Article

Evolution Characteristics during Initial Stage of Triggered Lightning Based on Directly Measured Current

1
State Key Laboratory of Severe Weather, Chinese Academy of Meteorological Sciences, Beijing 100081, China
2
Department of Atmospheric and Oceanic Sciences and Institute of Atmospheric Sciences, Fudan University, Shanghai 200433, China
*
Author to whom correspondence should be addressed.
Atmosphere 2020, 11(6), 658; https://doi.org/10.3390/atmos11060658
Submission received: 12 May 2020 / Revised: 10 June 2020 / Accepted: 16 June 2020 / Published: 19 June 2020
(This article belongs to the Section Meteorology)

Abstract

:
The initiation of a leader is an important lightning discharge process, but how an upward positive leader (UPL) initiates is still not fully understood. The evolution characteristics of a UPL during its initial stage was systematically studied based on directly measured current data of 14 triggered lightning events in 2019. It was found that the initial stage of triggered lightning can be divided into two types: a single initial process form and a multiple initial process form, with percentages of 64.29% and 35.71%, respectively. Compared with the former, the latter usually lasts longer, and the corresponding lightning is often triggered under a lower ground-level quasi-static electric field. In each initial process, precursor current pulses (PCPs), PCP clusters and initial precursor current pulse (IPCPs) are typical current waveforms, and the pulse durations and transferred charges of PCPs increase linearly with time. However, in the multiple initial process form, the pulse durations and transferred charges of PCPs will reduce significantly after each previous initial process and then continue to increase in the following initial process. In each initial process, when the pulse duration and transferred charge of a PCP increase to a certain extent, PCP clusters and IPCPs begin to appear. For the emergence of PCP clusters, the average values of the threshold are 3.48 μs and 19.53 μC, respectively. For the occurrence of IPCPs, the corresponding values are 4.69 μs and 27.23 μC, respectively. The average values of pulse durations and transferred charges of IPCPs are larger than those of PCP clusters. Compared with adjacent PCP clusters, IPCPs contain more pulses, with a critical range of 6–7. IPCPs also last longer, and have a critical range of 138–198 μs.

Graphical Abstract

1. Introduction

In recent years, how an upward positive leader (UPL) initiates has become an important problem in lightning physics research. However, due to the randomness of natural lightning, it is difficult to make close observations. Until now, the initial process of UPL has not been fully understood. However, the discharge process of triggered lightning is very similar to that of natural lightning, and the timing and location of triggered lightning can be planned, making it easy to observe at close range. Therefore, triggered lightning has become an important method by which to study the initiation of a leader.
In the field of high voltage technology, a long air gap discharge can be used to simulate lightning [1,2,3,4,5,6]. Some conversion threshold parameters during the evolution process of leader are given, such as local electric field, charge per unit length and critical length, but the scale of a long air gap discharge is much smaller than that of a natural discharge process, leading to great differences in parameters between the two. At the same time, because the scale of a long air gap discharge is too small and the discharge duration is too short, it is difficult to obtain a clear observation of the initial stage. Therefore, detailed research on UPL can only rely on triggered lightning.
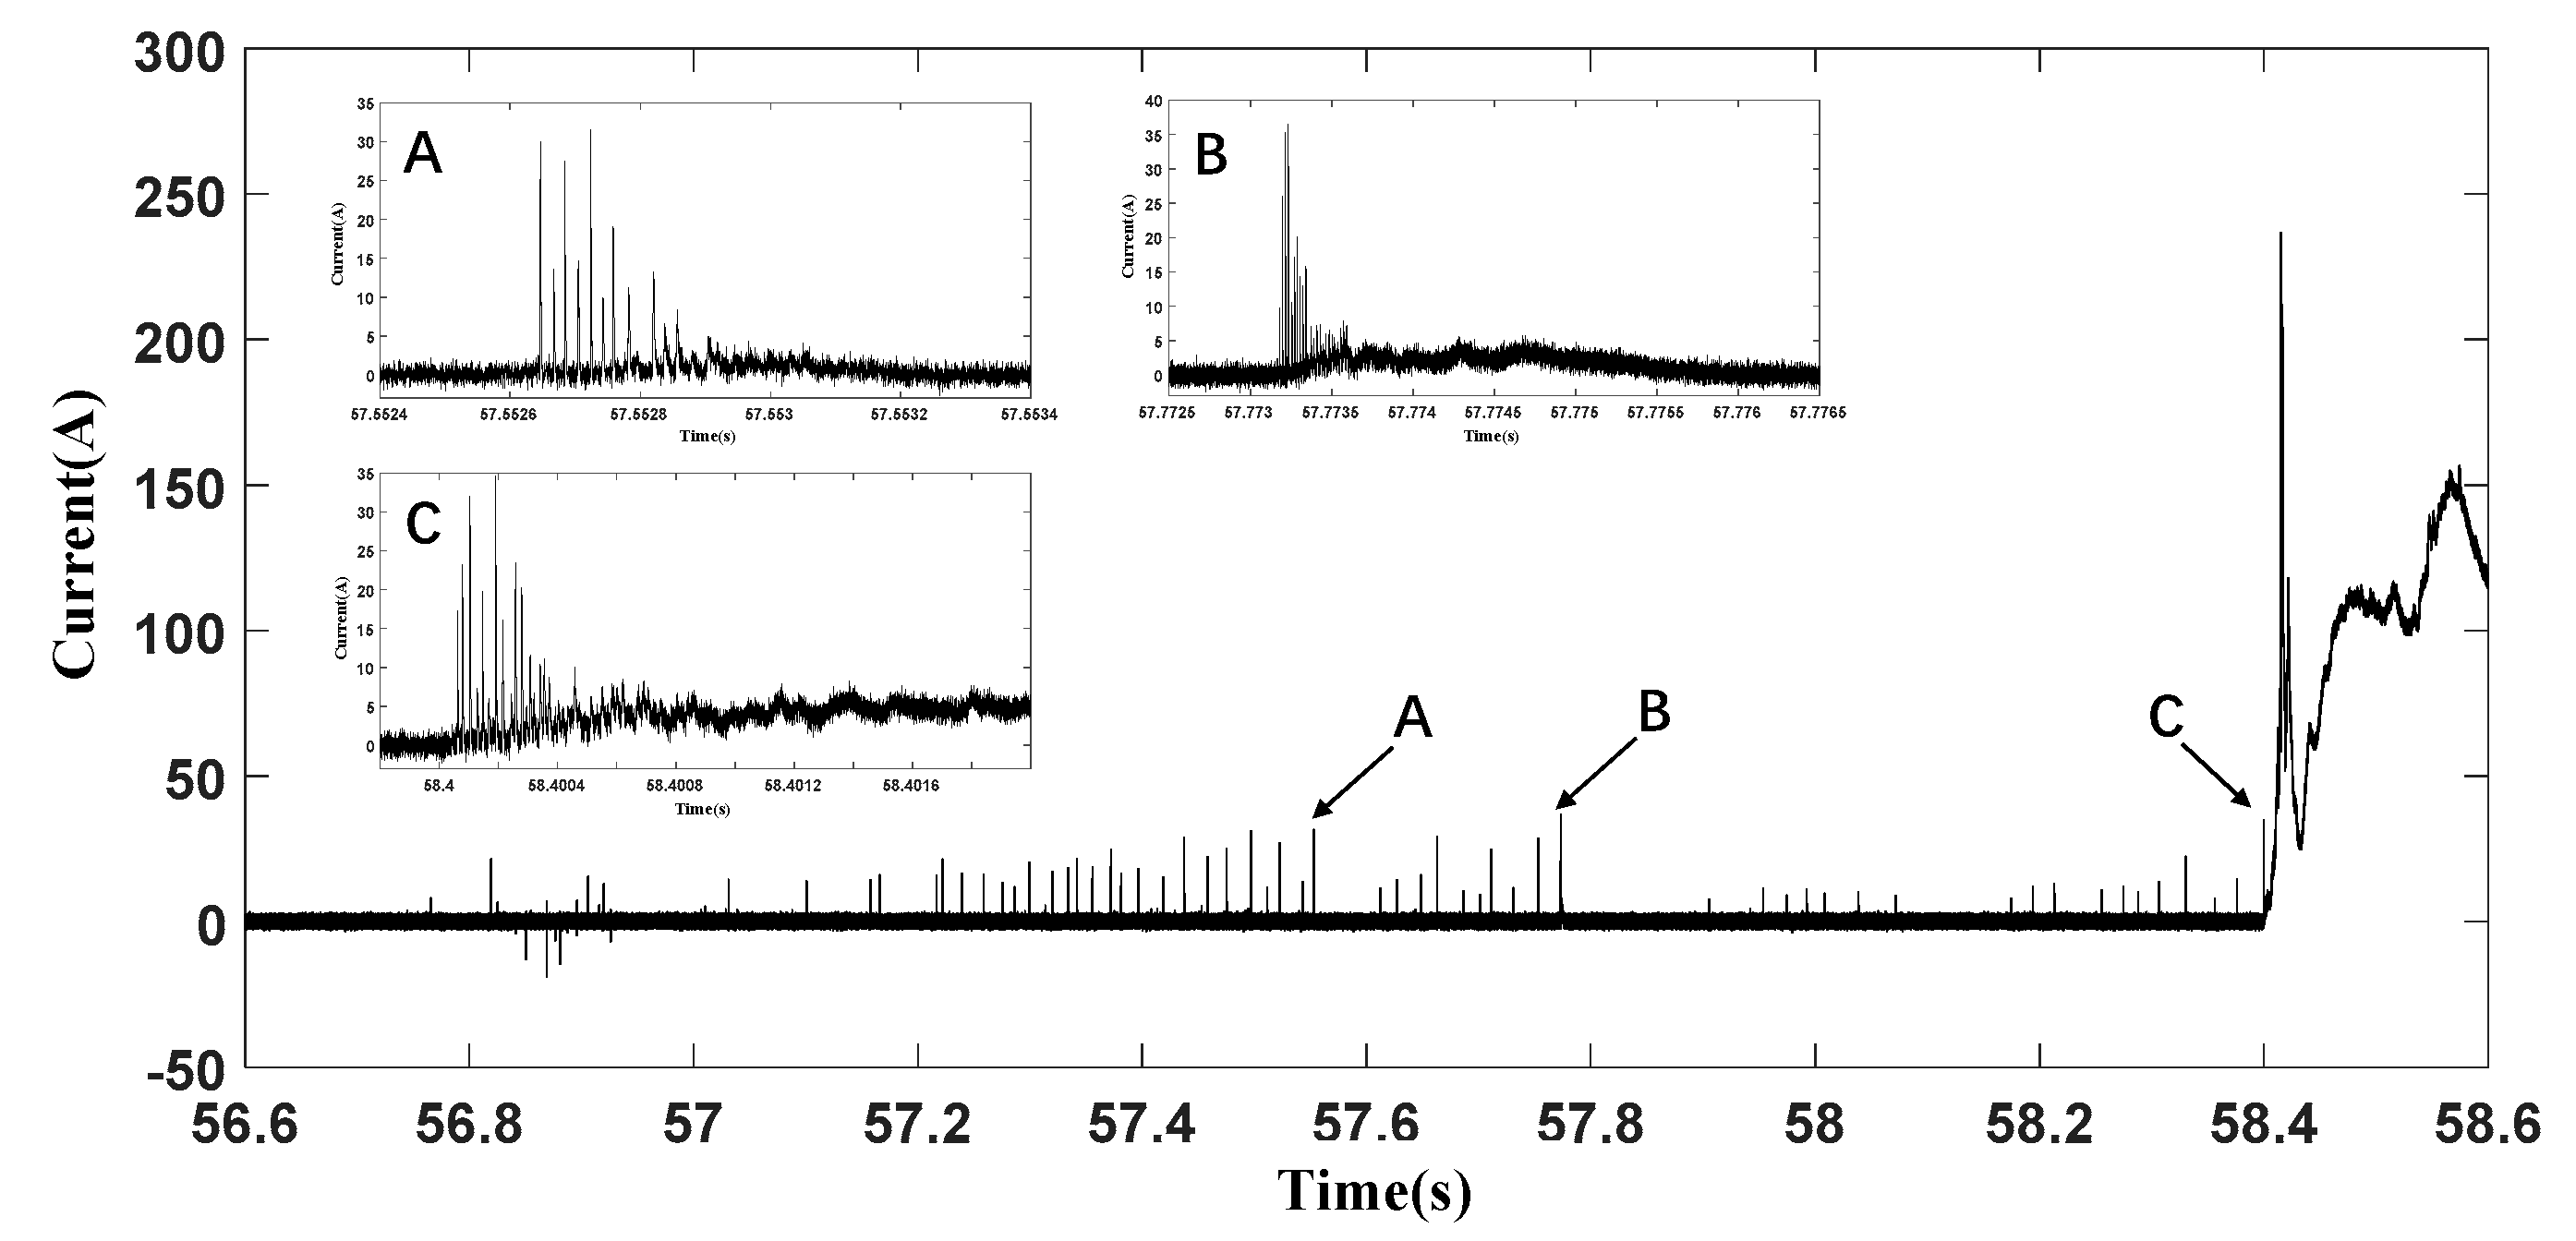
Classic triggered lightning is usually realized by a rocket carrying metal wires. When the negative ground-level quasi-static electric field is dominant, a negative triggered lightning will be generated, which starts from a UPL. UPL includes two stages: an initial stage and a self-sustaining development stage. The evolution of a UPL process is as follows. As the rocket rises, discontinuous corona discharges are generated at the rocket′s tip, forming some isolated current pulses at the bottom of the metal wire (called precursor current pulses (PCPs), each precursor current pulse called (PCP)). With the increase of rocket height, the discharges become frequent, with PCP appearing in groups (called PCP clusters). When the rocket rises to a certain height, a strong PCP cluster appears, indicating that the UPL has started self-sustaining development. After that, the current at the bottom of the metal wire no longer appears in the form of pulses, but instead changes to a continuous current form. The strong PCP cluster is referred to as the initial precursor current pulses (IPCPs), and the current in the self-sustaining development stage is called the initial continuous current (ICC). In this paper, each IPCPs and preceding PCPs constitute an initial process. It should be noted that although an IPCPs is a sign of the beginning of self-sustaining development, it is still considered part of the initial stage for analysis in this paper. At present, the research on UPLs of triggered lightning have mainly focused on the self-sustaining development stage. The characteristics of current and channel development have been obtained by observation of coaxial shunts, high speed video and radiation source positioning. For example, Jiang et al. [7] found that the luminous intensity at the tip of leader steps was stronger than in the channel behind it in the early portion of the self-sustaining development stage. The average 2-D speed of the leader was 1.0 × 10⁵ m/s, with partial speeds ranging from 2.0 × 10⁴ to 1.8 × 10⁵ m/s between 130 and 730 m above ground. Sun et al. [8] found that the UPL was mapped immediately from the tip of the metal wire during the early portion of self-sustaining development stage, developing at a speed of about 104 m/s without branches by using a very high frequency (VHF) radiation source positioning system. Biagi et al. [9] presented high-speed video images (recorded at 300 kfps) of a UPL developing stepwise from the top of a grounded triggering wire. The leader’s upward development speed increased with height, from 5.5 × 10⁴ m/s between heights of 123 and 134 m, to 2.1 × 10⁵ m/s at a height of 350 m.
It is relatively difficult to research the initial stage before self-sustaining development stage due to weak radiation and weak luminous intensity. Some limited studies have been based mainly on the data of directly measured currents. Horii [10] first introduced PCPs, and found that PCPs appeared in the form of a single or group of pulses with an amplitude within 100 A. Lalande et al. [11] observed the currents and electric fields of PCPs, and found that the time intervals between PCPs were roughly tens of milliseconds, and that the pulse intervals in PCP clusters were about 25 μs. Willet et al. [12] found that PCPs appeared about every 10 ms, and that the pulse intervals within clusters were about 30 μs. The related research also reported that PCPs were generated by the discharge near the tip of the rocket [9,11,12,13,14]. Zhang et al. [15] analyzed the current and radiation of PCPs, and found that individual PCPs were produced by weak upward positive breakdowns over a meters-scale distance, followed by more energetic and faster downward negative breakdowns over a distance several tens of meters in scale. Zhang et al. [16] found that the geometric mean values of current peaks, 10~90% rise times, durations, half peak widths, transferred charges and pulse intervals for PCPs were 28 A, 0.33 μs, 2.3 μs, 0.73 μs, 27 μC and 25 μs, respectively. Although the above studies have given some basic characteristics of PCPs, the development and evolution during the initial stage have rarely been reported. As a result, further research is needed. In this paper, we study the evolution characteristics of UPLs during the initial stage based on directly measured current data of triggered lightning in 2019.

2. Experiments and Data

Since 2006, the Chinese Academy of Meteorological Sciences lightning research group has carried out triggered lightning experiments in Conghua District, Guangzhou City. More information about this experiment can be found in [
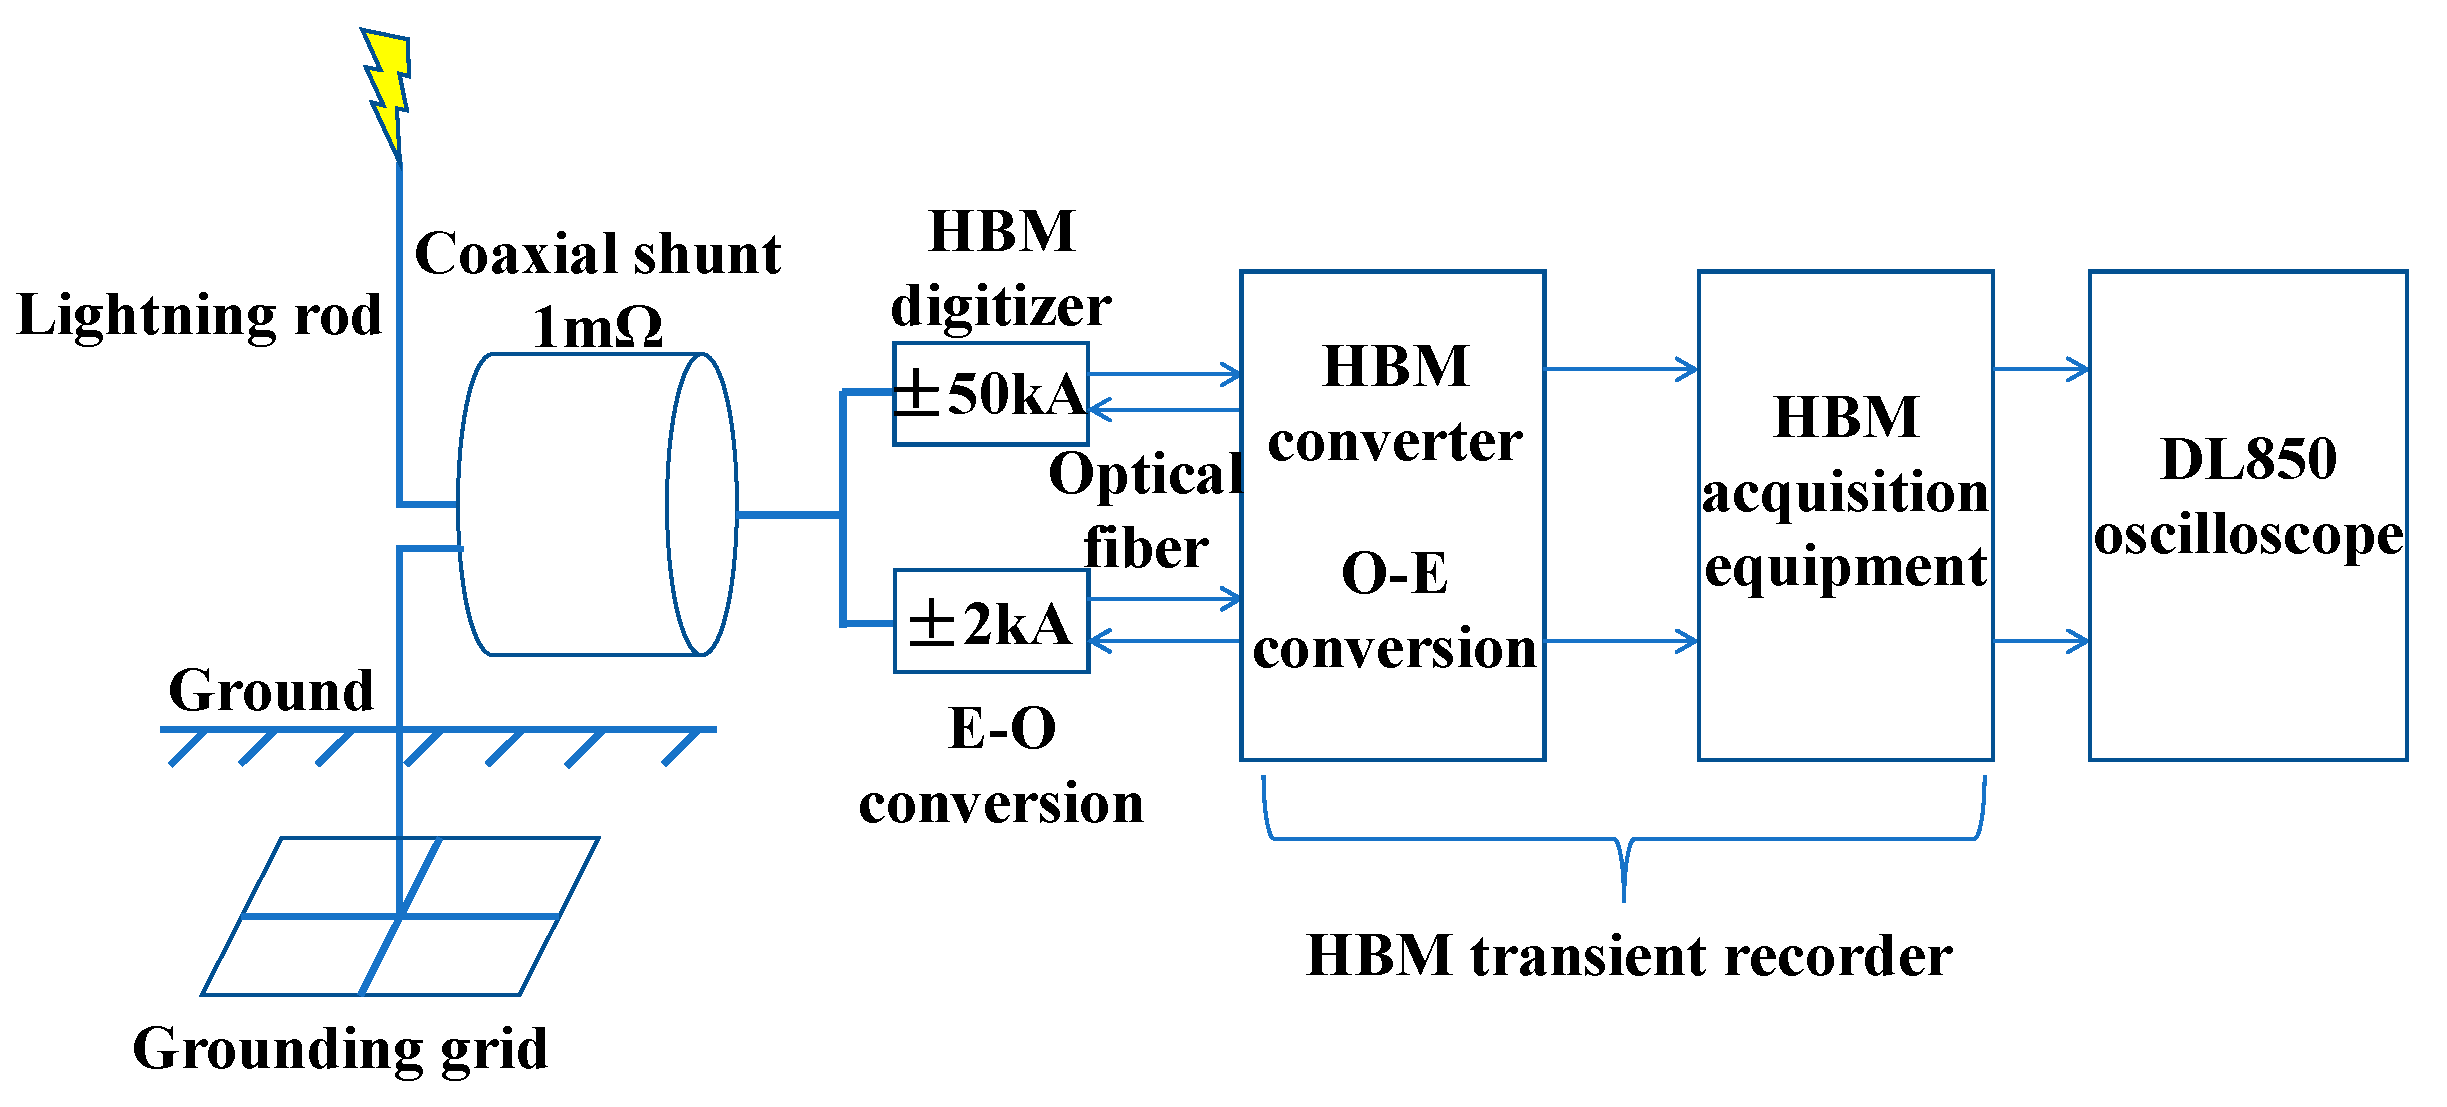
17]. This paper analyzes the directly measured current data of 14 triggered lightning events in 2019, which were measured using a 1 mΩ coaxial shunt. As shown in Figure 1, the lower part of the coaxial shunt was connected to ground and the upper part was connected to a lightning rod. The current waveform was digitized by an HBM digitizer and transmitted via optical fiber to an HBM transient recorder in the control room. Then, the converted signal by O-E (optical-electro) conversion was output to a DL850 oscilloscope for recording. In order to realize the complete recording of the large current signal and weak current signal at the same time, we set up two HBM digitizers with ranges of ±50 and ±2 kA, respectively. At that point, the minimum current resolution was about 5 A. In addition, the ground-level quasi-static electric field was detected by a CS110 electric meter that was installed 85 m away from the lightning rod. The positive electric field indicated negative charge overhead.
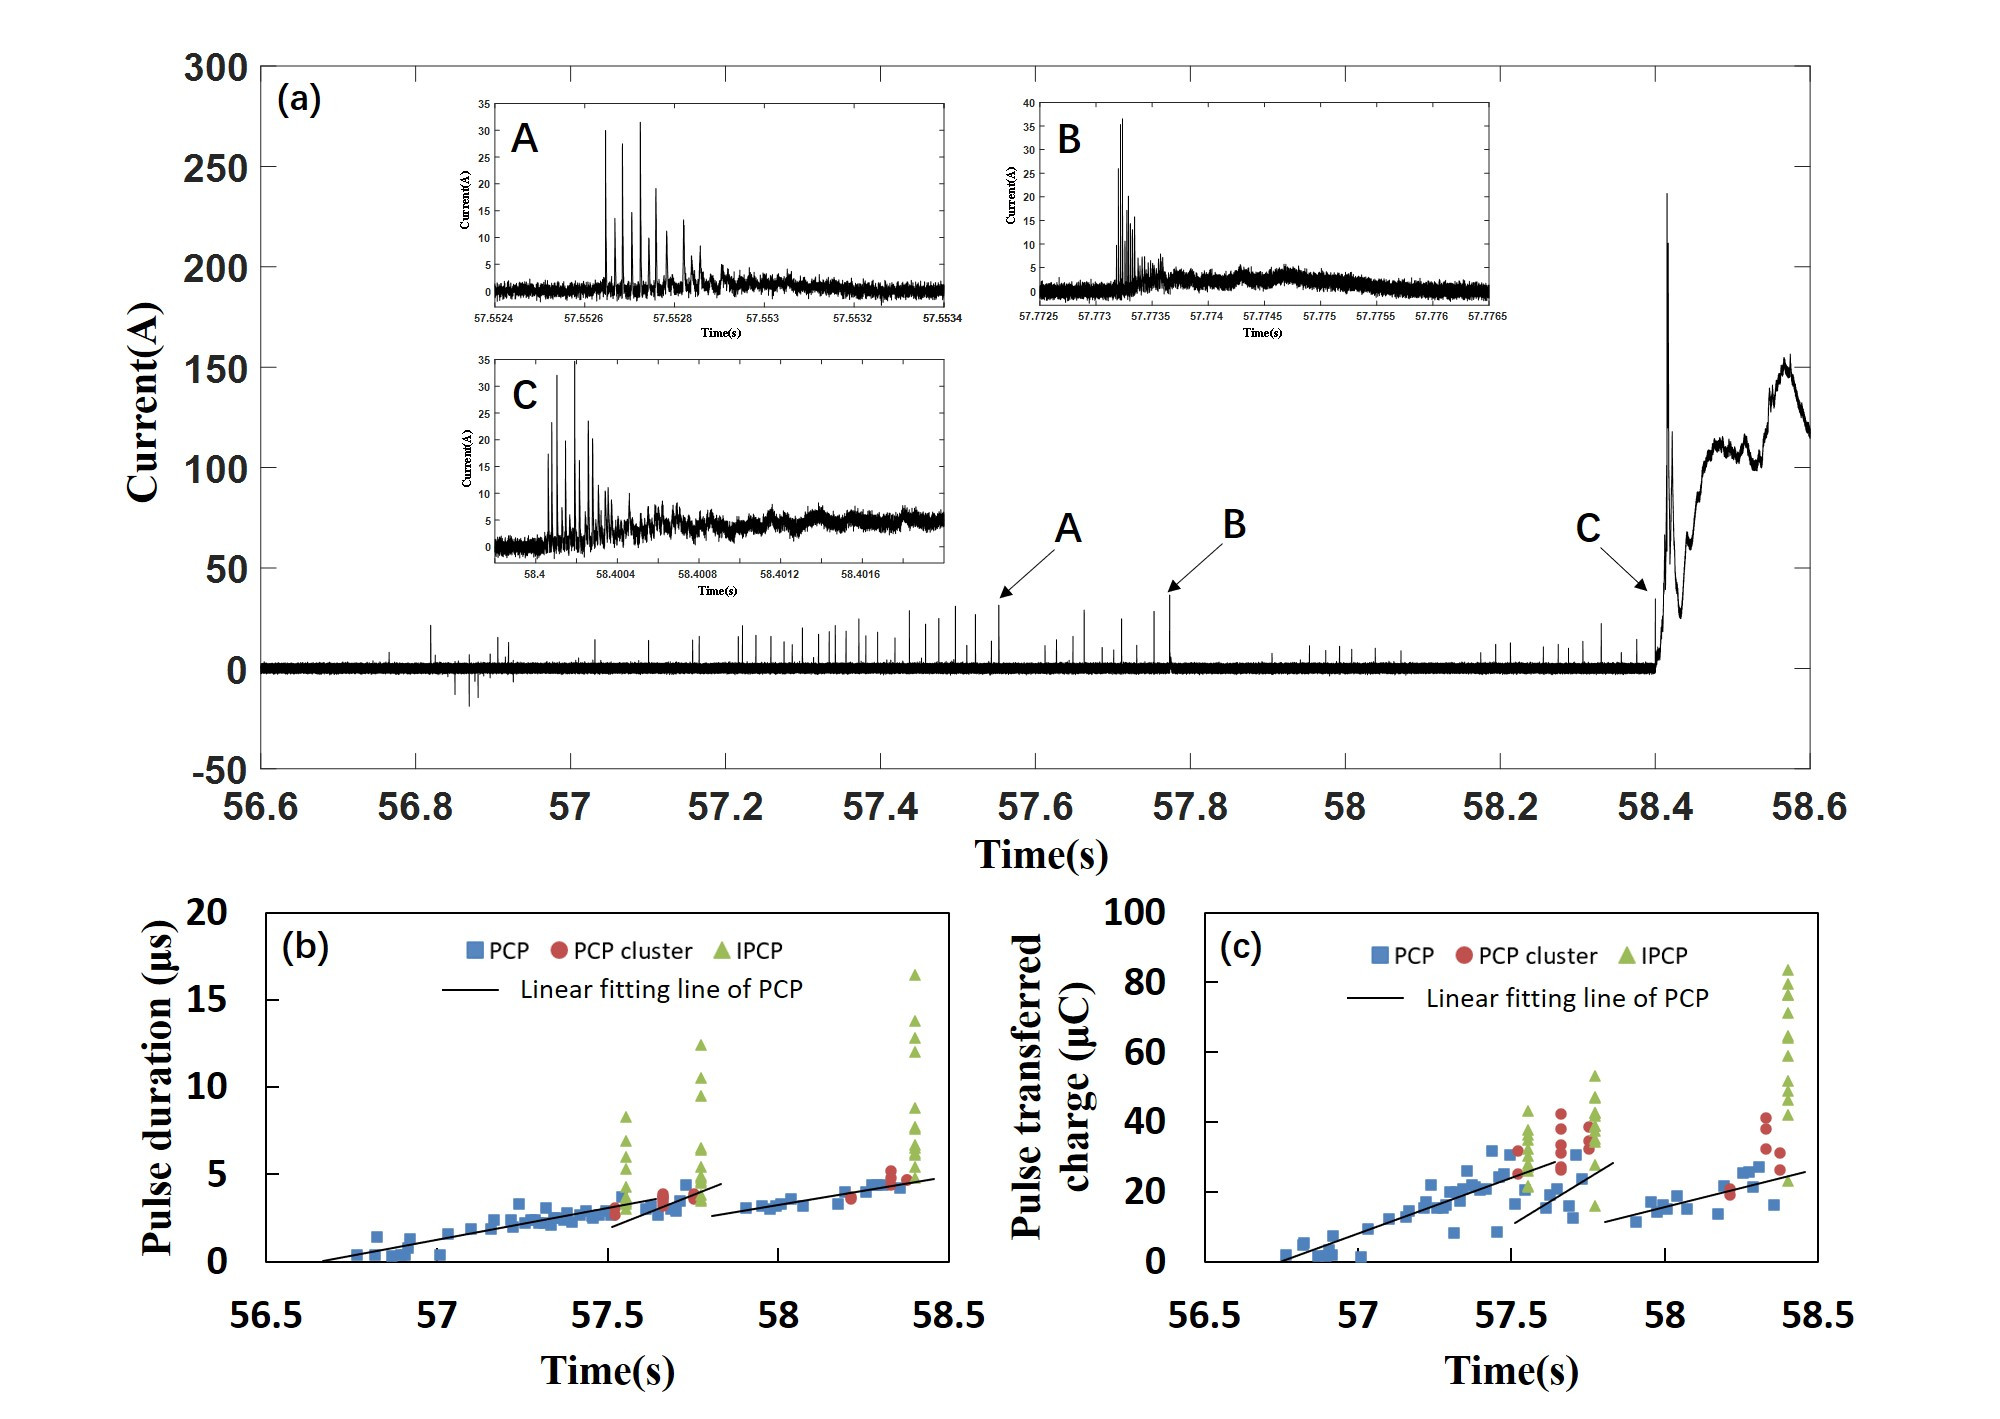
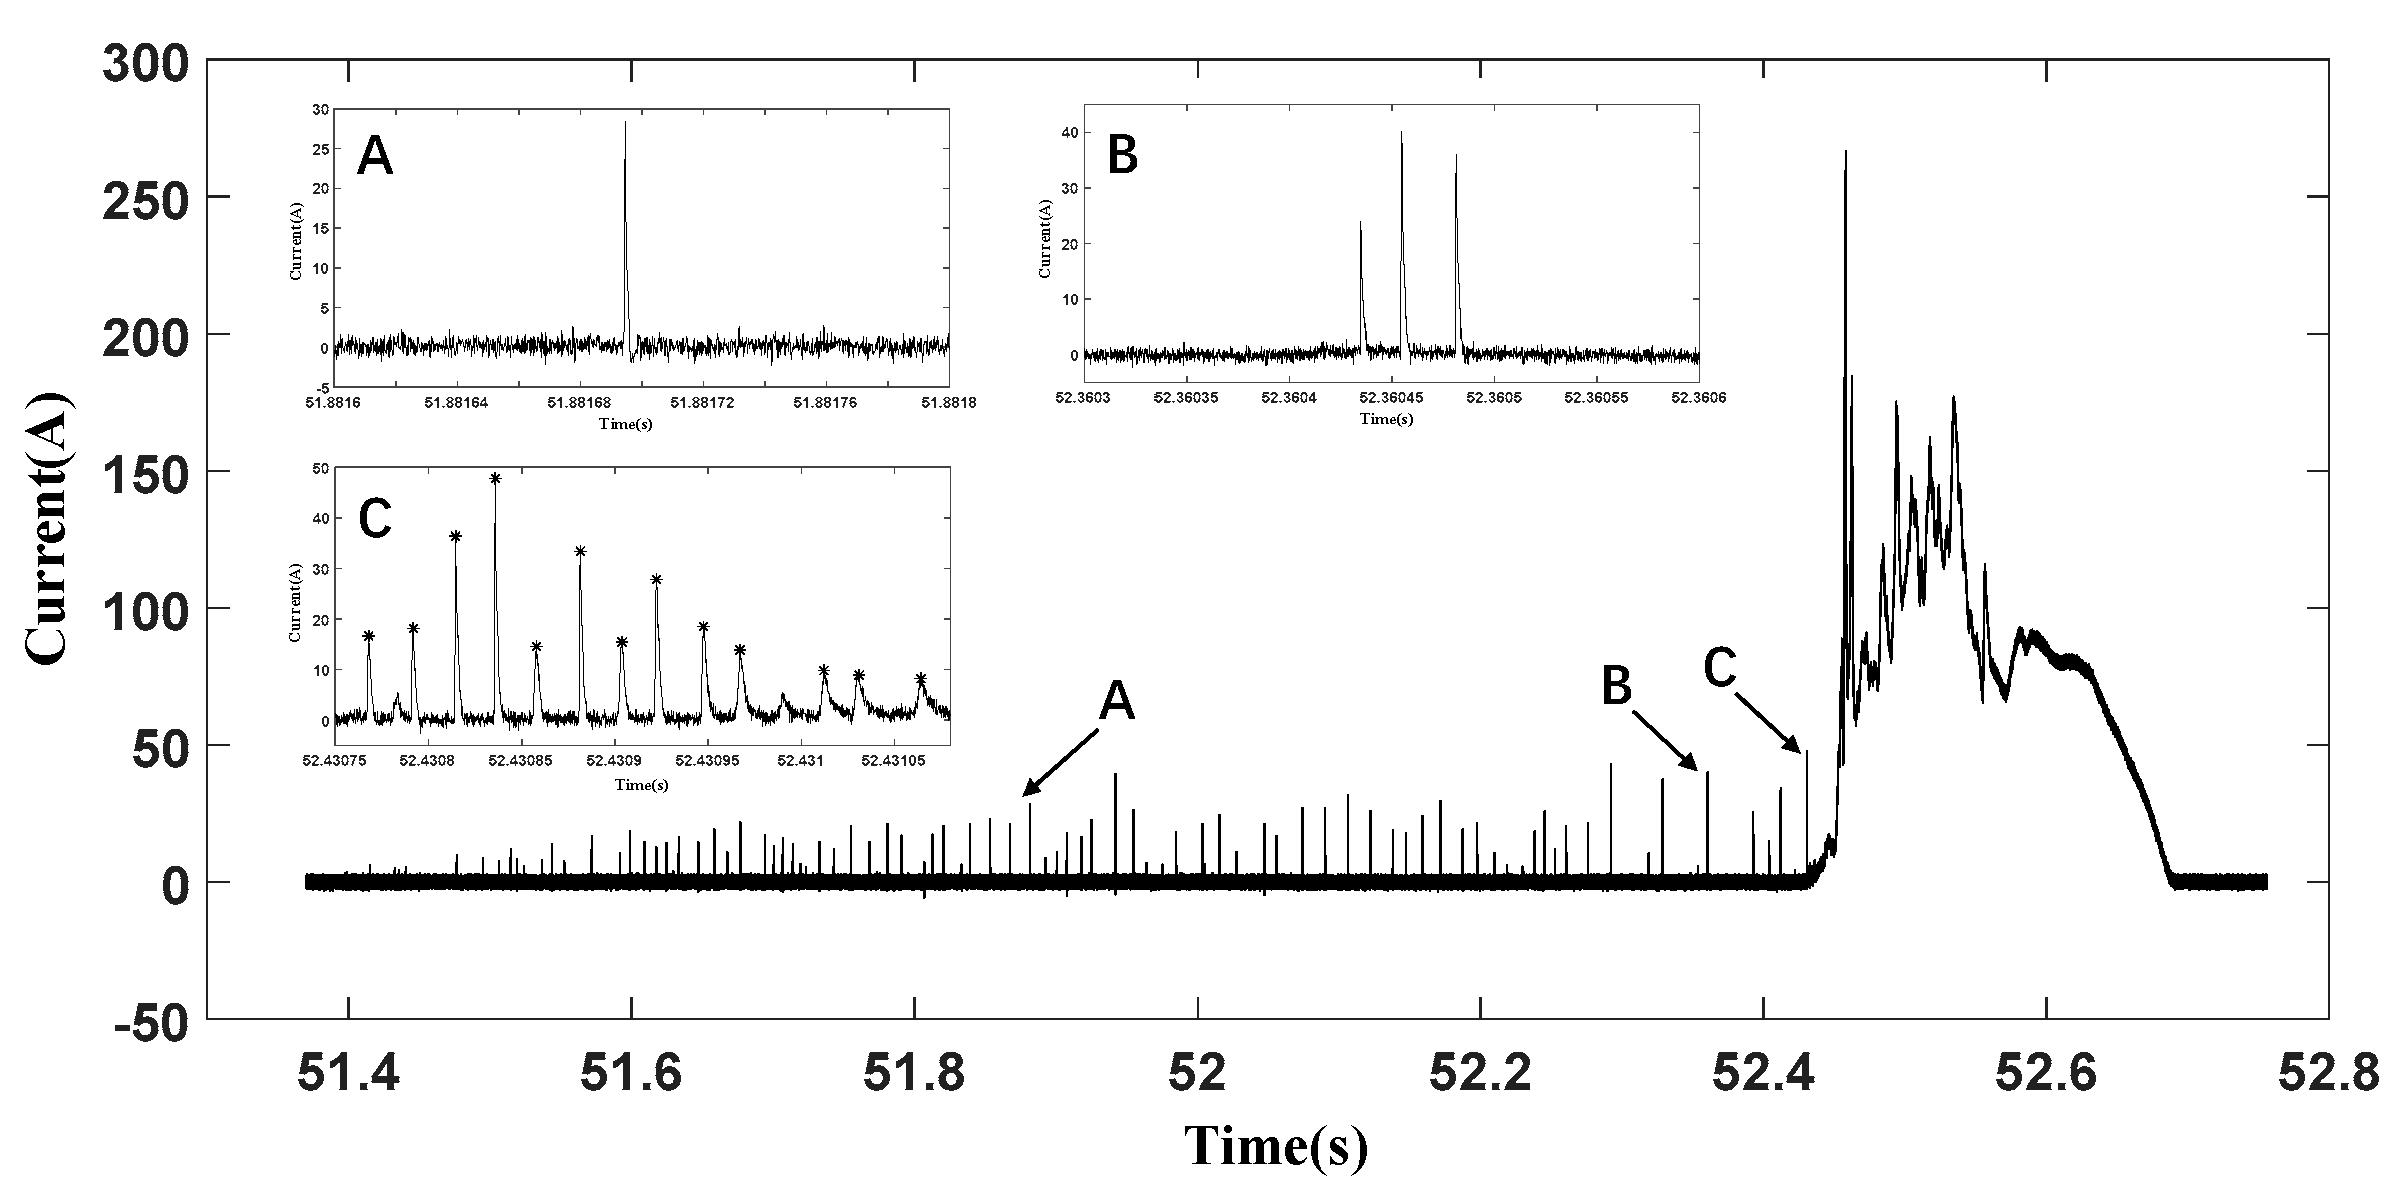
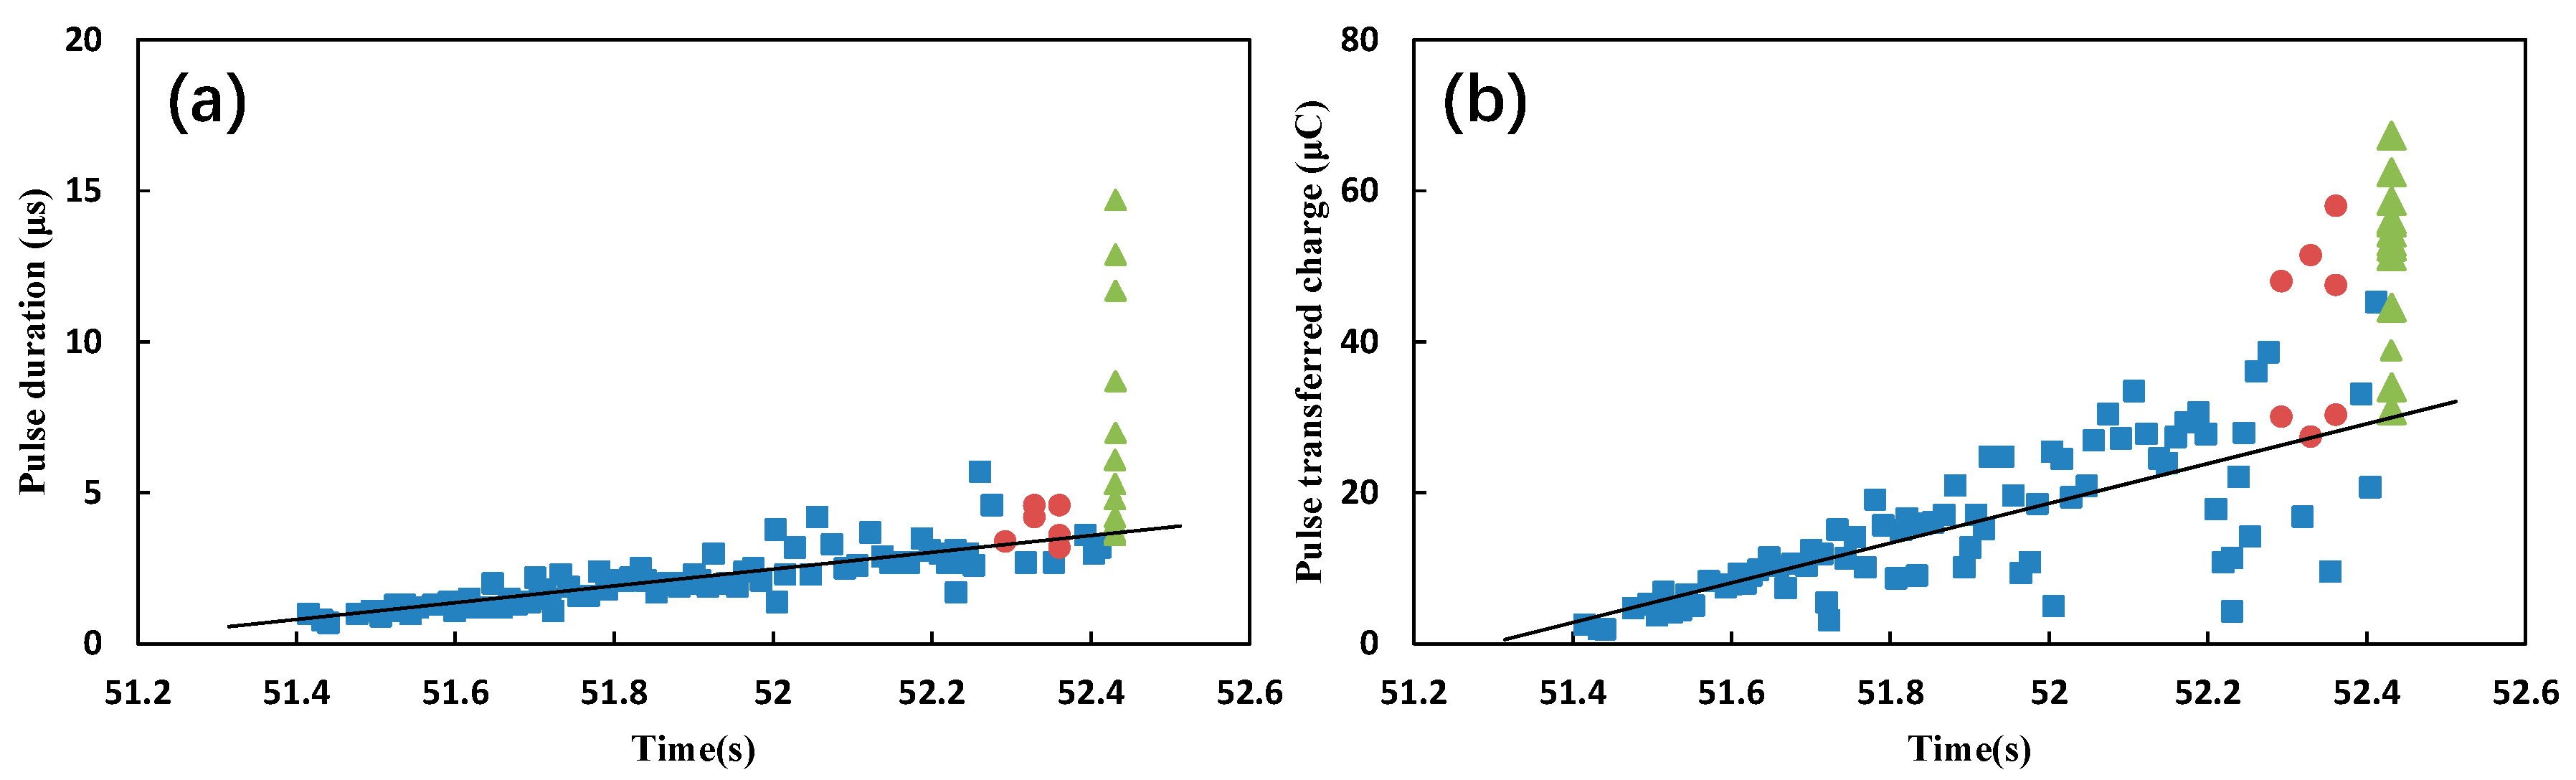
Some parameters are defined as follows. Pulse duration is the time interval when the amplitude of the front and back edges of a pulse reach the background noise level. Pulse transferred charge is the integration of pulse current and duration. The duration of the PCP cluster or IPCPs is the time interval from the first pulse to the last pulse. The duration of ICC process is defined as the time interval between the end of the preceding IPCPs and the end of the ICC. The duration of the current quiet period is the time interval from the end of the previous ICC to the first PCP in the following initial process. The duration of the initial process is defined as the time interval between the first PCP and the first pulse of the IPCPs during each initial process. The duration of the initial stage is the time interval from the first PCP of the first initial process to the first pulse in the IPCPs during the last initial process. For triggered lightning in a single initial process form, there is only one initial process, so the duration of the initial process is the same as the duration of the initial stage.

3. Results

3.1. Two Initial Forms of Triggered Lightning

From an analysis of 14 triggered lightning events, two initial forms of triggered lightning were found. One of them took the form of a single PCPs–IPCPs in the current signal during the initial stage; that is, there was only one IPCPs process. This article refers to this kind of triggered lightning as the single initial process form, and out of the 14 triggered lightning events there were nine such cases, accounting for 64.29%. The other variety of triggered lightning was in the form of multiple PCPs–IPCPs during the initial stage. This article refers to this kind of triggered lightning as the multiple initial process form. Out of 14 triggered lightning events there were five such cases, accounting for 35.71%. In the following section, these two different forms of the initial stage are presented using two triggered lightning events (370 and 570) as examples.

3.1.1. Single Initial Process Form

Taking the triggered lightning 370 as an example of the single initial process form, the basic process is the same as the description in Section 1. The rocket was launched when the ground-level quasi-static electric field was 3734 V/m. The current waveform and partially enlarged view are shown in Figure 2. It can be seen that the PCP (see marker A), PCP cluster (see marker B) and IPCPs (see marker C) appeared discontinuously. The IPCPs is the mark of one initial process, which indicates the beginning of the self-sustaining development of the UPL. Only one initial process with a duration of 1015.88 ms can be seen during the initial stage of this case. After that, the ICC process lasted 260.92 ms.
The duration and transferred charge of all the pulses for the PCPs, PCP cluster and IPCPs over time during the initial stage of this triggered lightning event are shown in Figure 3. It can be seen that the pulse duration and transferred charge of the PCPs increased roughly linearly with time. Considering that PCPs are generated by the discharge near the rocket tip [9,11,12,13,14], and the rocket speed is relatively stable, it can be speculated that the pulse duration and transferred charge of the PCPs are positively related to height. In terms of pulse duration, the first PCP cluster appeared when the pulse duration of the PCP reached 3.29 μs, and IPCPs appeared when the pulse duration of the PCP reached 3.68 μs, based on an analysis of the linear fitting results. The pulse duration of the PCP cluster was generally distributed near the linear fitting line of the pulse duration of the PCPs. The pulse duration at the beginning of the IPCPs was close to that of the PCPs, but then increased significantly. In terms of pulse transferred charge, based on an analysis of the linear fitting result, the first PCP cluster appeared when the pulse transferred charge of the PCP reached 26.25 μC, and the IPCPs appeared when the pulse transferred charge of the PCP reached 29.9 μC. The average values of the pulse transferred charge for the PCP cluster and IPCPs were larger than that of the PCPs. At the same time, we also analyzed the change of the pulse current peak, but found no obvious regularity.

3.1.2. Multiple Initial Process Form

Not every self-sustaining development is continuous and stable. Some self-sustaining developments are short-lived. After a short self-sustaining development ends, a new initial process may start with the rise of the rocket. Therefore, there may be multiple initial processes in an initial stage. Each initial process is similar to the description in Section 1. Taking the triggered lightning 570 as an example, the rocket was launched when the ground-level quasi-static electric field was 1630 V/m, which is significantly smaller than that of triggered lightning 370. The current waveform and partially enlarged view are shown in Figure 4. It can be seen that the initial stage included three initial processes, lasting 1634.35 ms, which is longer than that of triggered lightning 370. The first initial process lasted 786.94 ms and ends at position A in Figure 4. A represents the IPCPs at the beginning of the first self-sustaining development. The ICC process after the first IPCPs lasted 0.335 ms. Subsequently, there was a current quiet period of 59.08 ms after the ICC disappeared. The second initial process ends at position B in Figure 4, which represents the IPCPs at the beginning of the second self-sustaining development. The ICC process after this IPCPs lasted 2.757 ms. Subsequently, there was a current quiet period of 129.13 ms after the ICC disappeared. The third initial process continues to the position C in Figure 4, which represents the IPCPs at the beginning of the third self-sustaining development. Subsequently, the duration of ICC process was 378.364 ms. Since this paper mainly studies the initial stage of triggered lightning, only part of the current waveform of the third ICC process is shown in Figure 4.
The pulse duration and transferred charge over time during the initial stage of this triggered lightning are shown in Figure 5. It can be seen that, similar to triggered lightning 370, the pulse duration and transferred charge of the PCPs during each initial process increased roughly linearly over time. However, for the multiple initial processes, the linear increase was not continuous. Compared with the PCPs at the end position of the preceding initial process, the pulse duration and transferred charge of the PCPs at the beginning in the subsequent initial process were smaller. For example, the pulse duration and transferred charge of the last PCP in the first initial process were 3.7 μs and 20.51 μC, respectively, while the corresponding values of the first PCP in the second initial process were 3 μs and 15.39 μC, respectively. This may be due to the occurrence of the ICC process, resulting in charge neutralization and local electric field reduction.
In terms of pulse duration and based on an analysis of the linear fitting result, the first PCP cluster during the first initial process appeared when the pulse durations of PCPs reached 3.14 μs, and IPCPs appeared when the pulse duration of the PCP reached 3.25 μs. For the second initial process, the corresponding values when the first PCP cluster and IPCPs appeared were 3.16 and 4.01 μs, respectively. For the third initial process, the corresponding values were 3.93 and 4.54 μs, respectively. Similar to triggered lightning 370, the pulse duration of the PCP cluster was basically distributed near the linear fitting line of the pulse duration of the PCPs. The pulse duration at the beginning of the IPCPs was close to that of the PCPs, but then increased significantly. The average pulse durations of the three IPCPs in the initial stage were 4.66, 6.18 and 8.83 μs, respectively, showing an increasing trend.
In terms of pulse transferred charge and based on an analysis of linear fitting result, the first PCP cluster appeared during the first initial process when the pulse transferred charge of PCPs reached 24.53 μC, and IPCPs appeared when the pulse transferred charge of PCPs reached 25.49 μC. For the second initial process, the corresponding values when the first PCP cluster and IPCPs appeared were 19.09 and 25.06 μC, respectively. During the third initial process, the corresponding values were 20.41 and 24.6 μC, respectively. The average pulse transferred charge of IPCPs was greater than that of PCPs. The average pulse transferred charges of the three IPCPs were 30.83, 38.69 and 60.56 μC, respectively, showing an increasing trend. At the same time, we also analyzed the change of the pulse current peak, but found no obvious regularity.

3.2. Comparison of Characteristics of Two Forms of Triggered Lightning

3.2.1. Ground-Level Quasi-Static Electric Field When Launching Rocket

Figure 6 is a statistical diagram of the ground-level quasi-static electric field corresponding to two forms of triggered lightning when the rockets were launched. It can be seen that the electric field strength corresponding to the single initial process form was larger. After removing an apparently large value of 3734 V/m, the quasi-static electric field strength was between 1445 and 2460 V/m during the rocket’s launch, with an upper quartile of 2413 V/m, a median of 1987 V/m, a lower quartile of 1955 V/m and an average of 2211 V/m. In contrast, the quasi-static electric field strength for the multiple initial process form was between 1603 and 2084 V/m during the rocket’s launch, with an upper quartile of 1937 V/m, a median of 1660 V/m, a lower quartile of 1617 V/m and an average of 1753 V/m.

3.2.2. Duration of Initial Stage

Figure 7 is a statistical diagram of duration of the initial stage. The duration of the initial stage corresponding to the single initial process form was between 287.76 and 1314.44 ms, with an upper quartile of 973.95 ms, a median of 684.31 ms, a lower quartile is 513.22 ms and an average of 738.19 ms. Zhang et al. [15] reported the duration of the initial stage of a triggered lightning event in Guangzhou as 883 ms, which is consistent with our results. Obviously, there was only one initial process in that lightning.
The duration of the initial stage corresponding to the multiple initial process form was between 1634.35 and 3163.13 ms, with an upper quartile of 3088.49 ms, a median of 2629.74 ms, a lower quartile of 1679.5 ms and an average of 2433.14 ms. The duration of the first initial process in the multiple initial process form was between 786.94 and 2570.72 ms, with an upper quartile of 2216.78 ms, a median of 1766.23 ms, a lower quartile of 1045.1 ms and an average of 1658 ms. It can be seen that the duration of the initial stage of triggered lightning in the form of multiple initial processes was significantly longer than that of the triggered lightning in the form of a single initial process, and that the critical value range between them was 1314.44–1634.35 ms. The duration of the first initial process was also longer than the duration of the initial stage corresponding to a single initial process. This can be attributed to the difference in ground-level quasi-static electric field during rocket launching. For the multiple initial process form, the rocket was launched under a relatively low electric field, which resulted in the initial stage requiring longer development and reaching a higher altitude to achieve the electric field strength for self-sustaining development.

3.3. Statistical Characteristics of Initial Process

3.3.1. PCP Characteristics When PCP Cluster and IPCPs Appear

From above analysis it can be seen that whether triggered lightning is in a single initial process form or multiple initial process form, the characteristics of each initial process are similar. We next obtained the PCP characteristics corresponding to occurrences of PCP clusters and IPCPs from 21 initial processes of 14 triggered lightning events. As shown in Figure 8a,c, it can be seen that the pulse durations and transferred charges of PCPs from each case were smaller when PCP clusters appeared than when IPCPs occurred. The statistical data of 21 cases in Figure 8b,d show a similar result. When PCP clusters appeared, the pulse duration of a PCP was between 1.56 and 5.81 μs, with an upper quartile of 4.63 μs, a median of 3.21 μs, a lower quartile of 2.43 μs and an average value of 3.48 μs. The pulse transferred charges of a PCP was between 9.8 and 29.82 μC, with an upper quartile of 23.06 μC, a median of 19.58 μC, a lower quartile of 17.62 μC and an average value of 19.53 μC. When an IPCPs occurred, the pulse duration of a PCP was between 2.32 and 8.43 μs, with an upper quartile of 5.59 μs, a median of 4.54 μs, a lower quartile of 3.45 μs and an average value of 4.69 μs. The pulse transferred charge of a PCP was between 19.68 and 40.63 μC, with an upper quartile of 30.93 μC, a median of 25.49 μC, a lower quartile of 22.96 μC and an average value of 27.23 μC. The above results provide a reference for the development scale and transferred charge in the self-sustaining development model of leader.

3.3.2. Comparison of Characteristics of IPCPs and PCP Cluster

Before each IPCPs occurs, PCP clusters appear. To obtain a further understanding of the similarities and differences between PCP clusters and IPCPs, the PCP clusters closest to IPCPs were selected for comparison in order to minimize the impact of occurrence location. The overall characteristics of IPCPs and their closest PCP clusters were obtained from all 21 initial processes. It was found that the duration and pulse number of each IPCPs and PCP cluster were significantly different. The duration of IPCPs was from 198.1 to 394.9 μs, with a mean of 300.3 μs and a median of 308.3 μs. In contrast, the duration of PCP clusters was from 18 to 137.8 μs, with a mean of 45.43 μs and a median of 37.4 μs. The numbers of pulses of IPCPs were in the range of 7–17, with a similar average and median of ~11. In contrast, the numbers of pulses in PCP clusters were in the range of 2–6, with a similar average and median of ~2. Compared with PCP clusters, IPCPs contain more pulses, with a critical value range of 6–7, and the duration of IPCPs is also longer, with a critical value range of 138–198 μs. In order to obtain more accurate features, the average pulse peak, average pulse duration and average pulse transferred charge of IPCPs and their closest PCP clusters were analyzed.
Figure 9 shows the average pulse peaks for IPCPs and their closest PCP clusters. There were no consistent differences among the average pulse peaks of the 21 cases (see Figure 9a). The overall statistical results in Figure 9b show that the average pulse peaks of the PCP clusters were very close to that of the IPCPs, with a similar median and average.
Figure 10 shows the average pulse durations of IPCPs and their closest PCP clusters. The average pulse durations of the IPCPs were greater than those of their closest PCP clusters during each initial process (see Figure 10a). The overall statistics in Figure 10b also show a similar result. The average pulse durations of IPCPs were in the range of 4.66–11.93 μs, with an average and median of 8.11 μs for both. In contrast, the average pulse durations of PCP clusters were in the range of 2.9–7.07 μs, with an average of 4.78 μs and a median of 4.47 μs. In this paper, the pulses with smaller amplitudes are also included in IPCPs, resulting in slightly larger durations than other reports. For example, Jiang et al. [7] showed that the average pulse duration of an IPCPs was 3.2 μs in Shandong. Zhang et al. [16] found that the average pulse duration of an IPCPs was 3.5 μs in Guangzhou.
Figure 11 is a statistical diagram of the average pulse transferred charges of IPCPs and their closest PCP clusters. The average pulse transferred charge of an IPCPs was greater than that of its closest PCP cluster during each initial process (see Figure 11a). The overall statistics in Figure 11b also show a similar result. The average pulse transferred charges of IPCPs were in the range of 30.83–72.62 μC, with average values of 51.81 μC and a median of 50.83 μC. In contrast, the average pulse transferred charges of PCP cluster ranged from 21.89 to 47.99 μC, with average values of 34.31 μC and a median of 35.2 μC. These results are basically consistent with the other reports. For example, the average pulse transferred charges of an IPCPs were 54.8 and 46 μC in Shandong [7] and Guangzhou [16], respectively.

4. Conclusions and Discussion

Using the directly measured current data of 14 triggered lightning events in 2019, this paper systematically studies the evolution process of discharges during the initial stage of the UPL, in particular the process before self-sustaining development. A detailed conclusion follows.
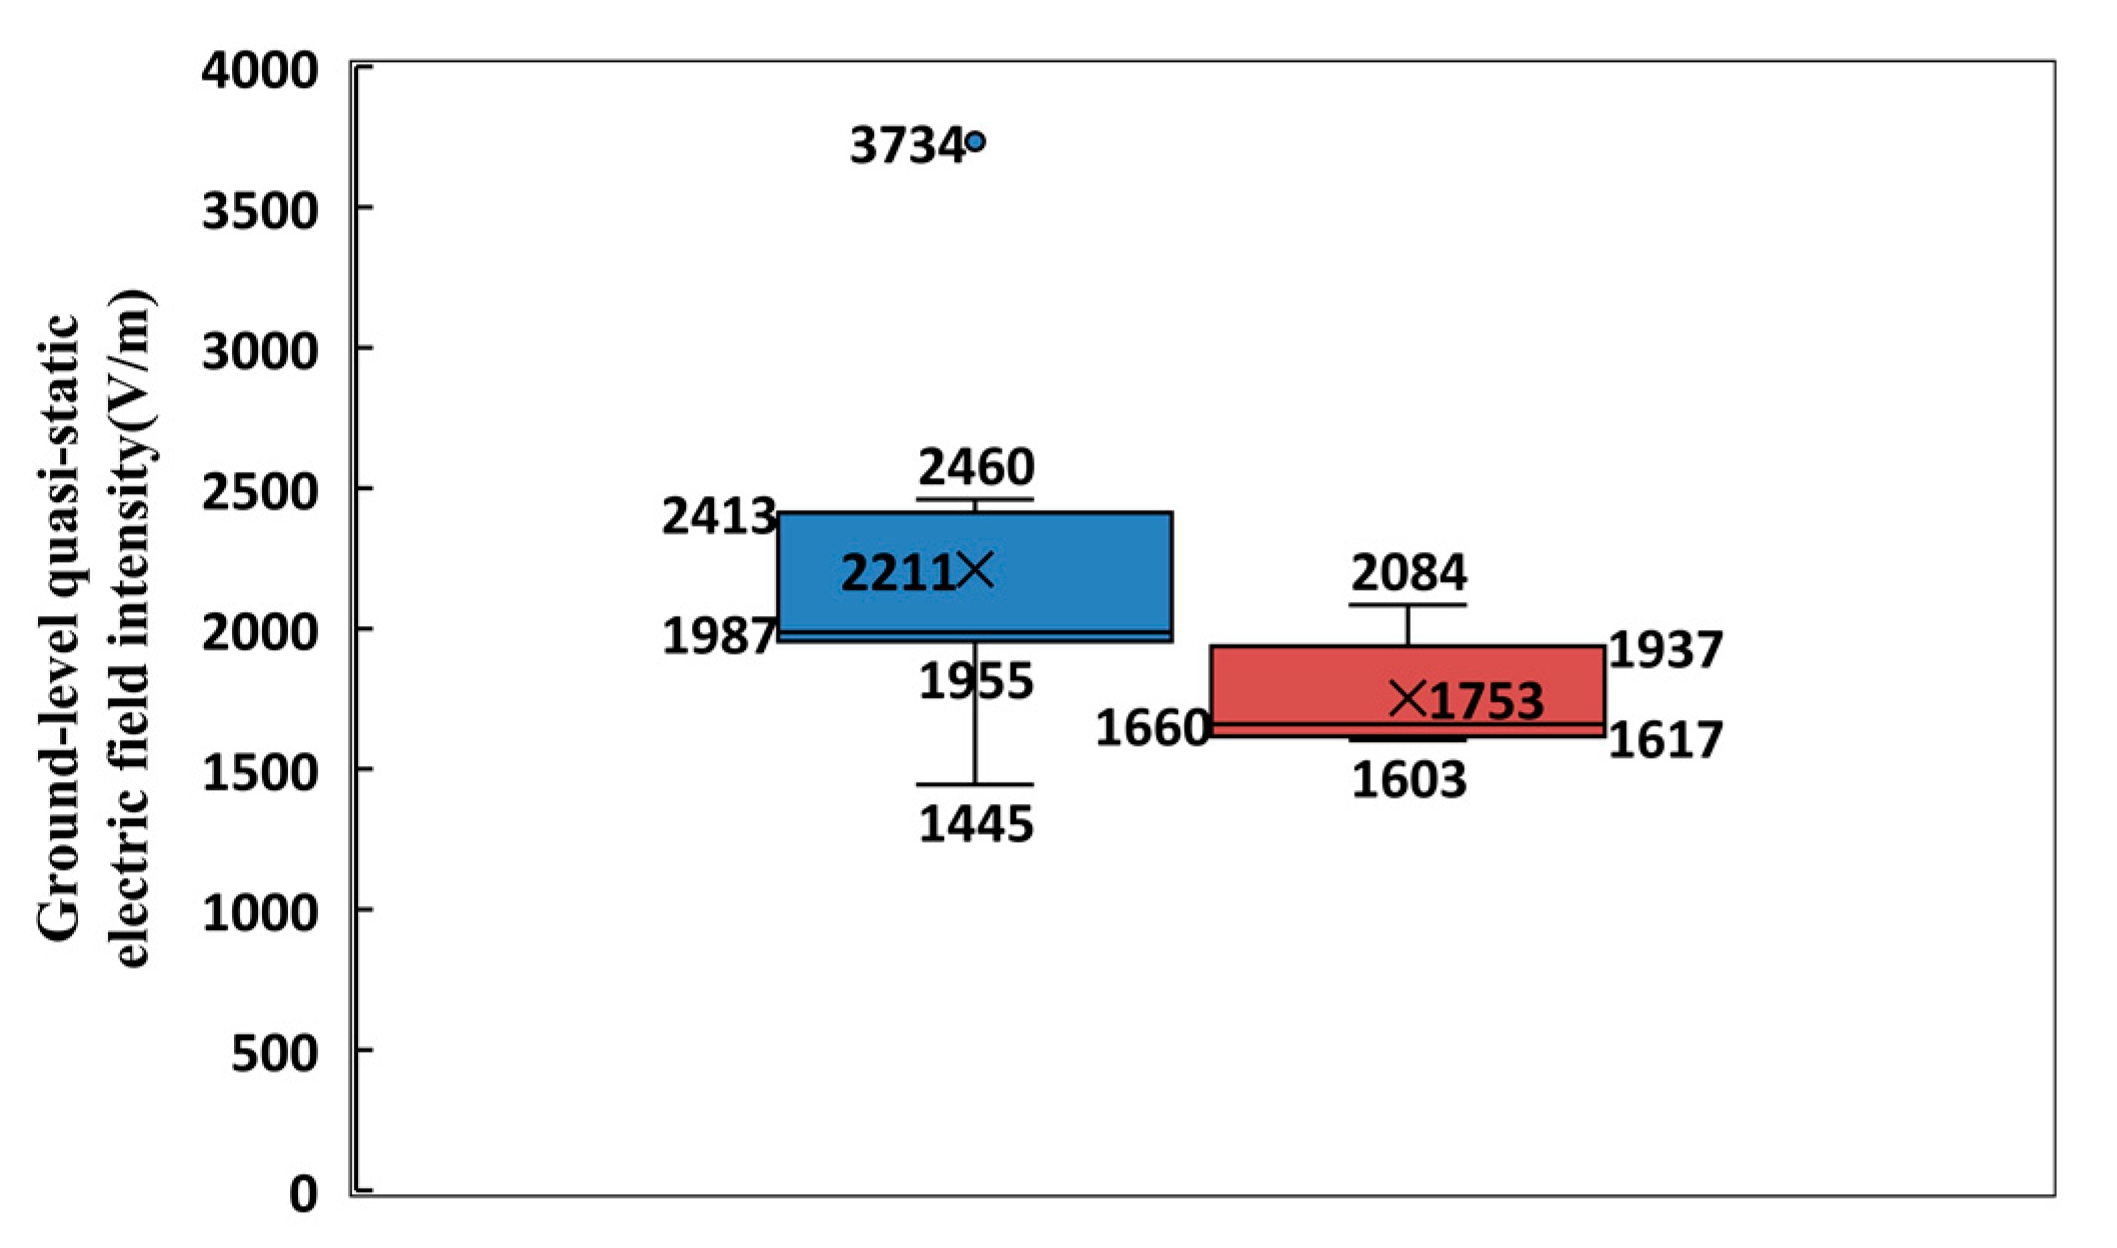
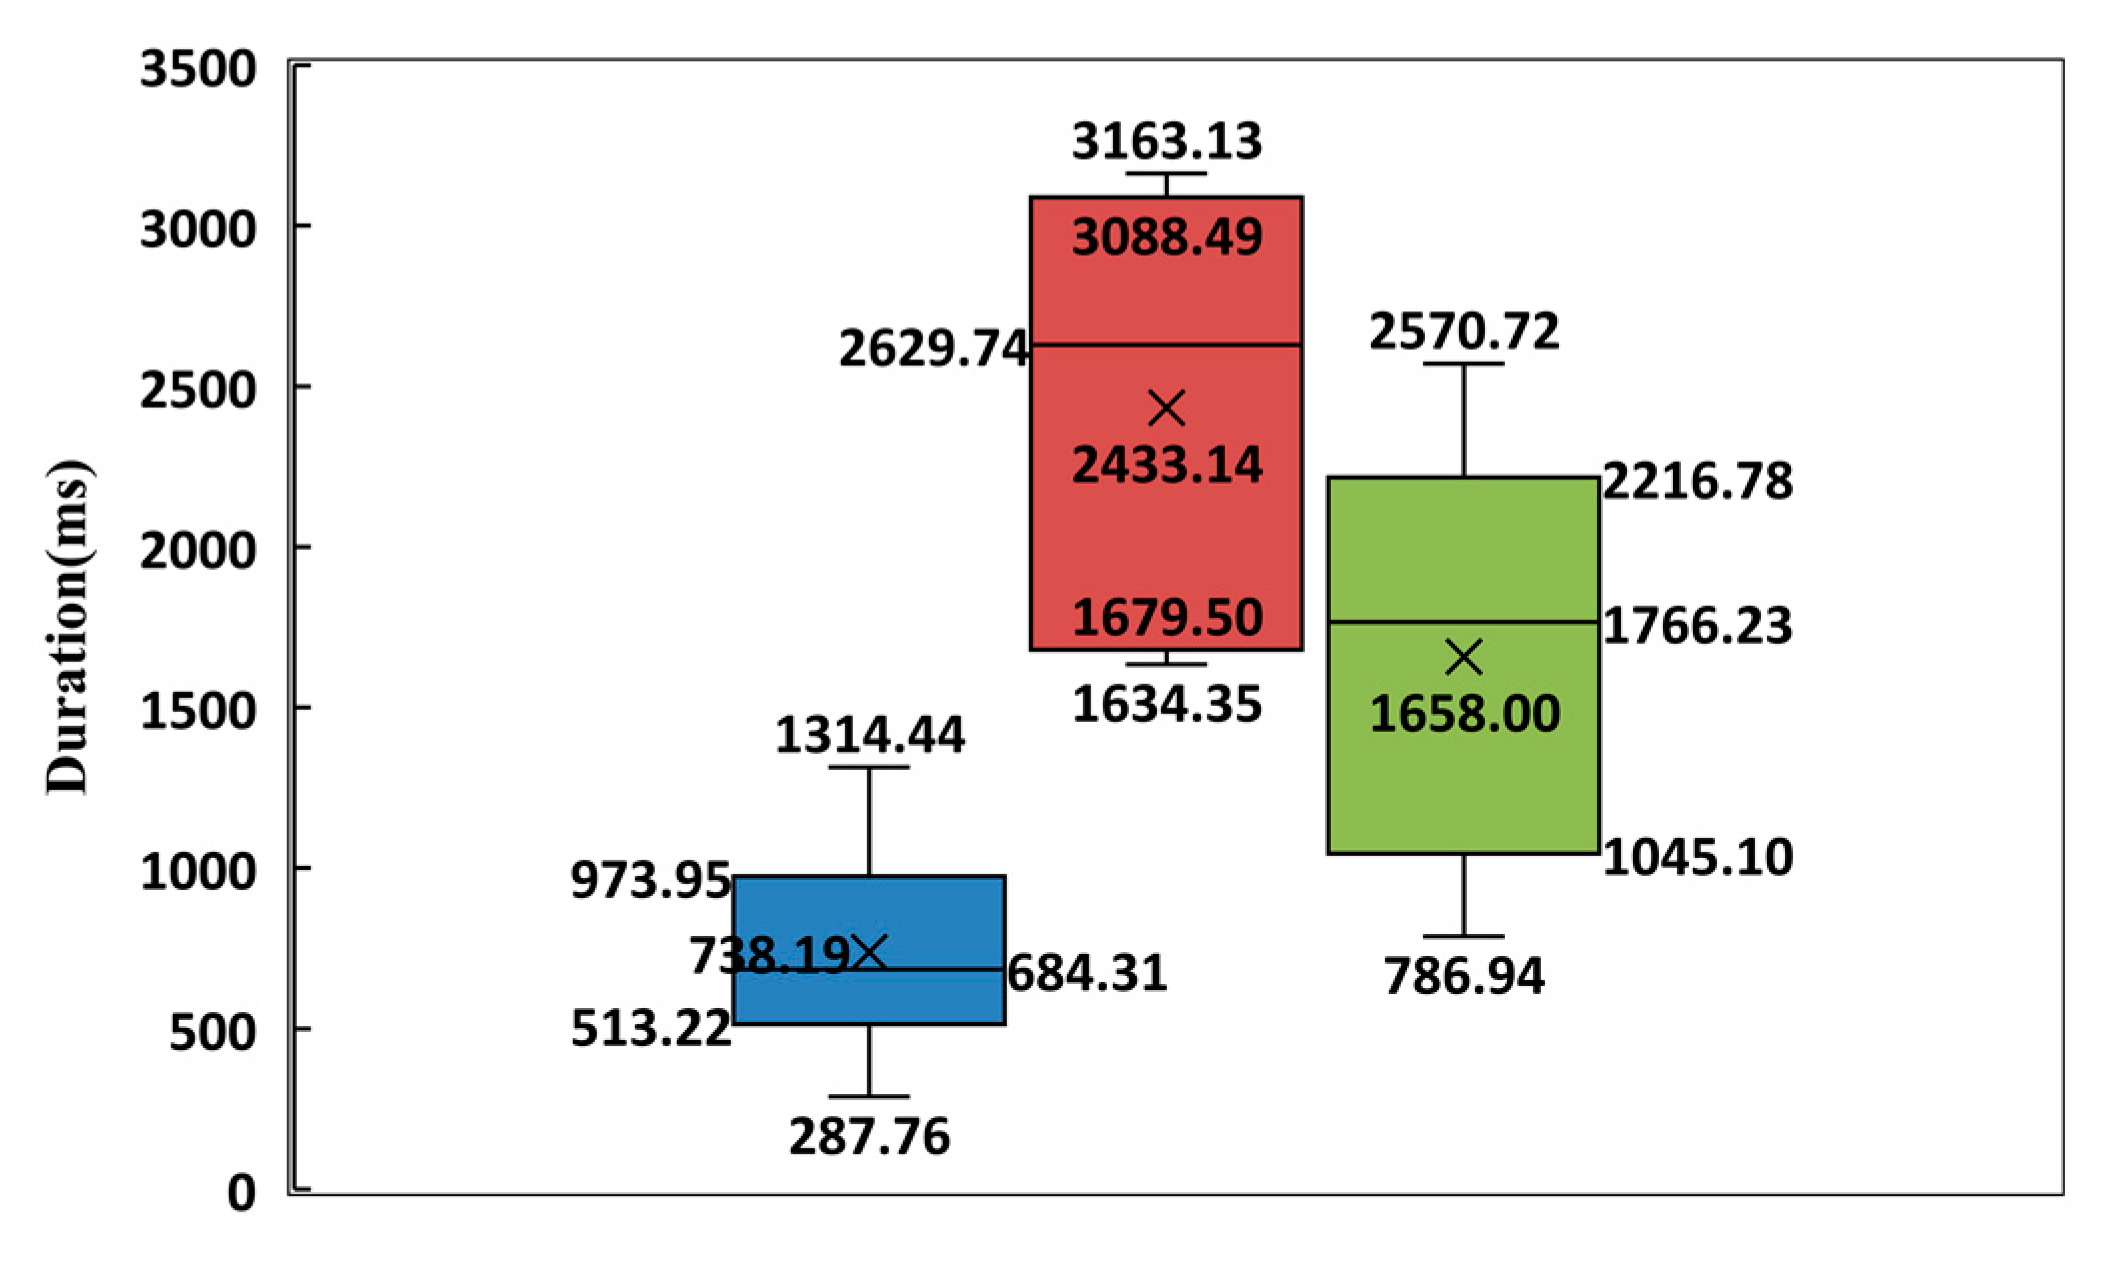
(1) The initial stage of triggered lightning can be divided into two types: a single initial process form and a multiple initial process form, with percentages of 64.29% and 35.71%, respectively. Compared with the former, the latter usually lasts longer, and the corresponding lightning is often triggered under a lower ground-level quasi-static electric field. The critical value of the initial stage duration between the two types is in the range of 1314.44–1634.35 ms. In addition, the duration of the first initial process in a multiple initial process form is generally longer than the duration of the initial stage of the triggered lightning in a single initial process form.
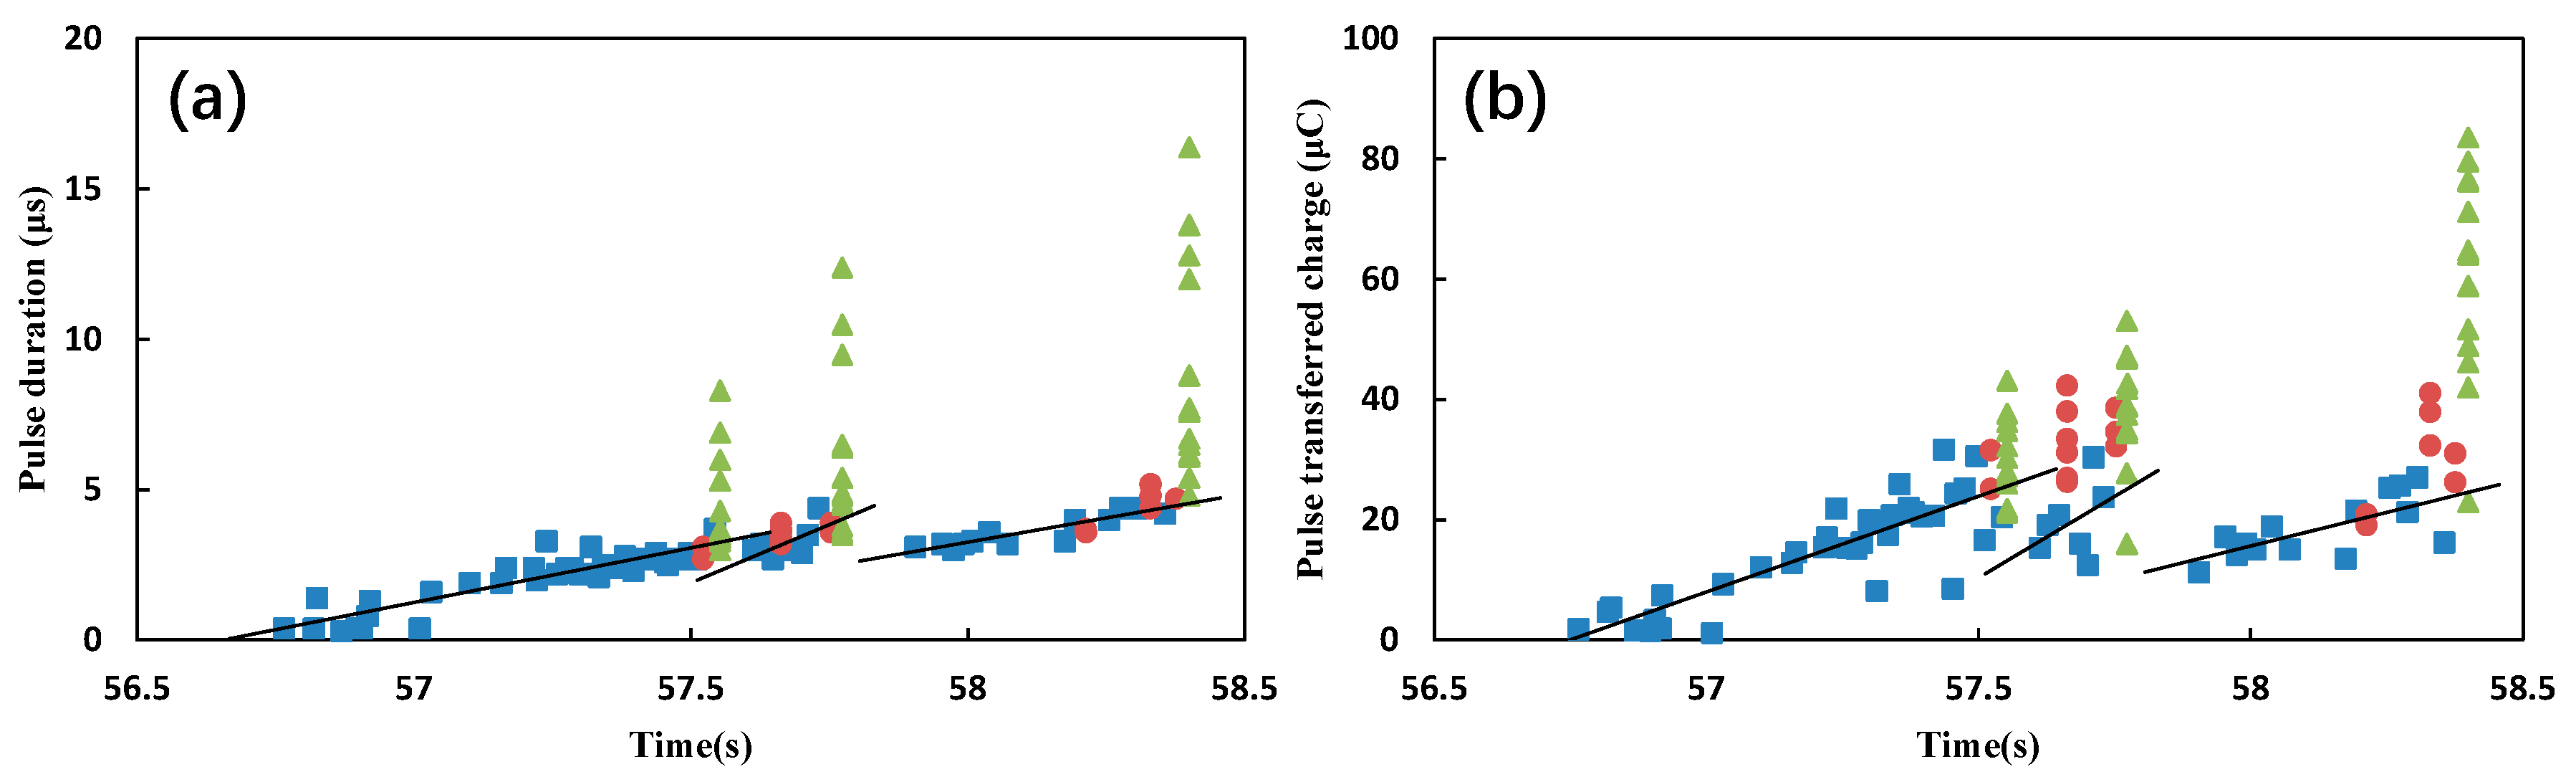
(2) Regardless of whether the triggered lightning is in the form of a single initial process or multiple initial processes, the pulse durations and transferred charges of PCPs generally increase linearly with time during each initial process. However, the linear increases are not continuous during multiple initial processes. The pulse durations and transferred charges of PCPs at the beginning of the next initial process are less than those of the end of the previous initial process. This may be due to the occurrence of an ICC process during failed initial process, resulting in a reduction in the local electric field that is not conducive to the formation of the next new initial process.
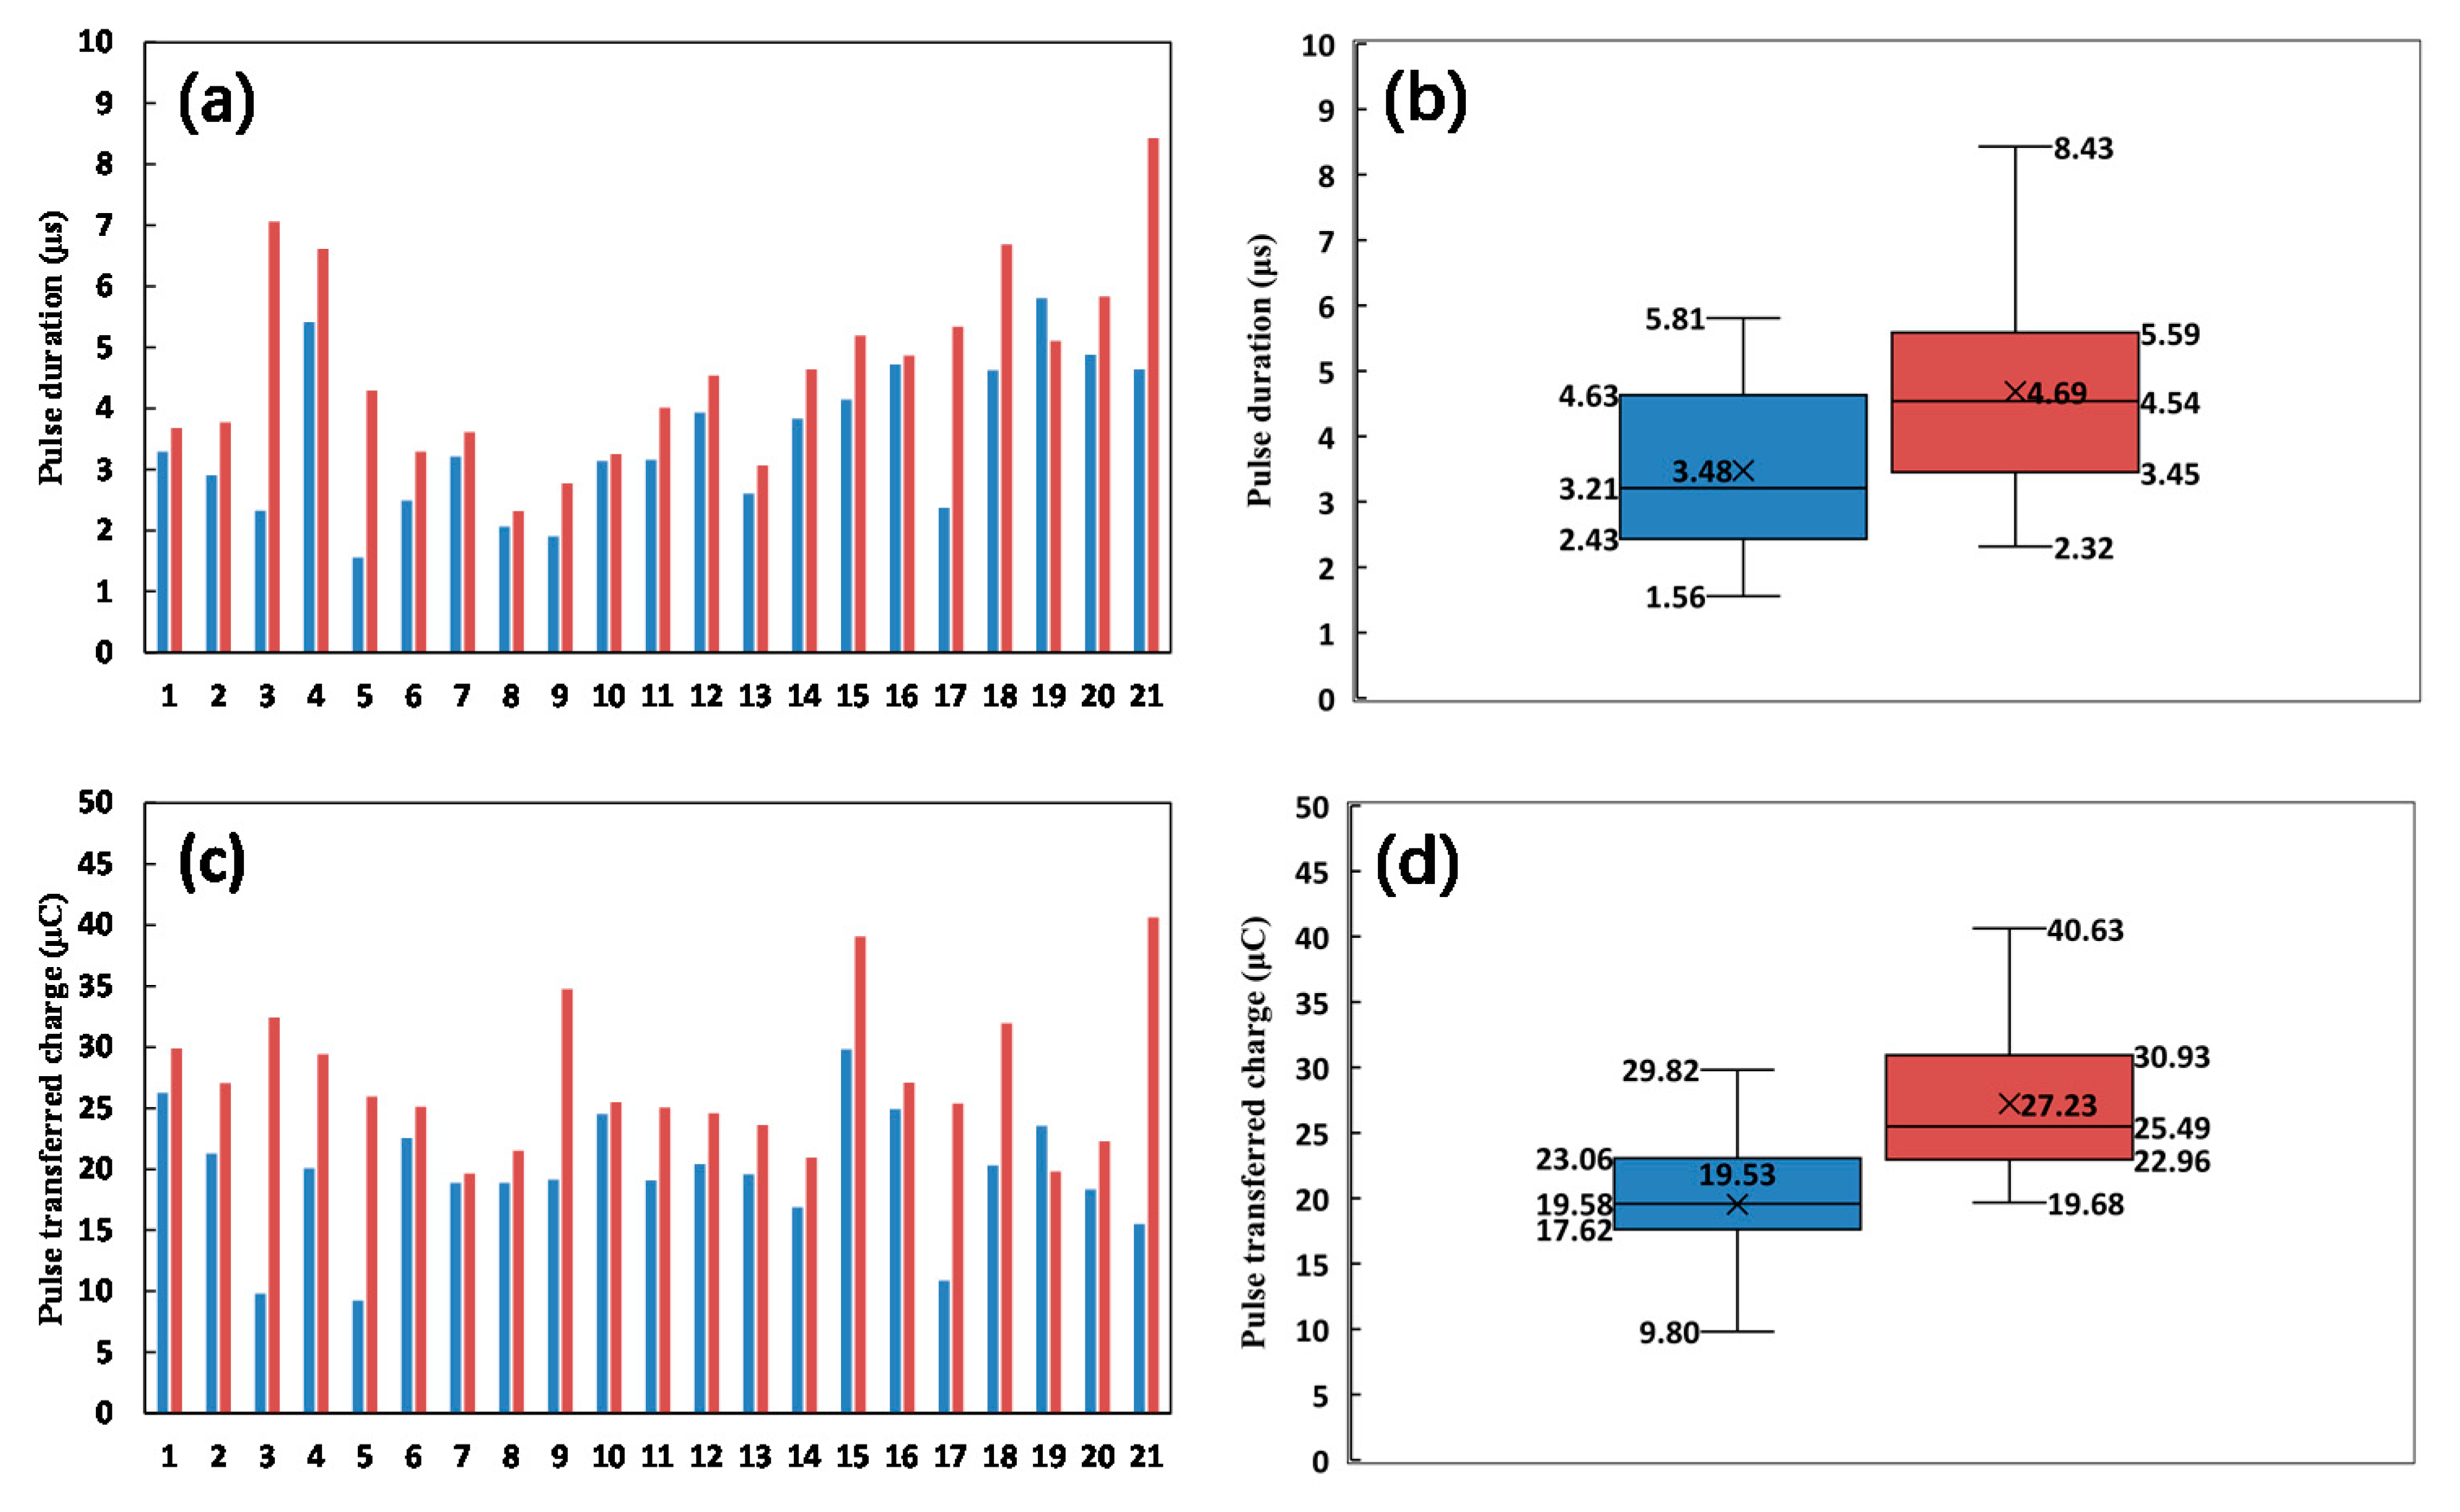
(3) In each initial process, when the pulse duration and transferred charge of a PCP gradually increase to a certain extent, PCP clusters and IPCPs will appear. According to the research results, when a PCP cluster appears, the average value of the pulse durations and transferred charges of PCPs are 3.48 μs and 19.53 μC, respectively. When IPCPs appears, the corresponding average values are 4.69 μs and 27.23 μC, respectively.
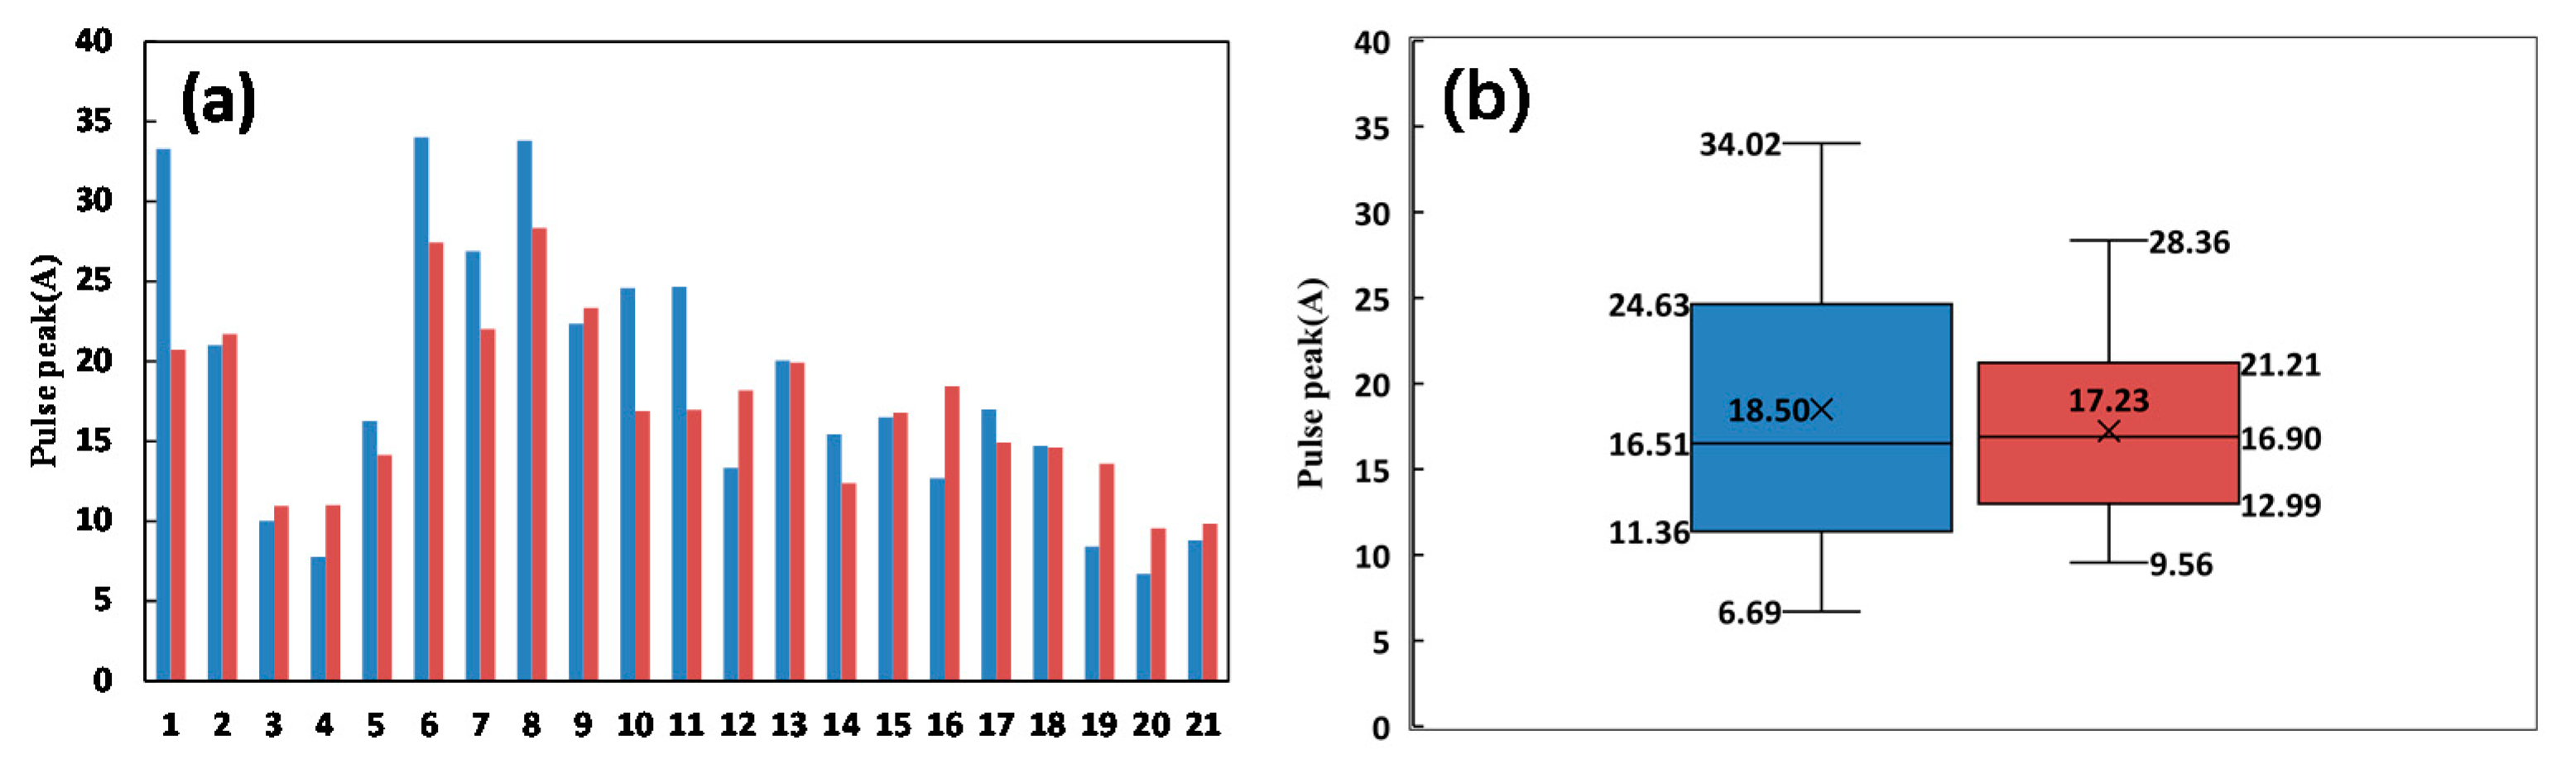
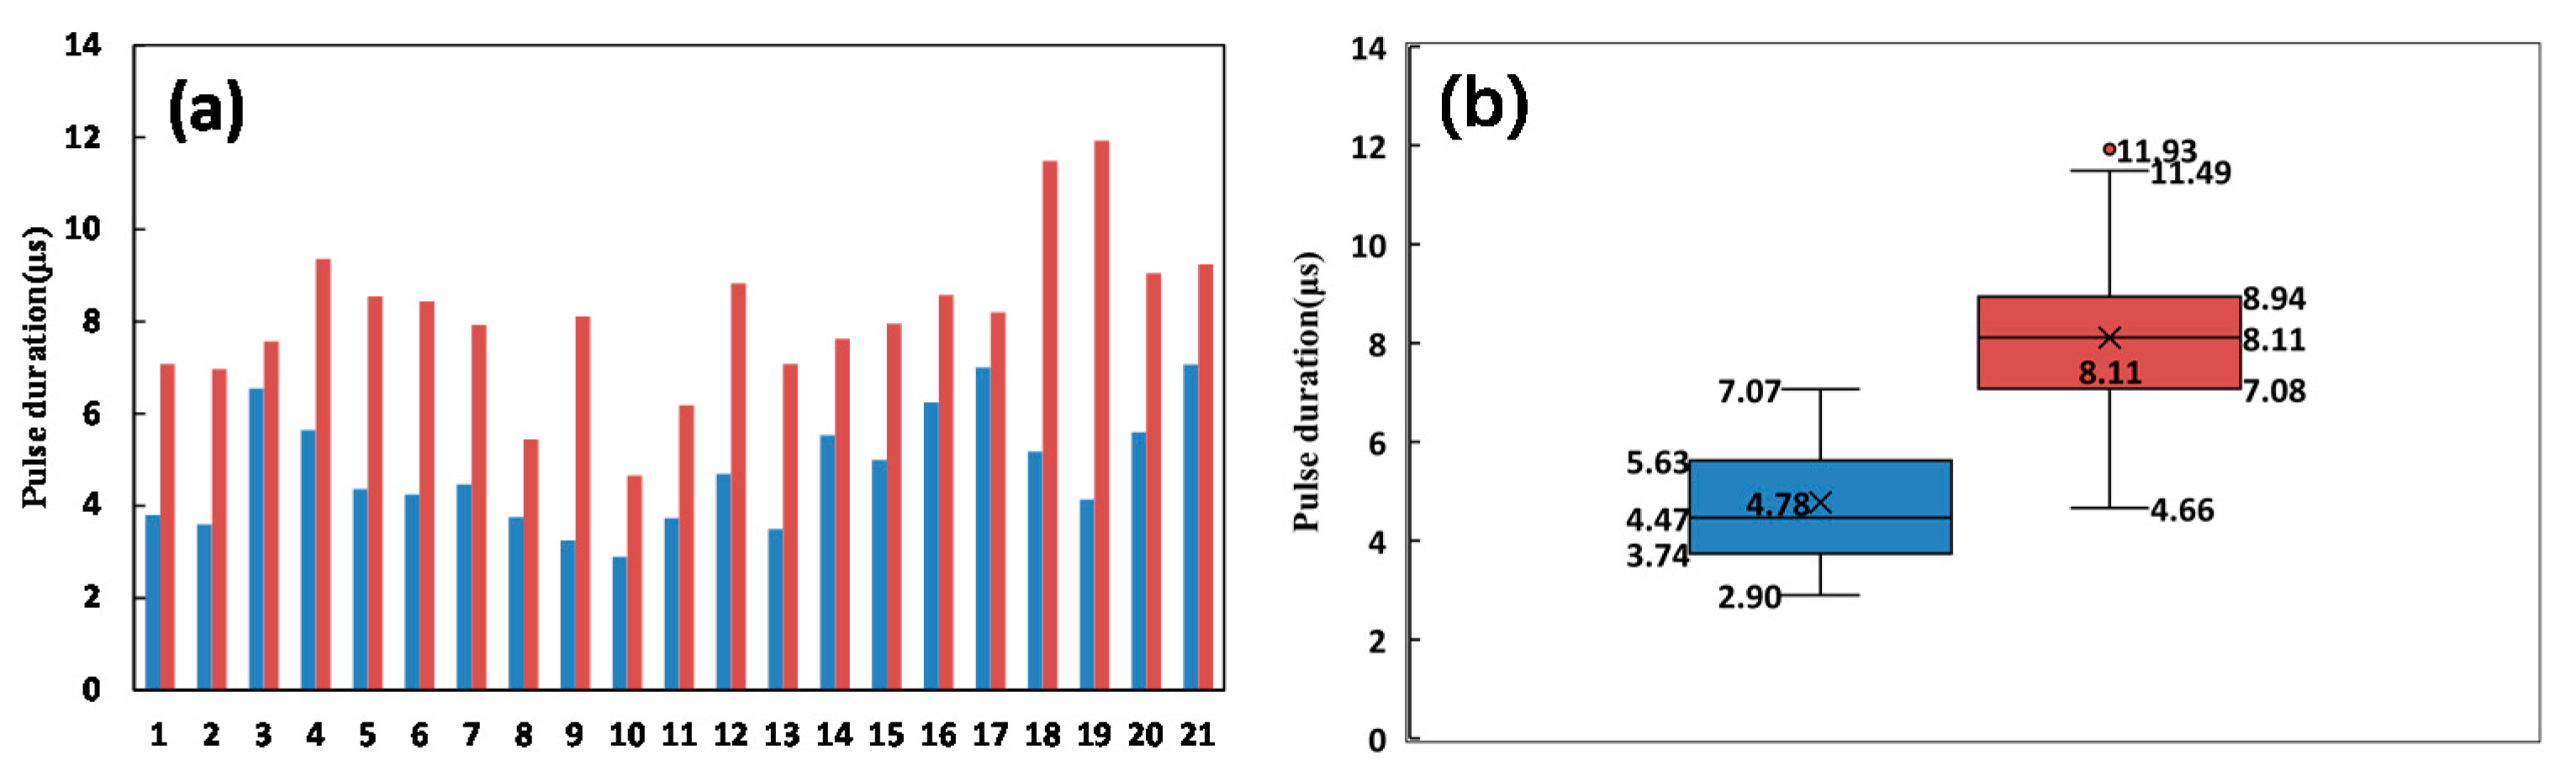
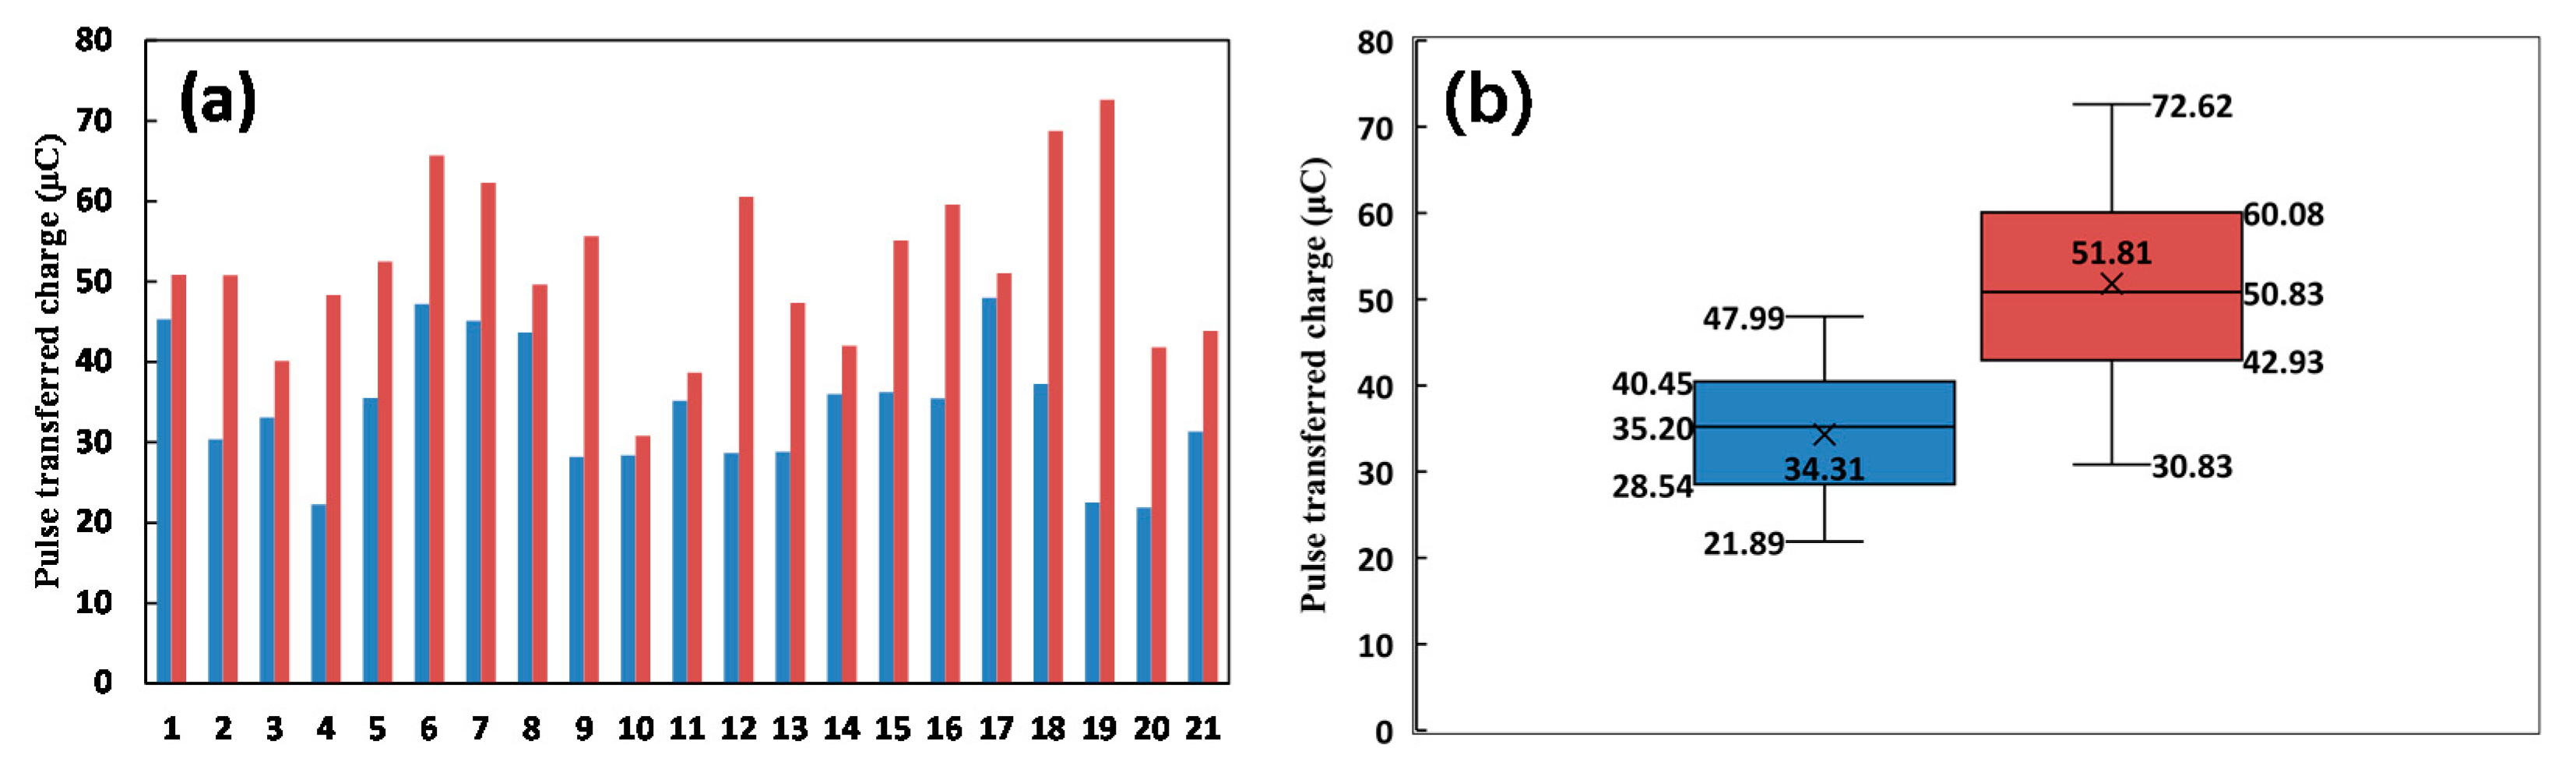
(4) Compared with the closest PCP cluster, IPCPs contain more pulses, with a critical value range of 6–7. Furthermore, the duration of the IPCPs is also longer, with a critical value range of 138–198 μs. Whether the statistics include all 21 initial processes or each initial process individually, the average pulse durations and average pulse transferred charges of IPCPs are larger than those of their closest PCP cluster. On the other hand, IPCPs and PCP clusters have no significant difference in current pulse peak.
The initial process of triggered lightning is very similar to that of long sparks observed in laboratory. Gallimberti et al. [3] reported the fundamental processes in long air gap discharges in detail. A positive discharge is initiated by the formation of the first corona. The corona consists of a number of streamer channels that develop from a common root. After one or more coronas, if the electric field is high enough, the leader channel inception itself takes place, starting from the common root of the coronas. The UPL of the triggered lightning should also be initiated and sustained by the formation in virgin air of ‘streamer corona’ and ‘leader’ discharges. It can be speculated that PCPs and IPCPs correspond to corona discharges and ‘leader’ discharges, respectively. Increases in the durations and transferred charges of PCPs indicate that the corresponding corona discharges intensifies. Gallimberti et al. [3] also mentioned that the leader propagates almost continuously, unless the rate of increase of the voltage is too low, in which case sudden re-illuminations associated with channel elongation appear during the propagation (‘restrikes’). In our results, the multi-initial process was similar to that case, as the condition with a slow increase of the local electric field led to an occurrence of multiple initial processes.
The evolution characteristics given in this paper can provide a reference for the development of a leader model in which the charge per unit length is necessary to realize the thermal transition from the diffuse glow to the leader channel [4]. In this paper, although we have given the transferred charge of PCPs when IPCPs appear, there is still a lack of the development scale. Therefore, we will obtain the development scale through analysis of VHF positioning results in the next step, so as to obtain the key model parameters.

Author Contributions

Conceptualization, Y.Z. (Yang Zhang); Formal analysis, Z.C.; Funding acquisition, Y.Z. (Yang Zhang) and Y.F.; Investigation, Y.F., J.W., D.Z., X.F., L.X., W.L. and Y.Z. (Yijun Zhang); Methodology, Y.Z. (Yang Zhang); Project administration, Y.Z. (Yang Zhang); Writing—original draft, Z.C. and Y.Z. (Yang Zhang); Writing—review & editing, Z.C. and Y.Z. (Yang Zhang). All authors contributed to the experiment. And all authors have read and approved the final version. All authors have read and agreed to the published version of the manuscript.

Funding

This research was funded by the National Natural Science Foundation of China (41775009 and 41905004), the National Key Research and Development Program of China (2017YFC1501501) and the Basic Research Fund of the Chinese Academy of Meteorological Sciences (Grant 2018Z003).

Acknowledgments

We are thankful to Shaodong Chen and Xu Yan for the assistance in experimental maintenance.

Conflicts of Interest

The authors declare no conflict of interest.

References

  1. Akyuz, M.; Cooray, V. The franklin lightning conductor: Conditions necessary for the initiation of a connecting leader. J. Electrost. 2001, 51, 319–325. [Google Scholar] [CrossRef]
  2. Chen, W.; Zeng, R.; He, H. Research progress of long air gap discharges (in Chinese). High. Voltage. Eng. 2013, 39, 1281–1295. [Google Scholar]
  3. Gallimberti, I.; Bacchiega, G.; Bondiou-Clergerie, A.; Lalande, P. Fundamental processes in long air gap discharges. C. R. Phys. 2002, 3, 1335–1359. [Google Scholar] [CrossRef]
  4. Goelian, N.; Lalande, P.; Bondiou-Clergerie, A.; Bacchiega, G.L.; Gazzani, A.; Gallimberti, I. A simplified model for the simulation of positive-spark development in long air gaps. J. Phys. D Appl. Phys. 1997, 30, 2441–2452. [Google Scholar] [CrossRef]
  5. Shi, W.; Li, Q. Research on the lightning upward leader inception based on leader discharge theory (in Chinese). Proc. Chin. Soc. Elect. Eng. 2014, 34, 2470–2477. [Google Scholar]
  6. Zeng, R.; Zhuang, C.; Yu, Z.; Chen, S.; Li, Z.; Chen, W. Challenges and achievement in long air gap discharge research (in Chinese). High. Voltage. Eng. 2014, 40, 2945–2955. [Google Scholar]
  7. Jiang, R.; Qie, X.; Wang, C.; Yang, J. Propagating features of upward positive leaders in the initial stage of rocket-triggered lightning. Atmos. Res. 2013, 129–130, 90–96. [Google Scholar] [CrossRef]
  8. Sun, Z.; Qie, X.; Jiang, R.; Liu, M.; Wu, X.; Wang, Z.; Lu, G.; Zhang, H. Characteristics of a rocket-triggered lightning flash with large stroke number and the associated leader propagation. J. Geophys. Res. Atmos. 2014, 119, 13388–13399. [Google Scholar] [CrossRef]
  9. Biagi, C.J.; Uman, M.A.; Hill, J.D.; Jordan, D.M. Observations of the initial, upward-propagating, positive leader steps in a rocket-and-wire triggered lightning discharge. Geophys. Res. Lett. 2011, 38, L24809. [Google Scholar] [CrossRef] [Green Version]
  10. Horii, K. Experiment of artificial lightning triggered with rocket. Mem. Fac. Eng. Nagoya Univ. 1982, 34, 77–112. [Google Scholar]
  11. Lalande, P.; Bondiou-Clergerie, A.; Laroche, P.; Eybert-Berard, A.; Berlandis, J.-P.; Bador, B.; Bonamy, A.; Uman, M.A.; Rakov, V.A. Leader properties determined with triggered lightning techniques. J. Geophys. Res. 1998, 103, 14109–14115. [Google Scholar] [CrossRef]
  12. Willett, J.C.; Davis, D.A.; Laroche, P. An experimental study of positive leaders initiating rocket-triggered lightning. Atmos. Res. 1999, 51, 189–219. [Google Scholar] [CrossRef]
  13. Biagi, C.J.; Jordan, D.M.; Uman, M.A.; Hill, J.D.; Beasley, W.H.; Howard, J. High-speed video observations of rocket-and-wire initiated lightning. Geophys. Res. Lett. 2009, 36, L15801. [Google Scholar] [CrossRef] [Green Version]
  14. Biagi, C.J.; Uman, M.A.; Hill, J.D.; Rakov, V.A.; Jordan, D.M. Transient current pulses in rocket-extended wires used to trigger lightning. J. Geophys. Res. 2012, 117, D07205. [Google Scholar] [CrossRef]
  15. Zhang, Y.; Krehbiel, P.R.; Zhang, Y.; Lu, W.; Zheng, D.; Xu, L.; Huang, Z. Observations of the initial stage of a rocket-and-wire-triggered lightning discharge. Geophys. Res. Lett. 2017, 44, 4332–4340. [Google Scholar] [CrossRef]
  16. Zhang, Y.; Qian, Y.; Zhang, Y.; Lü, W.; Zheng, D.; Chen, S. Discharge characteristics of upward positive leaders in initial stage of artificially triggered lightning (in Chinese). High. Voltage. Eng. 2017, 43, 1602–1608. [Google Scholar]
  17. Zhang, Y.; Yang, S.; Lu, W.; Zheng, D.; Dong, W.; Li, B.; Chen, S.; Zhang, Y.; Chen, L. Experiments of artificially triggered lightning and its application in Conghua, Guangdong, China. Atmos. Res. 2014, 135, 330–343. [Google Scholar] [CrossRef]
Figure 1. Schematic diagram of the direct measurement of the lightning current.
Atmosphere 11 00658 g001
Figure 2. Current waveform and partially enlarged view during the initial stage of triggered lightning 370. (A) Enlarged waveform of a precursor current pulse (PCP). (B) Enlarged waveform of a PCP cluster. (C) Enlarged waveform of an initial precursor current pulses (IPCPs).
Atmosphere 11 00658 g002
Figure 3. The pulse duration (a) and transferred charge (b) of triggered lightning 370 during its initial stage over time. Blue squares represent PCPs, red circles represent PCP clusters, green triangles represent IPCPs and the black line is the linear fitting line of the PCPs.
Atmosphere 11 00658 g003
Figure 4. Current waveform and partially enlarged view of triggered lightning 570. (AC) Enlarged waveform of three IPCPs.
Atmosphere 11 00658 g004
Figure 5. Graph of pulse duration (a) and transferred charge (b) of triggered lightning 570 over time. Blue squares represent PCPs, red circles represent PCP clusters, green triangles represent IPCPs and the black line is the linear fitting line of the PCPs.
Atmosphere 11 00658 g005
Figure 6. Statistical chart of ground-level quasi-static electric field intensity during rocket launching. The blue part corresponds to the single initial process form, and the red part corresponds to the multiple initial process form.
Atmosphere 11 00658 g006
Figure 7. Statistical graph of the duration of the initial stage. The blue part corresponds to the single initial process form, the red part corresponds to the multiple initial process form and the green part corresponds to first initial process in the multiple initial process form.
Atmosphere 11 00658 g007
Figure 8. Pulse durations and transferred charges of PCPs when PCP clusters and IPCPs appear. (a) Pulse durations during each case. (b) Pulse durations for all cases. (c) Pulse transferred charges during each case. (d) Pulse transferred charges for all cases. The blue is PCP clusters, and the red is IPCPs.
Atmosphere 11 00658 g008
Figure 9. Average pulse peaks of PCP clusters and IPCPs. (a) Statistics of each case. (b) Overall statistics of all cases. The blue is the PCP clusters and the red is the IPCPs.
Atmosphere 11 00658 g009
Figure 10. Average pulse durations of PCP clusters and IPCPs. (a) Statistics of each case. (b) Overall statistics of all cases. The blue is the PCP clusters and the red is the IPCPs.
Atmosphere 11 00658 g010
Figure 11. Average pulse transferred charge of PCP clusters and IPCPs. (a) Statistics of each case. (b) Overall statistics of all cases. The blue is the PCP clusters and the red is the IPCPs.
Atmosphere 11 00658 g011

