Assimilation of Himawari-8 Rapid-Scan Atmospheric Motion Vectors on Tropical Cyclone in HWRF System

 ,
,
Abstract
:
1. Introduction
2. Case and Methodology
2.1. Rapid-Scan Atmospheric Motion Vector of Himawari-8
2.2. Outline of HWRF and Experimental Design
2.3. Cases of TC
3. Results
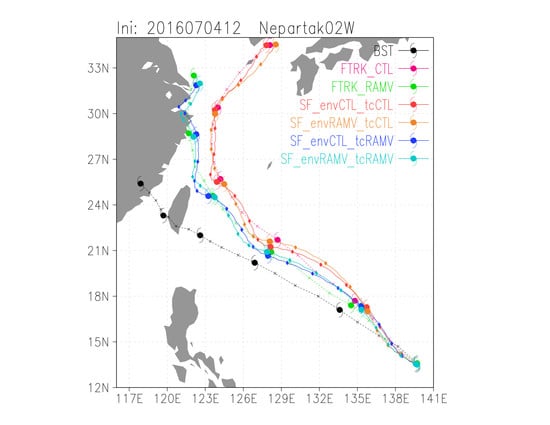
3.1. Track Forecast
3.2. Intensity Forecast
3.3. Size Forecast
3.4. Track Error Analysis
3.5. Axisymmetric Structures
4. Conclusions
Author Contributions
Funding
Acknowledgments
Conflicts of Interest
References
- Aberson, S.D.; Franklin, J.L. Impact on hurricane track and intensity forecasts of GPS dropwindsonde observations from the first-season flights of the NOAA Gulfstream-IV Jet Aircraft. Bull. Am. Meteorol. Soc. 1999, 80, 421–427. [Google Scholar] [CrossRef] [Green Version]
- Aberson, S.; Aksoy, D.A.; Sellwood, K.J.; Vukicevic, T.; Zhang, X. Assimilation of high-resolution tropical cyclone observations with an ensemble Kalman filter using HEDAS: Evaluation of 2008–11 HWRF forecasts. Mon. Weather Rev. 2015, 143, 511–523. [Google Scholar] [CrossRef]
- Wu, T.; Liu, H.; Majumdar, S.J.; Velden, C.S.; Anderson, J.L. Influence of Assimilating Satellite-Derived Atmospheric Motion Vector Observations on Numerical Analyses and Forecasts of Tropical Cyclone Track and Intensity. Mon. Weather Rev. 2014, 142, 49–71. [Google Scholar] [CrossRef] [Green Version]
- Wu, T.; Velden, C.S.; Majumdar, S.J.; Liu, H.; Anderson, J.L. Understanding the Influence of Assimilating Subsets of Enhanced Atmospheric Motion Vectors on Numerical Analyses and Forecasts of Tropical Cyclone Track and Intensity with an Ensemble Kalman Filter. Mon. Weather Rev. 2015, 143, 2506–2531. [Google Scholar] [CrossRef]
- Pu, Z.; Zhang, S.; Tong, M.; Tallapragada, V. Influence of the Self-Consistent Regional Ensemble Background Error Covariance on Hurricane Inner-Core Data Assimilation with the GSI-Based Hybrid System for HWRF. J. Atmos. Sci. 2016, 73, 4911–4925. [Google Scholar] [CrossRef]
- Velden, C.; Lewis, W.E.; Bresky, W.; Stettner, D.; Daniels, J.; Wanzong, S. Assimilation of High-Resolution Satellite-Derived Atmospheric Motion Vectors: Impact on HWRF Forecasts of Tropical Cyclone Track and Intensity. Mon. Weather Rev. 2017, 145, 1107–1125. [Google Scholar] [CrossRef]
- Elsberry, R.L.; Hendricks, E.A.; Velden, C.S.; Bell, M.M.; Peng, M.; Casas, E.; Zhao, Q. Demonstration with Special TCI-15 Datasets of Potential Impacts of New-Generation Satellite Atmospheric Motion Vectors on Navy Regional and Global Models. Weather Forecast. 2018, 33, 1617–1637. [Google Scholar] [CrossRef]
- Tong, M.; Sippel, J.A.; Tallapragada, V.; Liu, E.; Kieu, C.; Kwon, I.; Wang, W.; Liu, Q.; Ling, Y.; Zhang, B. Impact of Assimilating Aircraft Reconnaissance Observations on Tropical Cyclone Initialization and Prediction Using Operational HWRF and GSI Ensemble-Variational Hybrid Data Assimilation. Mon. Weather Rev. 2018, 146, 4155–4177. [Google Scholar] [CrossRef]
- Zhang, S.; Pu, Z.; Velden, C. Impact of Enhanced Atmospheric Motion Vectors on HWRF Hurricane Analyses and Forecasts with Different Data Assimilation Configurations. Mon. Weather Rev. 2018, 146, 1549–1569. [Google Scholar] [CrossRef]
- Lim, A.H.N.; Jung, J.A.; Nebuda, S.E.; Daniels, J.M.; Bresky, W.; Tong, M.; Tallapragada, V. Tropical Cyclone Forecasts Impact Assessment from the Assimilation of Hourly Visible, Shortwave, and Clear-Air Water Vapor Atmospheric Motion Vectors in HWRF. Weather Forecast. 2019, 34, 177–198. [Google Scholar] [CrossRef]
- Sawada, M.; Ma, Z.; Mehra, A.; Tallapragada, V.; Oyama, R.; Shimoji, K. Impacts of Assimilating High-Resolution Atmospheric Motion Vectors Derived from Himawari-8 on Tropical Cyclone Forecast in HWRF. Mon. Weather Rev. 2019, 147, 3721–3740. [Google Scholar] [CrossRef]
- Li, J.; Li, J.; Velden, C.; Wang, P.; Schmit, T.J.; Sippel, J. Impact of rapid-scan-based dynamical information from GOES-16 on HWRF hurricane forecasts. J. Geophys. Res. Atmos. 2020, 125. [Google Scholar] [CrossRef]
- Chan, P.; Wu, N.; Zhang, C.; Deng, W.; Hon, K. The first complete dropsonde observation of a tropical cyclone over the South China Sea by the Hong Kong Observatory. Weather 2018, 73, 227–234. [Google Scholar] [CrossRef] [Green Version]
- Ito, K.; Yamada, H.; Yamaguchi, M.; Nakazawa, T.; Nagahama, N.; Shimizu, K.; Ohigashi, T.; Shinoda, T.; Tsuboki, K. Analysis and forecast using dropsonde data from the inner-core region of Tropical Cyclone Lan (2017) obtained during the first aircraft missions of T-PARCII. SOLA 2018, 14, 105–110. [Google Scholar] [CrossRef] [Green Version]
- Gao, Y.; Xiao, H.; Jiang, D.; Wan, Q.; Chan, P.W.; Hon, K.K.; Deng, G. Impacts of Thinning Aircraft Observations on Data Assimilation and Its Prediction during Typhoon Nida (2016). Atmosphere 2019, 10, 754. [Google Scholar] [CrossRef] [Green Version]
- Torn, R.D. The Impact of Targeted Dropwindsonde Observations on Tropical Cyclone Intensity Forecasts of Four Weak Systems during PREDICT. Mon. Weather Rev. 2014, 142, 2860–2878. [Google Scholar] [CrossRef]
- Feng, J.; Wang, X. Impact of Assimilating Upper-Level Dropsonde Observations Collected during the TCI Field Campaign on the Prediction of Intensity and Structure of Hurricane Patricia (2015). Mon. Weather Rev. 2019, 147, 3069–3089. [Google Scholar] [CrossRef]
- Christophersen, H.; Aksoy, A.; Dunion, J.; Sellwood, K.J. The impact of NASA Global Hawk unmanned aircraft dropwindsonde observations on tropical cyclone track, intensity, and structure: Case studies. Mon. Weather Rev. 2017, 145, 1817–1830. [Google Scholar] [CrossRef]
- Velden, C.; Daniels, J.; Stettner, D.; Santek, D.; Key, J.; Dunion, J.; Holmlund, K.; Dengel, G.; Bresky, W.; Menzel, P. Recent Innovations in Deriving Tropospheric Winds from Meteorological Satellites. Bull. Am. Meteorol. Soc. 2005, 86, 205–224. [Google Scholar] [CrossRef] [Green Version]
- Bessho, K.; Date, K.; Hayashi, M.; Ikeda, A.; Imai, T.; Inoue, H.; Kumagai, Y.; Miyakawa, T.; Murata, H.; Ohno, T.; et al. An introduction to Himawari-8/9—Japan’s new-generation geostationary meteorological satellites. J. Meteorol. Soc. Jpn. 2016, 94, 151–183. [Google Scholar] [CrossRef] [Green Version]
- Kunii, M.; Otsuka, M.; Shimoji, K.; Seko, H. Ensemble data assimilation and forecast experiments for the September 2015 heavy rainfall event in Kanto and Tohoku regions with atmospheric motion vectors from Himawari-8. SOLA 2016, 12, 209–214. [Google Scholar] [CrossRef] [Green Version]
- Otsuka, M.; Seko, H.; Shimoji, K.; Yamashita, K. Characteristics of Himawari-8 rapid scan atmospheric motion vectors utilized in mesoscale data assimilation. J. Meteorol. Soc. Jpn. 2018, 96B, 111–131. [Google Scholar] [CrossRef] [Green Version]
- Liu, Q.; Surgi, N.; Lord, S.; Wu, W.-S.; Parrish, S.; Gopalakrishnan, S.; Waldrop, J.; Gamache, J. Hurricane initialization in HWRF model. In Proceedings of the 27th Conference on Hurricanes and Tropical Meteorology, Monterey, CA, USA, 23–28 April 2006; Available online: http://ams.confex.com/ams/pdfpapers/108496.pdf (accessed on 20 April 2020).
- Liu, Q.; Zhang, X.; Trahan, S.; Tallapragada, V. Extending operational HWRF initialization to triple-nest HWRF system. In Proceedings of the 30th Conference on Hurricanes and Tropical Meteorology, Ponte Vedra Beach, FL, USA, 15–20 April 2012; Available online: https://ams.confex.com/ams/30Hurricane/webprogram/Paper204853.html (accessed on 20 April 2020).
- Goldenberg, S.B.; Gopalakrishnan, S.G.; Tallapragada, V.; Quirino, T.; Marks, F.; Trahan, S.; Zhang, X.; Atlas, R. The 2012 Triply Nested, High-Resolution Operational Version of the Hurricane Weather Research and Forecasting Model (HWRF): Track and Intensity Forecast Verifications. Weather Forecast. 2015, 30, 710–729. [Google Scholar] [CrossRef]
- Tallapragada, V.; Kieu, C.; Kwon, Y.; Trahan, S.; Liu, Q.; Zhang, Z.; Kwon, I.-H. Evaluation of storm structure from the operational HWRF Model during 2012 implementation. Mon. Weather Rev. 2014, 142, 4308–4325. [Google Scholar] [CrossRef]
- Lu, X.; Wang, X.; Li, Y.; Tong, M.; Ma, X. GSI-based ensemble-variational hybrid data assimilation for HWRF for hurricane initialization and prediction: Impact of various error covariances for airborne radar observation assimilation. Q. J. R. Meteorol. Soc. 2017, 143, 223–239. [Google Scholar] [CrossRef]
- Otsuka, M.; Kunii, M.; Seko, H.; Shimoji, K.; Hayashi, M.; Yamashita, K. Assimilation experiments of MTSAT rapid scan atmospheric motion vectors on a heavy rainfall event. J. Meteorol. Soc. Jpn. 2015, 93, 459–475. [Google Scholar] [CrossRef] [Green Version]
- Cordoba, M.; Dance, S.L.; Kelly, G.A.; Nichols, N.K.; Waller, J.A. Diagnosing atmospheric motion vector observation errors for an operational high-resolution data assimilation system. Q. J. R. Meteorol. Soc. 2017, 143, 333–341. [Google Scholar] [CrossRef]
- Yamashita, K. An observing system experiment of MTSAT-2 rapid scan AMV using JMA meso-scale operational NWP system. In Proceedings of the 11th International Winds Workshop, Auckland, New Zealand, 20–24 February 2012; Available online: http://cimss.ssec.wisc.edu/iwwg/iww11/talks/Session4_Yamashita2.pdf (accessed on 20 April 2020).
- Shimoji, K. Motion Tracking and Cloud Height Assignment Methods for Himawari-8 AMV. In Proceedings of the 12th International Winds Workshop, Copenhagen, Denmark, 16–20 June 2014; Available online: http://cimss.ssec.wisc.edu/iwwg/iww12/talks/01_Monday/1710_IWWG_0616_2_algorithm_Shimoji_final.pdf (accessed on 20 April 2020).
- Han, J.; Witek, M.; Teixeira, J.; Sun, R.; Pan, H.-L.; Fletcher, J.K.; Bretherton, C.S. Implementation in the NCEP GFS of a Hybrid Eddy-Diffusivity Mass-Flux (EDMF) boundary layer parameterization with dissipative heating and modified stable boundary layer mixing. Weather Forecast. 2016, 31, 341–352. [Google Scholar] [CrossRef]
- Han, J.; Wang, W.; Kwon, Y.C.; Hong, S.; Tallapragada, V.; Yang, F. Updates in the NCEP GFS cumulus convection schemes with scale and aerosol awareness. Weather Forecast. 2017, 32, 2005–2017. [Google Scholar] [CrossRef]
- Aligo, E.A.; Ferrier, B.; Carley, J.R. Modified NAM Microphysics for Forecasts of Deep Convective Storms. Mon. Weather Rev. 2018, 146, 4115–4153. [Google Scholar] [CrossRef]
- Iacono, M.J.; Delamere, J.S.; Mlawer, E.J.; Shephard, M.W.; Clough, S.A.; Collins, W.D. Radiative forcing by long-lived greenhouse gases: Calculations with the AER radiative transfer models. J. Geophys. Res. 2008, 113, D13103. [Google Scholar] [CrossRef]
- Biswas, M.K.; Abarca, S.; Bernardet, L.; Ginis, I.; Grell, E.; Iacono, M.; Kalina, E.; Liu, B.; Liu, Q.; Marchok, T.; et al. Hurricane Weather Research and Forecasting (HWRF) Model: 2018 Scientific Documentation. Available online: https://dtcenter.org/HurrWRF/users/docs/index.php (accessed on 20 April 2020).
- Parrish, D.F.; Derber, J.C. The National Meteorological Center’s Spectral Statistical-Interpolation Analysis System. Mon. Weather Rev. 1992, 120, 1747–1763. [Google Scholar] [CrossRef]
- Wu, W.; Purser, R.J.; Parrish, D.F. Three-Dimensional Variational Analysis with Spatially Inhomogeneous Covariances. Mon. Weather Rev. 2002, 130, 2905–2916. [Google Scholar] [CrossRef] [Green Version]
- Galarneau, T.J.; Davis, C.A. Diagnosing Forecast Errors in Tropical Cyclone Motion. Mon. Weather Rev. 2013, 141, 405–430. [Google Scholar] [CrossRef] [Green Version]
- Rogers, R.F.; Reasor, P.; Lorsolo, S. Airborne Doppler observations of the inner-core structural differences between intensifying and steady-state tropical cyclones. Mon. Weather Rev. 2013, 141, 2970–2991. [Google Scholar] [CrossRef]
- Ren, Y.; Zhang, J.A.; Guimond, S.R.; Wang, X. Hurricane Boundary Layer Height Relative to Storm Motion from GPS Dropsonde Composites. Atmosphere 2019, 10, 339. [Google Scholar] [CrossRef] [Green Version]
- Emanuel, K.; Zhang, F. The Role of Inner-Core Moisture in Tropical Cyclone Predictability and Practical Forecast Skill. J. Atmos. Sci. 2017, 74, 2315–2324. [Google Scholar] [CrossRef]
- Blackwell, W.J.; Braun, S.; Bennartz, R.; Velden, C.; DeMaria, M.; Atlas, R.; Dunion, J.; Marks, F.; Rogers, R.; Annane, B.; et al. An overview of the TROPICS NASA Earth Venture Mission. Q. J. R. Meteorol. Soc. 2018, 144, 16–26. [Google Scholar] [CrossRef] [Green Version]
- Ruf, C.; Atlas, R.; Chang, P.S.; Clarizia, M.P.; Garrison, J.L.; Gleason, S.; Katzberg, S.J.; Jelenak, Z.; Johnson, J.T.; Majumdar, S.J.; et al. New ocean winds satellite mission to probe hurricanes and tropical convection. Bull. Am. Meteorol. Soc. 2016, 97, 385–395. [Google Scholar] [CrossRef]
- Lainbrigtsen, B.; Wilson, W.; Tanner, A.; Gaier, T.; Ruf, C.; Piepmeier, J. GeoSTAR—A microwave sounder for geostationary satellites. In Proceedings of the IGARSS 2004. 2004 IEEE International Geoscience and Remote Sensing Symposium, Anchorage, AK, USA, 20–24 September 2004; pp. 777–780. [Google Scholar]
- Cotton, J.; Francis, P.; Heming, J.; Forsythe, M.; Reul, N.; Donlon, C. Assimilation of SMOS L-band wind speeds: Impact on Met Office global NWP and tropical cyclone predictions. Q. J. R. Meteorol. Soc. 2017, 144, 614–629. [Google Scholar] [CrossRef]
- Meissner, T.; Ricciardulli, L.; Wentz, F.J. Capability of the SMAP Mission to Measure Ocean Surface Winds in Storms. Bull. Am. Meteorol. Soc. 2017, 98, 1660–1677. [Google Scholar] [CrossRef]
- Chang, Y.; Yang, S.; Lin, K.; Lien, G.; Wu, C. Impact of Tropical Cyclone Initialization on Its Convection Development and Intensity: A Case Study of Typhoon Megi (2010). J. Atmos. Sci. 2020, 77, 443–464. [Google Scholar] [CrossRef]
- Honda, T.; Miyoshi, T.; Lien, G.Y.; Nishizawa, S.; Yoshida, R.; Adachi, S.A.; Terasaki, K.; Okamoto, K.; Tomita, H.; Bessho, K. Assimilating all-sky Himawari-8 satellite infrared radiances: A case of typhoon Soudelor (2015). Mon. Weather Rev. 2018, 146, 213–229. [Google Scholar] [CrossRef]
- Sawada, Y.; Okamoto, K.; Kunii, M.; Miyoshi, T. Assimilating every-10-minute Himawari-8 infrared radiances to improve convective predictability. J. Geophys. Res. Atmos. 2019, 124, 2546–2561. [Google Scholar] [CrossRef]
- Zhang, F.; Minamide, M.; Clothiaux, E.E. Potential impacts of assimilating all-sky infrared satellite radiances from GOES-R on convection-permitting analysis and prediction of tropical cyclones. Geophys. Res. Lett. 2016, 43, 2954–2963. [Google Scholar] [CrossRef] [Green Version]
- Minamide, M.; Zhang, F. An adaptive background error inflation method for assimilating all-sky radiances. Q. J. R. Meteorol. Soc. 2019, 145, 1–19. [Google Scholar] [CrossRef]


| Case | Assimilated AMVs | VI | Thinning |
|---|---|---|---|
| CTL | OPAMV | On | None |
| RAMV | OPAMV + RS-AMV | On | None |
| RAMV_NVI | OPAMV + RS-AMV | Off | None |
| RAMV_T10K | OPAMV + RS-AMV | On | 10 km |
| Case | Cycle Period | No. of Cycles |
|---|---|---|
| Nepartak | 1800 UTC 2 July–0000 UTC 9 July 2016 | 26 |
| Meranti | 1200 UTC 8 September –1800 UTC 14 September 2016 | 26 |
| Megi | 0600 UTC 23 September –0600 UTC 28 September 2016 | 21 |
© 2020 by the authors. Licensee MDPI, Basel, Switzerland. This article is an open access article distributed under the terms and conditions of the Creative Commons Attribution (CC BY) license (http://creativecommons.org/licenses/by/4.0/).
Share and Cite
Sawada, M.; Ma, Z.; Mehra, A.; Tallapragada, V.; Oyama, R.; Shimoji, K. Assimilation of Himawari-8 Rapid-Scan Atmospheric Motion Vectors on Tropical Cyclone in HWRF System. Atmosphere 2020, 11, 601. https://doi.org/10.3390/atmos11060601
Sawada M, Ma Z, Mehra A, Tallapragada V, Oyama R, Shimoji K. Assimilation of Himawari-8 Rapid-Scan Atmospheric Motion Vectors on Tropical Cyclone in HWRF System. Atmosphere. 2020; 11(6):601. https://doi.org/10.3390/atmos11060601
Chicago/Turabian StyleSawada, Masahiro, Zaizhong Ma, Avichal Mehra, Vijay Tallapragada, Ryo Oyama, and Kazuki Shimoji. 2020. "Assimilation of Himawari-8 Rapid-Scan Atmospheric Motion Vectors on Tropical Cyclone in HWRF System" Atmosphere 11, no. 6: 601. https://doi.org/10.3390/atmos11060601