Article

Statistical Modelling of Temperature-Attributable Deaths in Portuguese Metropolitan Areas under Climate Change: Who Is at Risk?

1
Department of Geography and Tourism, University of Coimbra, Centre of Studies on Geography and Spatial Planning, 3004-530 Coimbra, Portugal
2
Department of Physics and Centre for Environmental and Marine Studies (CESAM), University of Aveiro, Campus Universitário de Santiago, 3810-093 Aveiro, Portugal
*
Author to whom correspondence should be addressed.
Atmosphere 2020, 11(2), 159; https://doi.org/10.3390/atmos11020159
Submission received: 11 December 2019 / Revised: 22 January 2020 / Accepted: 29 January 2020 / Published: 3 February 2020
(This article belongs to the Special Issue 10th Anniversary of Atmosphere: Climatology and Meteorology)

Abstract

:
Several studies emphasize that temperature-related mortality can be expected to have differential effects on different subpopulations, particularly in the context of climate change. This study aims to evaluate and quantify the future temperature-attributable mortality due to circulatory system diseases by age groups (under 65 and 65+ years), in Lisbon metropolitan area (LMA) and Porto metropolitan area (PMA), over the 2051–2065 and 2085–2099 time horizons, considering the greenhouse gas emissions scenario RCP8.5, in relation to a historical period (1991–2005). We found a decrease in extreme cold-related deaths of 0.55% and 0.45% in LMA, for 2051–2065 and 2085–2099, respectively. In PMA, there was a decrease in cold-related deaths of 0.31% and 0.49% for 2051–2065 and 2085–2099, respectively, compared to 1991–2005. In LMA, the burden of extreme heat-related mortality in age group 65+ years is slightly higher than in age group <65 years, at 2.22% vs. 1.38%, for 2085–2099. In PMA, only people aged 65+ years showed significant temperature-related burden of deaths that can be attributable to hot temperatures. The heat-related excess deaths increased from 0.23% for 2051–2065 to 1.37% for 2085–2099, compared to the historical period.

1. Introduction

The association between extreme temperatures and mortality in urban areas has been identified in previous studies [1,2,3,4,5,6,7,8,9,10,11]. Additionally, studies from Portugal report that a large proportion of such excess mortality in the hot season is caused by cardiovascular diseases, cerebrovascular diseases, and diseases of the respiratory system. This mortality is higher among the elderly and people with pre-existing conditions [1,12,13]. Concerning the cold season, Portugal has been mentioned over the years as having one of the highest rates of excess winter mortality in Europe [14,15,16,17], which may be related to socioeconomic conditions and population health status. Most often, this excess has been attributed to the influenza virus, mainly among the most vulnerable populations, due to the spread of respiratory infections and the decompensation caused by chronic illnesses [1,9,18,19,20].
Though many studies demonstrate the association between extreme temperatures and mortality, the Intergovernmental Panel on Climate Change (IPCC) Assessment Report [21] IPCC, and the World Health Organization [22] consider that research on the impacts of climate change, such as temperature-related mortality [23], should be intensified so as to characterize and identify the most vulnerable population groups, taking urban context into account [24]. Urban areas are particularly vulnerable to the effects of extreme temperatures [25] due to the high concentration of the susceptible population (elderly, impoverished populations, people with chronic health conditions, including diabetes, people using certain medications, the mentally ill and outdoor workers) [26,27], buildings, number of green areas or vegetative covering [28,29] and the nature of infrastructures [30,31].
In a context characterized by climate change, future scenario-based projections have stood as the main approach when it comes to planning and formulating policies. Climate change is expected to bring about a temperature increase between 1.6 °C and 4.5 °C by 2100 [32]. More importantly, temperature extremes have become more frequent and intense, and this trend is expected to continue in the future [33,34,35]. These projections have been estimated for many regions [36,37,38], and particularly for Europe [39,40], the Mediterranean [41,42,43], and the Iberian Peninsula [44]. Heat waves are such type of temperature extreme events that may bring continuous thermal stress for periods of days and are associated to increased mortality [45,46]. The frequency and intensity of heat waves is also expected to increase in the future in many regions [47,48,49]. This has been reported for Europe [50,51,52,53,54] and particularly for the Iberian Peninsula [55,56]. Pereira et al. [55] estimated projections of heat waves for 12 cities in the Iberian Peninsula for the Representative Concentration Pathway 8.5 (RCP8.5) greenhouse gas emission scenario. They report very large increases in the average number of heat wave days per year, up to 10-fold in some cities which may experience heat wave conditions during most of the summer by 2100.
Accordingly, the aim of this study is to quantify attributable mortality while identifying and characterizing the age groups (aged less than 65 and 65+ years) that are more vulnerable to the health impacts of climate change in Portuguese metropolitan areas (Lisbon and Porto), over the 2046–2065 and 2080–2099 time horizons, under a Representative Concentration Pathway 8.5 (RCP8.5) greenhouse gas emission scenario.

2. Data and Methods

2.1. Mortality Data

For this study, we first collected daily deaths due to diseases of the circulatory system from metropolitan areas (LMA, Lisbon metropolitan area; PMA, Porto metropolitan area). Data on the daily counts of deaths from 1 January 1 1991 to 31 December 2005 were collected from the Statistics Portugal. Mortality data were classified into the following categories using the International Classification of Diseases, Ninth Revision (ICD-9) and the International Statistical Classification of Diseases and Related Health Problems, Tenth Revision (ICD-10): Diseases of the Circulatory System (ICD–9: 390-459, ICD-10: I00-I99). To account for population aging, mortality data were disaggregated by two age groups (0–65 years and 65+ years).

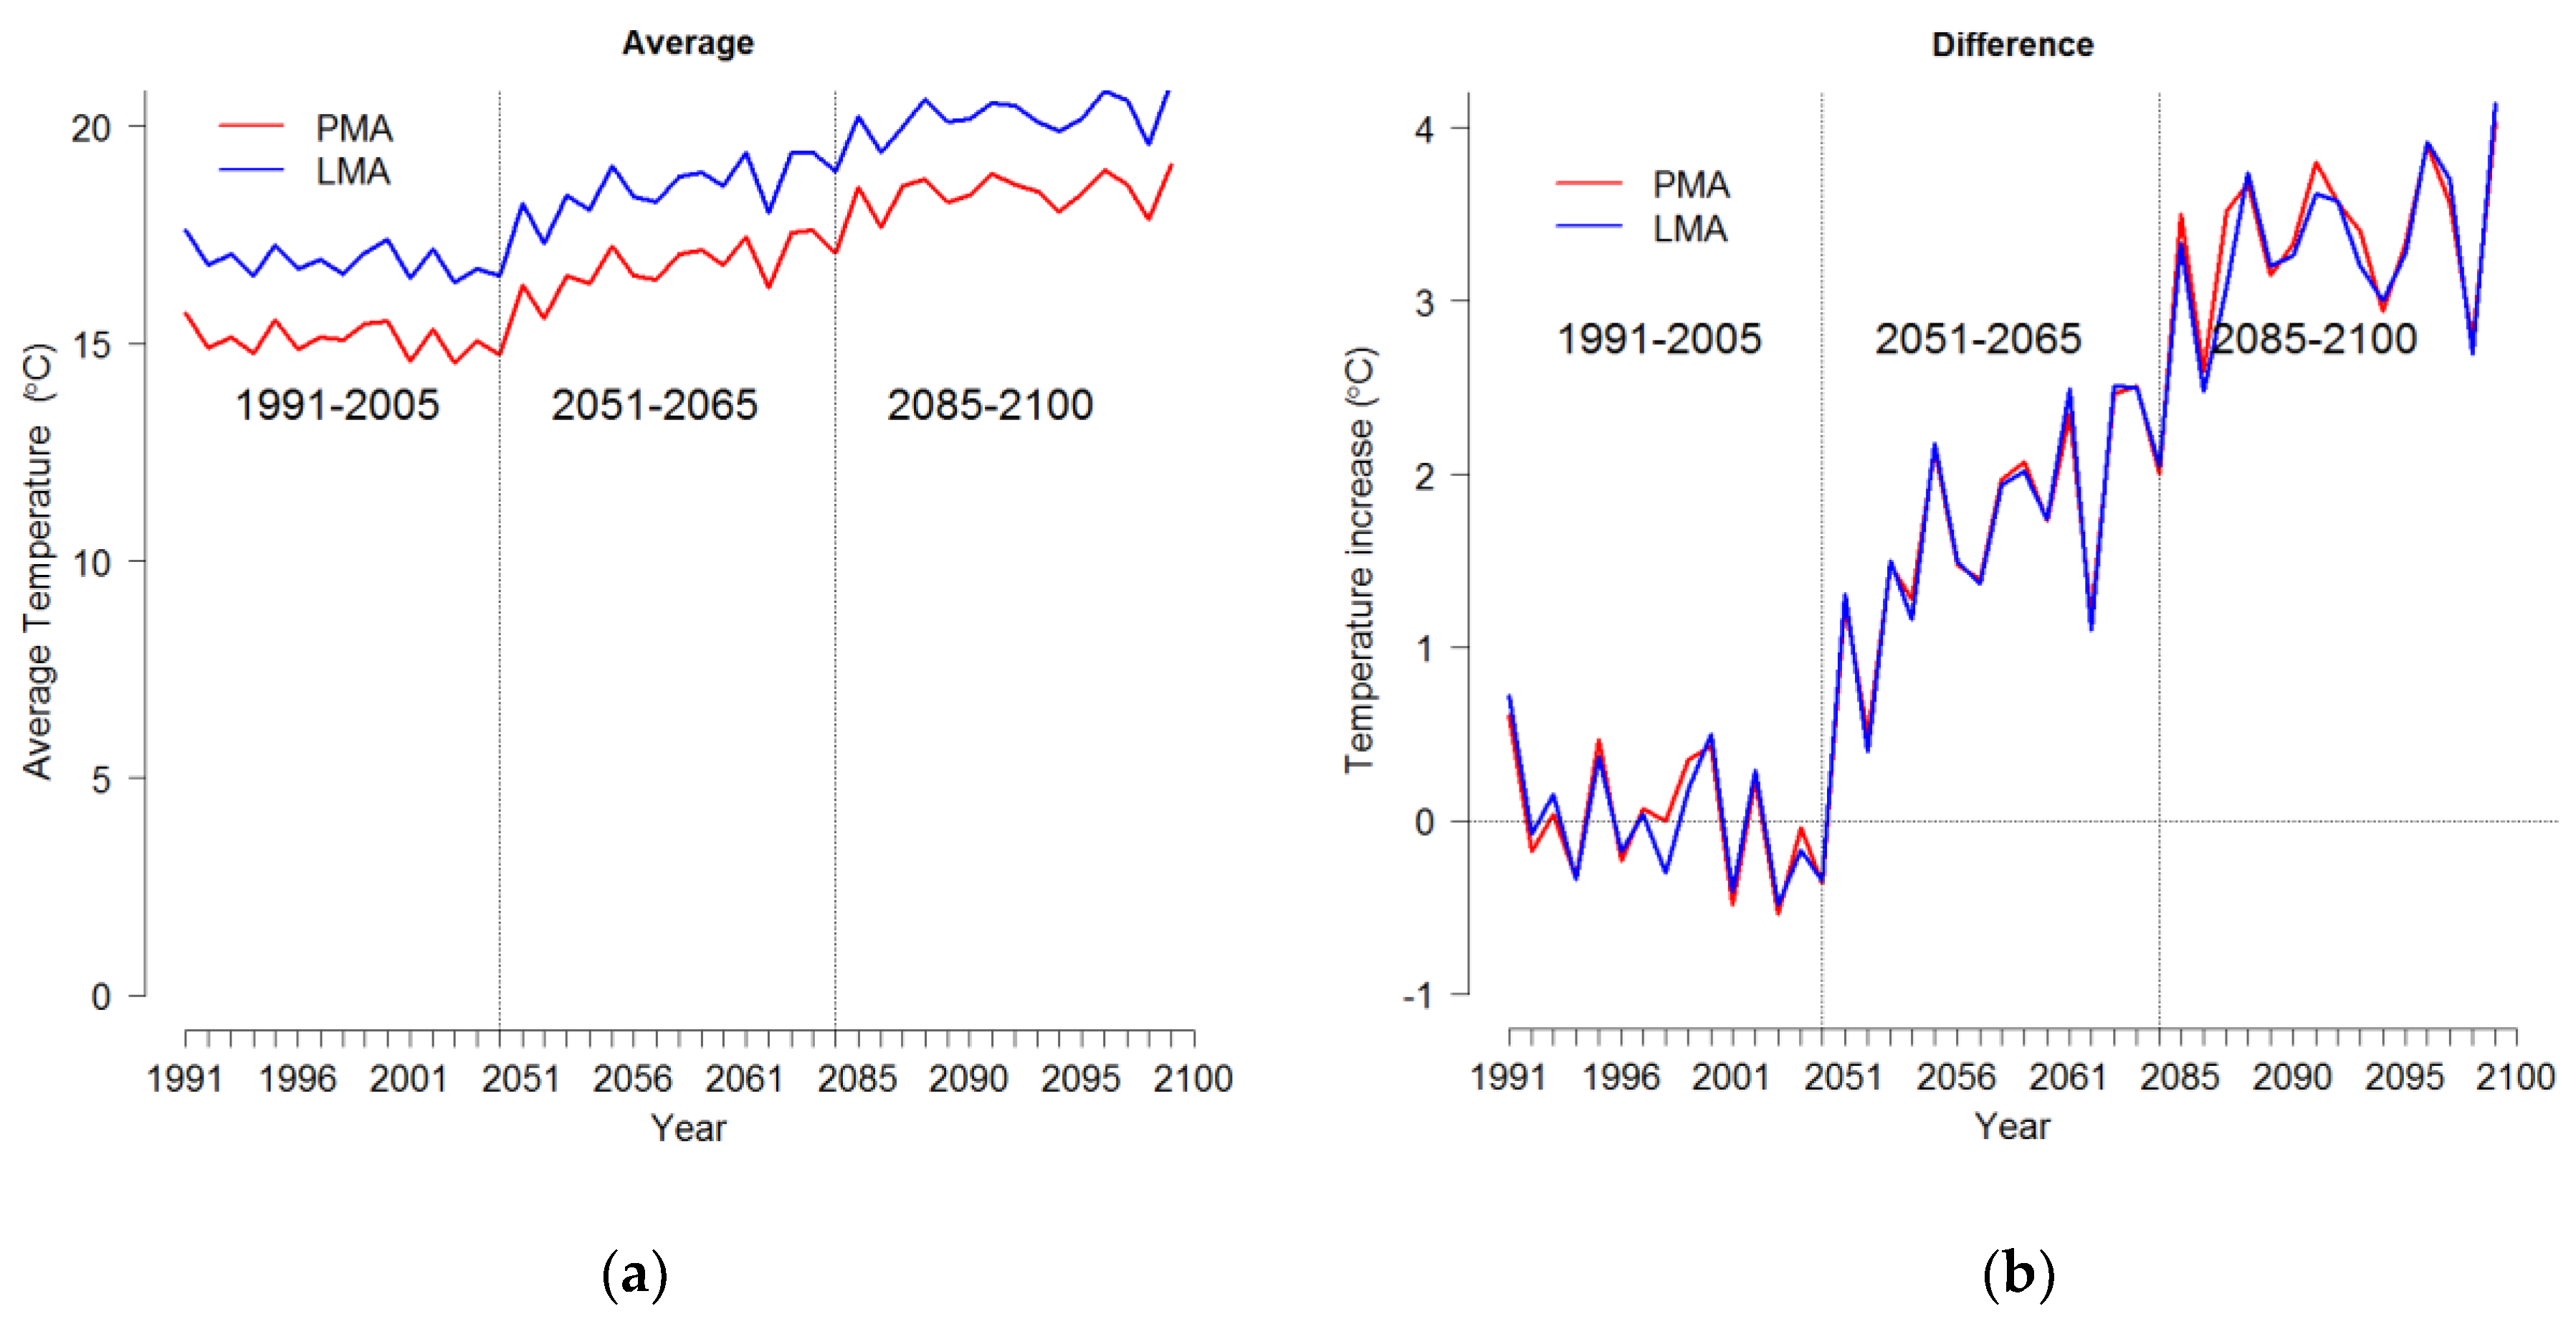
2.2. Temperature Projections

In this study, the simulations were performed using the Weather Research and Forecast–Advanced Research weather (WRF) model v3.5 [57] to dynamically downscale climate simulations from the Max Planck Institute Earth System Model (MPI-ESM-LR) [58], for time periods namely, a recent past climate (1991–2005), a mid-term future climate (2051–2065) and a long-term future climate (2085–2099). The simulations were performed using the RCP8.5 emission scenario [59,60]. The RCP8.5 scenario represents relatively high greenhouse gas emissions, with a radiative forcing reaching 8.5 W.m2 by 2100 [21,61], as detailed in the fifth IPCC report [61]. Systematic biases in daily temperatures were removed by applying the quantile-based mapping bias correction method [62]. This method has already shown to be adequate to be suitable to produce bias corrected high-resolution meteorological information for climate change impact studies [55,63,64]. As reported by Dosio et al. [65], bias correction of climate simulations is deemed necessary for climate impact studies because climate model outputs may present bias when compared with observed data [66]. Previously, the present data were submitted to bias correction to minimize model systematic errors to relative observations [9,55].

2.3. Statistical Approach

2.3.1. Estimation of Temperature-Mortality Association

In this study, mean daily temperature was used to examine the current temperature-mortality association in Porto and Lisbon metropolitan areas. We used distributed lag non-linear models (DLNMs) [1,9,67,68,69,70] assuming a quasi-Poisson distribution. We simultaneously explored the non-linear and delayed effects of temperature, adjusted for long-term temporal trends, day of the week (DOW), and holiday (Hoy).
The model is formulated as follows:
log [ E ( Y i t ) ] = Y t ~ q u a s i P o i s s o n ( μ t )
log ( μ t ) = α + o f f s e t   ( P o p u l a t i o n ) + c b ( T m e a n ) + n s ( t i m e ,   d f = n , y e a r ) + γ D O W + λ H o y
The daily number of deaths on day t is represented by Y t ; α is the intercept; n s is the natural cubic spline to capture long-term trend and seasonality with 3 degrees of freedom per year of study; c b ( T m e a n )   was used to model the non-linear and delayed effect of temperature through a bi-dimensional cross-basis function, described by a natural cubic spline with 4 degrees of freedom (dfs) for the exposure-response association, with four internal knots placed at equal intervals in the temperature range and the log scale of lags without intercept. The maximum lag was set at 30 days [1,9,20]. We accounted for linear effects binary indicator of day of the week (DOW) and holiday (Hoy), where γ and λ represent vector of coefficients of DOW and Hoy, respectively.
Furthermore, we assessed whether the associations varied by seasons (summer: June–September; and winter: December–March) [9] and age group (0–65 years and 65+ years). The heat effects were assessed using the data restricted to the summer months, and extreme hot was defined as the 99th percentile of the mean temperature. Similarly, data restricted to winter months was used to assess the cold effects with extreme cold classified as the first percentile of the mean temperature. Minimum mortality temperatures (MMT) were set as threshold temperatures for hot and cold.
For the model, the exposure-response curves for temperature-mortality associations were presented as log relative risk (logRR) of death for every unit increase/decrease in temperature with reference to the minimum mortality threshold/temperature (MMT). Minimum mortality temperature (MMT) is the temperature at which the mortality risk is at its lowest, and is derived from the prediction of the overall cumulative exposure-response relationship, based on the above-described model. The derivation of MMT is a straightforward scan through the temperature-mortality function to find the temperature value that minimizes the function [71].

2.3.2. Attributable Risk from DLNMs

Estimated temperature-mortality associations, reported as Log Relative Risks (logRR) for the entire exposure lag (30 days), were used to estimate temperature-related mortality. Following Gasparrini et al. [72,73,74] we assumed that the risk at day t is attributable to a series of exposure events in the past up to a maximum of 30 days. We calculated the attributable number deaths associated with temperature for the present year (1991–2005) using the estimated temperature-mortality rate. The backward attributable fraction ( b A F x , t ) and thus the backward attributable number ( b A N x , t ), result from the sum of all contributions in each day, given by the Equations:
b A F x , t = 1 e l = l 0 L β x t l , l
b A N x , t = b A F x , t · n t
where n t is the number of cases at time t.

2.3.3. Projection of Temperature-Mortality Association

First, the projections of future mortality trends were computed as average daily mortality for every year of the current period (1991–2005) to account for seasonal variations of the historical data [68]. These series were now replicated over the future periods. Finally, temperature-related mortality was calculated to estimate the change in mortality rate per million people for mid-term (2046–2065) and long-term (2081–2099) periods in the both metropolitan areas. Data distribution of current and future periods was explored and is presented in figures. Following, Gasparrini et al. [2], we used the exposure-lag-response curves and estimated temperatures thresholds with projections of future temperatures to estimate the change in mortality attributable to temperature per million people for winter and summer seasons, in the future decades (2046–2065 and 2081–2099).
Assuming the temperature-mortality risk is attributable to a series of past exposure, the sum of the contributions from all the previous days of the series is interpreted as the total excess mortality attributed to non-optimal temperature [2]. The expected mortality changes in hot-related, cold-related, and total temperature mortality rates per million people were presented together with the empirical confidence intervals (eCIs) obtained through Monte Carlo simulations.

2.4. Model Assessment and Sensitivity Analysis

The modified Akaike information criteria for models with over-dispersed data, Quasi-AIC [9,73], was used to examine various df for nonlinear and lag functions for mean temperatures. Sensitivity analyses were performed by changing the df (1–16) per year for time, so as to control for seasonality and trends (Table S1).
All analyses were carried out using the package dlnm [74] in R 3.4.2 statistical software (R Core Team 2017).

3. Results

3.1. Descriptive Statistics

During the study period (1991 and 2005), a total of 159,592 and 74,400 deaths were recorded in Lisbon metropolitan area (LMA) and Porto metropolitan area (PMA), respectively. Table 1 presents the descriptive summaries of baseline mortality rates in the study period. The daily mean deaths in LMA and PMA were 29.13 and 13.58, respectively. There were more deaths in the winter months: 67,349 (42.20%) and 30,138 (40.50%) deaths during the study period - than in the summer months: 44,651 (27.98%) and 20,911 (28.11%) in both metropolitan areas. Overall, the number of deaths among people aged 65+ was 138812 and 65062 in LMA and PMA, respectively, which accounts for the biggest proportion in the two metropolitan areas.
During the study period, the daily minimum and maximum mean temperature for LMA were 3.20 °C and 34.00 °C, respectively, and for LMA, and 1.00 °C and 31.50 °C for PMA, respectively (Table 2). The average daily temperature in winter and summer months for LMA was 12.72 °C and 21.81 °C, respectively, and 11.10 °C and 19.48 °C for PMA, respectively.

3.2. Temperature-Mortality Association

Table 3 presents the associated risk (logRR) of temperature-related mortality based on daily temperatures for all months, summer and winter months. Across both metropolitan areas, the relative risk for the first percentile and 99th percentile of mean temperature, for LMA and PMA, which shows an increased with exposure to the 1st percentile in winter months. When exposed to maximum temperature (34.00 °C) in LMA, there were significant cumulative (lag 0–30) heat effects for age group 65+ years (logRR = 2.18, 95% CI: 0.19–4.17) and <65 years (logRR = 1.07, 95% CI: −4.12–6.27). However, heat effects were only significant among people aged 65+ years in PMA (logRR = 1.02, 95% CI: 0.04–1.34). On the other hand, with a minimum temperature of 3.20 °C in LMA, and 1.00 °C in PMA, LMA showed a significant cold effect for the elderly (logRR = 7.14., 95%CI: 4.06–18.42) and PMA showed a significant cold effect for the elderly (logRR = logRR = 4.37, 95%CI: 1.52–16.22).

3.3. Projected Exposure and Health Outcomes

In this study, our main interest is the total number of deaths attributable to temperate change in the absence of other changes. The mortality counts were based on average daily deaths per year of the observed data, thereby keeping the seasonality observed in the historical period–1991–2005. Figure 1 shows the temporal trends in temperature for the historical data (1991–2005) and projected future periods (2051–2065 and 2081–2099). The time series plot indicates an increasing trend in average temperature in both metropolitan areas over the century (Figure 1a).
The temperature in LMA is estimated to increase from a yearly mean of 16.89 °C in 1991–2005 to a yearly mean of 18.61 °C and 20.25 °C in future periods 2051–2065 and 2085–2099, respectively. In the same vein, temperatures in PMA are estimated to rise from 15.09 °C in the current period to 16.81 °C and 18.50 °C in the future periods, respectively. The differences observed in these future temperatures are depicted in the Figure 1b.
The top panel of Figure 2, Figure 3, Figure 4 and Figure 5 display the estimated temperature–mortality relationship for the historical period and the future periods. The exposure-response curve is extrapolated to capture the future temperature projections. There is a general observation that the estimate mortality risk is set to increase with warmer temperatures in the future periods, compared to historical period (Figure 2 and Figure 3). This is clearly observed as the red dash lines increase with warmer temperatures, especially during the summer in the future periods (Figure 4 and Figure 5).
However, the estimated mortality risk decreases in the winter in the future periods (Figure 4 and Figure 5). The distribution of temperature values throughout the historical and future periods is presented in the middle panels of Figure 2, Figure 3, Figure 4 and Figure 5. It is evident that temperatures in both metropolitan areas show a slight difference, with PMA exhibiting lower temperatures than in LMA. In the future periods, it is projected that winter will get warmer (middle panels of Figure 4 and Figure 5) and summer will get hotter (middle panel of Figure 2 and Figure 3).
The estimated burden of temperature-attributable mortality (%) in the historical period (1991–2005) and future periods 2051–2065 and 2085–2099 are presented in Table 4. We estimate a decrease in extreme cold-related deaths of 0.55% and 0.45% in LMA, for 2051–2065 vs. 1991–2005 and 2085–2099 vs. 1991–2005, respectively (Table 4). Similarly, in PMA there is a decrease in cold-related deaths of 0.31% and 0.49% for 2051–2065 and 2085–2099, compared to 1991–2005. LMA is expected to have an overall increase in extreme heat-related deaths of 1.04% and 0.44% in 2051–2065 and 2085–2099, respectively, compared to the historical period (1991–2005). The burden of heat-related mortality (during the summer months) is estimated to increase substantially over the future periods, compared to the current period for all ages, being higher among people 65+ years. For example, in LMA, during the summer months, there is an increase for all ages in extreme heat-related deaths of 1.58% and 0.10% for the two periods, compared to the historical period. The burden of extreme heat-related mortality in the 65+ years age group is slightly higher than in age group <65 years, at 2.22% vs. 1.38% for 2085–2099, compared to the historical period. However, in PMA, only people aged 65+ years showed a significant temperature-related burden of deaths that can be attributable to hot temperatures. The heat-related excess deaths increased from 0.23% for 2051–2065 to 1.37% for 2085–2099, compared to the historical period.

4. Discussion

This study projects the number of deaths attributable to temperature according to diseases of the circulatory system and age group (under 65 years and 65+ years), using future daily temperature simulated by the weather research and forecasting (WRF) model, a distributed lag non-linear model with a quasi-Poisson family. This was conducted for two metropolitan areas in Portugal (Lisbon and Porto).
The results reported in this study indicate that the baseline temperature-mortality relationships for cold and hot temperatures contributed to an increased risk of mortality. However, substantial mortality burdens are visibly attributable to cold temperatures in Lisbon and Porto metropolitan areas, during the historical period. According to recent studies in Portugal [1,9,20,68], winter mortality is higher than summer mortality, especially among people aged 65 years and older with cardiovascular or higher prevalence of individuals with chronic diseases. Various underlying mechanisms have been proposed to explain the mortality risk associated with exposure to high and low temperatures. Previous studies have shown plausible physiological mechanisms for these relationships. Regarding high temperatures, mortality risks may be caused by failure of thermoregulation, which may be impaired by dehydration, salt depletion, increased surface blood circulation, and elevated blood viscosity during the hot season [75,76,77]. Low temperatures increase the risk of thrombogenic complications by inducing well-known and relatively rapid changes in blood composition, such as platelet viscosity, blood cholesterol, and blood pressure [78,79,80,81,82], which may increase the risk of myocardial infarction and stroke [83]. According to other studies, the magnitude of associations varies according to several characteristics, such as population structure, level of education, pre-existing conditions, socioeconomic status, housing conditions, access to health care, nutrition status, race, and ethnicity, which can affect the vulnerability to extreme temperatures [10,11].
Results also revealed that, in future projections, the proportion of burdens attributable to the effects of heat has a higher order of magnitude than for the cold. A decrease is estimated in extreme cold-related deaths of 0.55% and 0.45% in LMA for 2051–2065 and 2085–2099, respectively. In PMA, there is a decrease in cold-related deaths of 0.31% and 0.49% for 2051–2065 and 2085–2099, respectively. Our findings agree with previous studies estimating the magnitude of temperature effects on mortality. Gasparrini et al. [2] analyzed the impact of extreme temperatures under different climate change scenarios over a long-time horizon, 2090–2099, having concluded that southern European regions are going to experience an increase in hot-related mortality as well as a clear decrease in cold-wave-related mortality. For example, a study by Hajat et al. [84], based on modeled daily temperature projections for the whole of the UK, estimated an increase in annual heat-related deaths over the 2020s–2050s and 2050s–2080s, and corresponding decreases in cold-related deaths. In a study about Canada, Cheng et al. [85] projected that hot-related mortality would more than double by the 2050s and triple by the 2080s, estimating as well that cold-related mortality would decrease by 45–60% by the 2050s and by 60–70% by the 2080s, in four Canadian cities. On the other hand, according to climate change projections by Baccini et al. [86], the highest impact in Europe will be in three Mediterranean cities (Barcelona, Rome, and Valencia) and in two continental cities (Paris and Budapest), due to high summer temperatures. This study also estimates that, in terms of age, the highest impact will be in people aged 75 years and older. However, in some cities, a relatively high rate of hot-related deaths is estimated in young adults.
Southern Europe and the Iberian Peninsula are pointed out as one of the European regions most likely to be affected by climate change, facing a diversity of potential impacts such as more frequent heat-related events, which are expected to increase over the next decade in terms of intensity, magnitude, and spatial extent [21]. Increases in morbidity and mortality are therefore expected. Understanding the possible magnitude of future adaptation needs could facilitate identifying interventions to increase population health resilience in a future climate [22,87]. For that reason, adaptation measures will need to be developed, particularly in metropolitan areas, in order to quantify and explain excess deaths related to high temperatures in an increasingly older population. Even though Lisbon and Porto are cities with frequent heatwave events, older people and children are still not acclimatized to extreme heat, which increases temperature-related mortality. These measures could consist of identifying disease thresholds; interfacing with emergency preparedness; reinforcing population monitoring processes, particularly of the most vulnerable people; reinforcing alert systems for cold weather and heatwave plans; improving the knowledge on local vulnerabilities; and including projections of climate change health impacts under different climates so as to identify impacts on mortality of all magnitudes and formulate public health policies. Cities are particularly vulnerable to the effects of climate change due to their location, increasing urbanization, infrastructures, as well as social and economic inequalities [88,89,90]. Urban planning is strongly associated with population health, which should be protected today and in the future. At a local level, it is crucial that urban planning addresses climate mitigation and adaptation issues, aiming towards a sustainable development. For example, by creating green spaces for leisure that intersperse grassed open areas with spaces with trees and shading, where aeration is simple, and by improving the thermal behavior of buildings.
Some limitations of this study must be acknowledged. First, we did not take into account the future changes in the demographic structure, which may result in an underestimate of the health impact of climate change. Population trends can be interrelated and may intersect across different susceptibilities, with potential growth in different subgroups with varying sensitivities. Since subpopulations respond to hot differently with respect to mortality risk, any increase in total population density or in the proportion of vulnerable subpopulations may tend to change population characteristics and affect the relative impact of hot in the future [2,91,92]. Second, there is a need to be cautious with the interpretation of the projected temperature-related impact. Our approach to estimate future changes to temperature-related mortality is based on temperature-mortality rates estimated using historical data to model future temperature series. The attributable number of deaths was computed using the historical mortality data averaged over the observed time series. Third, the choice of smoothing functions for the exposure-lag-response relationships are difficult to validate in DLNM. In this study we based our choice on model selection criteria (QAIC). In spite of these limitations, the assumptions made in this study are reasonable in the absence of adequate information and do not reduce the importance of our findings.

5. Conclusions

To conclude, this study showed that, for the future periods (2051–2065 and 2085–2099), projections indicate that winters will be warmer and summers will be hotter. The estimated mortality risk is expected to increase with warmer temperatures in the future periods, compared to the historical period. For all ages, the proportion of burdens attributable to hot effects is much higher than the burden attributable to cold in both metropolitan areas, especially in the future periods. In LMA, the burden of extreme hot-related mortality in age group 65+ years is slightly higher than in age group <65 years, for 2051–2065 and 2085–2099. However, in PMA, only people aged 65+ years showed significant temperature-related burden of deaths that can be attributable to hot temperatures.
Our study provides results which may be beneficial to healthcare providers when developing long-term management plans, contributing as well to the development and implementation of public health policies, strategic initiatives contemplating the future distribution of the health resources necessary to control mortality due to diseases of the circulatory system in Portuguese metropolitan areas. Lastly, further research is required in order to understand vulnerabilities associated with poverty, social isolation, and outdoor workers.

Supplementary Materials

The following are available online at https://www.mdpi.com/2073-4433/11/2/159/s1, Table S1. Model assessment based on degrees of freedom for trend and crossbasis function.

Author Contributions

Conceptualization, M.R., P.S. and A.R.; methodology, M.R., P.S. and A.R. writing—original draft preparation, M.R.; writing—review and editing, M.R., P.S. and A.R. All authors have read and agreed to the published version of the manuscript.

Funding

This study was partially supported by the European Regional Development Funds, through the COMPETE 2020—Operational Programme “Competitiveness and Internationalization,” under Grant POCI-01-0145- FEDER-006891, National Funds through the Portuguese Foundation for Science and Technology (FCT) under Grant UID/GEO/04084/2013; and by CESAM (UID/AMB/50017/2019), to FCT/MCTES through national funds, and the co-funding by the FEDER, within the PT2020 Partnership Agreement and Compete 2020.

Acknowledgments

The authors would like to thank the Portuguese National Statistics Institute – Statistics Portugal for its support with obtaining the health data from this database.

Conflicts of Interest

The authors declare no conflict of interest. The funders had no role in the design of the study; in the collection, analyses, or interpretation of data; in the writing of the manuscript, or in the decision to publish the results. The corresponding author had full access to all the data in the study.

References

  1. Rodrigues, M.; Santana, P.; Rocha, A. Effects of extreme temperatures on cerebrovascular mortality in Lisbon: A distributed lag non-linear model. Int. J. Biometerol. 2019, 63, 549–559. [Google Scholar] [CrossRef] [PubMed]
  2. Gasparrini, A.; Guo, Y.; Sera, F.; Vicedo-Cabrera, A.M.; Huber, V.; Tong, S.; Coelho, M.S.Z.S.; Saldiva, P.H.N.; Lavigne, E.; Correa, P.M.; et al. Projections of temperature-related excess mortality under climate change scenarios. Lancet Planet Health 2017, 19, e360–e367. [Google Scholar] [CrossRef]
  3. Petkova, E.; Horton, R.; Bader, D.; Kinney, P. Projected Heat-Related Mortality in the U.S. Urban Northeast. Int. J. Environ. Res. Public Health 2013, 10, 6734–6747. [Google Scholar] [CrossRef] [PubMed]
  4. Achebak, H.; Devolder, D.; Ballester, J. Trends in temperature-related age-specific and sex-specific mortality from cardiovascular diseases in Spain: A national time-series analysis. Lancet Planet. Health 2019, 3, e297–e306. [Google Scholar] [CrossRef] [Green Version]
  5. Liu, T.; Ren, Z.; Zhang, Y.; Feng, B.; Lin, H.; Xiao, J.; Zeng, W.; Li, X.; Li, Z.; Rutherford, S.; et al. Modification Effects of Population Expansion, Ageing, and Adaptation on Heat-Related Mortality Risks Under Different Climate Change Scenarios in Guangzhou, China. Int. J. Environ. Res. Public Health 2019, 16, 376. [Google Scholar] [CrossRef] [Green Version]
  6. Qiu, H.; Tian, L.; Ho, K.F.; Yu, I.T.; Thach, T.Q.; Wong, C.M. Who is more vulnerable to death from extremely cold temperatures? A case-only approach in Hong Kong with a temperate climate. Int. J. Biometeorol. 2016, 60, 711–717. [Google Scholar]
  7. Li, T.T.; Horton, R.M.; Kinney, P.L. Projections of seasonal patterns in temperature-related deaths for Manhattan, New York. Nat. Clim. Chang. 2013, 3, 717–721. [Google Scholar] [CrossRef] [Green Version]
  8. Green, H.K.; Andrews, N.; Armstrong, B.; Bickler, G.; Pebody, R. Mortality during the 2013 heatwave in England–How did it compare to previous heatwaves? A retrospective observational study. Environ. Res. 2016, 147, 343–349. [Google Scholar] [CrossRef]
  9. Rodrigues, M.; Santana, P.; Rocha, A. Bootstrap approach to validate the performance of models for predicting mortality risk temperature in Portuguese metropolitan areas. Environ. Health 2019, 18, 25. [Google Scholar] [CrossRef] [Green Version]
  10. Benmarhnia, T.; Deguen, S.; Kaufman, J.S.; Smargiassi, A. Vulnerability to heat-related mortality: A systematic review, meta-analysis, and meta-regression analysis. Epidemiology 2015, 26, 781–793. [Google Scholar] [CrossRef]
  11. Marí-Dell’Olmo, M.; Tobías, A.; Gómez-Gutiérrez, A.; Rodríguez-Sanz, M.; de Olalla, P.G.; Camprubí, E.; Gasparrini, A.; Borrell, C. Social inequalities in the association between temperature and mortality in a South European context. Int. J. Public Health 2019, 64, 27–37. [Google Scholar] [CrossRef] [PubMed]
  12. Almeida, S.P.; Casimiro, E.; Calheiros, J. Effects of apparent temperature on daily mortality in Lisbon and Oporto, Portugal. Environ. Health 2010, 9, 12. [Google Scholar] [CrossRef] [PubMed] [Green Version]
  13. Nunes, A.R. General and specified vulnerability to extreme temperatures among older adults. Int. J. Environ. Health Res. 2019, 5, 1–18. [Google Scholar] [CrossRef] [PubMed]
  14. McKee, C. Deaths in Winter: Can Britain Learn: Can Britain learn from Europe? Eur. J. Epidemiol. 1989, 5, 178–182. [Google Scholar] [CrossRef]
  15. Healy, J.D. Excess winter mortality in Europe: A cross country analysis identifying key risk factors. J. Epidemiol. Community Health 2003, 57, 784–789. [Google Scholar] [CrossRef] [Green Version]
  16. Fowler, T.; Southgate, R.J.; Waite, T.; Harrell, R.; Kovats, S.; Bone, A.; Doyle, Y.; Murray, V. Excess winter deaths in Europe: A multi-country descriptive analysis. Eur. J. Pub. Health 2015, 25, 339–345. [Google Scholar] [CrossRef] [Green Version]
  17. Liddell, C.; Morris, C.; Thomson, H.; Guiney, C. Excess winter deaths in 30 European countries 1980–2013: A critical review of methods. J. Public Health 2016, 38, 806–814. [Google Scholar] [CrossRef] [Green Version]
  18. Paget, J.; Spreeuwenberg, P.; Charu, V. Global mortality associated with seasonal influenza epidemics: New burden estimates and predictors from the GLaMOR Project. J. Glob. Health 2019, 9, 020421. [Google Scholar] [CrossRef]
  19. Almendra, R.; Santana, P.; Freire, E.; Vasconcelos, J. Seasonal mortality patterns and regional contrasts in Portugal. Bull. Geogr. Socio-econ Ser. 2016, 32, 7–18. [Google Scholar] [CrossRef] [Green Version]
  20. Antunes, L.; Silva, S.; Marques, J. The effect of extreme cold temperatures on the risk of death in the two major Portuguese cities. Int. J. Biometeorol. 2017, 61, 127–135. [Google Scholar] [CrossRef]
  21. Intergovernmental Panel on Climate Change (IPCC). Climate Change 2013: The Physical Science Basis. Contribution of Working Group I to the Fifth Assessment Report of the Intergovernmental Panel on Climate Change; Cambridge University Press: Cambridge, UK, 2013. [Google Scholar]
  22. World Health Organization—WHO. Quantitative Risk Assessment of the Effects of Climate Change on Selected Causes of Death, 2030s and 2050s; World Health Organization: Geneva, Switzerland, 2014. [Google Scholar]
  23. Woodward, A.; Smith, K.; Campbell-Lendrum, D.; Chadee, D.; Honda, Y.; Liu, Q. Climate change and health: On the latest IPCC report. Lancet 2014, 383, 1185–1189. [Google Scholar] [CrossRef]
  24. Rosenthal, J.K.; Kinney, P.L.; Metzger, K.B. Intra-urban vulnerability to heat-related mortality in New York City, 1997–2006. Health Place 2014, 30, 45–46. [Google Scholar] [CrossRef] [PubMed] [Green Version]
  25. Carter, J.G.; Cavan, G.; Connelly, A.; Guy, S.; Handley, J.; Kazmierczak, A. Climate change and the city: Building capacity for urban adaptation. Prog. Plan. 2015, 95, 1–66. [Google Scholar] [CrossRef]
  26. Balbus, J.M.; Malina, C. Identifying vulnerable subpopulations for climate change health effects in the United States. J. Occup. Environ. Med. 2009, 51, 33–37. [Google Scholar] [CrossRef]
  27. Wilhelmi, O.V.; Hayden, M.H. Connecting people and place: A new framework for reducing urban vulnerability to extreme heat. Environ. Res. Lett. 2010, 5, 014021. [Google Scholar] [CrossRef]
  28. Zanobetti, A.; O’Neill, M.S.; Gronlund, C.J.; Schwartz, J.D. Susceptibility to mortality in weather extremes: Effect modification by personal and small-area characteristics. Epidemiology 2013, 24, 809–819. [Google Scholar] [CrossRef] [Green Version]
  29. Huang, Z.; Lin, H.; Liu, Y. Individual-level and community level effect modifiers of the temperature-mortality relationship in 66 Chinese communities. BMJ Open 2015, 5, e009172. [Google Scholar] [CrossRef] [Green Version]
  30. Kamal-Chaoui, L.; Robert, A. Competitive Cities and Climate Change; OECD Regional Development: Paris, France, 2009. [Google Scholar]
  31. Rafael, S.; Martins, H.; Marta-Almeida, M.; Sá, E.; Coelho, S.; Rocha, A. Quantification and mapping of urban fluxes under climate change: Application of WRF-SUEWS model to Greater Porto area (Portugal). Environ. Res. 2017, 155, 321–344. [Google Scholar] [CrossRef]
  32. Intergovernmental Panel on Climate Change (IPCC). Climate Change 2014: Impacts, Adaptation, and Vulnerability. Part A: Global and Sectoral Aspects; Cambridge University Press: Cambridge, UK, 2014; pp. 1–32. [Google Scholar]
  33. Marengo, J.A.; Rusticucci, M.; Penalba, O.; Renom, M. An intercomparison of observed and simulated extreme rainfall and temperature events during the last half of the twentieth century: Part 2: Historical trends. Clim. Chang. 2010, 98, 509–529. [Google Scholar] [CrossRef] [Green Version]
  34. Meehl, G.A.; Karl, T.; Easterling, D.R.; Changnon, S.; Pielke, R., Jr.; Changnon, D.; Evans, J.; Groisman, P.Y.; Knutson, T.R.; Kunkel, K.E.; et al. An Introduction to Trends in Extreme Weather and Climate Events: Observations, Socioeconomic Impacts, Terrestrial Ecological Impacts, and Model Projections. Bull. Am. Meteorol. Soc. 2000, 81, 413–416. [Google Scholar] [CrossRef] [Green Version]
  35. Easterling, D.R.; Meehl, G.A.; Parmesan, C.; Changnon, S.A.; Karl, T.R.; Mearns, L.O. Climate Extremes: Observations, Modeling, and Impacts. Science 2000, 289, 2068–2074. [Google Scholar] [CrossRef] [PubMed] [Green Version]
  36. Moberg, A.; Jones, P.D. Regional climate model simulations of daily maximum and minimum near-surface temperatures across Europe compared with observed station data 1961–1990. Clim. Dyn. 2004, 23, 695–715. [Google Scholar] [CrossRef]
  37. Alexander, L.V.; Zhang, X.; Peterson, T.C.; Caesar, J.; Gleason, B.; Tank, A.M.G.K.; Haylock, M.; Collins, D.; Trewin, B.; Rahimzadeh, F.; et al. Global observed changes in daily climate extremes of temperature and precipitation. J. Geophys. Res. 2006, 111, D05109. [Google Scholar] [CrossRef] [Green Version]
  38. Sillmann, J.; Kharin, V.V.; Zwiers, F.W.; Zhang, X.; Bronaugh, D. Climate extremes indices in the CMIP5 multimodel ensemble: Part 2. Future climate projections. J. Geophys. Res. Atmos. 2013, 118, 2473–2493. [Google Scholar] [CrossRef]
  39. Beniston, M.; Stephenson, D.B.; Christensen, O.B.; Ferro, C.A.T.; Frei, C.; Goyette, S.; Halsnaes, K.; Holt, T.; Jylhä, K.; Ko, B.; et al. Future extreme events in European climate: An exploration of regional model projections. Clim. Chang. 2007, 81, 71–95. [Google Scholar] [CrossRef] [Green Version]
  40. Tank, A.M.G.K.; Können, G.P. Trends in Indices of Daily Temperature and Precipitation Extremes in Europe, 1946–1999. J. Clim. 2003, 16, 3665–3680. [Google Scholar] [CrossRef]
  41. Sánchez, E.; Gallardo, C.; Gaertner, M.A.; Arribas, A.; Castro, M. Future climate extreme events in the Mediterranean simulated by a regional climate model: A first approach. Glob. Planet. Chang. 2004, 44, 163–180. [Google Scholar] [CrossRef]
  42. Goubanova, K.; Li, L. Extremes in temperature and precipitation around the Mediterranean basin in an ensemble of future climate scenario simulations. Glob. Planet. Chang. 2007, 57, 27–42. [Google Scholar] [CrossRef]
  43. Giorgi, F.; Lionello, P. Climate change projections for the Mediterranean region. Glob. Planet Chang. 2008, 63, 90–104. [Google Scholar] [CrossRef]
  44. Fonseca, D.; Carvalho, M.J.; Marta-Almeida, M.; Melo-Gonçalves, P.; Rocha, A. Recent trends of extreme temperature indices for the Iberian Peninsula. Phys. Chem. Earth 2016, 94, 66–76. [Google Scholar] [CrossRef]
  45. Gasparrini, A.; Armstrong, B. The impact of heat waves on mortality. Epidemiology 2012, 22, 68–73. [Google Scholar] [CrossRef] [Green Version]
  46. D’Ippoliti, D.; Michelozzi, P.; Marino, C.; de’Donato, F.; Menne, B.; Katsouyanni, K.; Kirchmayer, U.; Analitis, A.; Medina-Ramón, M.; Paldy, A.; et al. The impact of heat waves on mortality in 9 European cities: Results from the EuroHEAT project. Environ. Heal. 2010, 9, 37. [Google Scholar] [CrossRef] [PubMed] [Green Version]
  47. Russo, S.; Dosio, A.; Graversen, R.G.; Sillmann, J.; Carrao, H.; Dunbar, M.B.; Singleton, A.; Montagna, P.; Barbola, P.; Vogt, J.V. Magnitude of extreme heat waves in present climate and their projection in a warming world. J. Geophys. Res. Atmos. 2014, 119, 12500–12512. [Google Scholar] [CrossRef] [Green Version]
  48. Meehl, G.A.; Tebaldi, C. More intense, more frequent, and longer lasting heatwaves in the 21st Century. Science 2004, 305, 994–997. [Google Scholar] [CrossRef] [PubMed] [Green Version]
  49. Peterson, T.C.; Heim, R.R.; Hirsch, R.; Kaiser, D.P.; Brooks, H.; Di enbaugh, N.S.; Dole, R.M.; Giovannettone, J.P.; Guirguis, K.; Karl, T.R.; et al. Monitoring and understanding changes in heat waves, cold waves, floods, and droughts in the United States: State of knowledge. Bull. Am. Meteorol. Soc. 2013, 94, 821–834. [Google Scholar] [CrossRef] [Green Version]
  50. Schoetter, R.; Cattiaux, J.; Douville, H. Changes of western European heat wave characteristics projected by the CMIP5 ensemble. Clim. Dyn. 2015, 45, 1601–1616. [Google Scholar] [CrossRef]
  51. Bador, M.; Terray, L.; Boé, J.; Somot, S.; Alias, A.; Gibelin, A.-L.; Dubuisson, B. Future summer mega-heatwave and record-breaking temperatures in a warmer France climate. Environ. Res. Lett. 2017, 12, 074025. [Google Scholar] [CrossRef] [Green Version]
  52. Ouzeau, G.; Soubeyroux, J.-M.; Schneider, M.; Vautard, R.; Planton, S. Heat waves analysis over France in present and future climate: Application of a new method on the EURO-CORDEX ensemble. Clim. Serv. 2016, 4, 1–12. [Google Scholar] [CrossRef] [Green Version]
  53. Lhotka, O.; Kyselý, J.; Plavcová, E. Evaluation of major heat waves’ mechanisms in EURO-CORDEX RCMs over Central Europe. Clim. Dyn. 2018, 50, 4249–4262. [Google Scholar] [CrossRef]
  54. Morabito, M.; Crisci, A.; Messeri, A.; Messeri, G.; Betti, G.; Orlandini, S.; Raschi, A.; Maracchi, G. Increasing Heatwave Hazards in the Southeastern European Union Capitals. Atmosphere 2017, 8, 115. [Google Scholar] [CrossRef] [Green Version]
  55. Pereira, S.C.; Marta-Almeida, M.; Carvalho, A.C.; Rocha, A. Heat wave and cold spell changes in Iberia for a future climate scenario. Int. J. Clim. 2017, 37, 5192–5205. [Google Scholar] [CrossRef] [Green Version]
  56. Viceto, C.; Cardoso Pereira, S.; Rocha, A. Climate Change Projections of Extreme Temperatures for the Iberian Peninsula. Atmosphere 2019, 10, 229. [Google Scholar] [CrossRef] [Green Version]
  57. Skamarock, W.C.; Klemp, J.B.; Dudhia, J.; Gill, D.O.; Barker, D.; Wang, W. A Description of the Advanced Research WRF Version 3. Available online: http://opensky.ucar.edu/islandora/object/technotes:500 (accessed on 28 June 2018).
  58. Giorgetta, M.; Jungclaus, J.; Reick, C.H.; Legutke, S.; Bader, J.; Bottinger, M.; Brovkin, V.; Crueger, T.; Esch, M.; Fieg, K. Climate and carbon cycle changes from 1850 to 2100 in MPI-ESM simulations for the Coupled Model Intercomparison Project phase 5. J. Adv. Model. Earth Syst. 2013, 5, 572–597. [Google Scholar] [CrossRef]
  59. Russo, S.; Sillmann, J.; Fischer, E.M. Top ten European heatwaves since 1950 and their occurrence in the coming decades Environ. Res. Lett. 2015, 10, 124003. [Google Scholar] [CrossRef]
  60. Moss, R.; Babiker, M.; Brinkman, S.; Calvo, E.; Carter, T.; Edmonds, J.; Elgizouli, I.; Emori, S.; Erda, L.; Hibbard, K.; et al. Towards New Scenarios for Analysis of Emissions, Climate Change, Impacts, and Response Strategies; Intergovernmental Panel on Climate Change (IPCC): Noordwijkerhout, The Netherlands, 2007. [Google Scholar]
  61. Van Vuuren, D.P.; Edmonds, J.; Kainuma, M.; Riahi, K.; Thomson, A.; Hibbard, K.; Hurtt, G.C.; Kram, T.; Krey, V.; Lamarque, J.F.; et al. The representative concentration pathways: An overview. Clim. Chang. 2011, 109, 5–31. [Google Scholar] [CrossRef]
  62. Wood, A.W.; Maurer, E.P.; Kumar, A.; Lettenmaier, D.P. Long-range experimental hydrologic forecasting for the eastern United States. J. Geophys. Res. 2002, 107, 4429. [Google Scholar] [CrossRef]
  63. Marta-Almeida, M.; Teixeira, J.C.; Carvalho, M.J.; Melo-Gonçalves, P.; Rocha, A.M. High resolution WRF climatic simulations for the Iberian Peninsula: Model validation. Phys. Chem. Earth 2016, 94, 94–105. [Google Scholar] [CrossRef]
  64. Saurral, R.; Montroull, N.; Camilloni, I. Development of statistically unbiased 21st century hydrology scenarios over La Plata Basin. Int. J. River Basin Manag. 2013, 11, 329–343. [Google Scholar] [CrossRef]
  65. Dosio, A.; Paruolo, P.; Rojas, R. Bias correction of the ENSEMBLES high resolution climate change projections for use by impact models: Analysis of the climate change signal. J. Geophys. Res. Atmos. 2012, 117, 17110. [Google Scholar] [CrossRef] [Green Version]
  66. Barredo, J.I.; Caudullo, G.; Dosio, A. Mediterranean habitat loss under future climate conditions: Assessing impacts on the Natura 2000 protected area network. Appl. Geogr. 2016, 75, 83–92. [Google Scholar] [CrossRef]
  67. Gasparrini, A.; Armstrong, B.; Kenward, M.G. Distributed lag non-linear models. Stat. Med. 2010, 29, 2224–2234. [Google Scholar] [CrossRef] [PubMed] [Green Version]
  68. Rodrigues, M.; Santana, P.; Rocha, A. Projections of Temperature-Attributable Deaths in Portuguese Metropolitan Areas: A Time-Series Modelling Approach. Atmosphere 2019, 10, 735. [Google Scholar] [CrossRef] [Green Version]
  69. Casanueva, A.; Burgstall, A.; Kotlarski, S.; Messeri, A.; Morabito, M.; Flouris, A.D.; Nybo, L.; Spirig, C.; Schwierz, C. Overview of Existing Heat-Health Warning Systems in Europe. Int. J. Environ. Res. Public Health 2019, 16, 2657. [Google Scholar] [CrossRef] [PubMed] [Green Version]
  70. Ravindra, K.; Rattan, P.; Mor, S.; Aggarwal, A. Generalized additive models: Building evidence of air pollution, climate change and human health. Environ. Int. 2019, 132, 104987. [Google Scholar] [CrossRef]
  71. Tobías, A.; Armstrong, B.; Gasparrini, A. Investigating uncertainty in the minimum mortality temperature. Epidemiology 2017, 28, 72–76. [Google Scholar] [CrossRef]
  72. Gasparrini, A.; Leone, M. Attributable risk from distributed lag models. BMC Med. Res. Methodol. 2014, 14, 55. [Google Scholar] [CrossRef] [Green Version]
  73. Gasparrini, A.; Guo, Y.; Hashizume, M.; Lavigne, E.; Zanobetti, A.; Schwartz, A.; Tobias, A.; Tong, S.; Rocklöv, J.; Forsberg, B. Mortality risk attributable to high and low ambient temperature: A multicountry observational study. Lancet 2015, 386, 369–375. [Google Scholar] [CrossRef]
  74. Gasparrini, A. Distributed Lag Linear and Non-Linear Models in R: The Package dlnm. J. Stat. Softw. 2011, 43, 1–20. [Google Scholar] [CrossRef] [Green Version]
  75. Basu, R. High ambient temperature and mortality: A review of epidemiologic studies from 2001 to 2008. Environ. Health 2009, 8, 40–52. [Google Scholar] [CrossRef] [Green Version]
  76. Cheng, H.; Wang, M.; Li, Q.; Yagouti, A.; Lavigne, F.; Forty, R. Assessment of the effect of cold and hot temperatures on mortality in Ontario, Canada: A population-based study. CMAJ Open 2016, 4, 48–58. [Google Scholar] [CrossRef] [Green Version]
  77. Keatinge, W.R.; Coleshaw, S.R.; Easton, J.C. Increased platelet and red cell counts, blood viscosity, and plasma cholesterol levels during heat stress, and mortality from coronary and cerebral thrombosis. Am. J. Med. 1986, 81, 795–800. [Google Scholar] [CrossRef]
  78. Woodhouse, P.R.; Khaw, K.T.; Plummer, M.; Meade, T.W.; Foley, A. Seasonal variations of plasma fibrinogen and factor VII activity in the elderly: Winter infections and death from cardiovascular disease. Lancet 1994, 343, 435–439. [Google Scholar] [CrossRef]
  79. Mercer, J.B. Cold—an underrated risk factor for health. Environ. Res. 2003, 92, 8–13. [Google Scholar] [CrossRef]
  80. Keatinge, W.R.; Coleshaw, S.R.; Cotter, F.; Mattock, M.; Murphy, M.; Chelliah, R. Increases in platelet and red cell counts, blood viscosity, and arterial pressure during mild surface cooling: Factors in mortality from coronary and cerebral thrombosis in winter. Br. Med. J. 1984, 289, 1405–1408. [Google Scholar] [CrossRef] [PubMed] [Green Version]
  81. Keatinge, W.R. Winter mortality and its causes. Int. J. Circumpolar. Health 2002, 61, 292–299. [Google Scholar] [CrossRef]
  82. Neild, P.J. Cold-induced increases in erythrocyte count, plasma cholesterol and plasma fibrinogen of elderly people without a comparable rise in protein C or factor X. Clin. Sci. 1994, 86, 43–48. [Google Scholar] [CrossRef] [Green Version]
  83. Ryti, N.R.I.; Guo, Y.; Jaakkola, J.J.K. Global association of cold spells and adverse health effects: A systematic review and meta-analysis. Environ. Health Perspect. 2016, 124, 12–22. [Google Scholar] [CrossRef]
  84. Hajat, S.; Vardoulakis, S.; Heaviside, C.; Eggen, B. Climate change effects on human health: Projections of temperature-related mortality for the UK during the 2020s, 2050s, and 2080s. J. Epidemiol. Community Health 2014, 68, 641–648. [Google Scholar] [CrossRef] [Green Version]
  85. Cheng, C.S.; Campbell, M.; Li, Q.; Li, G.; Auld, H.; Day, N. Differential and combined impacts of extreme temperatures and air pollution on human mortality in south-central Canada. Part II: Future estimates. Air Qual. Atmos. Health 2009, 1, 223–235. [Google Scholar] [CrossRef] [Green Version]
  86. Baccini, M.; Kosatsky, T.; Analitis, A.; Anderson, R.; D’Ovidio, M.; Menne, B. Impact of heat on mortality in 15 European cities: Attributable deaths under different weather scenarios. J. Epidemiol. Community Health 2011, 65, 64–70. [Google Scholar] [CrossRef]
  87. Åström, C.; Åström, D.O.; Andersson, C.; Ebi, K.L.; Forsberg, B. Vulnerability reduction needed to maintain current burdens of heat-related mortality in a changing climate—magnitude and determinants. Int. J. Environ. Res. Public Health 2017, 14, 741. [Google Scholar] [CrossRef] [PubMed] [Green Version]
  88. Santamouris, M. Recent Progress on Urban Overheating and Heat Island Research. Integrated Assessment of the Energy, Environmental, Vulnerability and Health Impact Synergies with the Global Climate Change. Energy Build. 2019, 207, 109482. [Google Scholar] [CrossRef]
  89. Estrada, F.; Botzen, W.J.W.; Tol, R.S.J. A global economic assessment of city policies to reduce climate change impacts. Nat. Clim. Chang. 2017, 7, 403–406. [Google Scholar] [CrossRef] [Green Version]
  90. Pietrapertosa, F.; Salvia, M.; Hurtado, S.D.G.; d’Alonzo, V.; Church, J.M.; Geneletti, D.; Reckien, D. Urban climate change mitigation and adaptation planning: Are Italian cities ready? Cities 2019, 91, 93–105. [Google Scholar] [CrossRef]
  91. Kinney, P.L.; O’Neill, M.S.; Bell, M.L.; Schwartz, J. Approaches for estimating effects of climate change on heat-related deaths: Challenges and opportunities Environ. Sci. Policy 2008, 11, 87–96. [Google Scholar] [CrossRef]
  92. Knowlton, K.; Lynn, B.; Goldberg, R.A.; Rosenzweig, C.; Hogrefe, C.; Rosenthal, J.K.; Kinney, P.L. Projecting heat-related mortality impacts under a changing climate in the New York City region. Am. J. Public Health 2007, 97, 2028–2034. [Google Scholar] [CrossRef]
Figure 1. Time series plot of temperature in the PMA (Porto metropolitan area) and LMA (Lisbon metropolitan area) for the present/current period, 1991–2005 and future projections 2051–2065 and 2085–2099, (a) Average temperature, (b) Difference in temperature from historical average (1991–2005).
Atmosphere 11 00159 g001
Figure 2. Temperature related mortality and excess mortality for the present and projected future periods in Lisbon metropolitan area (LMA) during the summer period for people aged <65 years (a) and 65+ years (b). Top panel: Exposure-response curve for temperature-mortality cumulative associations (logRR). The solid lines represent the logRR and the gray areas the 95% empirical confidence interval. The dotted vertical line corresponds to reference temperature (MMT) which divides the curve into cold and hot (blue and red lines, respectively). Middle panel: distribution of temperature values for the present period, 1991–2005 (grey area) and future periods, 2051–2065 (green area) and 2085–2099 (darker green area). Bottom panel: distribution of temperature-related excess mortality, expressed as the fraction of additional deaths (%) attributed to non-optimal temperature, compared with the reference temperature.
Atmosphere 11 00159 g002
Figure 3. Temperature related mortality and excess mortality for the present and projected future periods in Porto metropolitan area (PMA) during the summer period for people aged <65 years (a) and 65+ years (b). Top panel: Exposure-response curve for temperature-mortality cumulative associations (logRR). The solid lines represent the logRR and the gray areas the 95% empirical confidence interval. The dotted vertical line corresponds to the reference temperature (MMT) which divides the curve into cold and hot (blue and red lines, respectively). Middle panel: distribution of the temperature values for the present period, 1991–2005 (grey area), and future periods, 2051–2065 (green area) and 2085–2099 (darker green area). Bottom panel: distribution of temperature-related excess mortality, expressed as the fraction of additional deaths (%) attributed to non-optimal temperature compared with the reference temperature.
Atmosphere 11 00159 g003
Figure 4. Temperature related mortality and excess mortality for the present and projected future periods in Lisbon metropolitan area (LMA) during the winter period for people aged <65 years (a) and 65+ years (b). Top panel: Exposure-response curve for temperature-mortality cumulative associations (logRR). The solid lines represent the logRR and the gray areas the 95% empirical confidence interval. The dotted vertical line corresponds to reference temperature (MMT) which divides the curve into cold and hot (blue and red lines, respectively). Middle panel: distribution of the temperature values for the present period, 1991–2005 (grey area), and future periods, 2051–2065 (green area) and 2085–2099 (darker green area). Bottom panel: distribution of temperature-related excess mortality, expressed as the fraction of additional deaths (%) attributed to non-optimal temperature compared with the reference temperature.
Atmosphere 11 00159 g004
Figure 5. Temperature related mortality and excess mortality for the present and projected future periods in Porto metropolitan area (PMA) during the winter period for people aged <65 years (a) and 65+ years (b). Top panel: Exposure-response curve for temperature-mortality cumulative associations (logRR). The solid lines represent the logRR and the gray area the 95% empirical confidence interval. The dotted vertical line corresponds to reference temperature (MMT) which divides the curve into cold and hot (blue and red lines, respectively). Middle panel: distribution of the temperature values for the present period, 1991–2005 (grey area) and future periods, 2051–2065 (green area) and 2085–2099 (darker green area). Bottom panel: distribution of temperature-related excess mortality, expressed as the fraction of additional deaths (%) attributed to non-optimal temperature compared with the reference temperature.
Atmosphere 11 00159 g005
Table 1. Descriptive statistics of daily mortality in Lisbon metropolitan area (LMA) and Porto metropolitan area (PMA), 1991–2005.
Metropolitan Area/AgeSeasonMean ± SDMin. PercentilesMax.
P25P50P75
All ages
LMATotal29.13 ± 8.548.023283488
Summer24.36 ± 6.298.020242888
Winter35.32 ± 8.791129354171
PMATotal13.58 ± 4.753.010131636
Summer11.41 ± 3.593.09.0111427
Winter16.57 ± 5.013.013162036
Age < 65 years
LMATotal3.79 ± 2.110.02.04.05.014
Summer3.43 ± 1.950.02.03.05.011
Winter4.34 ± 2.380.03.04.06.014
PMATotal1.70 ± 1.410.01.01.03.010
Summer1.51 ± 1.290.01.01.02.07
Winter1.98 ± 1.540.01.02.03.010
Age 65+ years
LMATotal25.34 ± 7.847.020243078
Summer20.96 ± 5.737.017212478
Winter31.70 ± 7.651326313665
PMATotal11.87 ± 4.351.09.0111433
Summer9.90 ± 3.331.08.0101223
Winter14.62 ± 4.622.011141833
Table 2. Descriptive statistics for the mean daily temperatures in Lisbon metropolitan area (LMA) and Porto metropolitan area (PMA), 1991–2005.
Metropolitan AreaSeasonMeanSDMin.PercentilesMax.
P1P2.5P97.5P99
LMATotal16.904.803.2010.8013.3026.5128.2034.00
Summer21.812.8616.1018.5019.6028.6029.7734.00
Winter12.723.423.208.8010.6021.6023.3930.20
PMATotal15.094.421.009.4011.8024.0026.5031.50
Summer19.482.8412.9016.3017.6026.8028.2731.50
Winter11.102.641.007.609.2015.8016.6018.40
Table 3. Metropolitan areas (MA)–specific relative risk (RR) of mortality due to hot and cold effects, logRR (95%CI), for the period 1991–2005.
MA/AgesSummer Temperature
(99%)
logRR95% CIWinter Temperature
(1%)
logRR95% CI
LowHighLowHigh
All ages
Lisbon
29.770.09−0.020.195.800.64−0.231.52
Porto28.270.14−0.771.055.201.51−1.104.13
Age < 65 years
Lisbon29.770.200.000.605.800.32−2.091.64
Porto28.270.800.011.595.201.45−1.304.22
Age 65+ years
Lisbon29.770.05−0.040.155.800.72−0.211.64
Porto28.270.14−0.841.125.202.17−1.295.65
Summer Temperature
(Maximum)
logRR95% CIWinter Temperature
(Minimum)
logRR95% CI
LowHighLowHigh
All ages
Lisbon
34.002.030.153.933.205.341.968.92
Porto31.501.060.422.141.001.65−0.704.01
Age < 65 years
Lisbon34.001.07−4.126.273.204.470.748.21
Porto31.500.03−9.099.141.001.77−1.543.1
Age 65+ years
Lisbon34.002.180.194.173.207.144.0618.42
Porto31.501.020.041.341.004.371.5216.22
Bold face represents statistically significant risk.
Table 4. Changes in temperature-attributable mortality (%) in the future periods (2051–2065 and 2085–2099) vs. 1991–2005, with their 95% empirical confidence interval.
Metropolitan Area/AgePeriodExtreme ColdExtreme Heat
LMA
All ages
All year2051–2065−0.55 ( −0.71 to −0.40)1.04 (0.55 to 1.47)
2085–2099−0.45 (−0.57 to −0.33)0.44 (0.19 to 0.67)
Summer 12051–2065 1.58 (0.75 to 1.90)
2085–2099 0.10 (0.04 to 0.14)
Winter 22051–2065−0.67 (−1.19 to 0.59)
2085–20990.79 (−1.39 to 0.69)
<65 years
Summer 12051–2065 0.08 (0.11 to 0.21)
2085–2099 1.38 (1.67 to 2.37)
Winter 22051–2065−1.15 (−3.11 to 49.01)
2085–2099−1.39 (−3.76 to 53.11)
65+ years
Summer 12051–2065 0.10 (0.00 to 0.18)
2085–2099 2.22 (0.11 to 1.82)
Winter 22051–2065−1.41 (−2.53 to 1.50)
2085–2099−1.67 (−3.05 to 1.10)
PMA
All ages
All year2051–2065−0.49 (−1.00 to 0.05)0.39 (−0.14 to 0.88)
2085–2099−0.31 (−0.57 to −0.01)0.14 (−0.10 to 0.37)
Summer 12051–2065 0.08 (−0.24 to 0.21)
2085–2099 0.57 (−1.10 to 1.15)
Winter 22051–2065−1.13 (−1.47 to 3.49)
2085–2099−1.34 (−1.74 to 4.16)
<65 years
Summer 12051–2065 0.06 (−0.35 to 0.20)
2085–2099 0.39 (−2.01 to 1.12)
Winter 22051–2065−0.28 (−0.58 to 0.96)
2085–2099−0.32 (−0.68 to 0.85)
65+ years
Summer 12051–2065 0.23 (0.05 to 0.28)
2085–2099 1.37 (0.41 to 1.52)
Winter22051–2065−1.35 (−1.51 to 17.84)
2085–2099−1.58 (−1.75 to 17.79)
1 Extreme heat above 99th percent. 2 Extreme cold less than 1st percentile. Bold face represents statistically significant risk.

