Article

Carbonaceous Aerosols in PM1, PM2.5, and PM10 Size Fractions over the Lanzhou City, Northwest China

1
State Key Laboratory of Cryospheric Sciences, Northwest Institute of Eco-Environment and Resources, Tianshan Glaciological Station, Chinese Academy of Sciences, Lanzhou 730000, China
2
College of Geography and Environmental Science, Northwest Normal University, Lanzhou 730000, China
3
College of Sciences, Shihezi University, Shihezi 832000, China
4
Key Laboratory of Western China’s Environmental Systems (Ministry of Education), College of Earth and Environmental Sciences, Lanzhou University, Lanzhou 730000, China
5
Beacon Science & Consulting, Doncaster East, VIC 3109, Australia
*
Author to whom correspondence should be addressed.
Atmosphere 2020, 11(12), 1368; https://doi.org/10.3390/atmos11121368
Submission received: 25 October 2020 / Revised: 10 December 2020 / Accepted: 15 December 2020 / Published: 17 December 2020
(This article belongs to the Special Issue Chemistry of Aqueous Surfaces in the Atmospheric Context)

Abstract

:
Carbonaceous particles have been confirmed as major components of ambient aerosols in urban environments and are related to climate impacts and environmental and health effects. In this study, we collected different-size particulate matter (PM) samples (PM1, PM2.5, and PM10) at an urban site in Lanzhou, northwest China, during three discontinuous one-month periods (January, April, and July) of 2019. We measured the concentrations and potential transport pathways of carbonaceous aerosols in PM1, PM2.5, and PM10 size fractions. The average concentrations of OC (organic carbon) and EC (elemental carbon) in PM1, PM2.5, and PM10 were 6.98 ± 3.71 and 2.11 ± 1.34 μg/m3, 8.6 ± 5.09 and 2.55 ± 1.44 μg/m3, and 11.6 ± 5.72 and 4.01 ± 1.72 μg/m3. The OC and EC concentrations in PM1, PM2.5, and PM10 had similar seasonal trends, with higher values in winter due to the favorable meteorology for accumulating pollutants and urban-increased emissions from heating. Precipitation played a key role in scavenge pollutants, resulting in lower OC and EC concentrations in summer. The OC/EC ratios and principal component analysis (PCA) showed that the dominant pollution sources of carbon components in the PMs in Lanzhou were biomass burning, coal combustion, and diesel and gasoline vehicle emissions; and the backward trajectory and concentration weight trajectory (CWT) analysis further suggested that the primary pollution source of EC in Lanzhou was local fossil fuel combustion.

1. Introduction

Carbonaceous aerosols, including elemental carbon (EC) and organic carbon (OC) [1], have significant effects on human health, the global climate, and visibility reduction [2,3,4]. EC comes from the incomplete combustion of biomass, coal, and fossil fuels, which are major sources of anthropogenic pollutants [5,6]. OC is not only emitted as primary particles but is also secondarily formed by atmospheric chemical reactions and included in the gaseous hydrocarbon precursors. In the atmosphere, carbonaceous aerosols cause atmospheric heating effects and alter cloud formation processes, which could travel far away from their emission sources since their lifetime in the atmosphere varies from several days to weeks [7,8]. Carbonaceous aerosols deposited on ice and snow surfaces can reduce surface albedo by absorbing more solar radiation, accelerate glacier melting, and result in glaciers changing [9,10,11]. Therefore, it is of great significance for us to understand the characteristics of carbonaceous aerosols, including their temporal and spatial distribution and their contribution to air pollutants.
In recent years, with rapid economic growth and industrial development, anthropogenic emissions from industry, transportation, and biomass burning have been soaring, producing a large number of carbonaceous aerosols [12]. Carbonaceous aerosols over China have attracted the attention of scientists, governments, and the public. The regular monitoring sites spread over the urban, rural, and remote areas [13,14,15,16,17]. Some megacities in China, such as Beijing, Tianjin, and some others, have widely carried out investigations on carbonaceous aerosols, insofar as anthropogenic emissions have caused serious air pollution [18,19,20,21,22,23]. Many measurements have been made to characterize carbonaceous aerosols and their contribution to aerosol chemical and optical properties [24,25,26,27,28].
Lanzhou is the capital of the Gansu Province, located in northwest China. This city is the geographic center of mainland China and an important center in Northwest China. With the advancement of the “One Belt, One Road” and “Silk Economic Belt” projects, its role as a transportation and economic hub has become increasingly prominent. Metal smelting, machinery manufacturing, and petrochemical industries are the primary pillars of the economy in Lanzhou. The vulnerable ecosystem, heavy petrochemical industries, and traffic congestion once made Lanzhou one of the most polluted cities in China and even the world [29]. Particulate matter is the dominant air pollutant in Lanzhou, which may have adverse effects on human health, visibility, and climate change. Studies have investigated air pollution in Lanzhou, focusing on the concentrations and chemical components of PM10 (atmospheric dynamic equivalent diameter ≤ 10 μm), PM2.5 (atmospheric dynamic equivalent diameter ≤ 2.5 μm), and PM1 (atmospheric dynamic equivalent diameter ≤1 μm) [30,31,32,33]. Tan et al. [32] suggested that coal combustion was the largest contributor to PM2.5 in Lanzhou. However, the characteristics of carbonaceous aerosols in PM1, PM2.5 and PM10 size fractions and the source apportionment of the pollutants over Lanzhou is still unclear.
Our aims here are (1) to characterize the seasonal variations and size distributions of EC, OC, and the OC/EC ratio, (2) to analyze the relationship between OC and EC and estimate the secondary organic carbon (SOC), and (3) to track the source of carbonaceous aerosols in Lanzhou City. The results would help one not only to understand the characteristics of air pollution in Northwestern China but also to propose more effective local air pollution control measures.

2. Experimental Site and Methodology

2.1. Sampling Site and Sample Collection

Airborne particles in PM1, PM2.5, and PM10 size fractions were collected at the Northwest Institute of Eco-Environment and Resources (NIEER) (103.86° E, 36.05° N), Chinese Academy of Sciences (CAS), located in the Chengguan District of Lanzhou (Figure 1). The sampling site was affected by mixed emission sources, such as local motor vehicle emissions, coal combustion, road dust, industrial activities, cooking, and transport pollutants. Lanzhou is in the upper reaches of the Yellow River and is a typical valley city in a semi-arid area. Since Lanzhou is located in a narrow valley of the Yellow River surrounded by mountains, the geographic feature around Lanzhou also leads to its special meteorological conditions, calm winds, and stable boundary layer.
Three air samplers (Model TH150-F, Wuhan Tianhong Ltd., Wuhan, China) were used to collect PM1, PM2.5, and PM10 samples on 91-mm quartz membrane filters at an airflow rate of 100 L min−1. Before the sampling campaign, we calibrated the flow rate and air volume of the samplers. The samplers keep working for 22 h from 21:00 (precedent day) to 19:00 (succedent day) for every single sample. The sampling fell into three discontinuous periods in 2019, which were 1–31 January (representative of winter), 1–30 April (spring), and 1–31 July (summer), respectively. Before the sampling, we put all filters in the furnace and heated them at 450 °C for 4 h to exclude any possible contaminations of the filters. The samples were then equilibrated for 24 h at a stable temperature of 20 °C and relative humidity (RH) of 38%.
All the filters for sampling were weighed by a microbalance (Liang You FA2104, accuracy: 0.1 mg) before and after sampling. The collected filters with samples were stored in a freezer at −18 °C before the analysis. By exposing the samplers without drawing air, six field-blank filters were collected to determine the filters’ background during the sampling process. Detailed records of the instrumental conditions were collected during the sampling, including the sampling time, the sampled air volume, atmospheric pressure, and air temperature.

2.2. OC and EC Analysis

A thermal optical analyzer (Sunset® Lab Model 4L NDIR) was used to measure the OC and EC content in the filters following the Interagency Monitoring of Protected Visual Environments (IMPROVE) thermal-optical reflectance protocol [34,35,36]. A 1-cm2 sample punch punched from the filter was submitted to the instrument. The OC in the sample chip was gradually heated in a nonoxidizing helium (He) atmosphere stepwise at 120, 250, 450, and 550 °C, and the EC was heated in an oxidizing atmosphere of 98% He and 2% oxygen at 550, 700, and 800 °C. During the calibration process, we calibrated the instrument five times with sucrose solution as the standard, and the error between the actual measured value and the theoretical value was less than 5%. Field blanks were used to quantify detection limits. The detection limits of OC and EC were below 0.2 and 0.1 μg m−3, respectively. Duplicate analyses were performed for every ten samples with uncertainties <10% [12].

2.3. Calculation of SOC

Secondary organic carbon (SOC) can be estimated using the EC tracer method [37]. The estimation of SOC follows the formula:
SOC = OC − EC × (OC/EC)min
POC = OC − SOC
where (OC/EC)min is the minimum of the OC/EC ratios of the studied samples, assuming that the sample with the minimum OC/EC has a negligible amount of SOC. (OC/EC)min was calculated for each season separately. It should be noted that the estimated SOC is only an approximate value with uncertainty. The uncertainty is due to the arbitrariness when selecting the ratio of primary organic carbon (POC) to EC, because they are affected by various factors, e.g., meteorology, diurnal and seasonal fluctuations in emissions, and local emission sources.

2.4. HYSPLIT Model and CWT Analysis

To determine the potential long-distance transport of air mass to Lanzhou, we calculated the five-day backward air-mass trajectories using the Hybrid Single-Particle Lagrangian Integrated Trajectory (HYSPLIT) model and the National Centre for Environmental Prediction (NCEP/NCAR) Global Data Assimilation System (GDAS) dataset. In this study, backward trajectories setting the end location at our sampling sites were run for 92 days with heights of 500 m above ground level. We obtained a total of 92 daily trajectories and grouped them into three or five clusters via the built-in clustering tool in the model. The calculated trajectories were then bunched into clusters by the clustering function in this model. We also calculated the median trajectory for each cluster. More details of the cluster analysis are available in Draxler et al. [38].
Concentration weighted trajectory analysis (CWT) is a method for calculating the weighted concentration of trajectories in a potential source area, which assigns the concentration values at the receptor site to the respective backward trajectories [39]. In the CWT method, each grid cell is assigned a weighted concentration by averaging the sample concentrations that have associated trajectories that crossed that grid cell, as follows:
C i j = 1 l = 1 M m i j l l = 1 M C l m i j l
where Cij is the average weight concentration on the grid (i, j), l is the index of the trajectory, M is the total number of trajectories, Cl is the concentration observed on arrival of the trajectory l, and mijl is the time spent on the grid (i, j) by the trajectory l. A high value for Cij implies that air parcels traveling over the grid (i, j) would be, on average, associated with high concentrations at the receptor.

2.5. Measurements of Meteorological Parameters

Meteorological data including the wind direction, wind speed, relative humidity (RH), temperature, and precipitation were obtained from an automatic weather station (AWS). This AWS was mounted at 3 m above the roof of the NIEER building (24 m above ground).

3. Results and Discussion

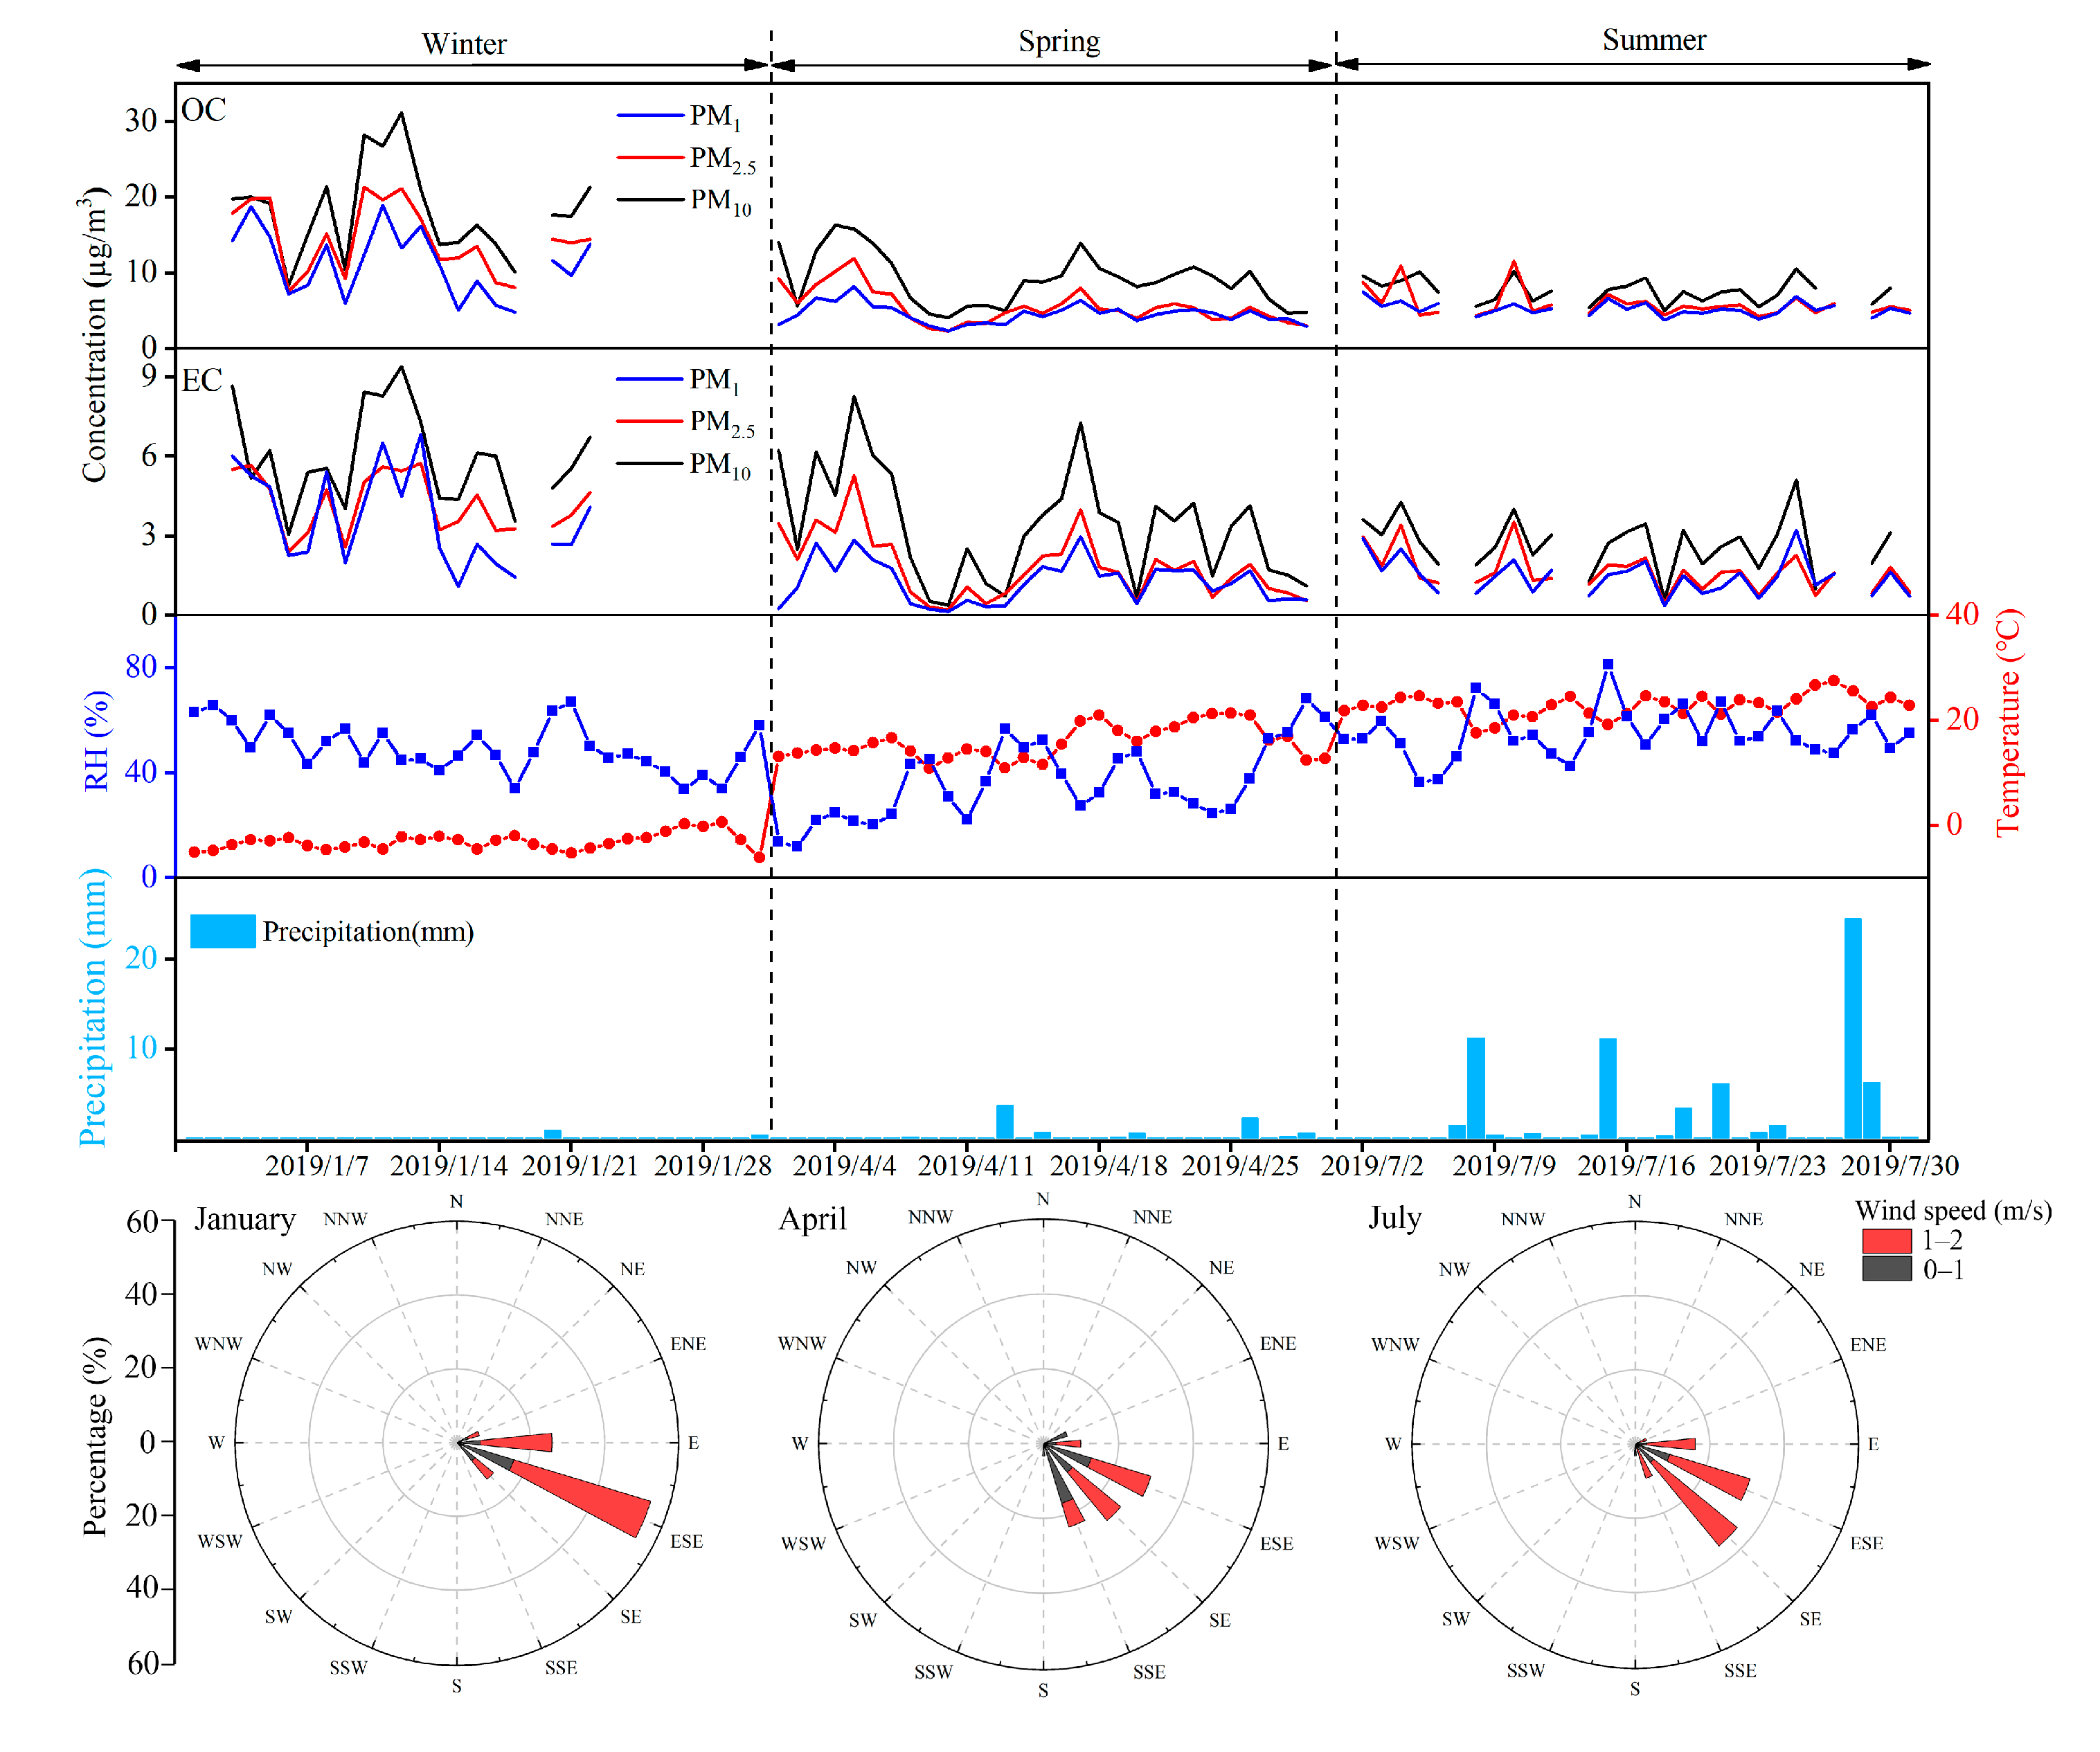
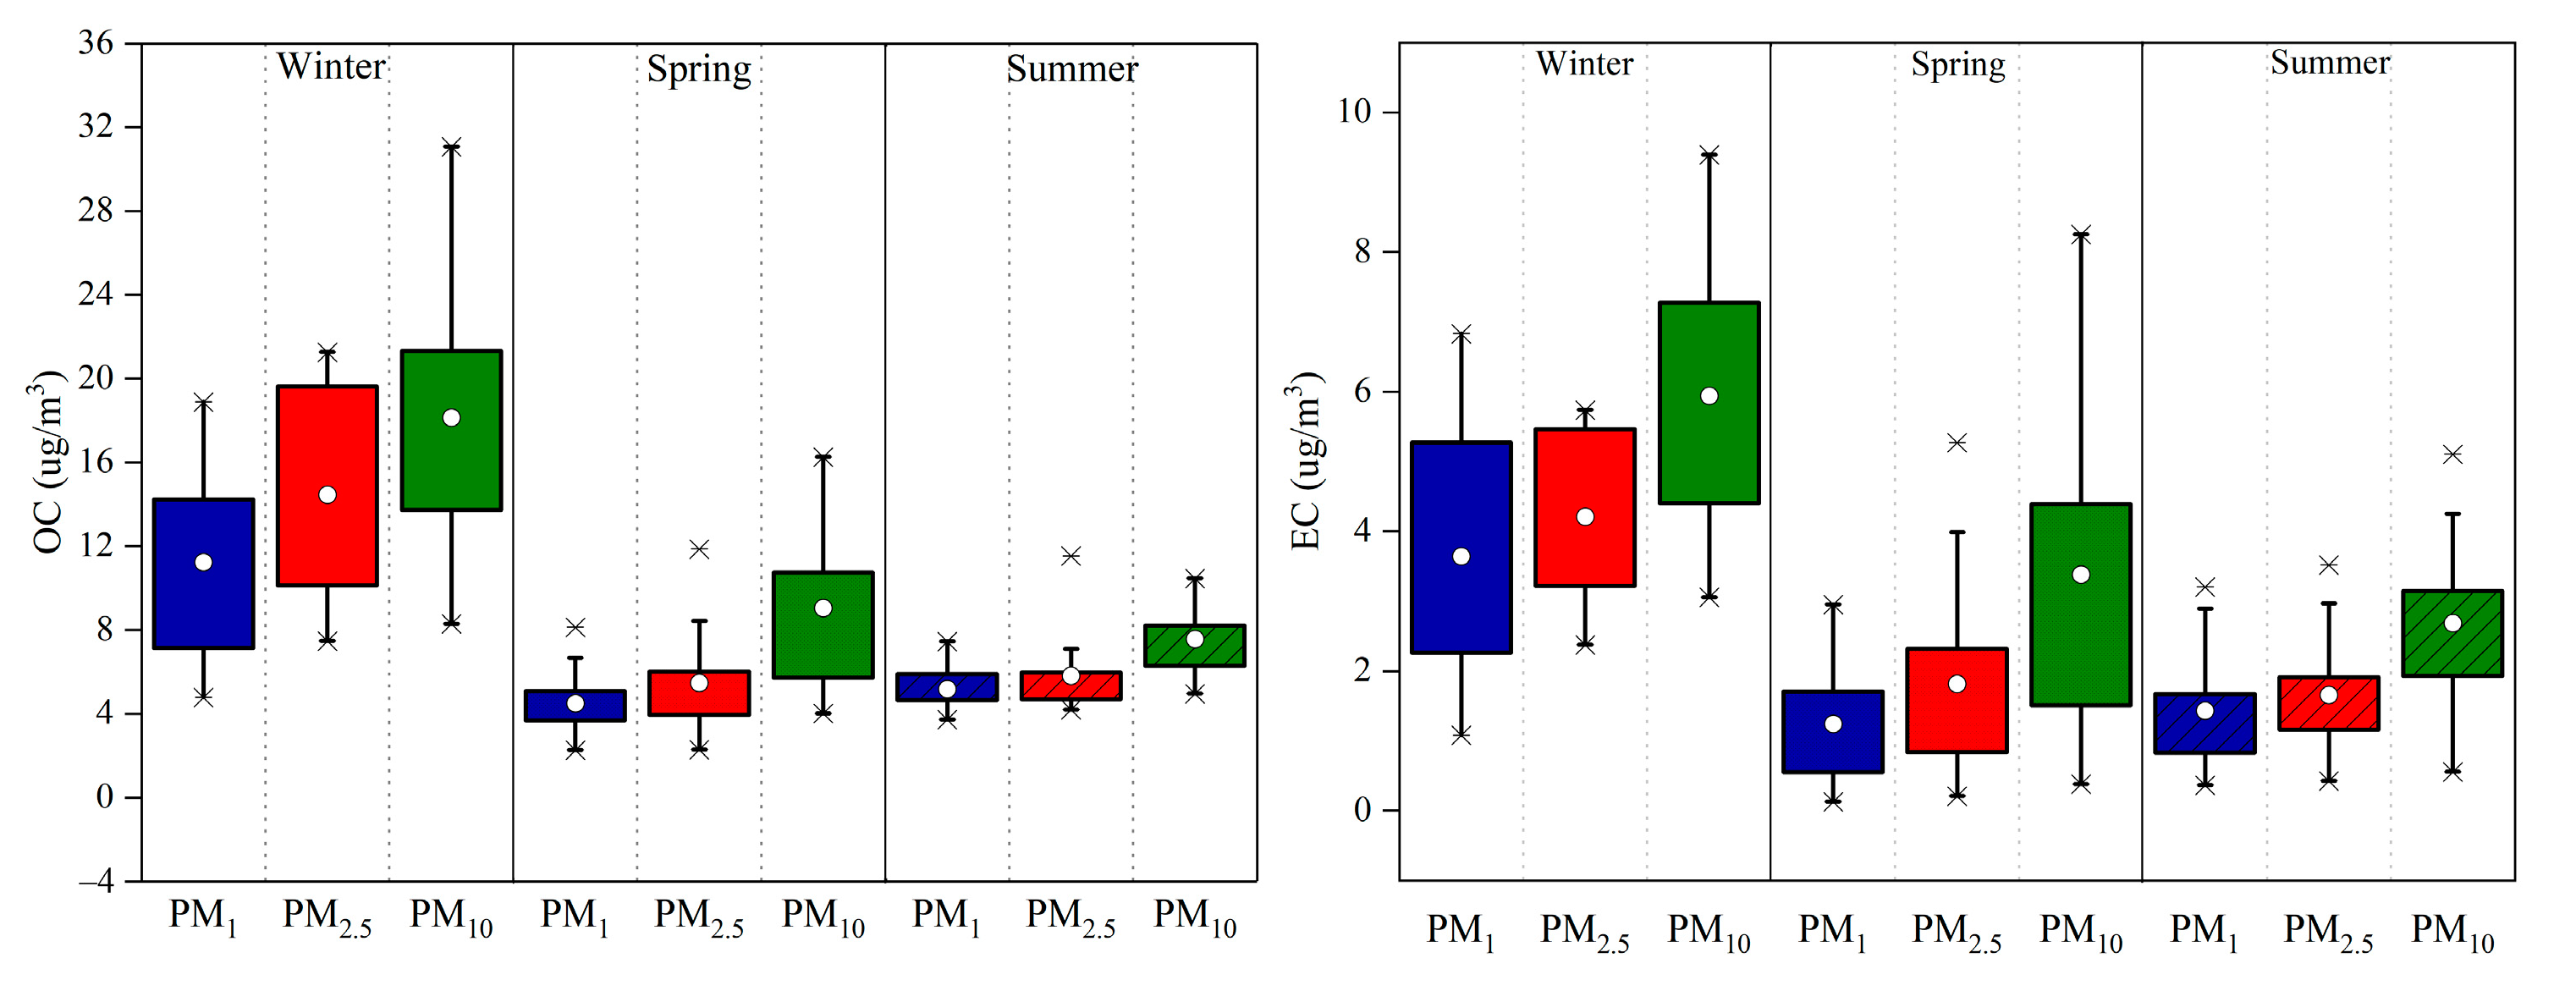
3.1. Temporal Variations of Carbonaceous Aerosols

The average-concentration time series of OC and EC in PM1, PM2.5, and PM10 size fractions of airborne particles in Lanzhou is presented in Table 1. The concentration of OC and EC generally showed an increasing trend with the particle size of the samples. Their average concentrations were 6.98 ± 3.71 and 2.11 ± 1.34 μg/m3 in PM1, 8.6 ± 5.09 and 2.55 ± 1.44 μg/m3 in PM2.5, and 11.6 ± 5.72 and 4.01 ± 1.72 μg/m3 in PM10, respectively. The concentration of OC was generally higher than EC and accounted for a higher proportion of PM. OC/PM1, OC/PM2.5, and OC/PM10 were 8.75%, 10.12%, and 7.35%, respectively. EC/PM1, EC/PM2.5, and EC/PM10 were 2.6%, 3.04%, and 2.5%, respectively. In winter, the proportion of OC/PM and EC/PM was significantly higher than for the other seasons.
The highest daily OC and EC concentrations (31.08 and 9.39 μg/m3) in PM10 were displayed on 12 January 2019, owing to a series of pollution events (Figure 2). For example, the daily averaged PM10 concentration exceeded 150 μg/m3 (Grade II of national ambient air quality standards, GB3095-2012), and the EC concentration in PM10 was higher than 26.7 μg/m3 from January 10 to January 12. Another reason was that the wind speed was very small (0.8 m/s) and the dominant wind direction was ESE, which favored the accumulation of local emissions. However, since precipitation can scavenge pollutants, the OC and EC concentrations on the snowy days (such as January 20) showed lower values. The linear correlation (R2) between humidity and OC was less than 0.1, and the correlation between humidity and OC was also less than 0.1. The correlation between OC and temperature (R2 < 0.55) was better than the correlation between EC and temperature (R2 < 0.46).
As shown in Figure 3, the concentrations of OC and EC in PM1, PM2.5, and PM10 had a similar seasonality, showing higher values in winter and lower values in spring and summer, respectively. The OC concentrations in the PM1, PM2.5, and PM10 samples in Lanzhou in winter ranged from 4.78 to 31.08 µg/m3, with an average of 14.62 ± 5.75 µg/m3, and for EC they ranged from 1.08 to 9.39 µg/m3, averaging 4.6 ± 1.85 µg/m3. The concentrations of OC and EC in the PM1, PM2.5, and PM10 samples in winter were 2.37 and 2.41 times larger than in summer, respectively. This seasonality of OC and EC was mostly due to the favorable meteorology in winter for the accumulation of pollutants and urban-increased emissions from heating. The precipitation in Lanzhou mainly occurred in summer, which played a role in wet scavenging. From July 18 to July 19 in particular, successive precipitation events suppressed the concentration of pollutants, resulting in the lowest OC and EC concentrations during the sampling period. This seasonal pattern is the same as for many cities in China, especially in the north of China [13,24,25,26,27,28].
To better understand the concentration levels of OC and EC in Lanzhou, we compared them with data from other Chinese cities (Table 2). Compared with the previous study in Lanzhou, the concentration of OC and EC in PM2.5 in this study was relatively low due to the different sampling periods, sampling site, and instrument. Compared with other cities, the concentration of OC and EC in PM10 in Lanzhou was higher than that in Lhasa. The concentrations of OC and EC in PM1, PM2.5, and PM10 were lower than in Beijing. The EC concentration in PM2.5 and PM10 was close to Xi’an. In general, the carbonaceous aerosol in Lanzhou is still at a relatively high level, and environmental management needs to be strengthened.

3.2. Variability of OC/EC

The OC/EC ratio is generally controlled by three factors, the characteristics of the emission sources, the transformation of OC to SOC, and the removal of OC and EC. The OC/EC ratio has been reported as being 3.8–13.2 from biomass burning, 2.5–10.5 from coal combustion, and 2.5–5.0 from vehicle exhaust [40,41]. Figure 4 presents the seasonal variation and size distribution of the average OC/EC ratio in Lanzhou. The average OC/EC ratio was 3.78 ± 0.59 during the sampling period, which was close to the typical OC/EC ratio of coal consumption [42], suggesting that Lanzhou was mainly affected by fossil fuel combustion. The average OC/EC ratios in PM10 were relatively lower than those in PM1 and PM2.5, which were 4.15 and 3.84, respectively, also suggesting the primary fossil fuel source of OC and EC.
The OC/EC ratios in the PM1, PM2.5, and PM10 samples showed the same seasonal variations, with higher values in spring (4.23 ± 0.58) than in summer (3.88 ± 0.55) and winter (3.25 ± 0.18) due to intense emissions and a stable boundary layer in spring. In summer, the removal effect of precipitation on water-soluble OC was stronger than for EC, and this could lead to a lower value of OC/EC. Previous studies have indicated that the OC/EC ratio in PM that resulted from biomass burning was substantially higher than those from coal combustion and vehicle exhaust. In this study, the seasonal average OC/EC ratios varied from 3.25 to 4.23 in Lanzhou. This indicates that carbonaceous materials of PM in Lanzhou might be influenced by vehicle exhaust and coal combustion.
OC/EC is an important indicator for judging whether secondary organic pollution occurs. The ratio of OC to EC concentrations can be used to identify the presence of secondary organic aerosols when the OC/EC ratios exceed 2.0 [43,44]. Figure 4 shows that the average value of OC/EC in Lanzhou City was greater than 2.0, indicating that secondary organic aerosols were present.
Figure 4 shows that the daily average concentrations of SOC were 2.19 ± 0.4, 2.38 ± 1.52, and 3.09 ± 1.32 μg/m3 in the PM1, PM2.5, and PM10, accounting for 34.9, 27.5, and 27.1% of the OC, respectively. This indicates that SOC was a major OC component in the PM in Lanzhou, especially in PM1. The daily average concentrations of POC in the study were 4.78 ± 3.33, 6.22 ± 3.64, and 8.51 ± 4.4 μg/m3 in the PM1, PM2.5, and PM10, respectively. The average concentrations of SOC were 2.1, 1.79, and 3.77 μg/m3 in spring, summer, and winter, respectively. Similar to OC and EC, the SOC concentration in winter was higher than in spring and summer, but its proportion in the total organic carbon was lower than that in spring and summer. This is mainly due to secondary pollution not being active in winter. When the temperature is lower than 15 °C, it is difficult to form SOC. The temperature ranged from −5.3 to −2 °C (average of −3.5 °C) during the winter sampling in Lanzhou. Higher ratios of POC/SOC were observed in winter (2.92 ± 0.37) than summer (2.67 ± 1.21) and spring (1.96 ± 0.52), which is the same as for the previous study on Beihuangcheng Island [28]. The estimated POC/SOC ratio was 2.06 in the PM1 samples, 2.79 in PM2.5, and 2.7 in PM10, respectively.
To explore the origin of carbonaceous aerosols in Lanzhou, the relationship between OC and EC was investigated. Figure 5 shows the OC and EC concentrations in PM1, PM2.5, and PM10 during three seasons in Lanzhou. OC and EC exhibited a significant linear correlation (R2 > 0.71, p < 0.01) during the whole sampling time, indicating their strong coemission, especially in PM2.5 (R2 > 0.81), which suggested their close emission sources. The highest correlation coefficient was found for PM2.5 samples in spring (R2 = 0.89), indicating that the sources of OC and EC were closer in spring than for the other seasons. Compared with the other seasons, the intercept in winter was much higher, which may be due to the rich SOC.

3.3. Source of Carbonaceous Aerosols

The dominant sources of man-made emissions of OC and EC in regional atmospheric particulate matter in China are coal combustion, motor vehicle exhaust, and biomass combustion [45]. According to the IMPROVE thermal/optical (TOR) protocol, OC was defined as OC1 + OC2 + OC3 + OC4 + OPC (OPC means pyrolized organic carbon), and EC was considered as EC1 + EC2 + EC3 − OPC [46]. Studies have shown that the different carbon components available through the IMPROVE protocol represent different emission sources [42,47,48]. In this study, we used eight carbon fractions to determine the source apportionment of carbonaceous aerosols in PM1, PM2.5, and PM10 size fractions, OC1 representing a biomass combustion source, OC2, OC3, and OC4 representing coal combustion emission sources, OPC and EC1 representing gasoline vehicle emissions, and EC2 and EC3 representing the emissions of diesel vehicles [20,46,48].
As shown in Figure 6, EC1, OC2, and OPC were the main components of carbon and represented pollution sources from coal, motor vehicle exhaust emissions, and biomass combustion. EC1 contributed 25.3% to TC in spring, 23% in summer, and 33.5% in winter, which indicated that coal combustion was the main emission in winter. OC2 accounted for 17.1% of TC in spring, 18.3% in summer, and 13.5% in winter. OPC constituted 19.6% of TC in spring, 20% in summer, and 22.9% in winter.
To provide a preliminary source characteristic of carbon-containing components in the atmospheric PM in Lanzhou, a principal component analysis (PCA) was used in this study to identify and quantify source contributions for the carbonaceous aerosols in PM. The fundamental principle of PCA is that a strong correlation may exist between components from the same source. It searches for the factors that play a leading role by an analysis of correlation and variance. In this study, PCA was conducted using statistical software (SPSS), and the daily average concentrations of the eight carbonaceous materials in Lanzhou were used for the PCA (Table 3).
In Lanzhou, two principal components were identified. In spring, Factor 1 in PM1, PM2.5, and PM10 was responsible for 70.035, 75.694, and 72.559% of the total variance and had highly positive contributions from OC2, OC3, OC4, EC1, EC2, and OPC, indicating its relation to coal combustion emissions and diesel and gasoline vehicle emissions. In summer, Factor 1 in PM1, PM2.5, and PM10 was responsible for 57.632, 74.199, and 84.037% of the total variance and had highly positive contributions from OC2, OC3, OC4, EC1, EC2, and OPC, indicating its relation to coal combustion emissions and diesel and gasoline vehicle emissions. Factor 2 in PM1, PM2.5, and PM10 was responsible for 17.651, 16.714, and 12.558% of the total variance and was highly correlated to OC1, indicating that Lanzhou City was affected by biomass burning in summer. In winter, Factor 1 in PM1, PM2.5, and PM10 was responsible for 80.997, 65.981, and 73.186% of the total variance and had highly positive contributions from OC1, OC2, OC3, OC4, EC1, EC2, and OPC, indicating its relation to biomass burning, coal combustion emissions, and diesel and gasoline vehicle emissions, while Factor 2 represented the emissions of diesel vehicles. Therefore, the main pollution sources of carbon components in PM in Lanzhou are biomass burning, coal combustion emissions, and diesel and gasoline vehicle emissions, which is the same as for the previous study conducted via PMF analysis in Lanzhou [32].

3.4. Potential Sources

Figure 7a shows that air masses are largely contributed by those from the Inner Mongolia Plateau (T1, 58.1%) passing through Baiyin City in winter, which is more susceptible to long-distance transmission from the Inner Mongolia Plateau due to the Mongolia–Siberian high pressure in winter [49]. Under the influence of pervasive continental cold air masses, the wind blows from the Mongolian Plateau to Lanzhou, the cold air moves southward, and the wind and sand dominate over Lanzhou. Figure 7b shows that there were three possible pathways (T1–T3) for air masses to arrive at the sampling site from their distant sources in spring. The T1 trajectory originated from Central Asia, accounting for 36.7% of the total air mass. This path carried a large amount of sand and dust to the sampling site. The T2 trajectory originated from the Zhungeer Basin in northern Xinjiang and reached the sampling site through the Altai Mountains and the western Inner Mongolia Plateau, accounting for 33.3% of the total air mass. The T3 trajectory originated from the Mongolian Plateau, passing through the Ningxia and accounting for 30% of air masses in spring. In summer, air masses were largely contributed by those from the southeast of Lanzhou (T3, 45.2%), followed by those from the Hexi Corridor passing through the Wuwei City (T5, 19.4%) (Figure 7c). In conclusion, air masses from the Inner Mongolia Plateau, southeast of Lanzhou, Xinjiang, Ningxia, and Hexi Corridor may affect the concentration of pollutants in Lanzhou.
To calculate and analyze the potential source areas and their contributions to the carbonaceous aerosols’ changes with seasons, the concentration-weighted trajectory analysis method (CWT) was used. Figure 8 shows the CWT of EC and OC in PM10 in Lanzhou during the sampling period. In spring, higher CWT values were mainly distributed in the Hexi Corridor and Qinghai–Tibetan Plateau, indicating amounts of air pollutants transported from these polluted areas. In summer, the CWT value was significantly lower than for the other seasons. In winter, higher CWT values appeared around Lanzhou due to the higher EC and OC concentration itself.
A combined trajectory and CWT analysis showed that the air masses originated largely from the Inner Mongolia Plateau and passed through Baiyin City, with higher CWT values in winter. Baiyin City is the largest center for multispecies nonferrous metallurgy in China. Lanzhou is an urban area with heavy pollutant emissions, and studies have found that local emissions have an important impact on the carbonaceous aerosols in Lanzhou [33], such as the Xigu District, which is the petrochemical industrial area in the western part of Lanzhou City. Therefore, the EC and OC concentration in Lanzhou is mainly affected by local fossil fuel combustion.

4. Conclusions

The average concentrations of OC (organic carbon) and EC (elemental carbon) in PM1, PM2.5, and PM10 were 6.98 and 2.11 μg/m3, 8.6 and 2.55 μg/m3, and 11.6 and 4.01 μg/m3, respectively. The OC and EC concentrations in PM1, PM2.5, and PM10 had similar seasonal trends, with higher values in winter due to the favorable meteorology for the accumulation of pollutants and the urban-increased emissions from heating. Precipitation played a key role in scavenge pollutants, resulting in lower OC and EC concentrations in summer. The correlation between OC and temperature was better than the correlation between EC and temperature.
The seasonal average OC/EC ratios varied from 3.25 to 4.23 in Lanzhou, suggesting that carbonaceous materials of PM in Lanzhou might be influenced by vehicle exhaust and coal combustion. The average OC/EC ratios in PM10 had relatively lower OC/EC ratios (3.36) than those in PM1 and PM2.5, with values of 4.15 and 3.84, respectively. The contribution of fossil fuel in PM10 was higher than in PM1 and PM2.5, suggesting that PM10 particles were more coarse and congregated EC lowered the ratio of OC/EC. The SOC concentrations were 2.1, 1.79, and 3.77 μg/m3 in spring, summer, and winter.
OC and EC exhibited a significant linear correlation in PM during the entire sampling time, suggesting similar primary emission sources. The PCA method showed that the main pollution sources of carbon components in PM in Lanzhou were biomass burning, coal combustion emissions, and diesel and gasoline vehicle emissions. The backward trajectory and concentration-weighted trajectory (CWT) showed that the dominant pollution source of EC in Lanzhou was mainly affected by local fossil fuel combustion.

Author Contributions

Data curation, X.Z. (Xi Zhou); formal analysis, X.Z. (Xin Zhang); funding acquisition, Z.L.; investigation, M.S.; methodology, F.W.; software, X.Z. (Xin Zhang); writing—original draft, X.Z. (Xin Zhang); writing—science advising, review, and editing, J.M. All authors have read and agreed to the publihsed version of the manuscript.

Funding

This work was supported by The Second Tibetan Plateau Scientific Expedition and Research (2019QZKK0201), the Strategic Priority Research Program of Chinese Academy of Sciences (Class A) (XDA20060201; XDA20020102), and the National Natural Science Foundation of China (41761134093;41471058) and The SKLCS founding (SKLCS-ZZ−2020).

Acknowledgments

We thank the staff working in the Tianshan Glaciological Station for helping collect data. We also gratefully thank the reviewers for their constructive comments.

Conflicts of Interest

The authors declare no conflict of interest.

References

  1. Petzold, A.; Ogren, J.A.; Fiebig, M.; Laj, P.; Li, S.M.; Baltensperger, U.; Holzer-Popp, T.; Kinne, S.; Pappalardo, G.; Sugimoto, N.; et al. Recommendations for reporting “black carbon” measurements. Atmos. Chem. Phys. 2013, 13, 8365–8379. [Google Scholar] [CrossRef] [Green Version]
  2. Mordukhovich, I.; Wilker, E.; Suh, H.; Wright, R.; Sparrow, D.; Vokonas, P.S.; Schwartz, J. Black carbon exposure, oxidative stress genes, and blood pressure in a repeated-measures study. Environ. Health PERSP 2009, 117, 1767–1772. [Google Scholar] [CrossRef] [PubMed]
  3. Jacobson, M.Z. Short-term effects of controlling fossil-fuel soot, biofuel soot and gases, and methane on climate, Arctic ice, and air pollution health. J. Geophys. Res. 2010, 115, D14. [Google Scholar] [CrossRef]
  4. Khan, M.F.; Latif, M.T.; Saw, W.H.; Amil, N.; Nadzir, M.S.M.; Sahani, M.; Tahir, N.M.; Chung, J.X. Fine particulate matter in the tropical environment: Monsoonal effects, source apportionment, and health risk assessment. Atmos. Chem. Phys. 2016, 16, 597–617. [Google Scholar] [CrossRef] [Green Version]
  5. Ramanathan, V.; Carmichael, G. Global and regional climate changes due to black carbon. Nat. Geosci. 2008, 1, 221–227. [Google Scholar] [CrossRef]
  6. Bond, T.C.; Doherty, S.J.; Fahey, D.W.; Forster, P.M.; Berntsen, T.; DeAngelo, B.J.; Flanner, M.G.; Ghan, S.; Kärcher, B.; Koch, D.; et al. Bounding the role of black carbon in the climate system: A scientific assessment. J. Geophys. Res. Atmos. 2013, 118, 5380–5552. [Google Scholar] [CrossRef]
  7. Chung, S.H. Global distribution and climate forcing of carbonaceous aerosols. J. Geophys. Res. 2002, 107, D19. [Google Scholar] [CrossRef] [Green Version]
  8. Panicker, A.S.; Pandithurai, G.; Safai, P.D.; Dipu, S.; Lee, D.I. On the contribution of black carbon to the composite aerosol radiative forcing over an urban environment. Atmos. Environ. 2010, 44, 3066–3070. [Google Scholar] [CrossRef]
  9. Flanner, M.G.; Zender, C.S.; Randerson, J.T.; Rasch, P.J. Present-day climate forcing and response from black carbon in snow. J. Geophys. Res. 2007, 112, D11. [Google Scholar] [CrossRef] [Green Version]
  10. Ming, J.; Xiao, C.D.; Cachier, H.; Qin, D.H.; Qin, X.; Li, Z.Q.; Pu, J.C. Black carbon (BC) in the snow of glaciers in west China and its potential effects on albedos. Atmos. Res. 2009, 92, 114–123. [Google Scholar] [CrossRef]
  11. Ming, J.; Wang, Y.; Du, Z.; Zhang, T.; Guo, W.; Xiao, C.; Xu, X.; Ding, M.; Zhang, D.; Yang, W. Widespread albedo decreasing and induced melting of Himalayan snow and ice in the early 21st century. PLoS ONE 2015, 10, e0126235. [Google Scholar] [CrossRef] [PubMed] [Green Version]
  12. Wang, Y.; Jia, C.; Tao, J.; Zhang, L.; Liang, X.; Ma, J.; Gao, H.; Huang, T.; Zhang, K. Chemical characterization and source apportionment of PM2.5 in a semi-arid and petrochemical-industrialized city, Northwest China. Sci. Total Environ. 2016, 573, 1031–1040. [Google Scholar] [CrossRef] [PubMed]
  13. Cao, J.J.; Lee, S.C.; Chow, J.C.; Watson, J.G.; Ho, K.F.; Zhang, R.J.; Jin, Z.D.; Shen, Z.X.; Chen, G.C.; Kang, Y.M.; et al. Spatial and seasonal distributions of carbonaceous aerosols over China. J. Geophys. Res. 2007, 112, D22. [Google Scholar] [CrossRef] [Green Version]
  14. Zhao, S.Y.; Ming, J.; Xiao, C.D.; Sun, W.J.; Qin, X. A preliminary study on measurements of black carbon in the atmosphere of northwest Qilian Shan. J. Environ. Sci. 2012, 24, 152–159. [Google Scholar] [CrossRef]
  15. Zhao, S.Y.; Tie, X.X.; Cao, J.J.; Li, N.; Li, G.H.; Zhang, Q.; Zhu, C.S.; Long, X.; Li, J.D.; Feng, T.; et al. Seasonal variation and four-year trend of black carbon in the Mid-west China: The analysis of the ambient measurement and WRF-Chem modeling. Atmos. Environ. 2015, 123, 430–439. [Google Scholar] [CrossRef]
  16. Li, C.L.; Chen, P.F.; Kang, S.C.; Yan, F.P.; Hu, Z.F.; Qu, B.; Sillanpaa, M. Concentrations and light absorption characteristics of carbonaceous aerosol in PM2.5 and PM10 of Lhasa city, the Tibetan Plateau. Atmos. Environ. 2016, 1127, 340–346. [Google Scholar] [CrossRef]
  17. Chen, P.; Kang, S.; Li, C.; Zhang, Q.; Guo, J.; Tripathee, L.; Zhang, Y.; Li, G.; Gul, C.; Cong, Z.; et al. Carbonaceous aerosol characteristics on the Third Pole: A primary study based on the Atmospheric Pollution and Cryospheric Change (APCC) network. Environ. Pollut. 2019, 253, 49–60. [Google Scholar] [CrossRef]
  18. Huang, R.J.; Zhang, Y.; Bozzetti, C.; Ho, K.F.; Cao, J.J.; Han, Y.; Daellenbach, K.R.; Slowik, J.G.; Platt, S.M.; Canonaco, F.; et al. High secondary aerosol contribution to particulate pollution during haze events in China. Nature 2014, 514, 218–222. [Google Scholar] [CrossRef] [Green Version]
  19. Tao, J.; Gao, J.; Zhang, L.; Zhang, R.; Che, H.; Zhang, Z.; Lin, Z.; Jing, J.; Cao, J.; Hsu, S.C. PM2.5 pollution in a megacity of southwest China: Source apportionment and implication. Atmos. Chem. Phys. 2014, 14, 8679–8699. [Google Scholar] [CrossRef] [Green Version]
  20. Wang, G.; Cheng, S.; Li, J.; Lang, J.; Wen, W.; Yang, X.; Tian, L. Source apportionment and seasonal variation of PM2.5 carbonaceous aerosol in the Beijing-Tianjin-Hebei region of China. Environ. Monit. Assess. 2015, 187, 143. [Google Scholar] [CrossRef]
  21. Xiong, Y.; Zhou, J.; Schauer, J.J.; Yu, W.; Hu, Y. Seasonal and spatial differences in source contributions to PM2.5 in Wuhan, China. Sci. Total Environ. 2016, 577, 155–165. [Google Scholar] [CrossRef] [PubMed]
  22. Liu, B.; Wu, J.; Zhang, J.; Wang, L.; Yang, J.; Liang, D.; Dai, Q.; Bi, X.; Feng, Y.; Zhang, Y.; et al. Characterization and source apportionment of PM2.5 based on error estimation from EPA PMF 5.0 model at a medium city in China. Environ. Pollut. 2017, 222, 10–22. [Google Scholar] [CrossRef] [PubMed]
  23. Shao, P.; Tian, H.; Sun, Y.; Liu, H.; Wu, B.; Liu, S.; Liu, X.; Wu, Y.; Liang, W.; Wang, Y.; et al. Characterizing remarkable changes of severe haze events and chemical compositions in multi-size airborne particles (PM1, PM2.5 and PM10) from January 2013 to 2016–2017 winter in Beijing, China. Atmos. Environ. 2018, 189, 133–144. [Google Scholar] [CrossRef]
  24. Zhang, N.; Cao, J.; Liu, S.; Zhao, Z.; Xu, H.; Xiao, S. Chemical composition and sources of PM2.5 and TSP collected at Qinghai Lake during summertime. Atmos. Res. 2014, 138, 213–222. [Google Scholar] [CrossRef]
  25. Huang, X.; Liu, Z.; Liu, J.; Hu, B.; Wen, T.; Tang, G.; Zhang, J.; Wu, F.; Ji, D.; Wang, L.; et al. Chemical characterization and source identification of PM2.5 at multiple sites in the Beijing-Tianjin-Hebei region, China. Atmos. Chem. Phys. 2017, 17, 12941–12962. [Google Scholar] [CrossRef]
  26. Li, L.; Tan, Q.; Zhang, Y.; Feng, M.; Qu, Y.; An, J.; Liu, X. Characteristics and source apportionment of PM2.5 during persistent extreme haze events in Chengdu, southwest China. Environ. Pollut. 2017, 230, 718–729. [Google Scholar] [CrossRef]
  27. Dai, Q.; Bi, X.; Liu, B.; Li, L.; Ding, J.; Song, W.; Bi, S.; Schulze, B.C.; Song, C.; Wu, J.; et al. Chemical nature of PM2.5 and PM10 in Xi’an, China: Insights into primary emissions and secondary particle formation. Environ. Pollut. 2018, 240, 155–166. [Google Scholar] [CrossRef] [PubMed]
  28. Zong, Z.; Wang, X.; Tian, C.; Chen, Y.; Fu, S.; Qu, L.; Ji, L.; Li, J.; Zhang, G. PMF and PSCF based source apportionment of PM2.5 at a regional background site in North China. Atmos. Res. 2018, 203, 207–215. [Google Scholar] [CrossRef] [Green Version]
  29. Chu, P.C.; Chen, Y.; Lu, S.; Li, Z.; Lu, Y. Particulate air pollution in Lanzhou China. Environ. Int. 2008, 34, 698–713. [Google Scholar] [CrossRef] [Green Version]
  30. Qiu, X.; Duan, L.; Gao, J.; Wang, S.; Chai, F.; Hu, J.; Zhang, J.; Yun, Y. Chemical composition and source apportionment of PM10 and PM2.5 in different functional areas of Lanzhou, China. J. Environ. Sci. 2016, 40, 75–83. [Google Scholar] [CrossRef]
  31. Wang, L.; Zhou, X.; Ma, Y.; Cao, Z.; Wu, R.; Wang, W. Carbonaceous aerosols over China—Review of observations, emissions, and climate forcing. Environ. Sci. Pollut. Res. Int. 2016, 23, 1671–1680. [Google Scholar] [CrossRef] [PubMed]
  32. Tan, J.; Zhang, L.; Zhou, X.; Duan, J.; Li, Y.; Hu, J.; He, K. Chemical characteristics and source apportionment of PM2.5 in Lanzhou, China. Sci. Total Environ. 2017, 601, 1743–1752. [Google Scholar] [CrossRef] [PubMed]
  33. Zhao, S.; Yu, Y.; Yin, D.; Yu, Z.; Dong, L.; Mao, Z.; He, J.; Yang, J.; Li, P.; Qin, D. Concentrations, optical and radiative properties of carbonaceous aerosols over urban Lanzhou, a typical valley city: Results from in-situ observations and numerical model. Atmos. Environ. 2019, 213, 470–484. [Google Scholar] [CrossRef]
  34. Chow, J.C.; Watson, J.G.; Pritchett, L.C.; Pierson, W.R.; Frazier, C.A.; Purcell, R.G. The DRI thermal/optical reflectance carbon analysis system: Description, evaluation and applications in U.S. Air quality studies. Atmos. Environ. Part A Gen. Top. 1993, 27, 1185–1201. [Google Scholar] [CrossRef]
  35. Chow, J.C.; Watson, J.G.; Chen, L.-W.; Arnott, W.P.; Moosmüller, H.; Fung, K. Equivalence of Elemental Carbon by Thermal/Optical Reflectance and Transmittance with Different Temperature Protocols. Environ. Sci. Technol. 2004, 38, 4414–4422. [Google Scholar] [CrossRef]
  36. Wu, C.; Ng, W.M.; Huang, J.; Wu, D.; Yu, J.Z. Determination of Elemental and Organic Carbon in PM2.5 in the Pearl River Delta Region: Inter-Instrument (Sunset vs. DRI Model 2001 Thermal/Optical Carbon Analyzer) and Inter-Protocol Comparisons (IMPROVE vs. ACE-Asia Protocol). Aerosol Sci. Technol. 2012, 46, 610–621. [Google Scholar] [CrossRef] [Green Version]
  37. Turpin, B.J.; Huntzicker, J.J. Secondary formation of organic aerosol in the Los Angeles basin: A descriptive analysis of organic and elemental carbon concentrations. Atmos. Environ. Part A Gen. Top. 1991, 25, 207–215. [Google Scholar] [CrossRef]
  38. Draxler, R.R.; Hess, G.D. An Overview of the Hysplit 4 modeling system for trajectories, dispersion and deposition. Aust. Meteorol. Mag. 1998, 47, 295–308. [Google Scholar]
  39. Babu, S.S.; Chaubey, J.P.; Krishna Moorthy, K.; Gogoi, M.M.; Kompalli, S.K.; Sreekanth, V.; Bagare, S.P.; Bhatt, B.C.; Gaur, V.K.; Prabhu, T.P.; et al. High altitude (~4520 m amsl) measurements of black carbon aerosols over western trans-Himalayas: Seasonal heterogeneity and source apportionment. J. Geophys. Res. Atmos. 2011, 116, D24201. [Google Scholar] [CrossRef] [Green Version]
  40. Schauer, J.J.; Kleeman, M.J.; Cass, G.R.; Simoneit, B.R.T. Measurement of emissions from air pollution sources. 5. C-1-C-32 organic compounds from gasolinepowered motor vehicles. Environ. Sci. Technol. 2002, 36, 1169–1180. [Google Scholar] [CrossRef]
  41. Chen, Y.; Zhi, G.; Feng, Y.; Fu, J.; Feng, J.; Sheng, G.; Simoneit, B.R.T. Measurements of emission factors for primary carbonaceous particles from residential raw-coal combustion in China. Geophys. Res. Lett. 2006, 33, 20. [Google Scholar] [CrossRef]
  42. Cao, J.J.; Wu, F.; Chow, J.C.; Lee, S.C.; Li, Y.; Chen, S.W.; An, Z.S.; Fung, K.K.; Watson, J.G.; Zhu, C.S.; et al. Characterization and source apportionment of atmospheric organic and elemental carbon during fall and winter of 2003 in Xi’an, China. Atmos. Chem. Phys. 2005, 5, 3127–3137. [Google Scholar] [CrossRef] [Green Version]
  43. Ming, J.; Xiao, C.D.; Sun, J.Y.; Kang, S.C.; Bonasoni, P. Carbonaceous particles in the atmosphere and precipitation of the Nam Co region, central Tibet. J. Environ. Sci. 2010, 22, 1748–1756. [Google Scholar] [CrossRef]
  44. Zhang, Y.L.; Kawamura, K.; Agrios, K.; Lee, M.; Salazar, G.; Szidat, S. Fossil and Nonfossil Sources of Organic and Elemental Carbon Aerosols in the Outflow from Northeast China. Environ. Sci. Technol. 2016, 50, 6284–6292. [Google Scholar] [CrossRef] [PubMed]
  45. Streets, D.G.; Gupta, S.; Waldhoff, S.T.; Wang, M.Q.; Bond, T.C.; Yiyun, B. Black carbon emissions in China. Atmos. Environ. 2001, 35, 4281–4296. [Google Scholar] [CrossRef]
  46. Chow, J.C.; Watson, J.G.; Kuhns, H.D.; Etyemezian, V.; Lowenthal, D.H.; Crow, D.J.; Kohl, S.D.; Engelbrecht, J.P.; Green, M.C. Source profiles for industrial, mobile, and area sources in the Big Bend Regional Aerosol Visibility and Observational (BRAVO) Study. Chemosphere 2003, 54, 185–208. [Google Scholar] [CrossRef]
  47. Ellis, E.C.; Novakov, T.; Zeldin, M.D. Thermal characterization of organic aerosols. Sci. Total Environ. 1984, 36, 261–270. [Google Scholar] [CrossRef]
  48. Watson, J.G.; Chow, J.C.; Lowenthal, D.H.; Pritchett, L.C.; Frazier, C.A.; Neuroth, G.R.; Robbins, R. Differences in the carbon composition of source profiles for dieseland gasoline-powered vehicles. Atmos. Environ. 1994, 28, 2493–2505. [Google Scholar] [CrossRef]
  49. Zhou, X.; Zhang, T.; Li, Z.; Tao, Y.; Wang, F.; Zhang, X.; Xu, C.; Ma, S.; Huang, J. Particulate and gaseous pollutants in a petrochemical industrialized valley city, Western China during 2013–2016. Environ. Sci. Pollut. Res. Int. 2018, 25, 15174–15190. [Google Scholar] [CrossRef]
Figure 1. (a) Geographical location of Lanzhou, China and (b) locations of the sampling site on the topographic map. Background map was retrieved from Google Earth.
Atmosphere 11 01368 g001
Figure 2. Time series of the EC and OC concentrations in PM1, PM2.5, and PM10, respectively. The temperature, relative humidity (RH), precipitation, and wind speed (WS) and direction (WD) were recorded by the automatic weather station.
Atmosphere 11 01368 g002
Figure 3. Seasonal variations of OC and EC in the PMs, where each box indicates the 99%, 75%, 50%, 25%, and 1% quartiles of the data from the top to the bottom.
Atmosphere 11 01368 g003
Figure 4. Seasonal variation of POC, SOC, OC/EC, and POC/SOC in different-sized PMs.
Atmosphere 11 01368 g004
Figure 5. Regressions between OC and EC in PM1, PM2.5, and PM10. Different lines (colour) represent the Regressions between in different seasons.
Atmosphere 11 01368 g005
Figure 6. Seasonal variation and size distribution of carbon components.
Atmosphere 11 01368 g006
Figure 7. Five-day backward trajectories of Lanzhou and the ratio between OC and EC in each cluster in 500-m layer in (a) winter, (b) spring, and (c) summer. Different lines (colour) represent different clusters.
Atmosphere 11 01368 g007
Figure 8. Concentration-weighted trajectory (CWT) of OC in (a) winter, (b) spring, and (c) summer and of EC in (d) winter, (e) spring, and (f) summer in PM10 in Lanzhou.
Atmosphere 11 01368 g008
Table 1. The average concentrations of OC, EC in PM1, PM2.5, and PM10.
Size FractionSeasonConcentration (µg/m3)EC (µg/m3)OC (µg/m3)OC/PM (%)EC/PM (%)
PM1Winter96.36 ± 28.263.65 ± 1.7811.24 ± 4.4111.663.79
Spring60.88 ± 24.441.24 ± 0.814.51 ± 1.297.412.04
Summer72.42 ± 24.831.43 ± 0.695.19 ± 0.917.171.97
Average76.55 ± 18.1 2.11 ± 1.346.98 ± 3.718.752.60
PM2.5Winter104.26 ± 35.114.21 ± 1.1214.47 ± 4.5813.884.04
Spring60.37 ± 39.041.82 ± 1.235.48 ± 2.319.083.01
Summer78.98 ± 13.791.63 ± 0.755.85 ± 1.837.412.06
Average81.20 ± 22.03 2.55 ± 1.448.60 ± 5.0910.123.04
PM10Winter176.69 ± 56.175.94 ± 1.818.15 ± 6.1110.273.36
Spring161.83 ± 70.633.38 ± 2.119.06 ± 3.5262.08
Summer130.87 ± 39.652.69 ± 1.037.58 ± 1.585.792.06
Average156.46 ± 23.384.01 ± 1.7211.60 ± 5.727.352.50
Table 2. OC and EC concentrations in Lanzhou and those from other Chinese cities.
LocationPeriodSize
Fraction
OC
(µg/m3)
EC
(µg/m3)
References
LanzhouJanuary 2019–July 2019PM16.98 ± 3.712.11 ± 1.34This study
PM2.58.6 ± 5.092.55 ± 1.44
PM1011.6 ± 5.724.01 ± 1.72
LanzhouJanuary 2014–December 2014PM2.515.36.7[12]
LanzhouDecember 2012–January 2013PM2.59.44.3[30]
Beijing2016–2017 winterPM121.225.74[23]
PM2.541.2511.02
PM1045.8914.26
ChengduJanuary 2011–October 2011PM2.517 ± 87 ± 4[19]
Xi’anDecember 2014–November 2015PM2.519.73 ± 15.031.86 ± 1.00[27]
PM1022.47 ± 17.422.23 ± 1.42
14 cities, ChinaWinter, 2003PM2.538.1 9.9 [13]
Summer, 2003PM2.513.8 3.6
Lhasa PM104.742.31[16]
Table 3. Principal component analysis of carbon components in PM.
SpeciesPMSpringSummerWinter
F1F2F1F2F1F2
OC1PM10.5250.7870.1820.6330.865-
PM2.50.614-0.6610.7240.784−0.385
PM100.566−0.674−0.0380.9990.807−0.186
OC2PM10.9560.3730.8860.1600.984-
PM2.50.974-0.9220.2880.968−0.185
PM100.908−0.2860.9930.0410.967−0.110
OC3PM10.9500.3990.869−0.4200.968-
PM2.50.963-0.912−0.2850.9170.158
PM100.955−0.1380.9960.0240.963−0.064
OC4PM10.9560.3670.899−0.1990.950-
PM2.50.893-0.943−0.1610.7930.460
PM100.9550.1230.9950.0020.8960.063
EC1PM10.9420.3350.9340.2660.943-
PM2.50.969-0.924−0.3090.944−0.191
PM100.961−0.0590.9970.0330.971−0.039
EC2PM10.811−0.0800.8730.0920.940-
PM2.50.935-0.935−0.2010.6790.606
PM100.8990.3040.995−0.0050.8260.197
EC3PM10.5060.7770.343−0.7660.508-
PM2.50.560-0.6730.659−0.2350.704
PM100.5200.6070.884−0.0640.1680.960
OPCPM10.8920.3150.6900.3200.945-
PM2.50.936-0.865−0.2870.923−0.103
PM100.9110.1360.9940.0010.941−0.025
EigenvaluesPM15.6031.0154.6111.4126.480-
PM2.56.056-5.9361.3375.2781.328
PM105.8051.0536.7231.0055.8551.017
FVCR (%)PM170.035%12.688%57.632%17.651%80.997%-
PM2.575.694%-74.199%16.714%65.981%16.605%
PM1072.559%13.159%84.037%12.558%73.186%12.712%
CVCR (%)PM170.035%82.723%57.632%75.283%80.997%-
PM2.575.694%-74.199%90.914%65.981%82.585%
PM1072.559%85.718%84.037%96.595%73.186%85.898%
Publisher’s Note: MDPI stays neutral with regard to jurisdictional claims in published maps and institutional affiliations.

