A Note on the Assessment of the Effect of Atmospheric Factors and Components on Humans


1
Research Centre Human Biometeorology, Deutscher Wetterdienst, 79104 Freiburg, Germany
2
Chair of Environmental Meteorology, Institute of Earth and Environmental Sciences, Albert-Ludwigs-University Freiburg, 79085 Freiburg, Germany
Atmosphere 2020, 11(12), 1283; https://doi.org/10.3390/atmos11121283
Submission received: 27 October 2020
/
Revised: 23 November 2020
/
Accepted: 25 November 2020
/
Published: 28 November 2020
(This article belongs to the Special Issue Review Special Issue: Human Biometeorology—Link to Climate Impact Research)
Abstract
:The aim of this contribution is both to demonstrate and to explore the general assessment pertaining to the effects of atmospheric factors on human health and general wellbeing. While humans are aware of such effects, particularly individually, their concrete and synergetic effects with the human physiological system are, comparatively, not well comprehended. In human biometeorological studies and approaches, the aforementioned effects are analyzed in terms of their effect pathways, and the development of single or complex approaches. Recurrently in the existing literature, such approaches are mostly defined and, respectively, targeted as indexes. The evaluation and assessment of similar factors and parameters that present related effects were subsequently put together and quantified. This approach is described as ‘effective complexes’ or components. The most well-known examples are the thermal complex, air pollution complex (which can be divided into the biological (pollen) and anthropogenic (air pollutants) factors), actinic complex, and finally, the recent or rapid weather changes complex. Most of the approaches focus on the negative effects consequential to the established criteria ranging from empirical outputs, to epidemiological studies. As a result, the presented approach does not only include the negative effects or implications on humans. Instead, it also highlights the neutral and positive effects which were acknowledged by the research. The approach deals furthermore with the combined effects of different complexes or components and incorporates different weightings of the factors based on the disclosed effects. In addition, seasonal and exposure factors are deliberated upon to differentiate annual variability factors. Finally, the presented approach builds upon a way in which to cogitate how the complex interactions associated to weather and climate can be quantified in a more appropriate way in the context of human health. The approach aims to be applied for a specific weather forecast enabling the communication and balance between human health factors, and also more encompassing climatic analysis.
1. Introduction
According to VDI-guideline 3787 (Association of German Engineers = Verein Deutscher Ingenieure) climate and air quality must be taken into account in urban and regional planning at meso-scales in a manner which is relevant to human health and wellbeing [1]. This relevance and approach of quantification is the target of human biometeorology and includes the effects of mean and extreme weather conditions, climate and air quality. Based on [1] the combined effects of atmospheric conditions on human, three specific areas of human biometeorology can be highlighted, which are particularly important in preventative planning. Preventative planning embraces regular urban planning attitudes, but can moreover interplay with diverse temporal periods and spatial scales. As a first example, this includes weather forecast and specific information including warning for protection of human general wellbeing standards and human health. A second example relays to the capacity to inform long-term attitudes and perspectives, a crucial aspect which should also be considered in disciplines, including (but not limited to) urban planning, landscape planning, and general urban design [2].
Much is known about the combined effect and similar way of affection and that not only one single parameter, or factor, is the main cause of the effect. Within the combined effects of atmospheric conditions on humans, several specific areas of human biometeorology are highlighted given their particular key role in preventative planning and protection [1]. The thermal factors comprise the meteorological elements of air temperature, air humidity, wind velocity, and short wave and long wave radiation which have a thermophysiological effect on humans outdoors and indoors. The respective significance to health is directly associated with the close linking of thermoregulation and circulatory regulation [1]. Air quality factors comprise the solid, liquid and gaseous, natural and anthropogenic air pollutants which have an effect on human health in both outdoor and indoor contexts. Firstly, air pollution conditions relevant to health conditions depend on emission sources. Secondly, given such sources, the transmission conditions (dispersion, dilution, possible chemical conversion, washout, rainout) become crucial, and are moreover determined by atmospheric stratification (turbulence state), wind dynamics, precipitation patterns, and also possibly air humidity and solar radiation. The actinic factors comprise the visible and ultraviolet spectrum of solar radiation which correlates to direct biological action going beyond a purely thermal effect. In addition, meteorotropic reaction (weather changes or biotropy) of the human organism is a function of different factors, such as the type and intensity of the effects of the physical environment as well as individual conditions like adaptive capacity and state of health. Many human biometeorological studies indicate both causal correlations between conditions in the lower atmosphere and reactions of the human organism, and moreover, the combined or synergistic effects of different weather types [3]. These four factors cover mostly the natural and anthropogenic effects and changes of atmosphere on human health.
Given the awareness of the negative effects of pollutants and extreme atmospheric conditions including heat waves and elevated UV exposure, several approaches and methods of quantification have been developed. For the thermal component, a plethora of empirical and more sophisticated indices have been developed, each based on the specific aim of the research. From early on, the necessity of the inclusion of the human energy balance has been eminent. Therefore, the concept of equivalent temperatures based on the human energy balance has gained so much weight in terms of thermal index usage and application. Considering the effect of the ultra violet (UV) part of solar radiation, the exposure and the ozone hole hazards have ensued the development and general application of the UV index for several purposes and applications. In the case of air pollution, and going beyond the issue of exposure, the contemplation upon pollutant origin has been highlighted, and nowadays it distinguishes the advantage in perceiving the separation between biological and anthropogenic compounds (gases and particles). For air pollutants, and due to its intrinsic political issues and socioeconomic inferences, the epidemiological setup of thresholds and air pollution indices have thus far steered large scale discussions and application, especially in the context of urban areas. Finally, the effects on the autonomous nervous system which catalyzed the expression of both general and specific complaints regarding identified human symptoms as a result of weather changes has been target of considerable epidemiological and clinical analysis studies.
Several contemporary issues are also beyond the atmospheric/meteorological single, combined, synergetic, and antagonistic factors. More specifically, such factors should also not only be considered in terms of mean and extreme conditions, but in amalgamation, their frequencies and statistical values (i.e., including their wholesome percentile ranges). However, as aforementioned, the relationships of atmospheric factors with humans go beyond that of secluded atmospheric and meteorological dynamics. Such is clear when considering the imperative interdisciplinary relationships with (i) specific urban climatic adaptation action that by definition requires the involvement of non climatic experts who are responsible for appointing creative design and structural thermal measures; (ii) the peripatetic and dynamic attributes of general urban behavior, including the movement/mobility and general indoor/outdoor activity patterns of humans during both the diurnal and nocturnal periods. These two aforementioned relationships are argued to also play an important role in addressing and ensuring human wellbeing and health factors in the assessment approach.
The aim of the present communication is to raise awareness about this specific topic, including how to set up an approach of quantification of the different factors and complexities in human biometeorology. First the different factors and complexes are presented, followed by how these factors are affected not only by meteorological and climatological issues, but also by seasonality, exposure to indoor/outdoor contexts. Such approach will ensure that both the negative and positive influences of such combined effects are also underlined; in addition, important factors in terms of instantaneous combined effects are given and described. Finally, the approach is supported by visualization possibilities to aid the comprehension and denote the scientific bridging and comprehension between atmospheric outputs with non climatic factors.
2. Methods
2.1. Thermal
There are more than 165 thermal indices and simulation devices developed and applied during the last 100 years and designed to assess the thermal environment according to human thermal physiology and sensation [4,5,6,7]. From these, only suitable indices for the thermophysiologically relevant quantification of atmospheric environment can be applied. They provided the basis for the different human biometeorological applications for assessing the short-term impacts of weather and the long-term development of climate [4,7,8].
Recent studies also reveal the relevance of thermal indices and their justification to thermal perception. Only 12 out of 165 indices of human thermal perception are classified to be principally suitable for the human biometeorological evaluation of climate for urban and regional planning; this moreover entails that the thermal indices provide an equivalent air temperature of an isothermal reference with minor wind velocity. Furthermore, thermal indices must be traceable to complete human energy budget models consisting of both a controlled passive system (heat transfer between body and environment), and a controlling active system, which provides a positive feedback on temperature deviations from neutral conditions of the body core and skin as it is the case in nature. Seven out of the 12 indices are fully suitable, out of which three overlap with the others. Accordingly, the following indices were selected as appropriate [4,7]: Universal Thermal Climate Index (UTCI), Perceived Temperature (PT), Physiologically Equivalent Temperature (PET), and rational Standard Effective Temperature (SET*). In addition, the modified PET (mPET) has become available that retains the definition of the PET reference environment and the fundamental parts of the underlying thermophysiology, but improves both passive and active thermoregulation significantly [7,9].
For the thermal comfort, or thermal effective factor, these aforementioned indices have been applied in a large amount of studies which have strived to investigate the specific and direct influences of heat and/or cold stress upon the human body [7].
2.2. UV
There is no need to explain the significance of solar radiation. However, it is certainly worth recapping the influences that take place, which in turn, affect hormone balance and mental facets. Bright light and strong contrasts produce an ergotropic mood, i.e., an attitude focused on activity and work, which provides the precondition for performance, whereas oppressive and dim conditions with little contrast have a damping effect [10,11]. Despite its relatively small contribution to the overall radiation intensity, UV radiation has an exceptionally high biological significance. In addition to nonspecific effects—influence on stamina, wellbeing and capability, vegetative-neurological stabilization and the like by influencing metabolism, respiration, hemoglobin, and inner secretion—the three UV ranges divided up according to biological aspects are associated with very different specific effects (selection):
- ○
- UV-A: 315–400 nm (long wave UV, “black light”) immediate pigmentation, ageing of the skin;
- ○
- UV-B: 280–315 nm (medium wave UV) erythema, secondary pigmentation, calluses, anti-rickets effect, bactericidal effect, skin cancer, cataracts, keratitis; efficacy in psoriasis treatment (including UV-A);
- ○
- UV-C: 100–280 nm (short wave UV) cell destruction, bactericidal effect.
Radiation in the UV-C range does not affect human life because it is completely absorbed by the stratospheric ozone (O3) and by oxygen (O2). UV-B radiation is also diminished in accordance with the variable ozone distribution (short wave limitation of the optical window), which means that only those individuals who permit excessive exposure will suffer the negative effects [10,11].
As a result of the wide scatter of short wave radiation, apart from when the sun is very high, the diffuse proportion of UV radiation is always greater than the direct proportion, i.e., relatively high radiation intensities also occur in the shade. Snow-covered ground causes strong reflection of UV radiation; the risk of rapid overexposure thus increases in high terrain/mountains, especially since the radiation which affects erythema increases by about 12% to 15% per 1000 m in height. The high radiation dosage at the coast is not caused by reflection on the water but by the open horizon [11,12].
Solar and terrestrial infrared radiation is only significant for the heat balance of the human body, where thus far, no suspected physiological effects going beyond that have yet been proven.
UV-A absorption in the atmosphere is very marginal. The exposure to primary UV-B, but to a lower extent also to UV-A, is known to have positive and negative impacts on human health. UV radiation supports vitamin D synthesis, which promotes bone health, and is the main source of vitamin D in the human body [13,14]. On the other hand, UV radiation can provoke health disorders and diseases, such as sunburn, cataracts, oncological incidences in skin tissue, and generally alter the immune response of the human body [10,11,15].
The global solar UV-Index (UVI) was developed by the World Health Organization (WHO) in collaboration with the World Meteorological Organization (WMO), the United Nations Environment Programme (UNEP) and the International Commission on Non-Ionizing Radiation Protection (ICNIRP), and is a measure for the maximal erythemally effective UV radiation, induced by the sun at a specific day on a horizontal surface [16,17,18]. UVI is primarily aimed to inform people about the need to adopt protective behaviors/measures when exposed to UV radiation. The UVI is unitless and ranges from zero to 11+ and provides five exposure categories with related protective measures [11]. The UVI is highly variable in time and space, mainly influenced by sun elevation, ozone, cloud cover, aerosols, ground reflection, and altitude [14]. As an example, and returning to ozone layer subtleties, and given the proximate ‘ozone-hole’ close to New Zealand, the country’s peak UV can be 40% higher when compared to correlated latitudes in the northern hemisphere (e.g., the Mediterranean area). Changes of sun elevation are reflected in the seasonal course of UVI, and also in the changes of UVI according to latitude oscillation. Additionally, the most significant absorber of solar radiation at UV-B wavelengths, the stratospheric ozone, usually exists in higher concentration over northern latitudes compared to southern latitudes. Hence, towards the equator, the UVIs are higher and generally decrease with increasing latitude. Clouds may have a strong effect on UV radiation ranging from almost complete extinction under heavy thunderstorms to enhancements of a factor of around 1.4 [11].
2.3. Weather Change/Sensitivity
With the exception of extreme conditions, weather cannot directly cause diseases. It can, however, serve to trigger and/or exacerbate symptoms associated to an acute disease, and generally contribute to the aggravation of chronic problems. Such risk factors become particularly tangible if the organism’s adaptive ability cannot cope with the weather stimuli. Humans, therefore, react differently depending upon the meteorological conditions and the organic system affected. The reactions range from slight impairments of the general feeling of wellbeing, to the triggering of death for seriously ill patients [3].
As with any stress, the negative component should not be seen to overpower the positive aspect associated to instigating ‘distressing’ behaviors and patterns. More specifically, changes in the atmosphere caused by weather can improve or train the adaptive ability of the organism (eustress) [1]. An appropriate weather-dependent behavior requires that one exploits positive conditions, especially the chance to be outside, which our lifestyles often neglect. In addition, an appropriate weather-dependent behavior requires that we protect a sensitive or damaged organism from adaptive demands that are too strenuous [3,19].
Statistical studies have been used frequently, with varying success, to clarify the relationships between weather and the human being [19]. Even if one has doubts about the quality of methodology of many studies, there are a large number of findings that have been reproduced independently, which can be considered reliable. The numerous difficulties associated with attempts to prove the effects of weather on the organism point to a very complicated problem. These attempts have also illustrated that the human organism as well as the atmosphere are complex systems of a high order. Clarifying relationships between these two systems is not a simple matter. That is why there have been various attempts to portray these complex relationships more clearly by constructing classification systems [3,19].
With respect to the human organism, one can differentiate between three types of reaction depending upon the strength of the response to weather stimulus:
- -
- weather reaction: reaction, conditioned by weather, in the sense of a physiological adaptive process that is not viewed negatively;
- -
- weather-prone: functional disturbances with impairment of the general wellbeing and symptoms such as headaches, sleep disturbances, or physiological misperceptions that have no direct connection to a disease; and
- -
- weather-sensitive: pathological symptoms where previous illnesses have occurred, such as chronic obstructive bronchitis or cardiac and circulatory diseases.
The boundaries between these three reaction levels are fluid and dependent upon the strength of the stimuli, the degree of damage to the organism, and a number of other factors. Such reactions also enforce the aforementioned importance of considering that the relationship with weather stimulus is not limited to a specific time of day, and is significant for both diurnal and nocturnal cyclic human activity patterns.
2.4. Air Pollution
Air quality is the result of a complex interaction between natural and anthropogenic environmental conditions. Especially in cities, air pollution is a serious environmental problem. The air pollution path of the urban atmosphere consists of emission and transmission of air pollutants resulting in ambient air pollution. Each part of the path is influenced by different factors. Anthropogenic releases from motor traffic accounts for a significant proportion of worldwide emissions. During transmission, air pollutants are dispersed, diluted, and subjected to photochemical reactions. Ambient air pollution reveals temporal and spatial variability [20]. The temporal, spatial variability, and trends of urban air pollutants caused by motor traffic, typical averaged as annual, weekly, and diurnal cycles of NO, NO2, O3, and Ox are very important.
Exposure to elevated concentrations of ambient air pollutants causes adverse human health effects. A critical question in many urban environments is not whether the air is unhealthy, but, given that air quality is poor, how severely health standards are affected [21]. Answering this question is a complex task, given the (1) assembling and analyzing the air-quality data necessary for this problem is to a large degree location-specific; (2) appropriate indices for the assessment of the air-quality component of the urban climate have yet to be developed, and rigorously tested. Nearly every country has standards to assess single air pollutants, e.g., EU-standards in Europe, the National Ambient Air Quality Standards (NAAQS) in USA, or the World Health Organization Air Quality Guidelines (WHO—AQGs). However, these standards are not sufficient, especially for urban air quality management or urban planning, because human beings in cities are not exposed to a single type of air pollutant, but to a mixture of different substances. The problem is to develop an index based on air pollutants that are typical of different emission source groups and for which data are easily available, i.e., they must be routinely recorded at official air-quality stations. Meanwhile some indices do exist for the assessment of the air pollution conditions in cities, e.g., Pollutant Standards Index (PSI) in the USA or the air quality stress index (LBI) in Germany [20,22]. One major challenge in the development of an integral assessment index for air pollution in cities is to make it sufficiently relevant in environmental medical terms. On the other hand, if this index is too complicated, it is nearly impossible to use it in different applied questions, e.g., in urban planning decision making. This problem is currently under discussion with regard to LBI, which is an index for average and short-term air pollution loads and considers SO2, NO2, and total suspended particles (TSP), i.e., air pollutants from official air-quality stations, for which data are easily available. The investigation on air pollutants (SO2, particulate matter (PM), CO, NO2, and O3) in cities [1,22] reveals that air pollution is widespread across the cities and is often most severe in cities located in developing countries. However, even in others, health standards are exceeded, albeit to a smaller degree. The concentrations of PM in these cities are persistently above the WHO guidelines by a factor as much as two or three.
2.5. Biogenic Factors
The atmospheric pollution by gases and particulate matter affects many rural, industrial, and urban sites [23]. In the last report of the European Environment Agency, it is possible to read that up to 96% of the European Union’s urban population is currently exposed to fine particulate matter concentrations above World Health Organization guidelines [24]. In addition to pollutant gases, and particles emitted consecutively to human activities, the atmosphere is the medium of transit for a wide variety of biogenic particles [25]. Among biogenic particles, the bioaerosol consists of very different types of particles like viruses, bacteria, mold, plant fibers, or pollen with a broadly open size distribution from tens of nanometers to a few hundred micrometers. It has been known for quite long that these particles are very active for very diverse potential diseases [26]. Among them, pollen grains are a considerable point of concern in managing allergy related disorders. If pollen is one of the main agents in the reproduction system for thousands of plant species, from Gymnosperms to Angiosperms, it is at the same time a real contributor of the total bioaerosol mass. Based on the concentration of phospholipids, the authors of [27] reported that cell materials of fungi and pollen could contribute 4–11% of the total particulate matter <2.5 μm (PM2.5) mass and 12–22% of organic carbon in fine particulate matter (PM). It is also the direct carrier of water and non-water-soluble allergens as well as the vector for outer and inner sub particles for which various allergens were recently characterized. When broken, the pollen grains of anemophilous plants are also the vectors of fragments. Many of these fragments are able to diffuse airborne allergens as can do innate pollen subparticles (https://www.anses.fr/sites/default/files/documents/AIR2011sa0151EN.pdf).
It is known that the most frequent aeroallergens are derived from pollen [28]. Some of the effects of pollution on this specific fraction of the global bioaerosols are already known and reviewed [29,30]. What is proposed here is focusing on the diversity of approaches that were chosen in order to study, at different scales and for different pollutant sources, year after year and decade after decade, the various links between atmospheric pollution, airborne pollen, allergenicity, and allergy [25].
2.6. Less Atmospheric Influenced Factors (Odors, Noise, Wind)
In addition, some of the following variables and factors which may have a significant influence have to be mentioned [1]. Nevertheless, they are suggested to be approached in less of an obligatory nature for numerous reasons, including their milder influence on atmospheric factors and the high variability between them. Human wellbeing may be impaired by noxious odors. The dispersion of odors depends greatly on local meteorological conditions (primarily thermal stratification and wind conditions) [31]. Noise constitutes physiological stress for human beings, the level of which rises with increasing intensity and duration of the noise. The dispersion of noise is likewise influenced by local meteorological conditions (primarily through thermal stratification and wind conditions) [32].
2.7. Combined Effects
It is not clear how more than one negative effect or situation affect human or human health. The question is whether, for example, heat stress and high UV radiation (in addition to potentially high levels of pollutant materials) have a linear or nonlinear effect. In addition, having amalgamating effects, including, but not limited, the simultaneous exposure of two types of pollen types can lead to synergetic problems which further heighten the disclosed risk factors.
2.8. The Dilemma for an Overall Assessment
The scientific interest for an overall assessment of different atmospheric parameters and factors has existed for several decades [34,35]. The still applicable indices/approaches, and mostly for air pollution, have a strong political background which shall continue to augment as a result of climate change [36]. The dilemma in the quantification and assessment, is how to bring the most important factors, combining knowledge and approaches from environmental sciences, medical, epidemiological, geographical, and communication spectrums together. Furthermore, the developed knowledge must continue to be easily comprehended and/or interpreted, especially given the prominence of universal application and mutual goals across different disciplines. Besides the fact that the amount of knowledge varies in the existing literature, the other dilemma is that of approaching the respective factors under different scientific circumstances. Many times, the extent to which the factors can be reduced and/or simplified without compromising the quality, quantity, and reliability of the information for the end users becomes another issue. Under such a scope, this fine balance unequivocally alters depending upon the type of end users, which can range from regional administration and health authorities to decision makers involved in contemporary urban design, regional or urban planning disciplines that should be directly involved with elaborating micro-meso scale response measures.
3. Approach
The presented or suggested approach follows several aims, these being: (1) to raise awareness about the importance of the issue; (2) to start a broad scientific discussion between the disciplines of meteorology, biometeorology, air pollution, epidemiology, medicine, planning including decision makers and authorities; (3) to present some simple, but more or less comprehensive possibilities that portray how an assessment possibility could be accomplished, including how both visualization and presentation possibilities could enhance such interdisciplinary aims.
3.1. Thermal Component
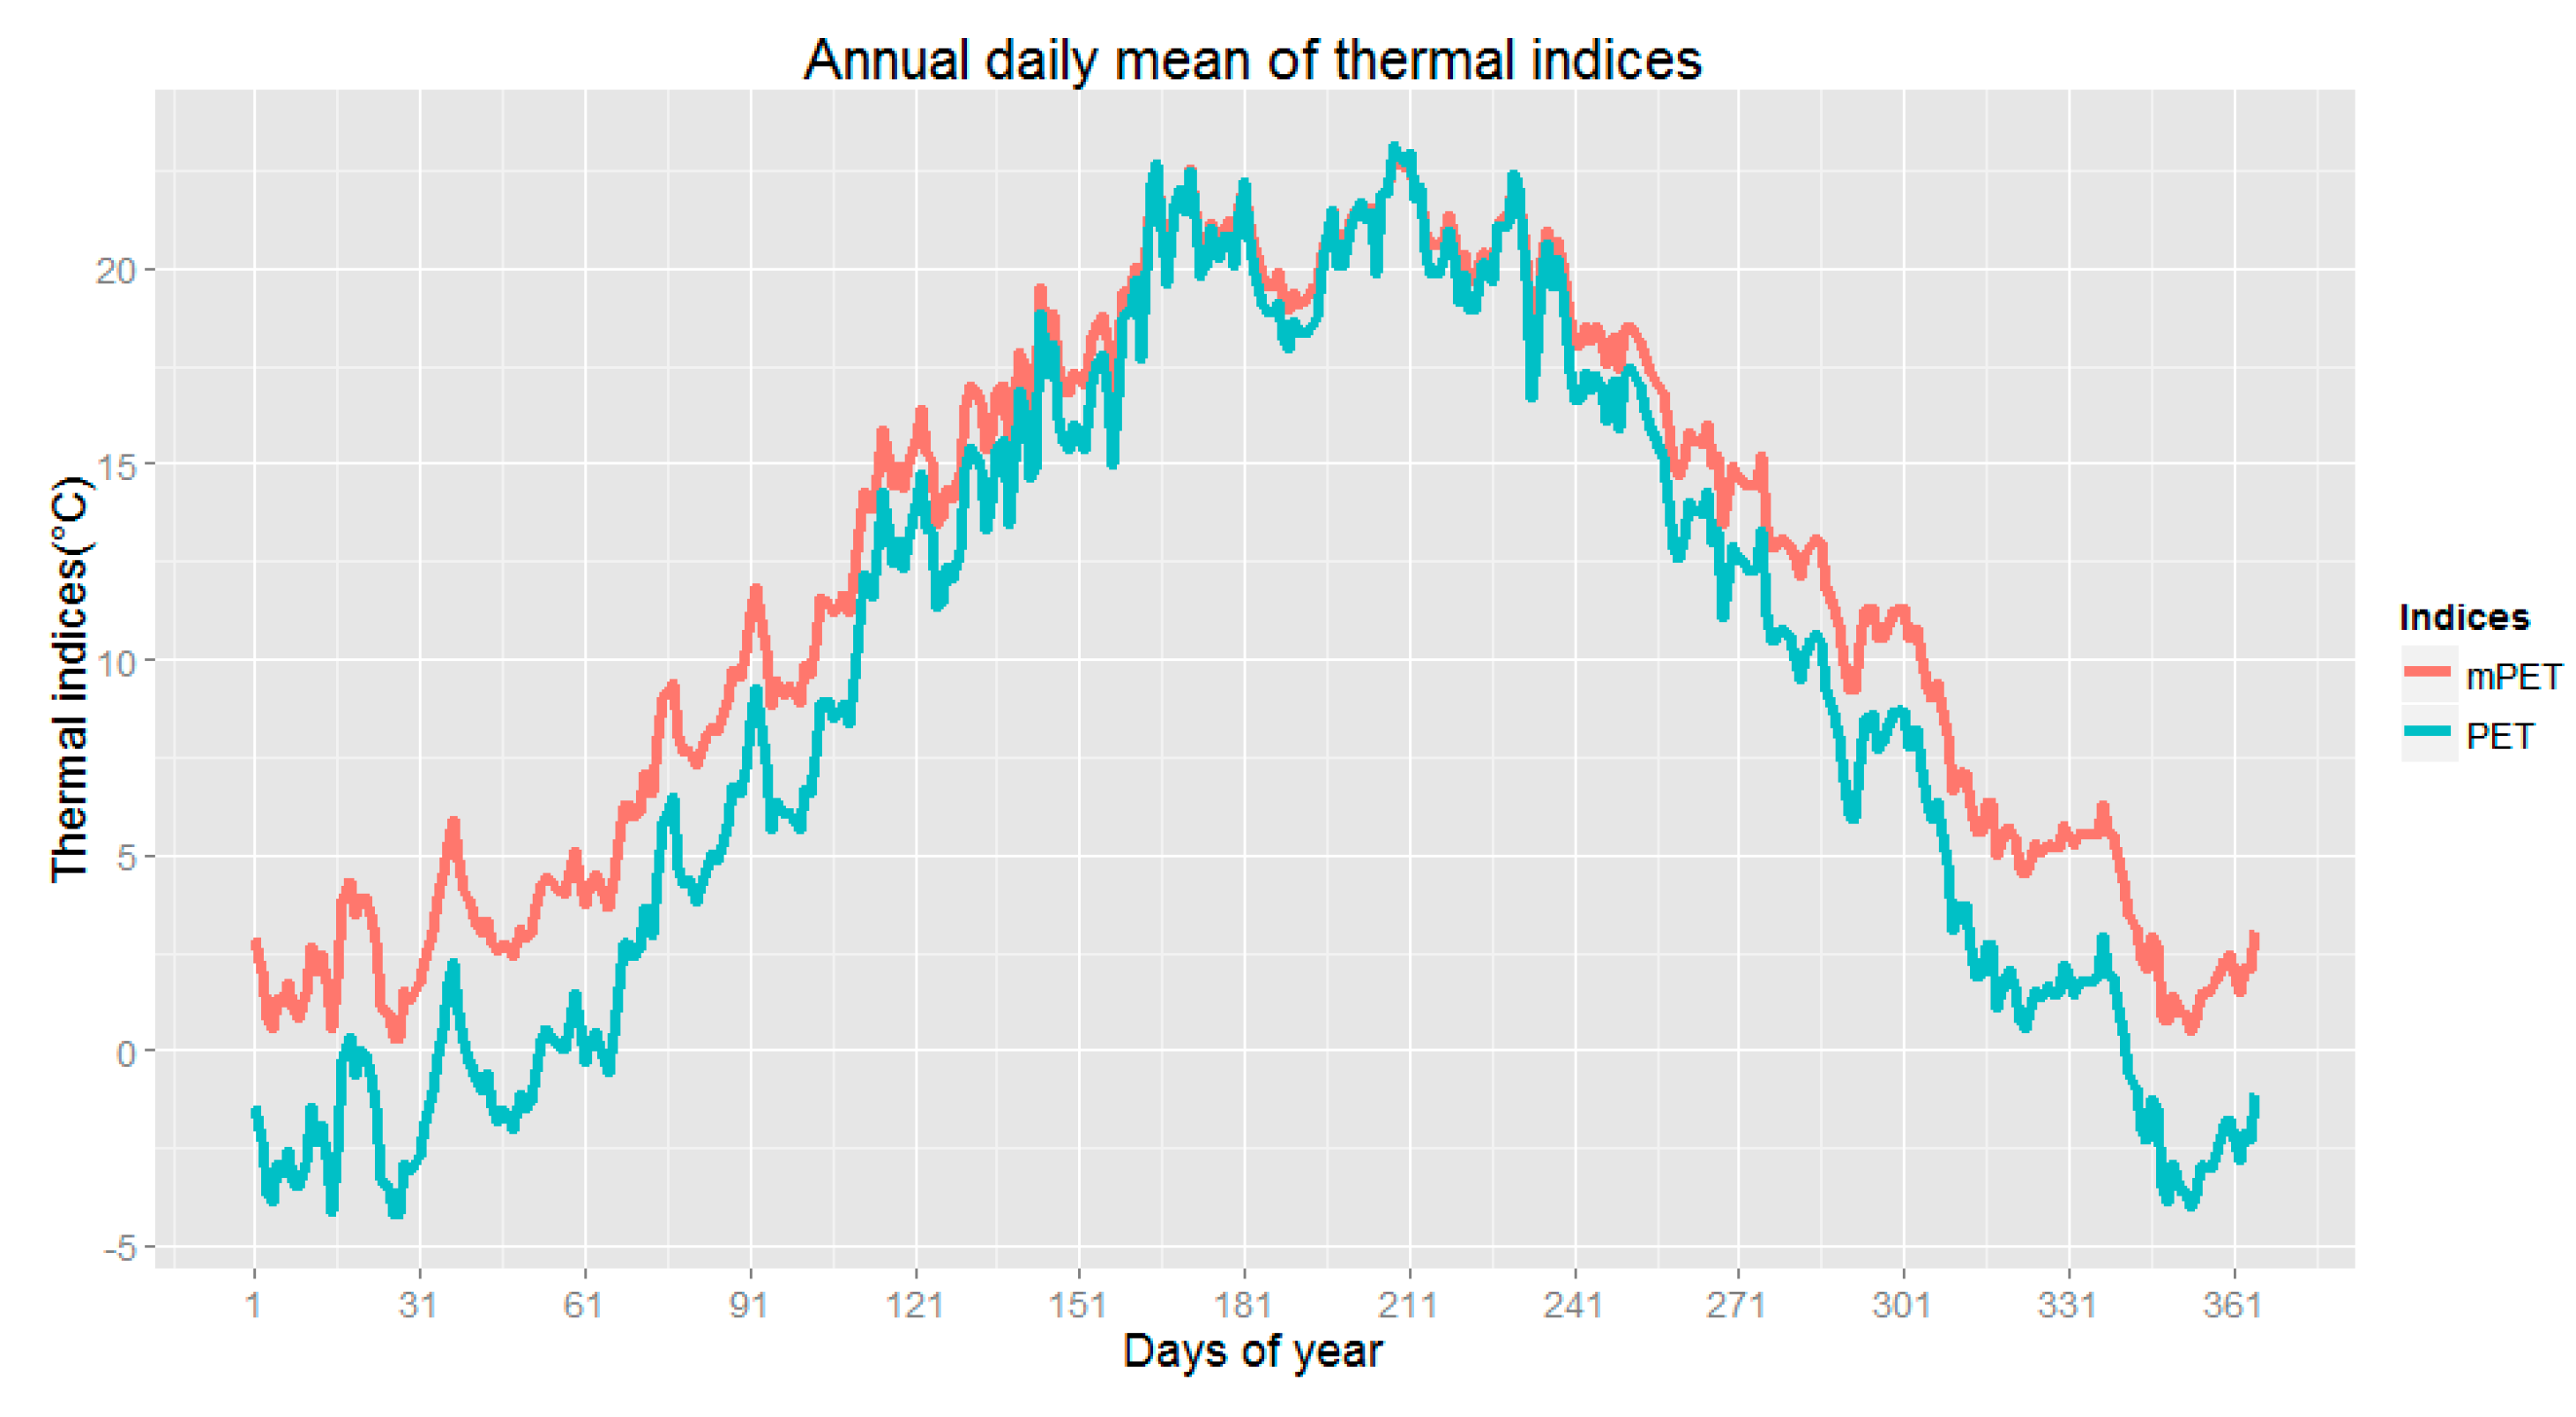
The thermal component, which is controlled by thermoregulation has several facets, which have to be considered. It covers several ranges of conditions based on the existing climate and the respective biometeorological exposure to a wide range of encircling atmospheric settings. More specifically, the abovementioned receptors are the skin and breathing system, and in general the human body has a huge possibility for thermal adaptation. Humans can be exposed in cold conditions and also hot conditions, but the range of acceptance in cold is much higher than in hot as a result of human’s intrinsic homoeothermic constitution. Therefore, the problem nowadays can occur more from circumstances associated to physiological heat stress, rather than cold stress. Nevertheless, it is often overlooked that there is also a range, where the effects from thermal environment are neutral and other circumstances where there are deviations from this neutral range. However, this does not imply that these deviations are still not within an acceptable range (Figure 1 and Figure 2), where physiological adaptation is running extemporaneously, or at least with limited stain being placed upon the human body’s thermoregulatory system.
The quantification of positive and neutral effects should be described and counted in a positive manner based on points, which finally results in a specific number. Cold stimulus and slight cold stress are counted here with −1 (which means positive effects) and the medium stress with 1, strong with 2, and very strong equating to +3.
Beside the warm, cold, and neutral aspect, it has to be considered that seasonality (Winter/Summer) and the aforesaid diurnal pattern plays an important role. Additional factors also must be considered when approaching thermal sensitivity to atmospheric factors, namely: (i) the duration of exposure to severe or extreme conditions; (ii) adaptation time (short and medium term); and, also (iii) consternation, which can relay/modify original thermal ‘tolerance’ levels. In addition, the possibilities of avoiding or escaping from extreme or unpleasant conditions are dominant factors. Especially in the thermal component, the indoor aspect and the related mobility component are driving factors. These respective factors should be quantified and added in the assessment Table 1.
In addition, the duration of extremes (which are more centered upon heat stress since cold stress can be more easily avoided or escaped) is counted for two days, with an additional value of 0.1 for the first two days, 0.2 for the third day. In the case of three to five days 0.2 is applied, if the duration lasts for longer than five days, the value of 0.5 is used. The seasonal adaptation in early summer, because of less adaptation, is considered by additional 0.2 for May and 0.1 for June (Months refer to northern hemisphere conditions). In the case of September, and due to adaptation, a reduction of −0.1 was implemented. The inclusion of social factors is considered by the consternation, because of the stronger and more than regional effect of heat stress is increased for May and June with 0.2 and for July and August with 0.1.
3.2. UV Factors
When approaching the effect of UV on human health, both the positive and negative have to be respectively identified for both the human skin and eyes. In most of the cases, the negative effects like human sensation, sun burn, or skin cancer are considered. Concerning long-term effects, the approach method cannot be considered or solved here. Therefore, the short-term exposure respective of some days is the target. In general, it tackles with the biological effect on human skin, especially depending on exposition and intensity. More specifically, such vulnerability relays to the respective time of the day and the time of the year, and additionally concentrating on when the sun angle is very high during summer, and in some cases also because of the other influencing factors i.e., areas with reduced ozone concentration in the stratosphere, during spring.
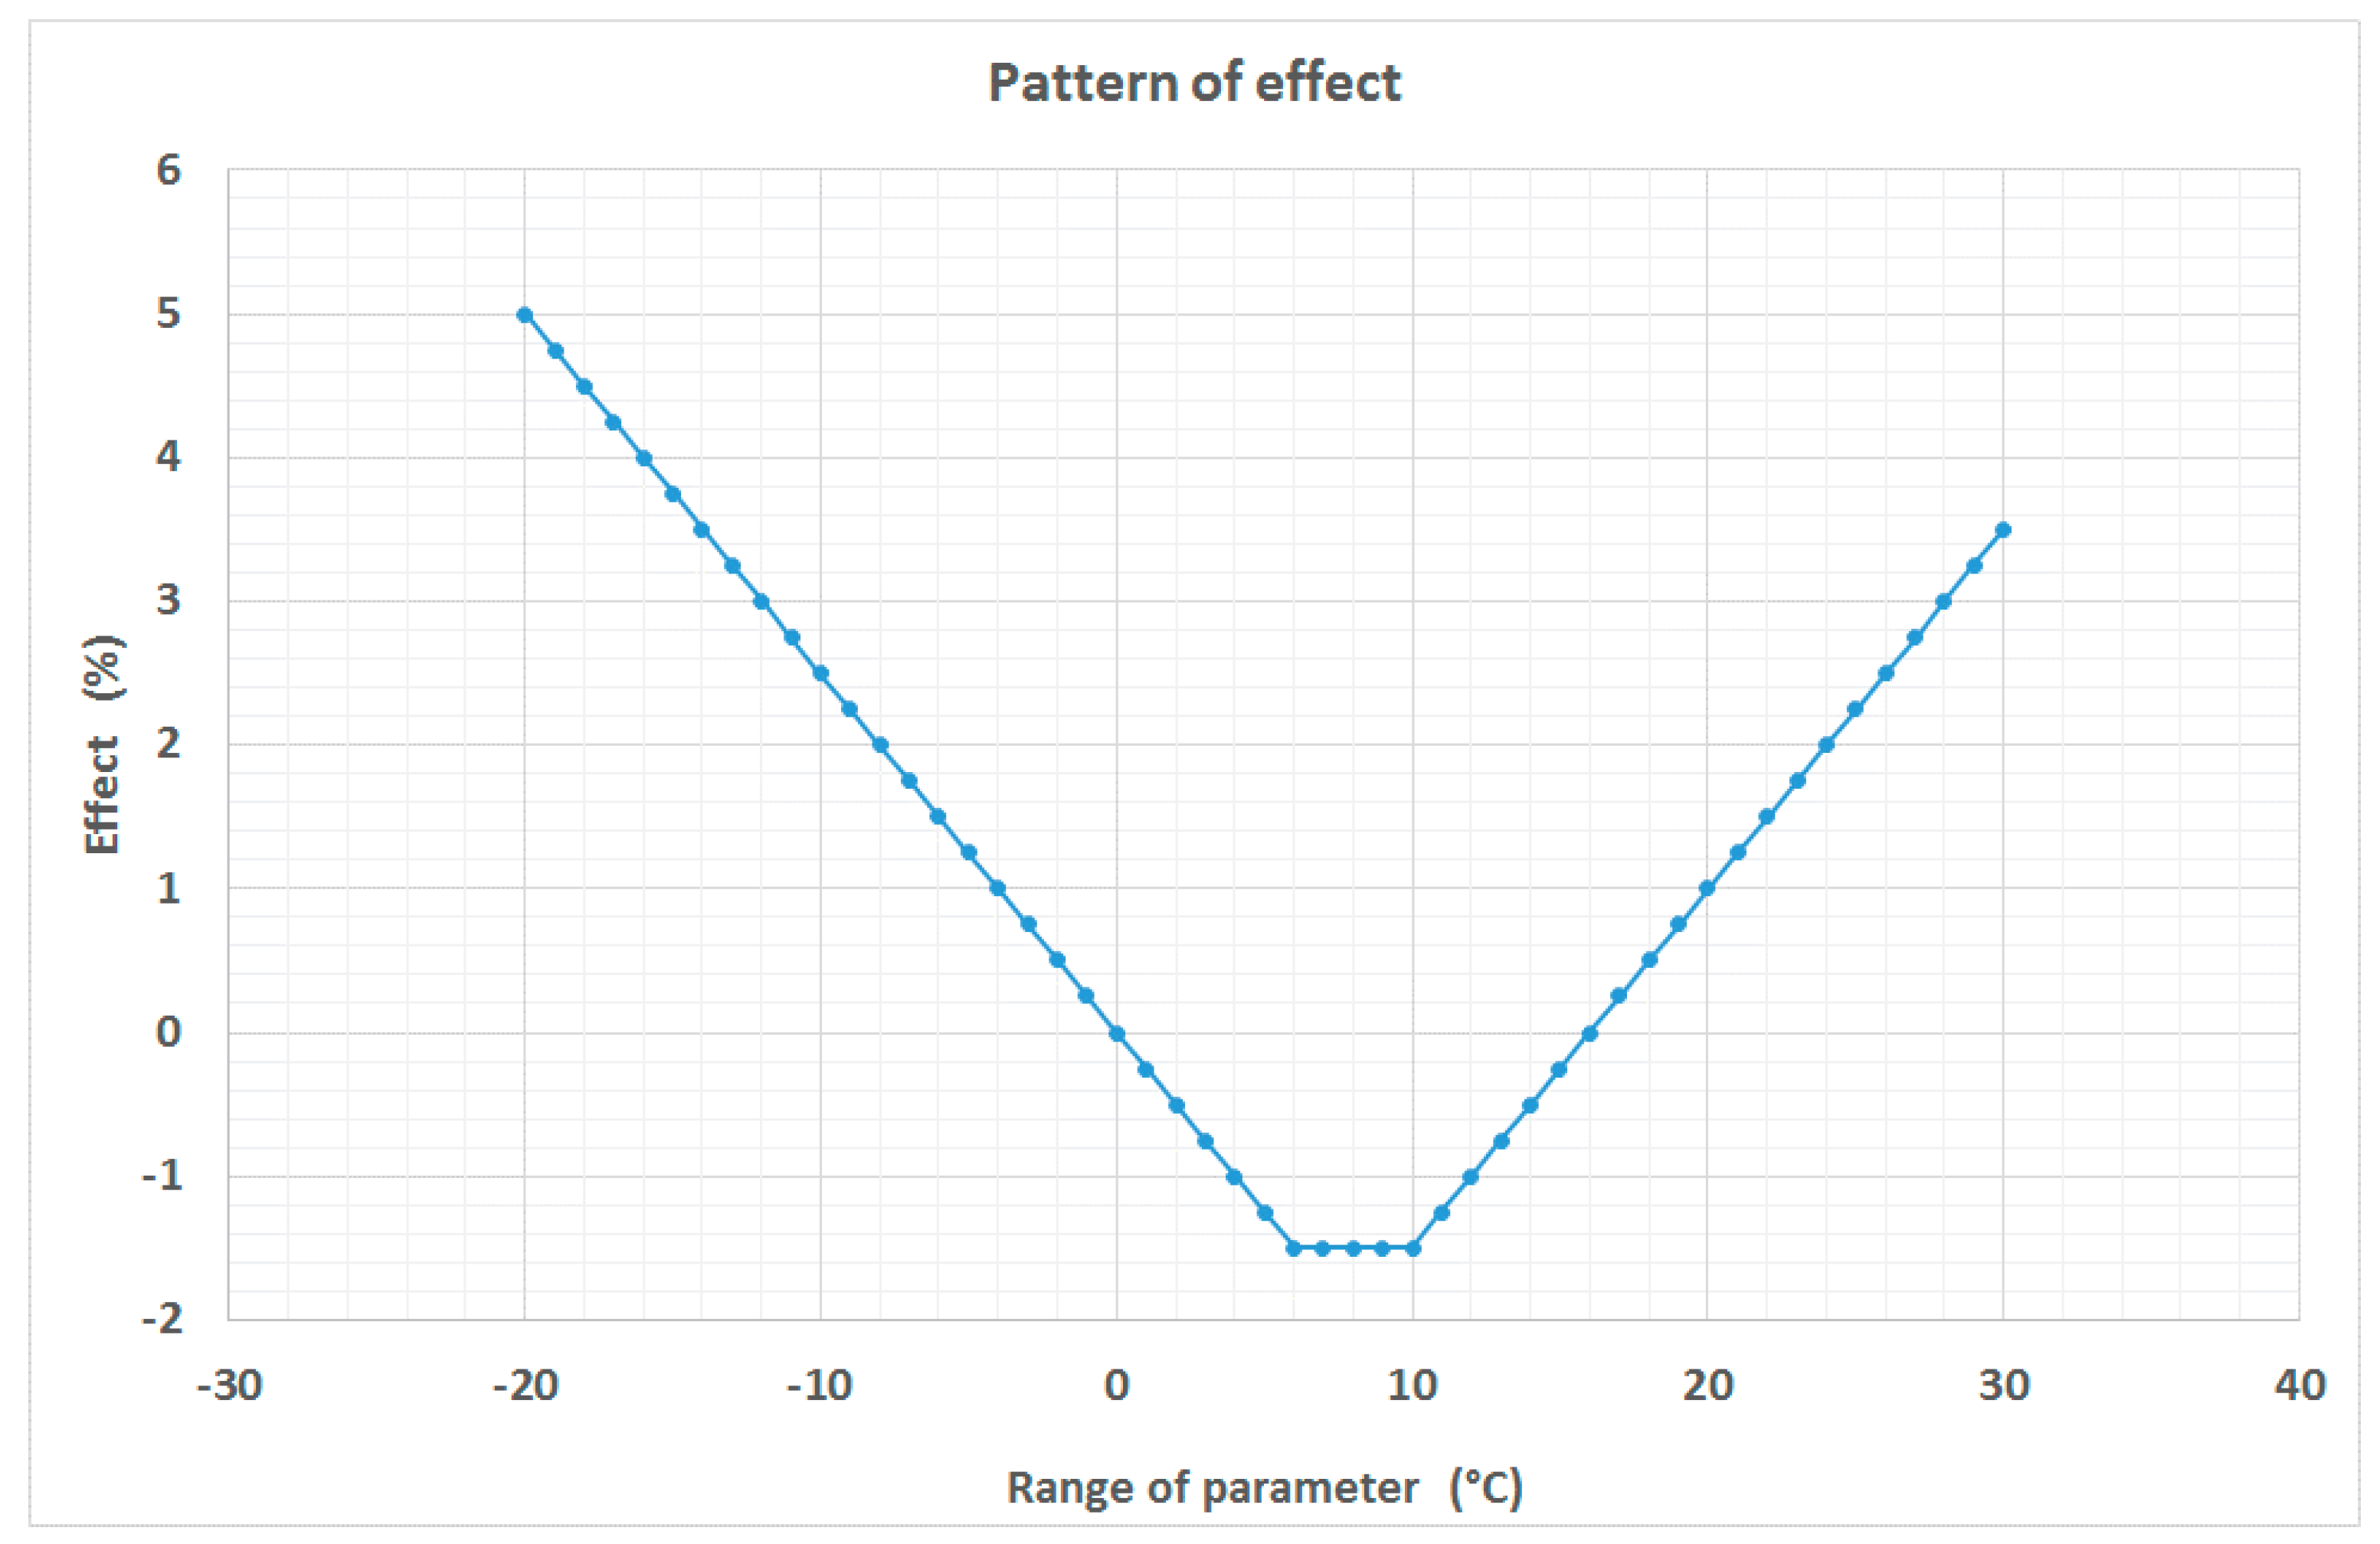
In general, there is an effect which is based on exposition, and varies in the diurnal and annual pattern. After a specific value (threshold) the positive effect turns into a negative effect. Overall, during summer, and due to the high sun elevation and lower latitude results, the effect remains mostly negative (Figure 3 and Table 2).
For the assessment approach, which is based on the UV index, the following factors have to be considered. If the UV Index is lower than 3 then the effect is positive and counted by −1. A value of 1 is attributed to between 3 and 6, the value of 2 relays to between 6 and 8, and 3 identifies occurrences beyond 8. If the UV index is higher than the long-term value in April and May, additional stress should be added and counted with +0.5. Adaptation for summer months can be considered, but not obligatory, because people have been previously exposed. In addition, it has to be mentioned that for UV exposure the possibility of avoiding negative effects is very high and mostly on the individual level. Finally, the effect of UV, is very important, but does not reach the emergency and complexity of heat stress.
3.3. Weather Sensitivity
The quantification of the effects of weather or atmospheric changes which are a result of the short-term adaptation of the human body in new atmospheric conditions is particularly relevant for people, and moreover those that suffer from a long-term or chronic illness. A positive effect can be achieved mostly during high pressure conditions, where the changes from day to day are not so high. This being said, there is only one exception during hot weather, which relates to when the effect is negative and covers the full spectrum of human effects from heat stress to heat stroke. The negative effects are mostly driven by the rapid changes and cover many complaints and varying levels of discomfort. Furthermore, and accounting for general information based on health records, fitness, nutrition, and environmental stress factors, weather changes are a minor trigger, but sufficient enough in order to support how stress and negative effects can be reduced. There is a strong connection with heat/cold stress, but also air pollution and other stress factors.
The overall concept of weather sensitivity is triggered by the senses, single human organs, and overall physiological and also thermoregulatory system, which is driven by the central nervous system. In general terms, it is perceived by population as mostly negative. In general, sub effects are empirically adjusted or quantified.
For the quantification approach (Table 3) positive factors should be considered, but with a more reduced weighting (−1) and neutral for indifferent weather (0). Light and strong negative conditions should be considered with a weighting of 1 and 2. Due to the high possibilities of preparation and action possibilities the effects of light and strong can be counted by 50%. The seasonal effects can be neglected here. The effect of duration can be counted for 2–3 days and the additional factor can be limited for 0.1 for more weather sensitivities. The weather sensitivity is counted with very less variation between indoor and outdoor exposure and conditions. Concerning adaptation there is no effect on it and for consternation about half of population.
3.4. Biogenic Factors
The effect of pollen is a general issue for a big part of population, but also generally limited because of the presence of emission of pollen. The effect can be evident for less pollen concentrations and also for specific cross correlations of several pollen kinds. Usually affected are breathing (with the upper respiratory part) and also the skin. In this spectrum, less is known about the positive effects on human health, and also the complexity of the setup of limit values (Figure 3). Another aspect is the positive element in that such periods which are normally associated to increased floral diversity which instigates psychological wellbeing in green spaces.
For the quantification (Table 4), the first approach is essentially associated to a specific context, and whether or not there is pollen in the air. In cases where there is pollen in the air, in cases where there is a lesser amount, the factor can be setup as 0.5. For medium, strong, and extreme levels of pollen, the respective levels can be designated at 1, 2 and 3, respectively. The seasonality is limited for the specific vegetation/emission period and there is only escape to indoor environments, with no emission, but possible overflow from outdoors should be noted, especially in close proximity to open windows. Seasonal or daily adaptation on pollen is not applicable, and consternation plays a large role within the population. For cross correlation or two suffers at the same time, the effect can be multiplied based on the situation in the air. Therefore, if two main pollen types are simultaneously airborne, a value of 0.25 can be added.
3.5. Air Pollutants
For single air pollutant thresholds and limit values based on existing epidemiological or clinical studies, research efforts have provided the scientific community with valuable information in terms of quantification purposes. Less is known about the positive effects of air pollutants. In addition, more than one air pollutant with high levels at the same time can further affect human health standards, and an antagonistic effect seems to be less relevant in comparison to a synergetic one.
From the large amount of air pollutants and contaminants in the air, only the classical and measurable ones (from the existing thresholds) can be taken into consideration. This includes primary and secondary air pollutants, which are considered for both the Winter and Summer period.
Due to the complexity and significance of exposure to air pollution in combination with other atmospheric stress factors, they are considered to play an increased role in the quantification of the factors affecting human health and comfort conditions (Figure 3).
For the quantification of the air pollution (Table 5) the following concept is suggested. If an air pollutant is less then 25% of the threshold, then a negative factor is not assumed. For a level of 25–75%, a value of 1 is attributed. Between 75% and 100% equates to a value of 2 which can increase to 3 if the pollutant percentage surpasses that of 100%. The concept is based on daily values or limits. The concept is valid for outdoor contexts and does not account for any indoor pollution. No seasonal or in general adaptation is considered. If two different gases exceed levels, a factor of 0.25, along with a value of 0.5 for PM is correspondingly added.
3.6. Combinations of Factors and Components
For the evidence of atmospheric stress factors, which in this case considers two simultaneous complexes, it is necessary to account for additional effects (Table 6). More specifically this includes the addition of 0.25 for UV, 0.25 for pollen, 0.25 for thermal, 0.25 for gases, and 0.5 for PM. Resultantly, this permits a better weighting of the different medical effects, including on breathing effects, single organs. Such a weighting can also be conceived more generally for the whole human body and its intrinsic physiological, respiratory, and thermoregulatory systems. This additional effect should be only used, if the different single stress factors are counted with higher than 2.
For specific uses (Table 6), where a component or combination is higher than 3, then the final score is 3. In the case of two factors presenting a value above 3, then the score can be indicated with additional asterisk (*).
Finally, for complex interactions and effects, some scores can be negative, indicating that there can be both a positive and a neutral effect (Figure 4). Positive effects are only feasible for weather sensitivity, cold stimulus, and UV exposition.
3.7. Graphical Approach and Visualization
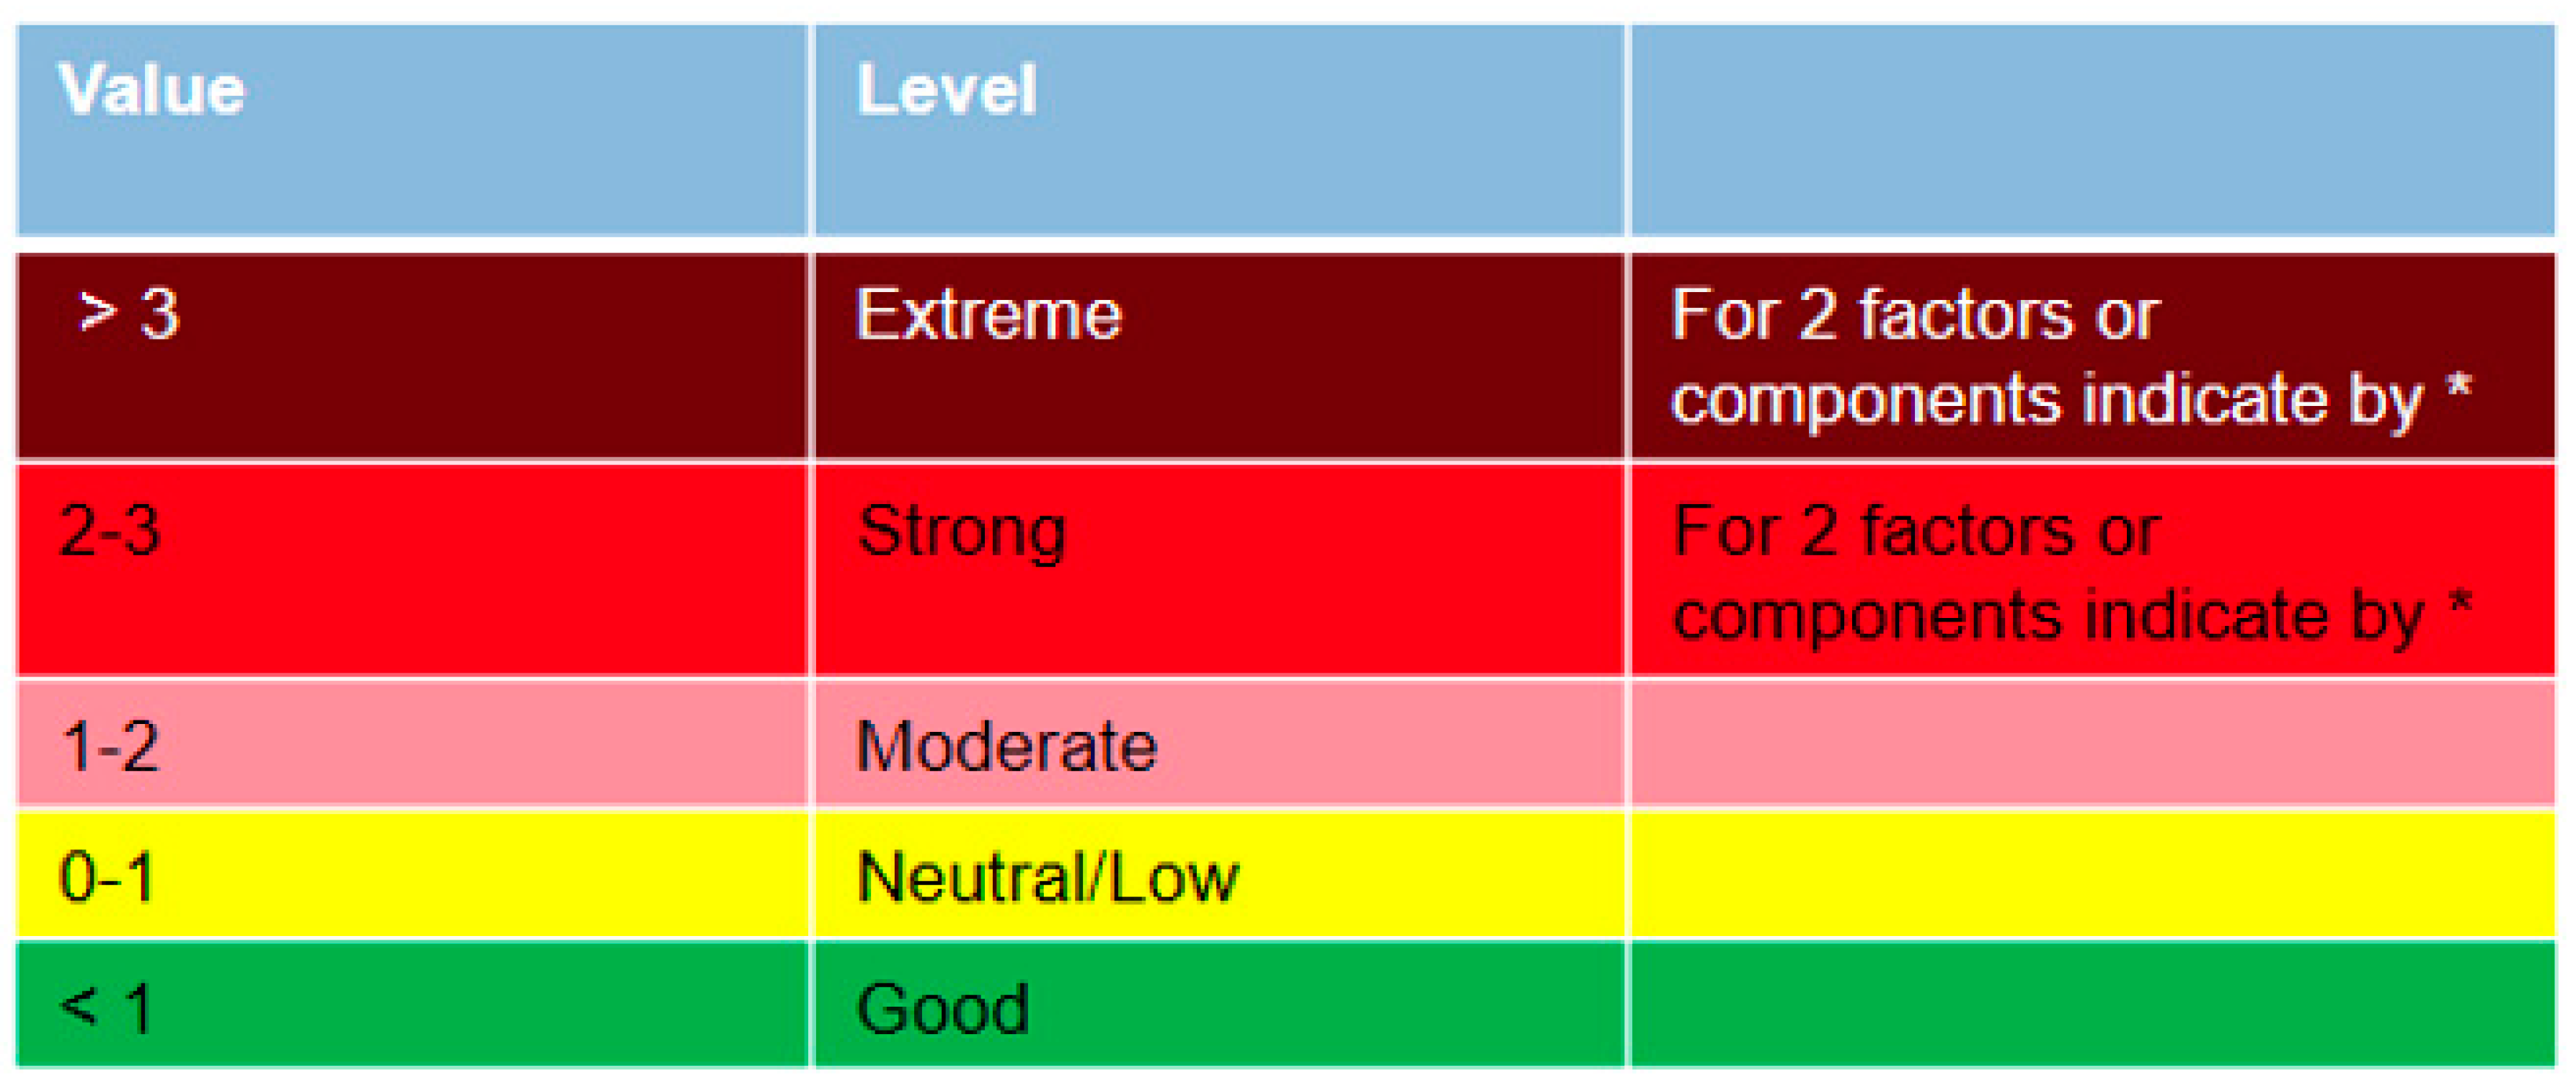
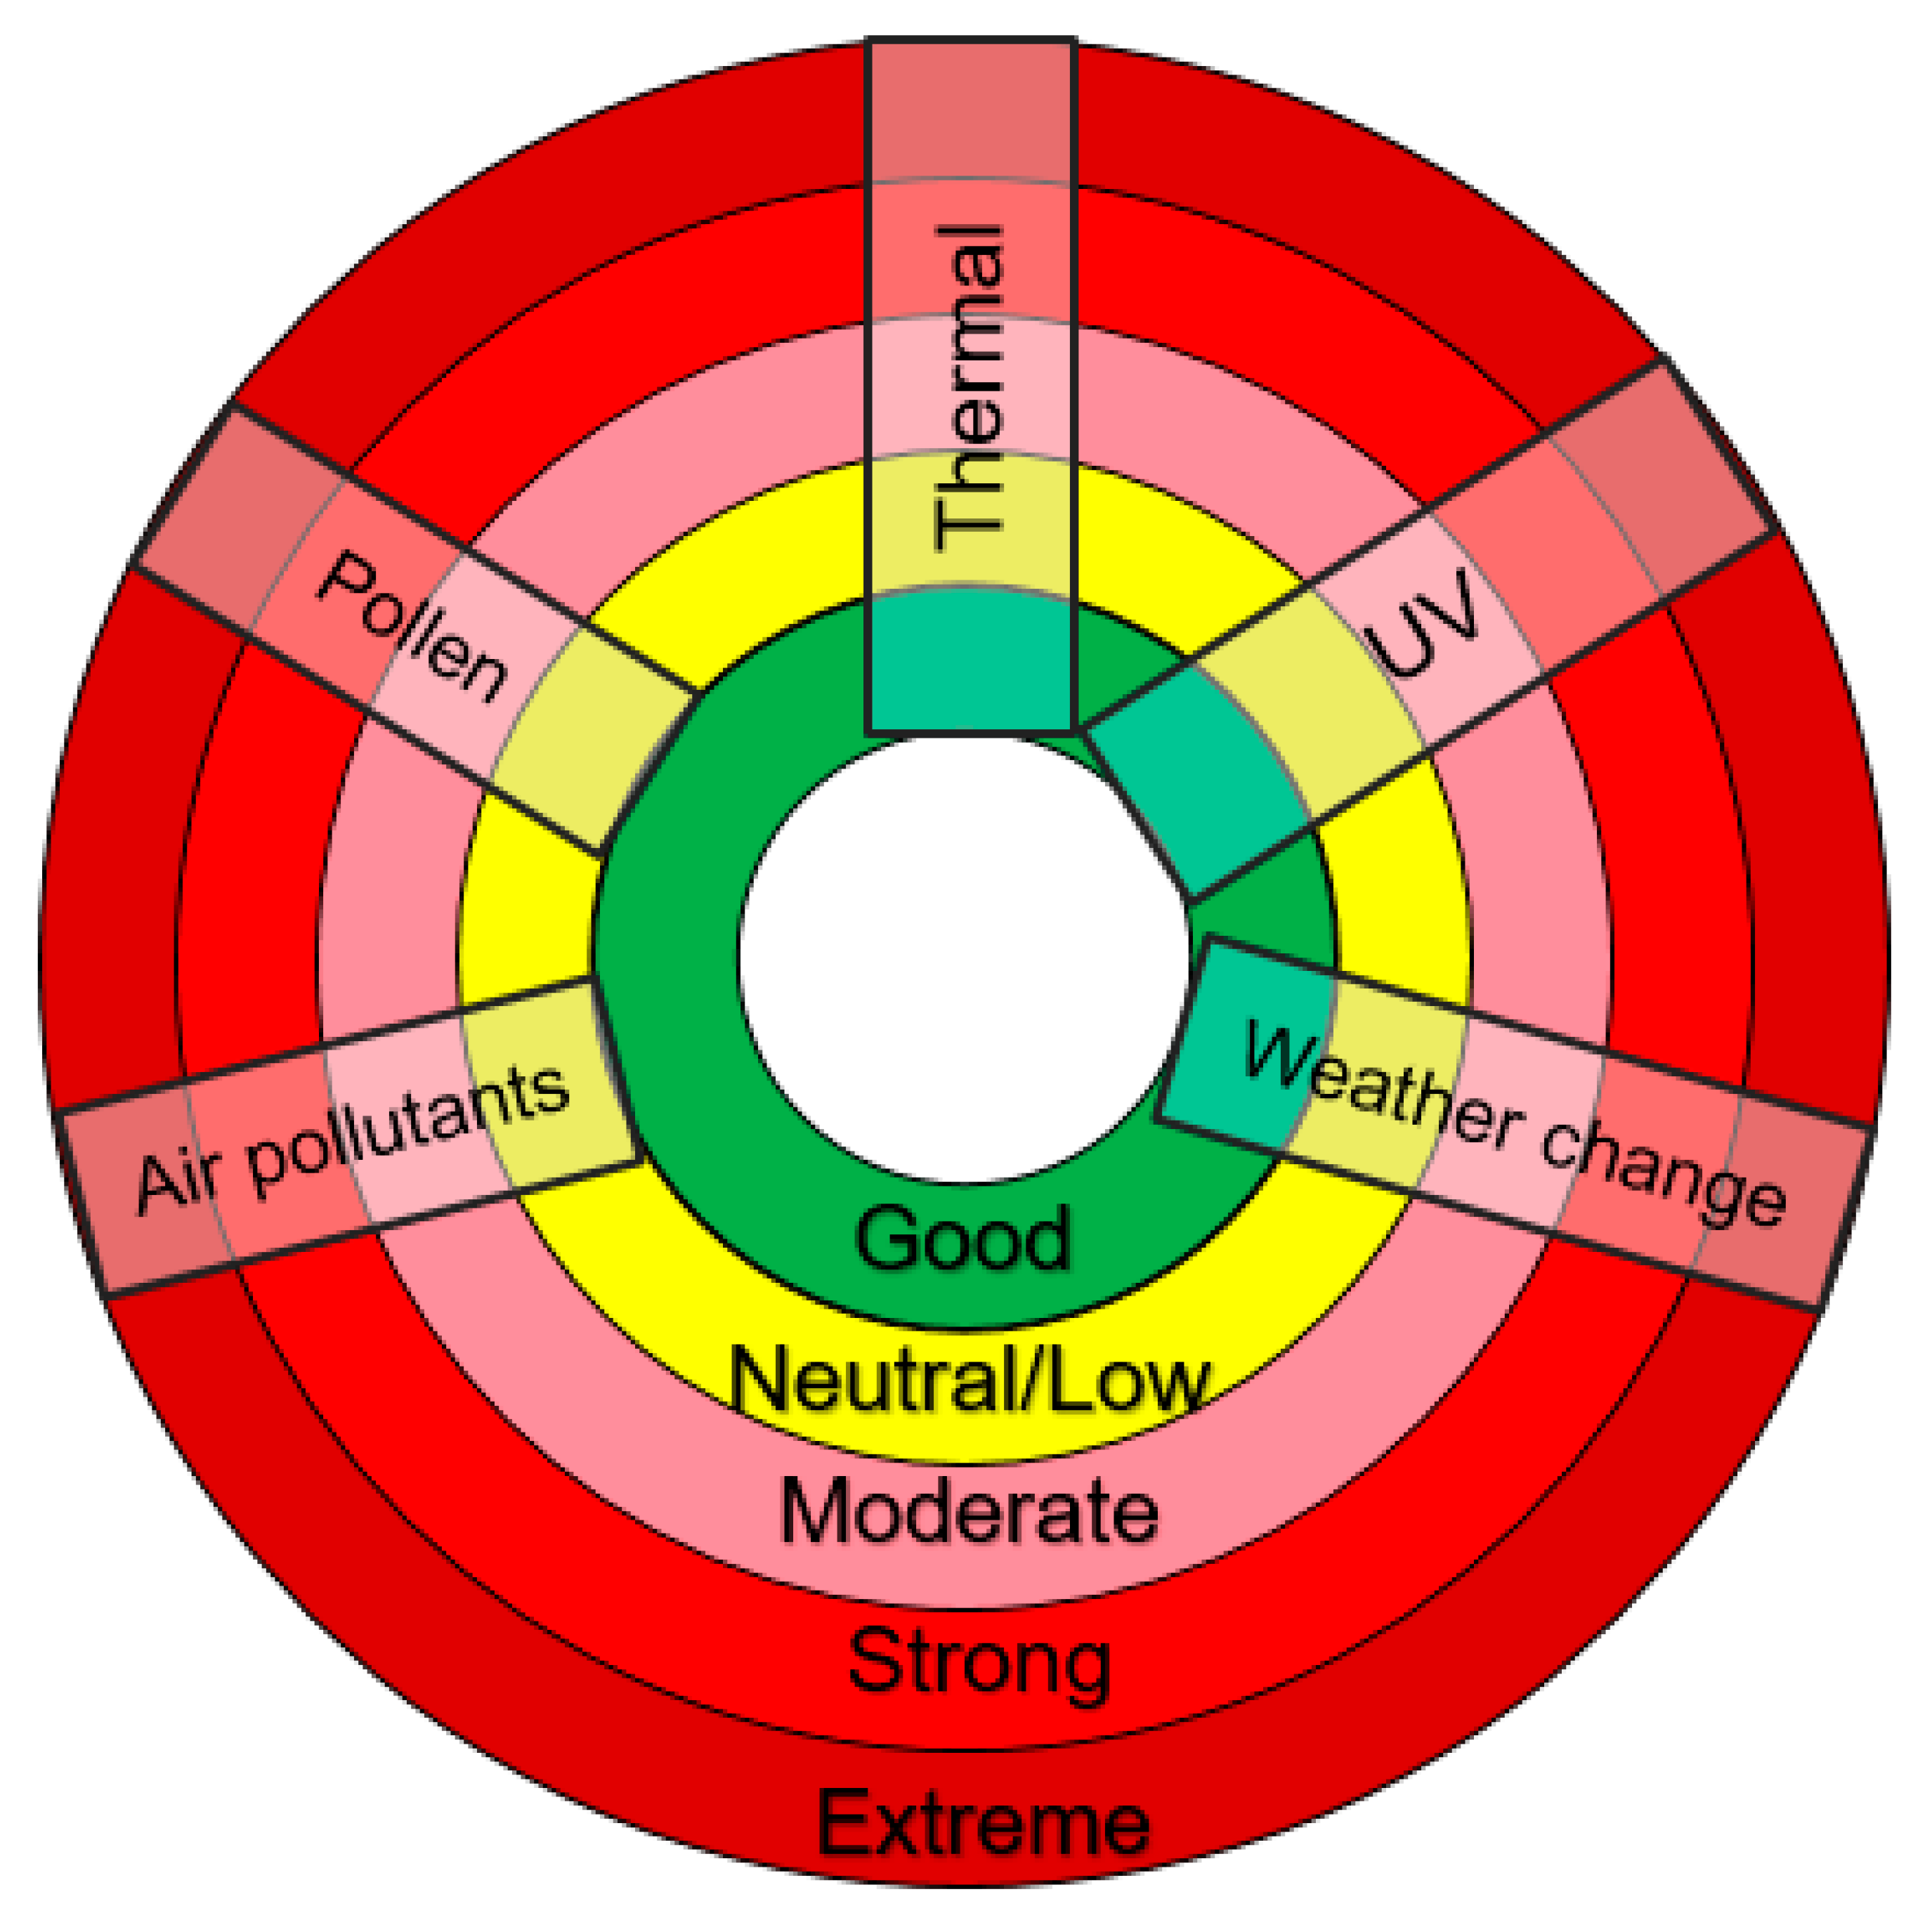
When summarizing the factors, they have to be separated between positive effects, which serve as a score, with a score of −1, or 0 to 1 for neutral or less negative effect conditions, depending on the factor. The traffic light approach is utilized with five colors (Figure 5). The medium scores are presented by the value of 2, representing a moderate level, and subsequently, the value of 3 indicates a strong level, and beyond that relays to extreme stress or physiological effect level. If the factor is higher than 4 then the scheme (Figure 5) can be run with an additional color. Yet it is nonetheless suggested that such an augmentation should keep the same color, yet be presented by a higher number. For two simultaneous stress factors an indication with a asterisk (*) can be added as demonstrated in Figure 5.
For single component or factor a simple visualization can be applied. The single scores can be given by the real number and scores, including the different colors of the level and the final general score, including multiple or combined factors (Figure 6).
As mentioned, for the first approach daily conditions or values are assumed. The weighting factors can differ and vary from region to region. Duration and exposure, including the recent history in previous days is a question that requires examination. For climate change, based on regional climate simulations only single factors can be applied thus relaying to the appropriateness of climate simulations. Seasonality and adaptation can be applied only for factors where there is enough evidence, requirement, or circumvention, i.e., UV. For quantification based on climate or long-term data, the approach can be applied with fewer limitations. Once again, this returns to issues of exposure and mobility of humans, including during both diurnal and nocturnal, which in the latter, can exclude air pollution levels that are encountered outdoors.
The suggested initial model is by definition more modest, and does not aim to cover the overall complexity of the topic. The respective aim is to launch an approach that is both applicable and practical based upon short-term weather forecasts and climatic contexts. It goes beyond solely considering the negative factors, and also considers the influences of positive aspects pertaining to thermal comfort, cold stimulus, weather sensitivity and desired UV radiation levels. Finally, the approach contemplates combined and/or simultaneous effects, and can consider also indoor conditions, when exposure times/data are available.
4. Discussion
Based upon the proposed methodology, several applications are required. The approach can be based on weather forecast information that includes daily information of warnings, which moreover can be configured around a daily basis for early and short-term warning systems. Methodically speaking, this infers that the limit values or thresholds be based upon a daily basis. The specific thresholds can be official (Air Pollution values) or based on specific studies and findings [37]. In terms of forecasts for extreme events for the subsequent days, it is argued that this daily information, which can include respective warning and broadcasting systems, is very useful and helpful [37].
For long-term analysis and quantification, the assessment is more complex and requires further steps to be undertaken. As part of such steps, the pivotal role of the identified negative effects can be extracted from the analyzed atmospheric factors and communicated in such a way that highlights their significance. In addition, the exposure should be quantified in terms of acknowledging the mobility and peripatetic behavior patterns of humans, along with other urban factors and exposures. Therefore, hourly data can be considered and quantified.
Nevertheless, it has to be considered that atmospheric factors have a regional differentiation depending on the geographical situation, land use, and topography. In the case of the latter, elevation affects the discussed factors differently. More specifically, while there is a clear impact upon factors such as temperature, radiation, and UV, the same type of symbiotic relationship is not applicable for the emission and circulation of neither pollen nor air pollutants. Moreover, in other cases, like weather sensitivity, it seems to also have limited or no effect.
An additional issue is the simultaneous effects of two main factors (i.e., heat exposure and UV, and heat exposure and ozone), which consequently raises the issue of how such effects can be tackled. In this primary approach, it is suggested that they have to be summarized/limited or conceived within a broader contextual sense. Furthermore, in many cases, due to data limitation both in the sense of quantity and quality/reliability, one must indisputably consider which factors should be considered, particularly given the specific end user in different analytical circumstances consideration. Yet, and in a broader overview, the disclosed approach or index should remain flexible.
In continuation to the previous point, the final delivered information should ultimately aid decision making, including, but not limited to; (i) aiding warning system broadcasts based on weather forecasts; (ii) climate quantification purposes which relay upon other disciplines such as planning efforts which can also enhance their means to address future climatic conditions, and the aggravations of already existing biometeorological exacerbations in urban environments. Notwithstanding, and even based upon this flexible approach, not all factors can be included due to the availability and relevance under a specific condition, region, and climate.
5. Conclusions
The aim of this communication was to provide a methodological approach in quantifying the impact of the atmospheric environment (i.e., thermal conditions, air pollution, pollen, UV, and weather sensitivity) upon humans. It is clear that not only one single atmospheric factor that affects human health, in fact, even the effects caused by a combination of factors on human wellbeing is not linear either. It is well acknowledged by scientific community that, in some cases, humans present a considerable capacity to adapt to new conditions. Nevertheless, and inculcated to the constitution of the human physiological and biometeorological system, such adaptive capacity does not apply to extreme conditions, particularly in the case of heat stress conditions which are harder to counteract. Effects occurring at the same time can have combined implications and cannot be counted as linear effects.
In addition to adaptation, humans can react and adjust immediately. However, such a versatility is not the same for members of the public that are in poorer health conditions, and will respectively require additional time for recovery and rehabilitation when prone to more extraneous atmospheric factors. Seasonality, temporal and regional variability build also factors which play a significant role in the effect and quantification methods. Based on the concept of exposure/dosis, the delineated duration and frequency of exposure is essential when assessing both the short- and long-term effects, including the methods of evaluations themselves. Short-term implications can be run based on weather forecast possibilities, and in the case of climatic approaches, higher resolutions in the context of temporal and regional variability can be utilized. Another vital issue (which can be solved based on weighting different interconnecting factors) is the dynamic and peripatetic exposure to indoor and outdoor conditions, especially during extreme events. Finally, the combined effects of several factors and complexes play an immanent role and can deliver a more clear and sophisticated assessment outlook.
Not all factors and effects can be implemented in that kind of approach. Ultimately, an encompassing decision has to be made, namely, regarding the identification of which are the most relevant factors for a specific region and/or area. The implemented factors must also be assessed based on the availability (and reliability) of the retrievable data for such a desired study. In addition, the approach is more or less flexible in terms of the consideration and/or inclusion of factors depending on the importance and reliability for specific climates and regions. In association, and as also discussed, the type of end user must be considered, which in turn, shall unequivocally have implications upon how the respective information shall be interpreted and/or applied.
The disclosed topic is very complex, and it requires the inclusion of specific experts and disciplines in the discussion about the development of an integral index or wholesome approach. The topic presented here wants to restart the discussion about the integral and combined effects, and reengage the focus on this specific topic. The prevailing advantage associated to this topic is the existing know-how in some of the individual topics, which in turn, is valid and adaptable to other similar effective complexes.
As suggested in the present approach, it is not aimed at covering the overall complexity of the topic. Instead, the more modest, yet provocative, aim is to launch an early approach that is applicable and practical given the growing importance in addressing the association between atmospheric factors upon human wellbeing and health. One approach which, moreover, can be applied based on short-term weather forecasts and climate approaches. It includes not only negative factors but also positive aspects, i.e., thermal comfort, cold stimulus, and positive effects of UV radiation. The approach considers the combined effects, and can consider also indoor conditions, when exposure times and data are available.
Ultimately, the real aim is the quantification of negative effects, without forgetting the valuable inclusion also of positive effects that also play a key role in our daily lives.
Author Contributions
Conceptualization, A.M.; methodology, A.M.; validation, A.M.; formal analysis, A.M.; investigation, A.M.; resources, A.M.; data curation, A.M.; writing—original draft preparation, A.M.; writing—review and editing, A.M.; visualization, A.M.; supervision, A.M.; project administration, A.M.; funding acquisition, A.M. All authors have read and agreed to the published version of the manuscript.
Funding
This research received no external funding.
Acknowledgments
Thanks to all the colleagues and the intensive discussion in the specific topic in the last 25 years. The first approach was developed and started in 1999.
Conflicts of Interest
The authors declare no conflict of interest.
References
- VDI. Guideline 3787/Part 2. Environmental Meteorology, Methods for the Human Biometeorological Evaluation of Climate and Air Quality for Urban and Regional Planning at Regional Level: Part I: Climate; Kommission Reinhaltung der Luft im VDI und DIN-Normenausschuss KRdL. VDI/DIN Handbuch Reinhaltung der Luft, Umweltmeteorologie, Beuth-Verlag; Verlag des Vereins Deutscher Ingenieure: Düsseldorf, Germany, 2008; Volume 1B. [Google Scholar]
- Santos Nouri, A.; Costa, J.P.; Santamouris, M.; Matzarakis, A. Approaches to Outdoor Thermal Comfort Thresholds through Public Space Design: A Review. Atmosphere 2018, 9, 108. [Google Scholar] [CrossRef] [Green Version]
- Bucher, K.; Haase, C. Meteorotropy and medical-meteorological forecasts. Experientia 1993, 49, 759–768. [Google Scholar] [CrossRef] [PubMed]
- Staiger, H.; Laschewski, G.; Matzarakis, A. Selection of Appropriate Thermal Indices for Applications in Human Biometeorological Studies. Atmosphere 2019, 10, 18. [Google Scholar] [CrossRef] [Green Version]
- De Freitas, C.R.; Grigorieva, E.A. A comprehensive catalogue and classification of human thermal climate indices. Int. J. Biometeorol. 2015, 59, 109–120. [Google Scholar] [CrossRef] [PubMed]
- De Freitas, C.R.; Grigorieva, E.A. A comparison and appraisal of a comprehensive range of human thermal climate indices. Int. J. Biometeorol. 2016, 61, 487–512. [Google Scholar] [CrossRef]
- Matzarakis, A. Selection and application of appropriate thermal indices for urban studies. Urban Clim. News 2019, 71, 22–24. [Google Scholar]
- Potchter, O.; Cohen, P.; Lin, T.P.; Matzarakis, A. Outdoor human thermal perception in various climates: A comprehensive review of approaches, methods and quantification. Sci. Total Environ. 2018, 631–632, 390–406. [Google Scholar] [CrossRef]
- Chen, Y.C.; Matzarakis, A. Modified physiologically equivalent temperature-Basics and applications for western European climate. Theor. Appl. Climatol. 2018, 132, 1275–1289. [Google Scholar] [CrossRef]
- Ambach, W.; Blumthaler, M. Biological effectiveness of solar UV radiation in humans. Experienta 1993, 49, 747–753. [Google Scholar] [CrossRef]
- Vitt, R.; Laschewski, G.; Bais, A.; Diémoz, H.; Fountoulakis, I.; Siani, A.; Matzarakis, A. UV-Index Climatology for Europe Based on Satellite Data. Atmosphere 2020, 11, 727. [Google Scholar] [CrossRef]
- Calbo, J.; Pagés, D.; Gonzáles, J.-A. Empirical studies of cloud effects on UV radiation: A review. Rev. Geophys. 2005, 43. [Google Scholar] [CrossRef] [Green Version]
- Holick, M. Sunlight, UV-Radiation, Vitamin D and Skin Cancer: How Much Sunlight Do We Need? In Sunlight, Vitamin D and Skin Advances in Experimental Medicine and Biology; Reichrath, J., Ed.; Springer: New York, NY, USA, 2008; Volume 624.1. [Google Scholar]
- Litynska, Z.; Koepke, P.; De Backer, H.; Groebner, J.; Schmalwieser, A.; Vuilleumier, L. Long Term Changes and Climatology of UV Radiation over Europe; COST 726 Final Report; Publications Office of the European Union: Luxembourg, 2012. [Google Scholar]
- Armstrong, B.K.; Kricker, A. The epidemiology of UV induced skin cancer. J. Photochem. Photobiol. B Biol. 2001, 63, 8–18. [Google Scholar] [CrossRef]
- WHO World Health Organization. Global Solar UV Index: A Practical Guide. A Joint Recommendation of the World Health Organization; World Meteorological Organization, United Nations Environmental Programme, and the International Commission on Non-Ionizing Radiation Protection; World Health Organization: Geneva, Switzerland, 2002; ISBN 92-4-159007 6. [Google Scholar]
- CIE International Commission on Illumination. A Reference Action Spectrum for Ultraviolet Induced Erythema in Human Skin; Elsevier Science: Amsterdam, The Netherlands, 1987; pp. 17–22. [Google Scholar]
- WHO World Health Organization. Ultraviolet Radiation. Environmental Health Criteria (EHC) 160; World Health Organization: Geneva, Switzerland, 1994. [Google Scholar]
- Bucher, K.; Wanka, E. Das Problem der Wetterfühligkeit. Promet 2007, 33, 133–139. [Google Scholar]
- Mayer, H. Urban bioclimatology. Experientia 1993, 49, 957–963. [Google Scholar] [CrossRef]
- Hall, J.V. Assessing health effects of air pollution. Atmos. Environ. 1996, 30, 743–746. [Google Scholar] [CrossRef]
- Mayer, H. Human-biometeorologische Probleme des Stadtklimas. Geowissenschaften 1996, 14, 233–239. [Google Scholar]
- Akimoto, H. Global Air Quality and Pollution. Science 2003, 302, 1716–1719. [Google Scholar] [CrossRef] [Green Version]
- EEA. Air Quality in Europe; EEA Report; European Environment Agency: Copenhagen, Denmark, 2018. [CrossRef]
- Sénéchal, H.; Visez, N.; Charpin, D.; Shahali, Y.; Peltre, G.; Biolley, J.P.; Lhuissier, F.; Coudrec, R.; Yamada, O.; Malrat-Domenge, A.; et al. A Review of the Effects of Major Atmospheric Pollutants on Pollen Grains, Pollen Content, and Allergenicity. Sci. World J. 2015, 2015, 940243. [Google Scholar] [CrossRef] [Green Version]
- Main, C.E. Aerobiological, ecological, and health linkages. Environ. Int. 2003, 29, 347–349. [Google Scholar] [CrossRef]
- Womiloju, T.O.; Miller, J.D.; Mayer, P.M.; Brook, J.R. Methods to determine the biological composition of particulate matter collected from outdoor air. Atmos. Environ. 2003, 37, 4335–4344. [Google Scholar] [CrossRef]
- Behrendt, H.; Becker, W.-M. Localization, release and bioavailability of pollen allergens: The influence of environmental factors. Curr. Opin. Immunol. 2001, 13, 709–715. [Google Scholar] [CrossRef]
- Breiteneder, H.; Scheiner, O. Environmental pollution and pollen allergy—A possible link. Allergo J. 1998, 7, 271–274. [Google Scholar] [CrossRef]
- Emberlin, J. The effects of air pollution on allergenic pollen. Eur. Respir. Rev. 1998, 8, 164–167. [Google Scholar]
- VDI. Guidelines 3883/Part 2. Effects and Assessment of Odours; Determination of Annoyance Parameters by Questioning; Repeated Brief Questioning of Neighbour Panellists; VDI/DIN Kommission Reinhaltung der Luft (KRdL)—Normenausschuss, VDI Handbuch Biotechnologie, VDI/DIN—Handbuch Reinhaltung der Luft—Band 1A: Maximale Immissions-Werte; Band 1B: Umweltmeteorologie; Beuth-Verlag: Berlin, Germany, 1993. [Google Scholar]
- IMBW. Städtebauliche Klimafibel; Innenministerium Baden-Württemberg: Stuttgart, Germany, 2012. [Google Scholar]
- Bottema, M. Wind Climate and Urban Geometry; Rapport Nr. 92.63.K; Vakgroep Fago; Technische Universiteit: Eindhoven, The Netherlands, 1992. [Google Scholar]
- Matzarakis, A.; Mayer, H.; Sczepanski, P. Urban air pollution and forests. Adv. Air Pollut. 1999, 6, 303–312. [Google Scholar]
- Mayer, H.; Matzarakis, A.; Kalberlah, F. Human-Biometeorological Assessment of the Air Pollution Component of the Urban Climate by the Index DAQX; 50 Newsletter; Eurasap: Aveiro, Portugal, 2003. [Google Scholar]
- Matzarakis, A.; Endler, C. Adaptation of thermal bioclimate under climate change conditions—The example of physiologically equivalent temperature in Freiburg, Germany. Int. J. Biometeorol. 2010, 54, 479–483. [Google Scholar] [CrossRef]
- Matzarakis, A.; Laschewski, G.; Muthers, S. The Heat Health Warning System in Germany—Applications and Warnings for 2005 to 2019. Atmosphere 2020, 11, 170. [Google Scholar] [CrossRef] [Green Version]
Figure 1.
Range of exposure for physiologically equivalent temperature (PET) and modified PET (mPET) in positive and negative conditions of thermal component (illustration depicts only the effect range on negative and positive). Data source: mean daily data for Freiburg.
Figure 1.
Range of exposure for physiologically equivalent temperature (PET) and modified PET (mPET) in positive and negative conditions of thermal component (illustration depicts only the effect range on negative and positive). Data source: mean daily data for Freiburg.

Figure 2.
Range of exposure of cold and warm conditions in positive and negative conditions of thermal component (illustration depicts only the effect range on negative (>0) and positive (<0)).
Figure 2.
Range of exposure of cold and warm conditions in positive and negative conditions of thermal component (illustration depicts only the effect range on negative (>0) and positive (<0)).

Figure 3.
Range of exposition based on existing thresholds and limit values and no positive effects.
Figure 3.
Range of exposition based on existing thresholds and limit values and no positive effects.

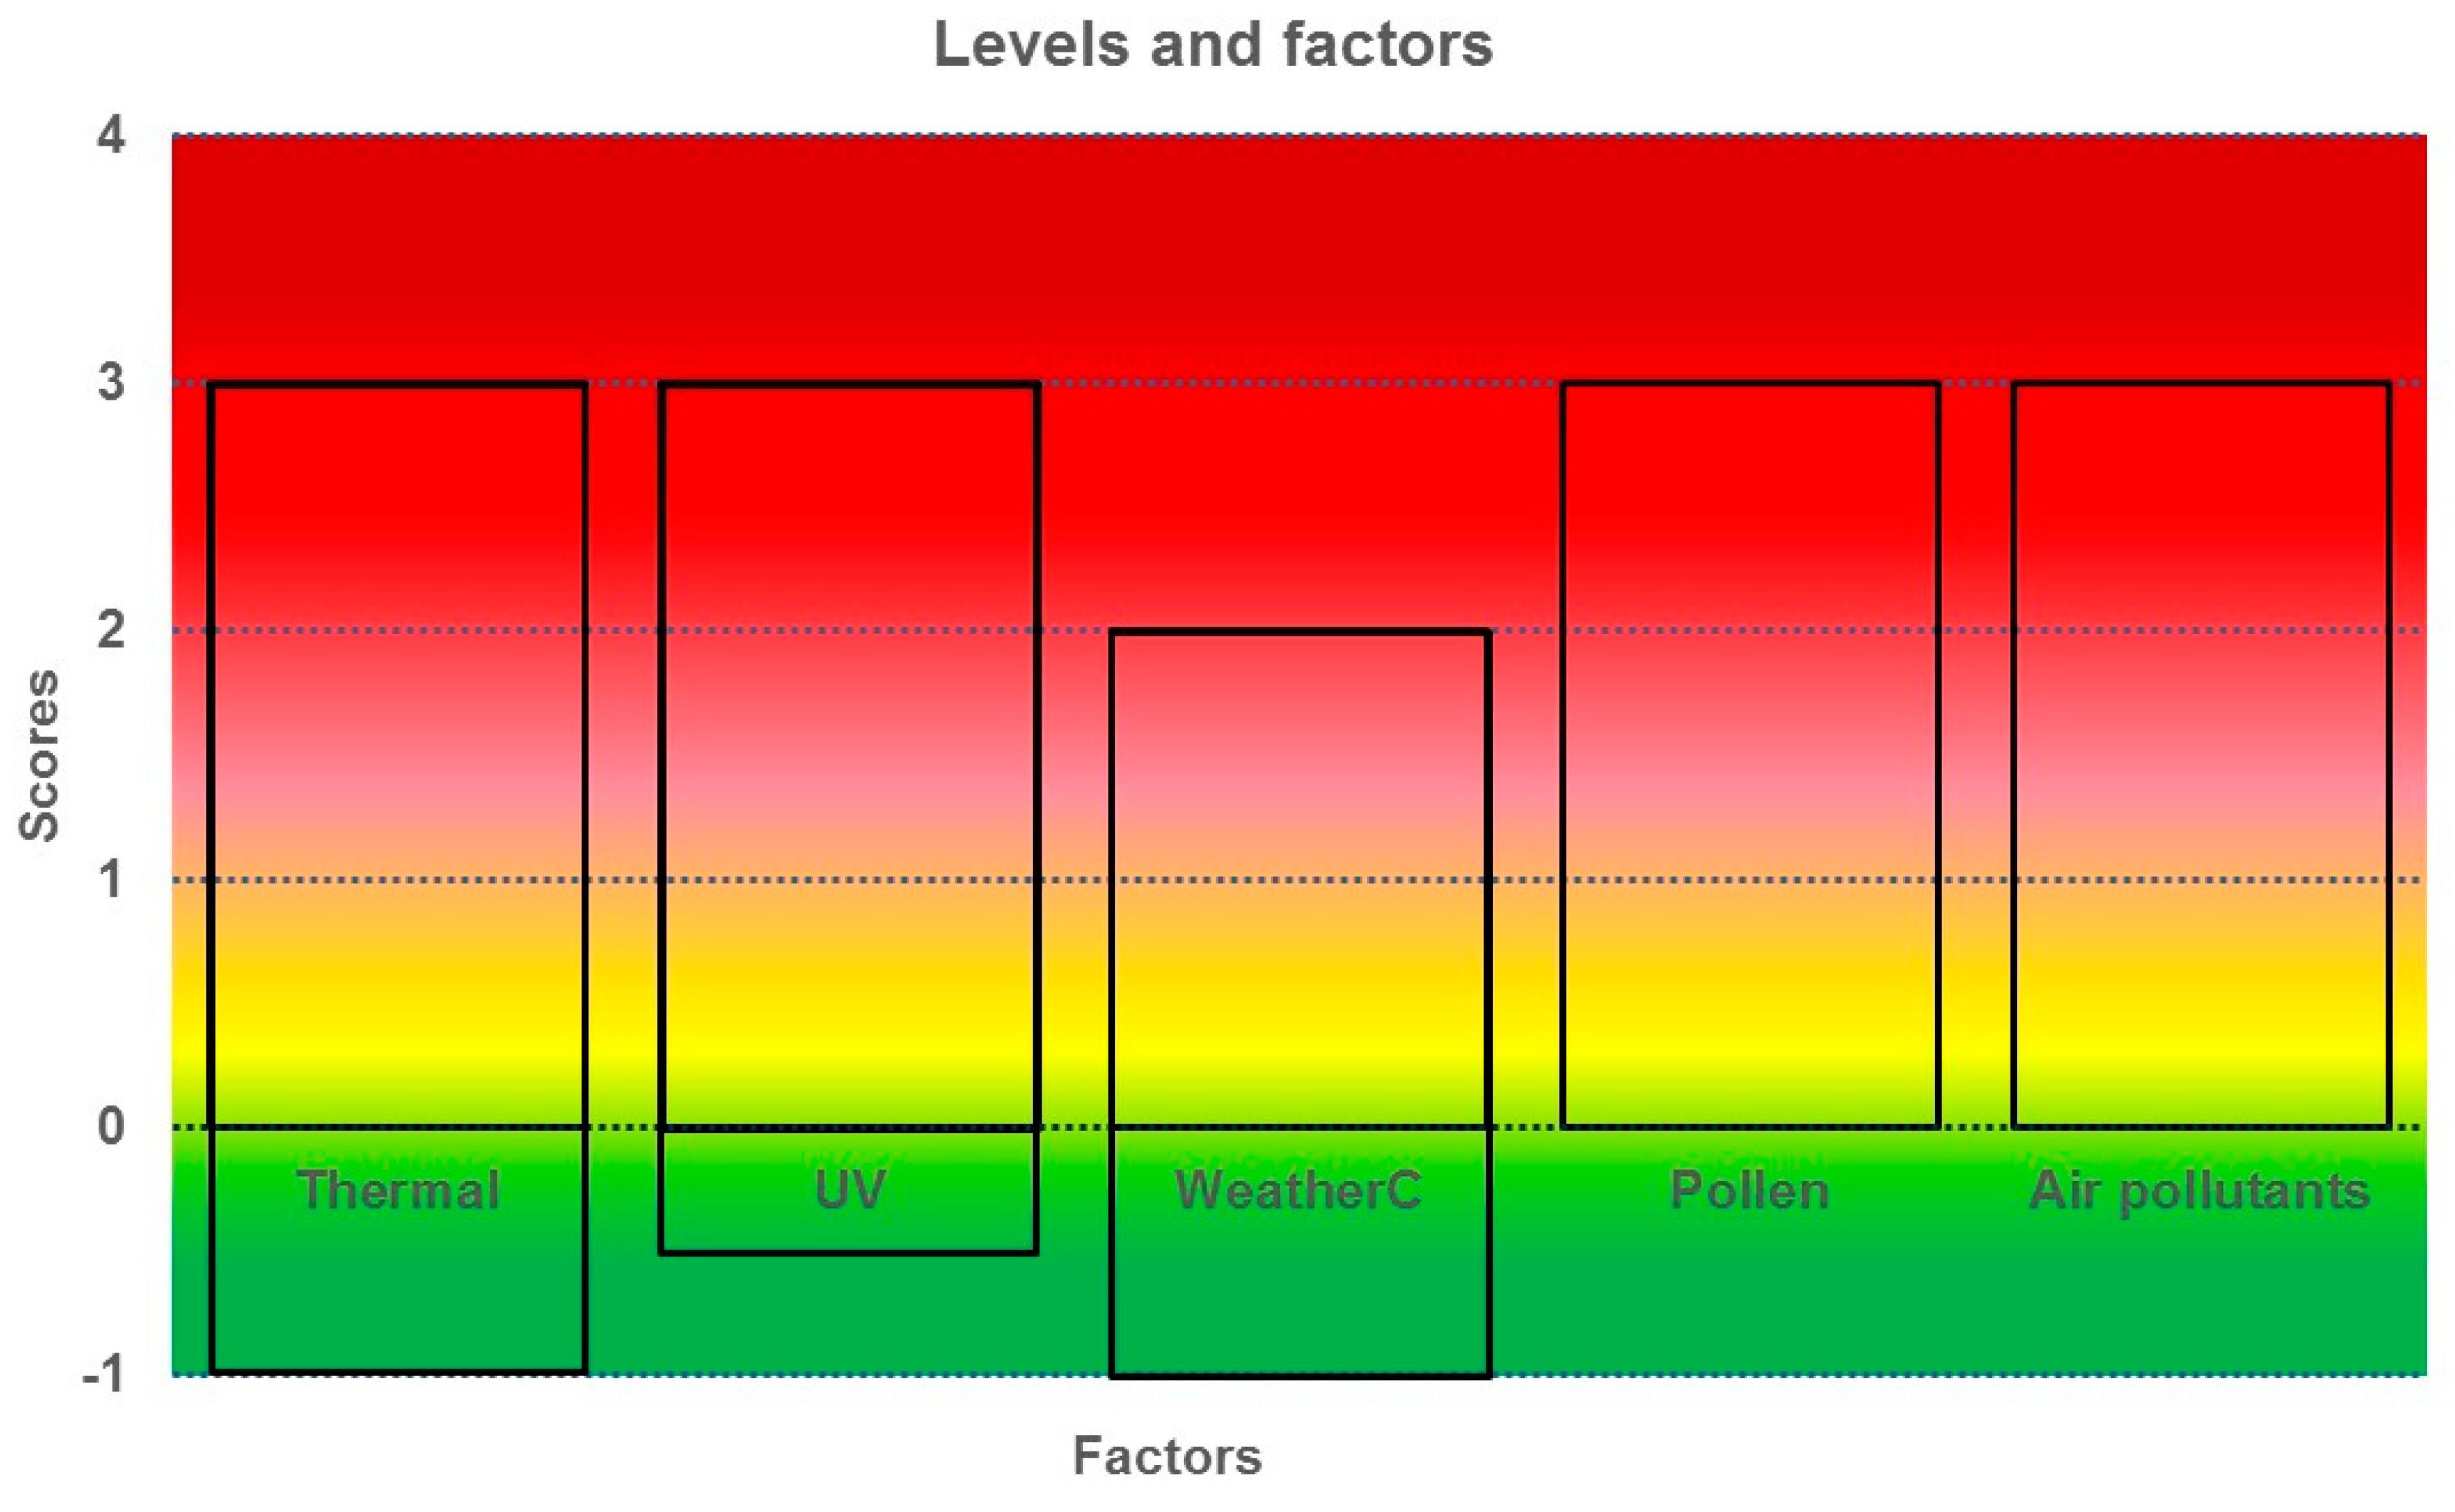
Figure 4.
Scores and levels of different components and factors. In some cases, the score can be negative indicating positive effects. The scores are only an exemplary indication of the different levels.
Figure 4.
Scores and levels of different components and factors. In some cases, the score can be negative indicating positive effects. The scores are only an exemplary indication of the different levels.

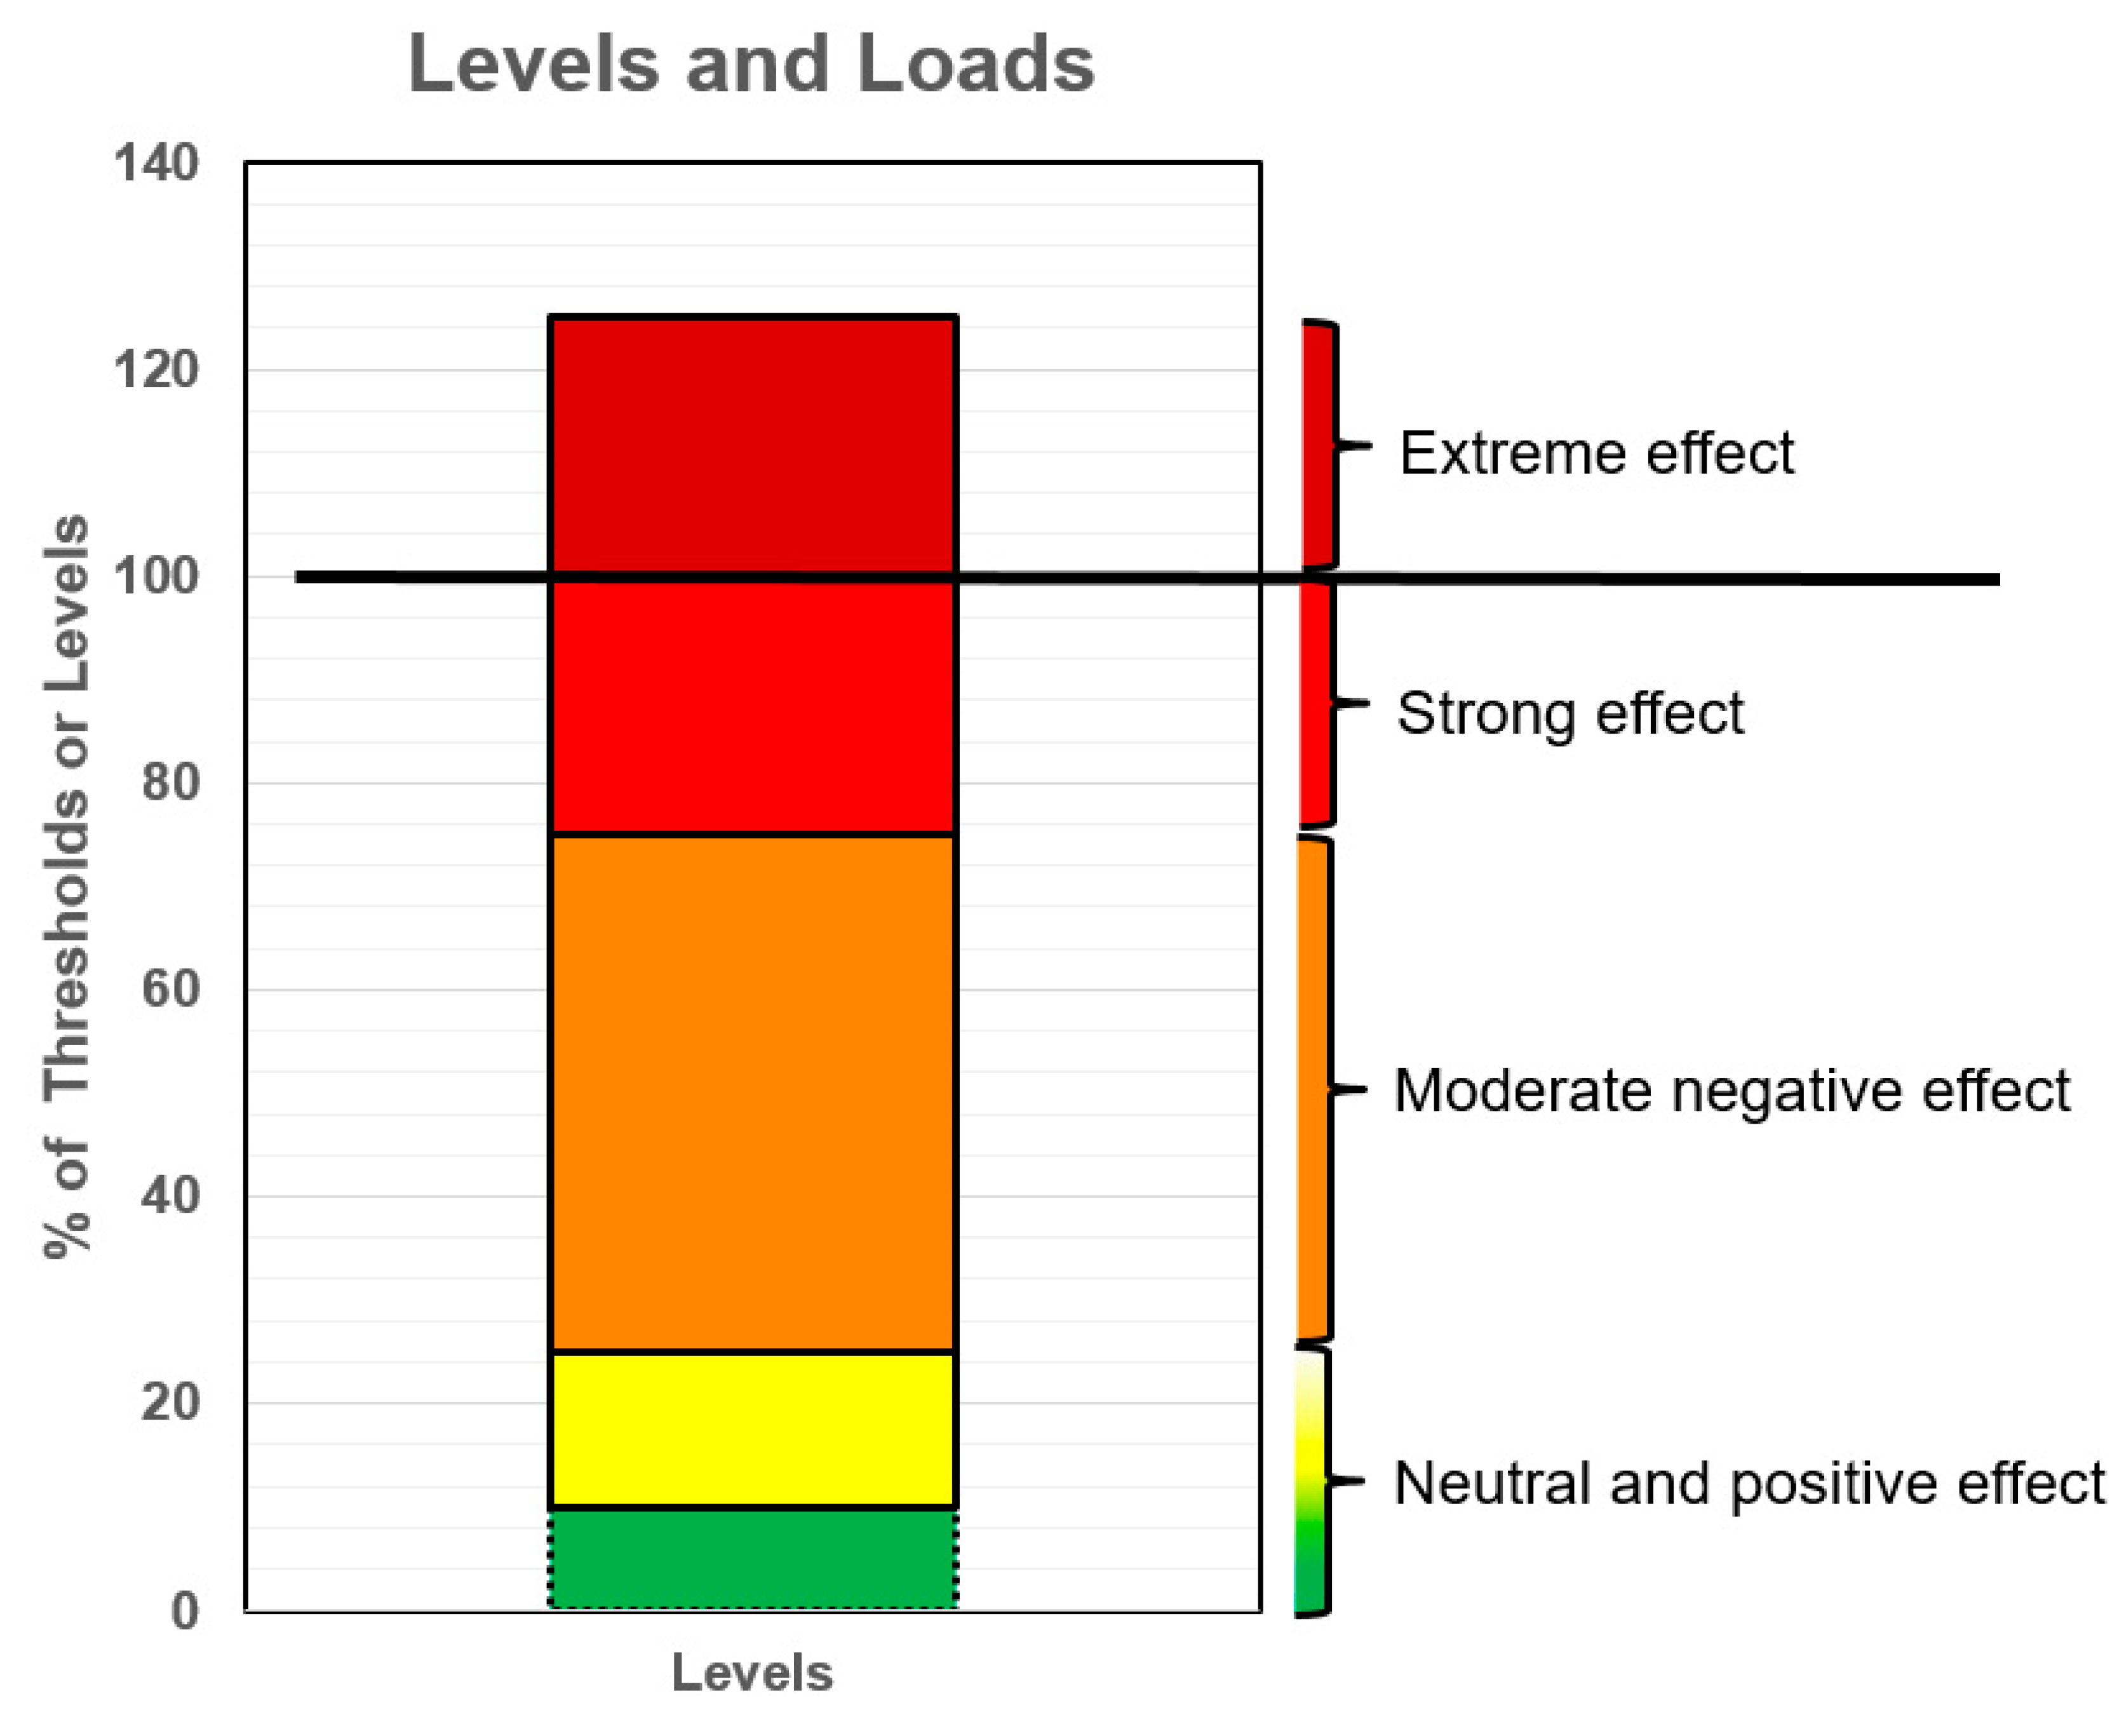
Figure 5.
Classification approach.

Figure 6.
Classification approach for single and general visualization.


Table 1.
Factors affecting thermal. Months refer to northern hemisphere.
| Range/Grade | −1 | 0 | 1 | 2 | 3 |
|---|---|---|---|---|---|
| Cold | Positive/Slight | Neutral | Medium | Strong | Very strong |
| Hot | Neutral/Slight | Medium | Strong | Very strong | |
| Seasonality | Summer | ||||
| Day/night | Summer | ||||
| Avoidance/Indoor | Cold yes, heat no | ||||
| Duration (for extreme heat/cold) | For 2 days: +0.1, 3 d: +0.2, >3 d: +0.2 to 5 days, >5 days: +0.5 | ||||
| Adaptation | May: +0.2, June: 0.1, July: 0.0, August: 0.0, Sep: −0.1 | ||||
| Consternation | May, June: +0.2, July, August: +0.1 | ||||
Table 2.
Factors affecting UV. Months refer to northern hemisphere.
| Range/Grade | −1 | 0 | 1 | 2 | 3 |
|---|---|---|---|---|---|
| UV Index | <3 | - | 3–6 | 6–8 | >8 |
| Subeffect (if Heat) | - | - | +0.5 | +0.5 | +0.5 |
| Seasonality | April and May: +0.5 | ||||
| Avoidance/Indoor | Yes, shade and indoors | ||||
| Adaptation | Yes, July–August (0.0) | ||||
| Consternation | Individual, personal | ||||
Table 3.
Factors affecting weather sensitivity.
| Range/Grade | −1 | 0 | 1 | 2 | |
|---|---|---|---|---|---|
| Class | Positive | Neutral | Light | Strong | |
| Subeffect (if Heat) | +0.5 | +0.5 | +0.5 | ||
| Seasonality | Winter more intense, Summer less intense | ||||
| Duration | 2–3 days, 0.1 for 2 Weather Sensitivities | ||||
| Avoidance/Indoor | No, (everywhere), partly indoors | ||||
| Adaptation | No, partly by training | ||||
| Consternation | Individual, personal, 20%, 50% | ||||
Table 4.
Factors affecting pollen.
| Range/Grade | 0 | 0.5 | 1 | 2 | 3 |
|---|---|---|---|---|---|
| Class | Fly | Medium | >Strong | >Extreme | |
| Seasonality | Yes | ||||
| Duration | No | ||||
| Avoidance/Indoor | No, or indoors | ||||
| Adaptation | Medication | ||||
| Embarrassment | High | ||||
| Complexity | 2 Pollen = +0.25 | ||||
Table 5.
Factors affecting air pollutants.
| Range/Grade | 0 | 1 | 2 | 3 | |
|---|---|---|---|---|---|
| Class | <25% | 25%–75% | 100% | >100% | |
| Season | NO2: S-W, O3: S, PM: S, W | ||||
| Duration | <1 d | ||||
| Daily pattern | Yes | ||||
| Avoidance/Indoor | Behavior/Indoor | ||||
| Adaptation | No, partly by medical effects/importance | ||||
| Embarrassment | High | ||||
| Quantity | Gases: 2/3; +0.25, PM: 2/3: +0.5 | ||||
Table 6.
Combined atmospheric stresses.
| Multifactors (for > 2) | >2 | >2 |
|---|---|---|
| PM | gases | UV/Pollen/thermal |
| +0.5 | +0.25 | +0.25 |
| If one factor > 3 | Then all index > 3 | If two factors > 3 then indication with asterisk (*) |
Publisher’s Note: MDPI stays neutral with regard to jurisdictional claims in published maps and institutional affiliations. |
© 2020 by the author. Licensee MDPI, Basel, Switzerland. This article is an open access article distributed under the terms and conditions of the Creative Commons Attribution (CC BY) license (http://creativecommons.org/licenses/by/4.0/).
Share and Cite
MDPI and ACS Style
Matzarakis, A. A Note on the Assessment of the Effect of Atmospheric Factors and Components on Humans. Atmosphere 2020, 11, 1283. https://doi.org/10.3390/atmos11121283
AMA Style
Matzarakis A. A Note on the Assessment of the Effect of Atmospheric Factors and Components on Humans. Atmosphere. 2020; 11(12):1283. https://doi.org/10.3390/atmos11121283
Chicago/Turabian StyleMatzarakis, Andreas. 2020. "A Note on the Assessment of the Effect of Atmospheric Factors and Components on Humans" Atmosphere 11, no. 12: 1283. https://doi.org/10.3390/atmos11121283
Note that from the first issue of 2016, this journal uses article numbers instead of page numbers. See further details here.