Accumulation Characteristics of Metals and Metalloids in Plants Collected from Ny-Ålesund, Arctic


Abstract
:1. Introduction
2. Experiments
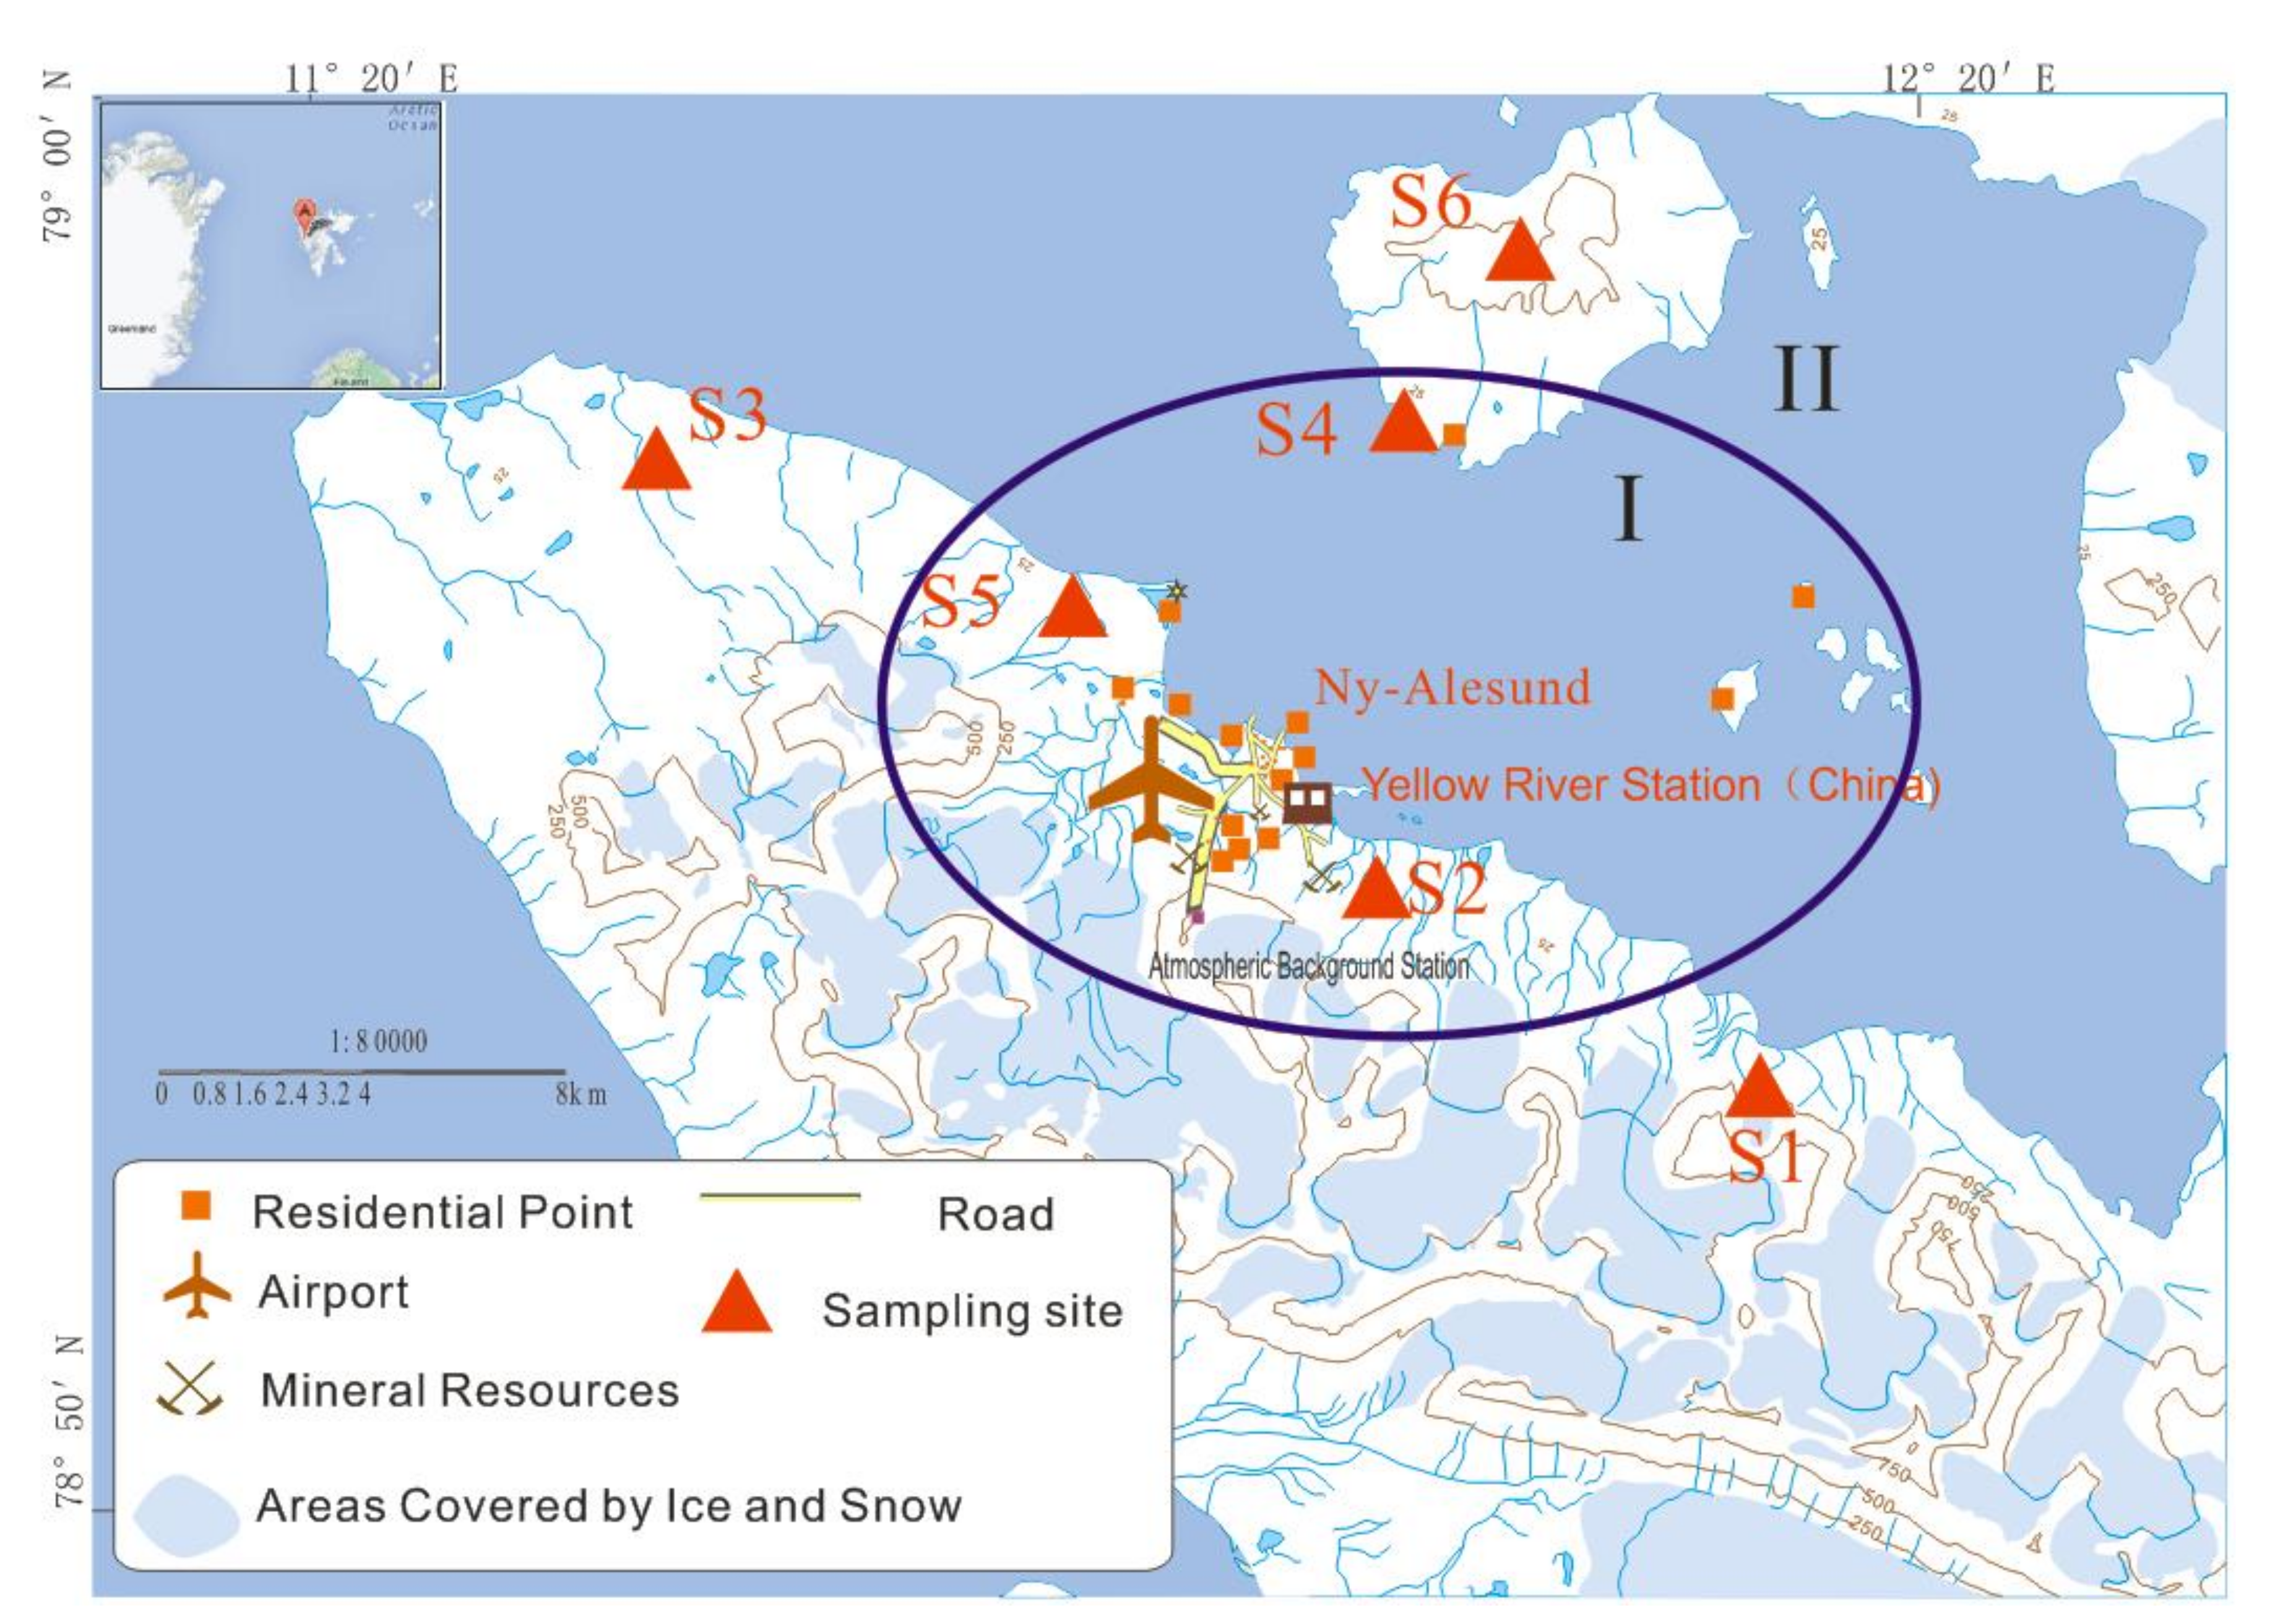
2.1. Study Area
2.2. Sample Collection
2.3. Sample Analysis
2.4. Enrichment Factor Analysis
2.5. Multivariate Statistical Analysis
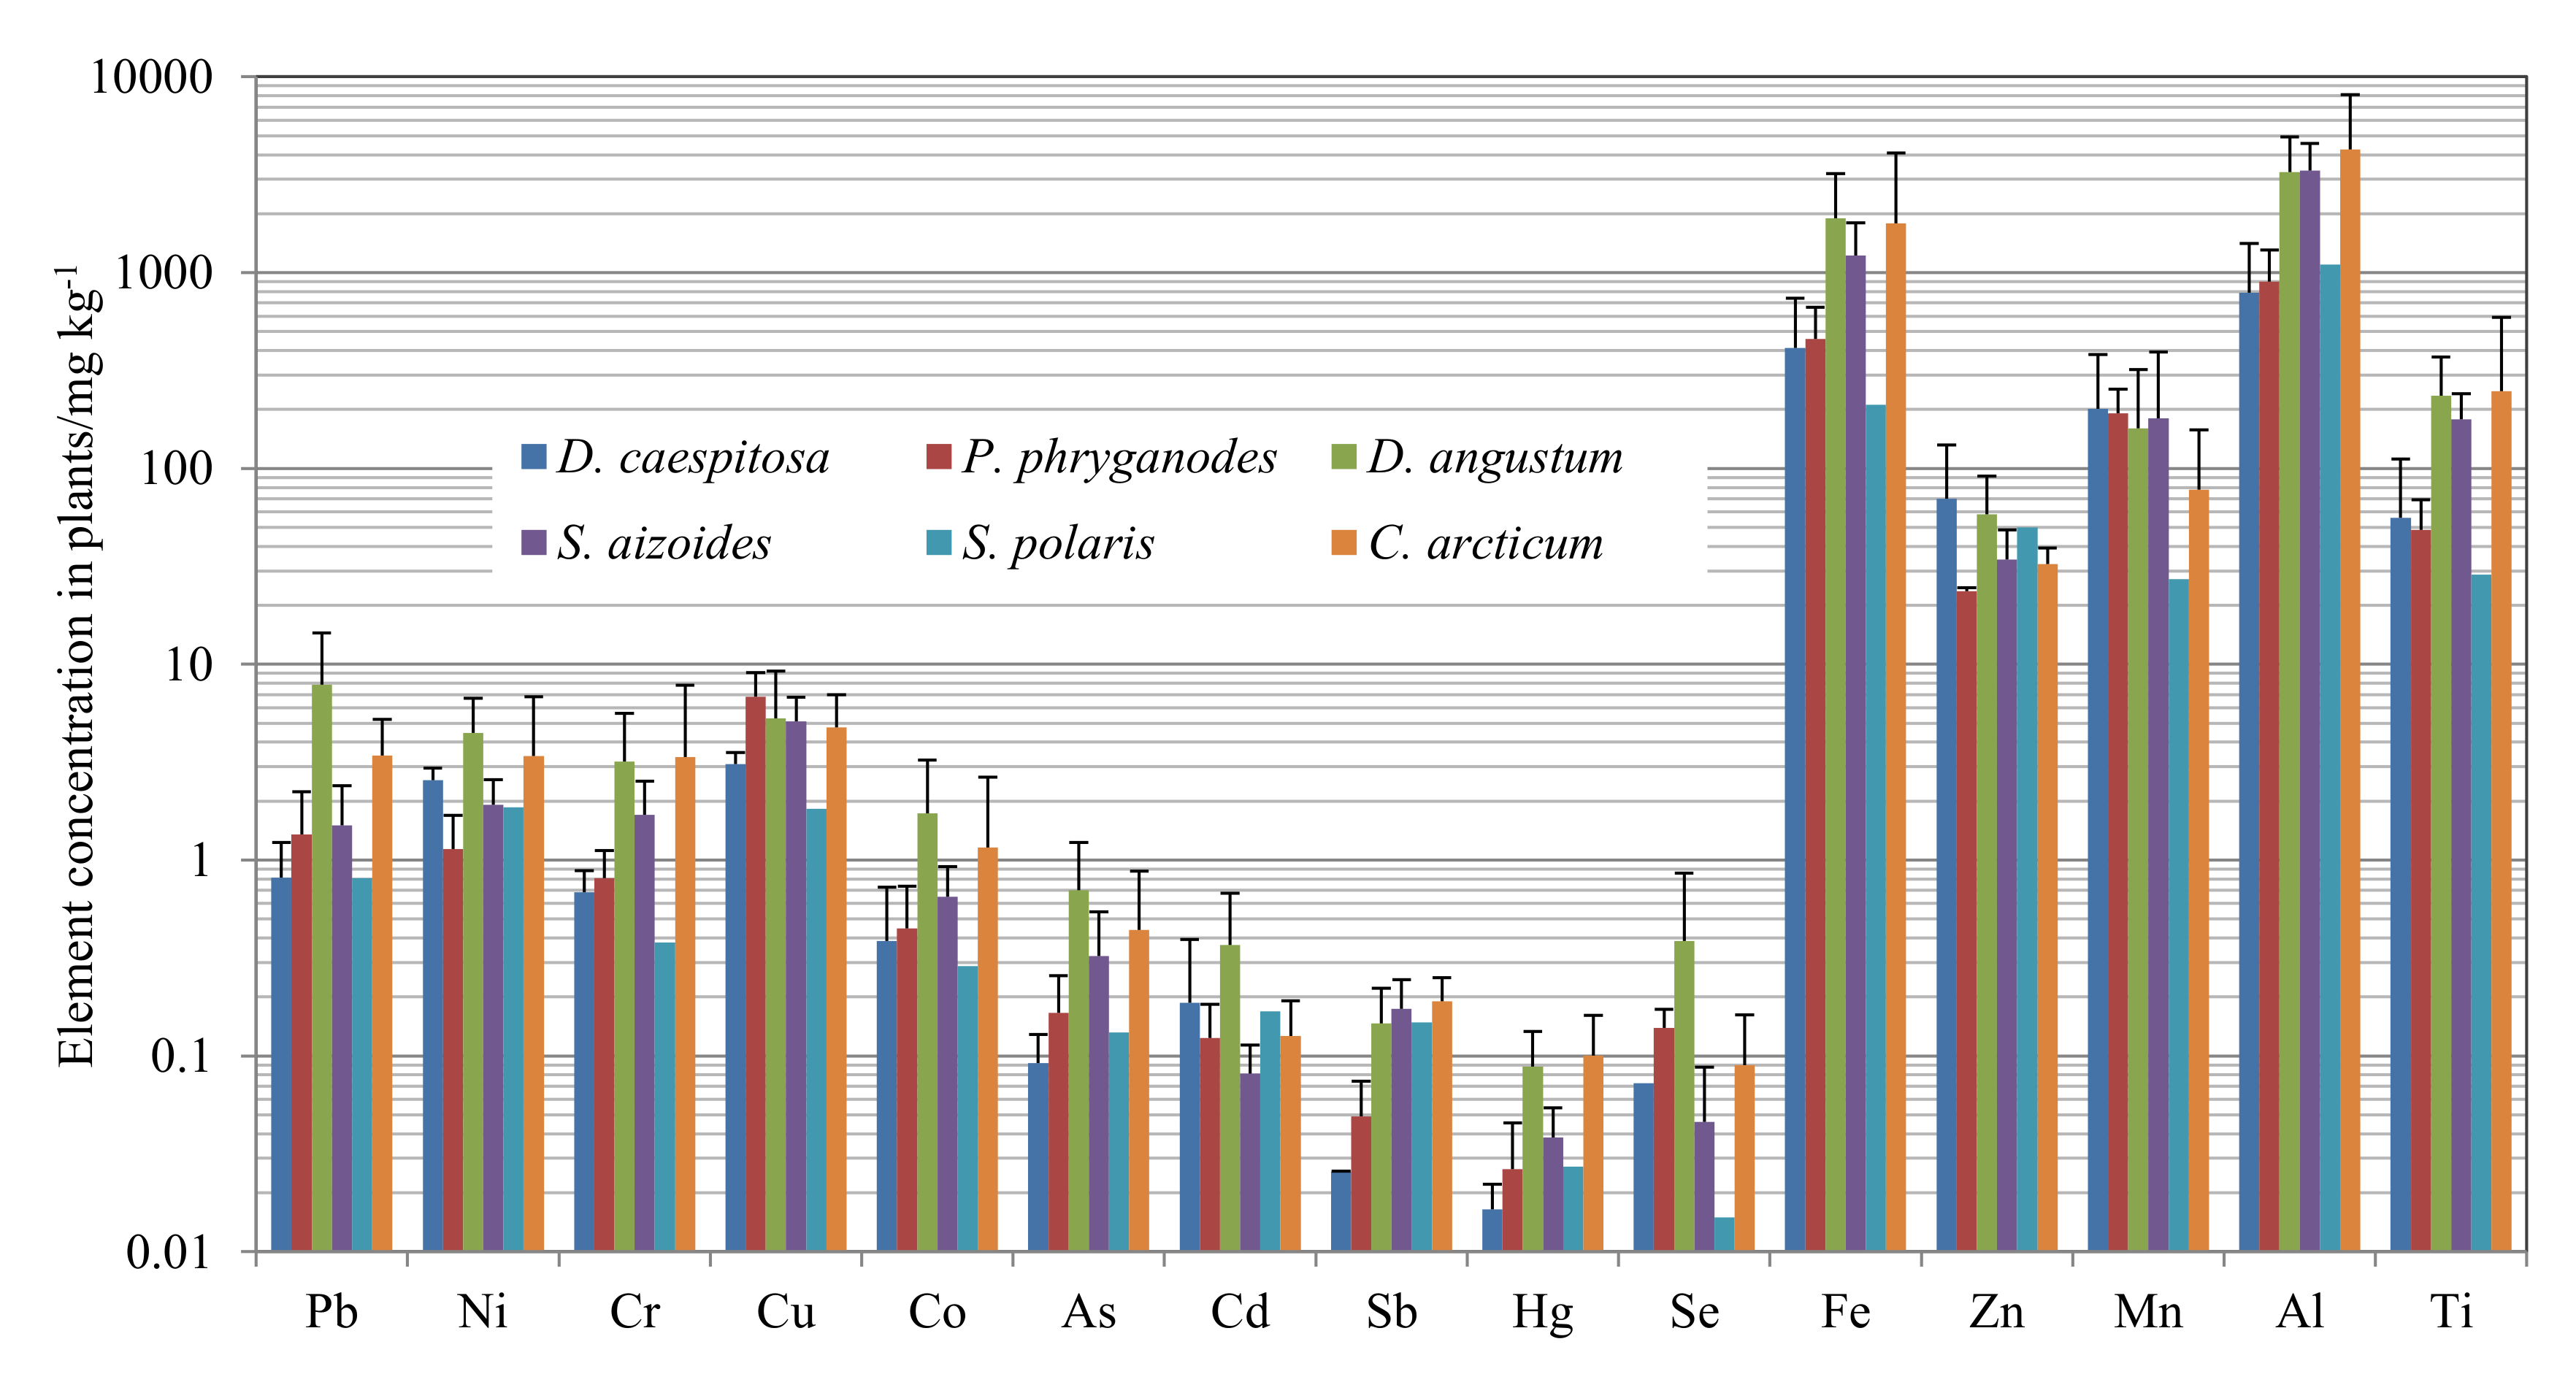
3. Results
4. Discussion
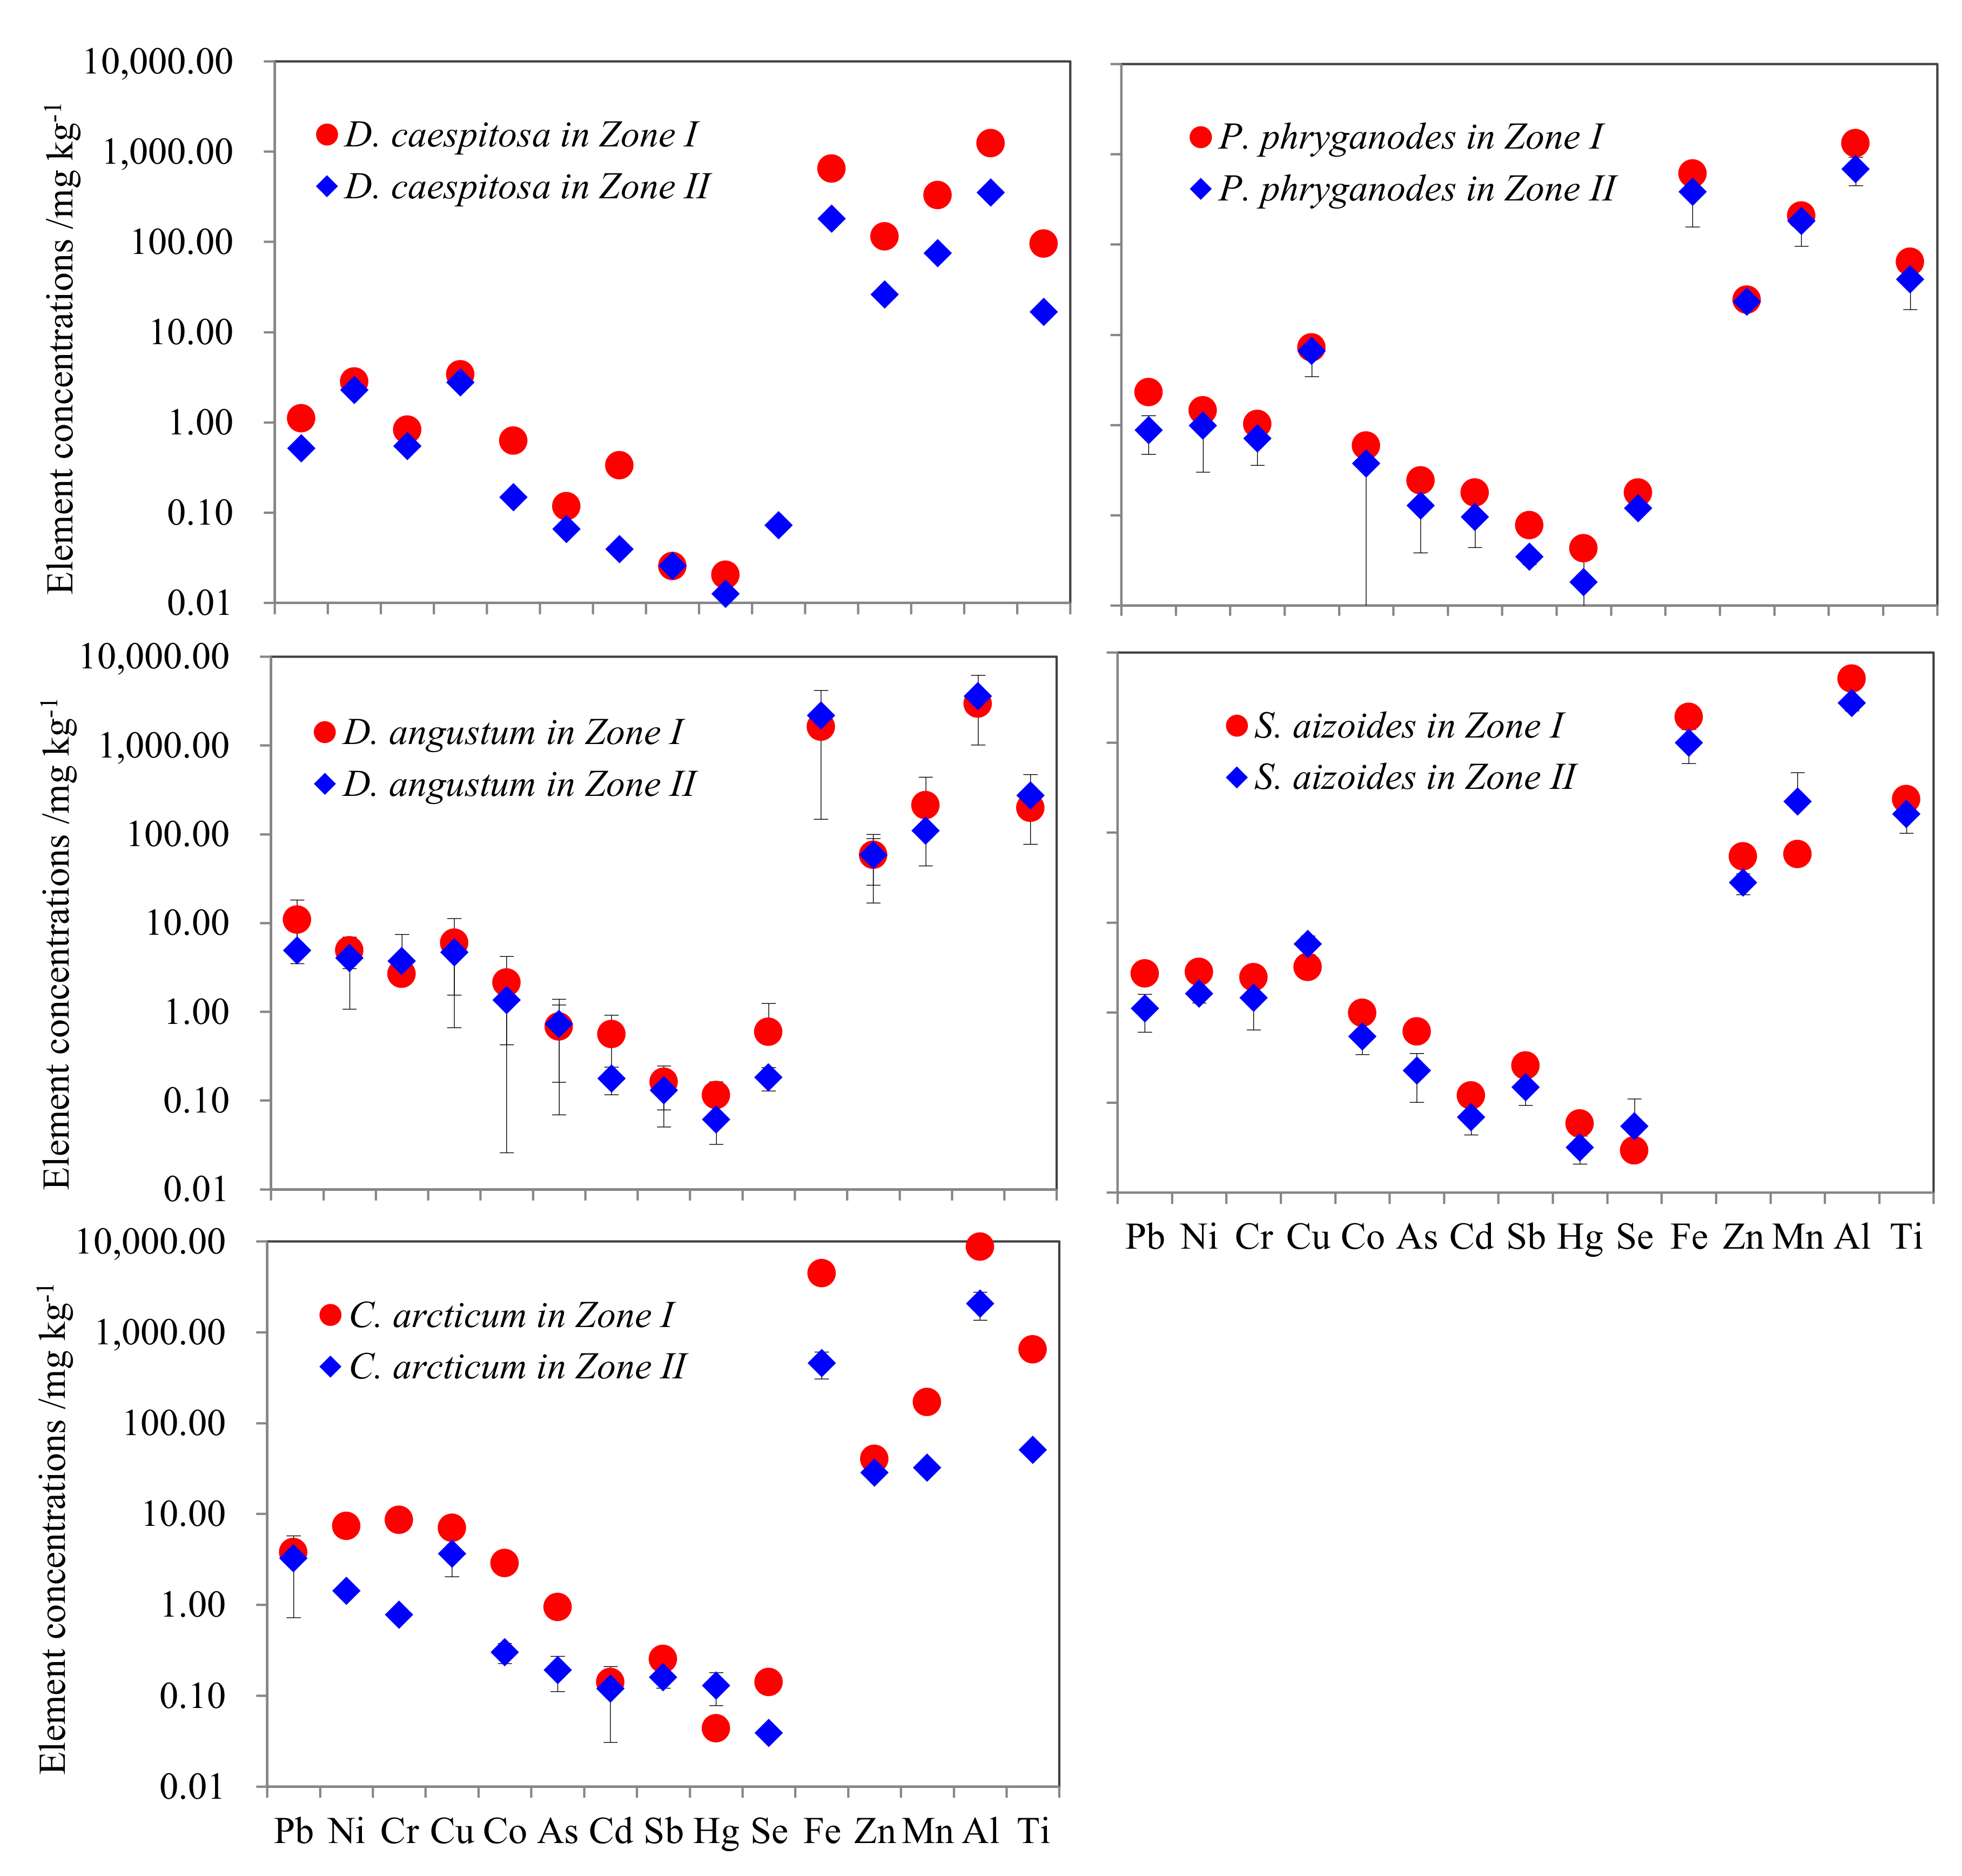
4.1. Spatial Variation of Elements in Plants
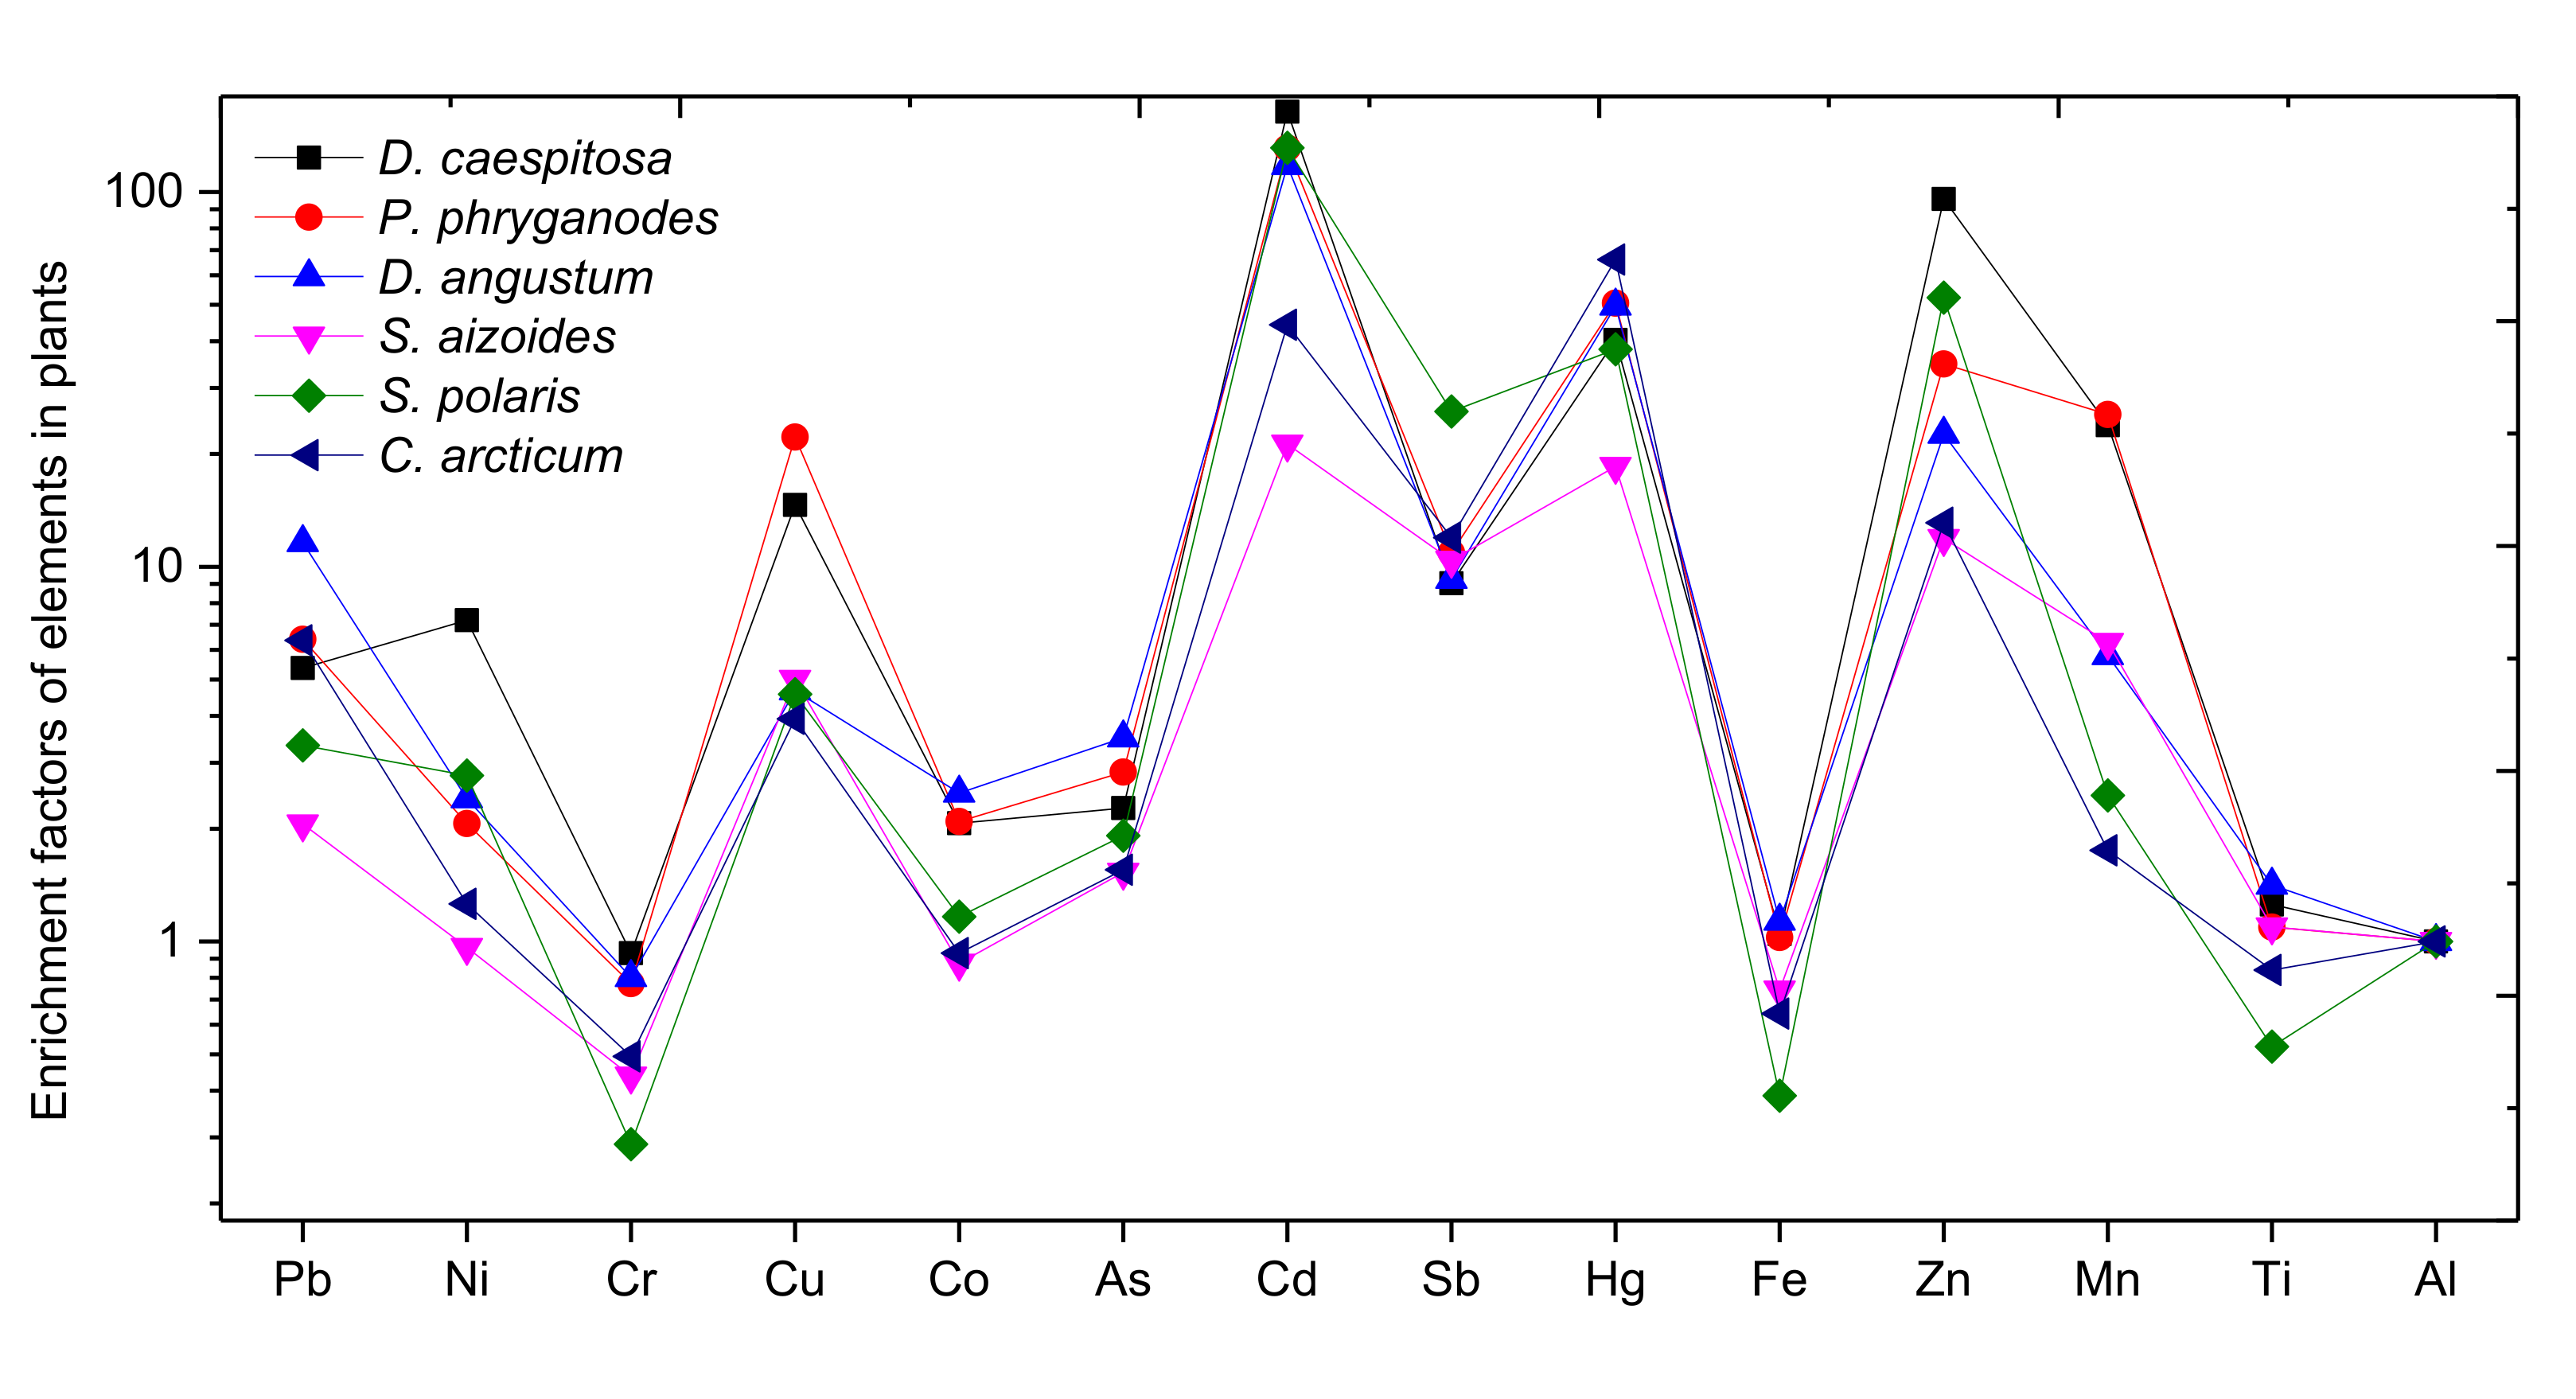
4.2. Enrichment Factors of Elements in Plants
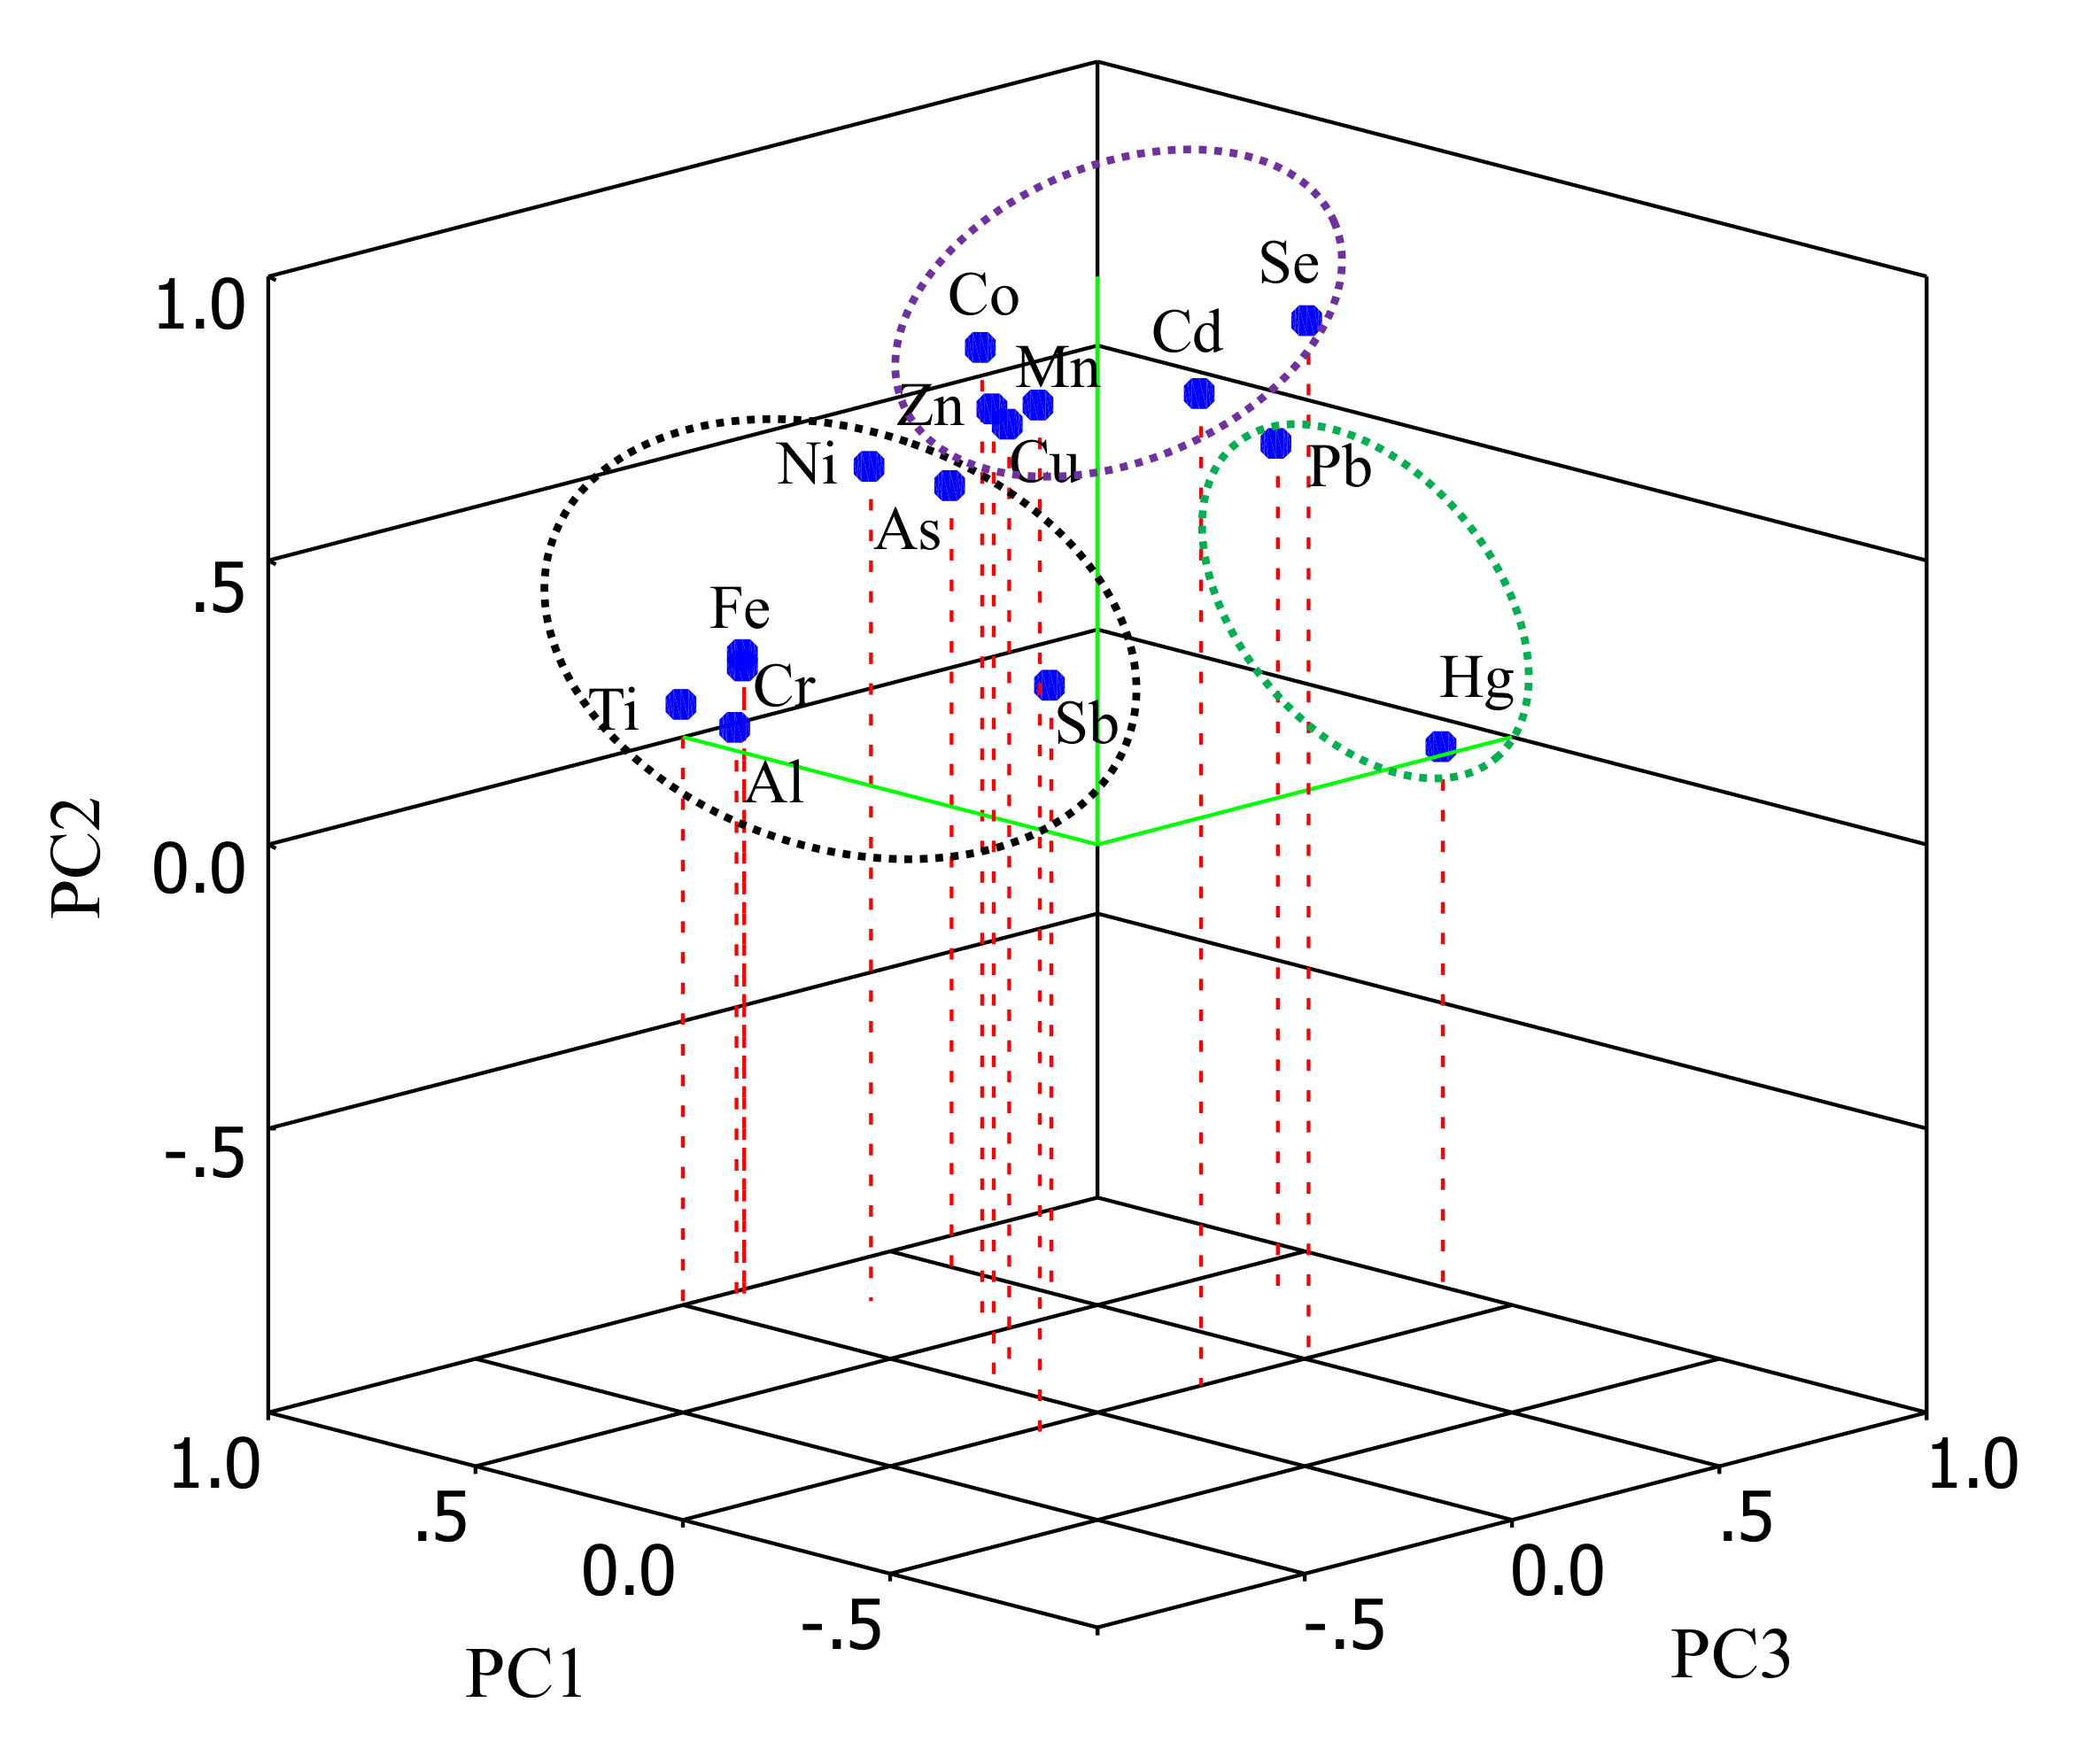
4.3. Element Groups in Plants
5. Conclusions
Author Contributions
Funding
Acknowledgments
Conflicts of Interest
References
- Barrie, L.A. Arctic air pollution: An overview of current knowledge. Atmos. Environ. 1986, 20, 643–663. [Google Scholar] [CrossRef]
- Simões, J.C.; Zagorodnov, V.S. The record of anthropogenic pollution in snow and ice in Svalbard, Norway. Atmos. Environ. 2001, 35, 403–413. [Google Scholar] [CrossRef]
- Zheng, J.; Shotyk, W.; Krachler, M.; Fisher, D.A. A 15,800-year record of atmospheric lead deposition on the Devon Island Ice Cap, Nunavut, Canada: Natural and anthropogenic enrichments, isotopic composition, and predominant sources. Glob. Biogeochem. Cycles 2007, 21. [Google Scholar] [CrossRef]
- Michelutti, N.; Simonetti, A.; Briner, J.P.; Funder, S.; Creaser, R.A.; Wolfe, A.P. Temporal trends of pollution Pb and other metals in east-central Baffin Island inferred from lake sediment geochemistry. Sci. Total Environ. 2009, 407, 5653–5662. [Google Scholar] [CrossRef] [PubMed]
- Liu, X.; Jiang, S.; Zhang, P.; Xu, L. Effect of recent climate change on Arctic Pb pollution: A comparative study of historical records in lake and peat sediments. Environ. Pollut. 2012, 160, 161–168. [Google Scholar] [CrossRef] [PubMed]
- Shi, G.; Teng, J.; Ma, H.; Li, Y.; Sun, B. Metals and metalloids in precipitation collected during CHINARE campaign from Shanghai, China to Zhongshan Station, Antarctica: Spatial variability and source identification. Glob. Biogeochem. Cycles 2015, 29, 760–774. [Google Scholar] [CrossRef]
- Bindler, R.; Renberg, I.; John Anderson, N.; Appleby, P.G.; Emteryd, O.; Boyle, J. Pb isotope ratios of lake sediments in West Greenland: Inferences on pollution sources. Atmos. Environ. 2001, 35, 4675–4685. [Google Scholar] [CrossRef]
- Allen-Gil, S.M.; Ford, J.; Lasorsa, B.K.; Monetti, M.; Vlasova, T.; Landers, D.H. Heavy metal contamination in the Taimyr Peninsula, Siberian Arctic. Sci. Total Environ. 2003, 301, 119–138. [Google Scholar] [CrossRef]
- Fitzgerald, W.F.; Engstrom, D.R.; Lamborg, C.H.; Tseng, C.-M.; Balcom, P.H.; Hammerschmidt, C.R. Modern and historic atmospheric mercury fluxes in northern Alaska: Global sources and Arctic depletion. Environ. Sci. Technol. 2005, 39, 557–568. [Google Scholar] [CrossRef]
- Shotyk, W.; Zheng, J.; Krachler, M.; Zdanowicz, C.; Koerner, R.; Fisher, D. Predominance of industrial Pb in recent snow (1994–2004) and ice (1842–1996) from Devon Island, Arctic Canada. Geophys. Res. Lett. 2005, 32. [Google Scholar] [CrossRef]
- Lahoutifard, N.; Sparling, M.; Lean, D. Total and methyl mercury patterns in Arctic snow during springtime at Resolute, Nunavut, Canada. Atmos. Environ. 2005, 39, 7597–7606. [Google Scholar] [CrossRef]
- Cai, M.; Lin, J.; Hong, Q.; Wang, Y.; Cai, M. Content and distribution of trace metals in surface sediments from the northern Bering Sea, Chukchi Sea and adjacent Arctic areas. Mar. Pollut. Bull. 2011, 63, 523–527. [Google Scholar] [CrossRef] [PubMed]
- Fort, J.; Grémillet, D.; Traisnel, G.; Amélineau, F.; Bustamante, P. Does temporal variation of mercury levels in Arctic seabirds reflect changes in global environmental contamination, or a modification of Arctic marine food web functioning? Environ. Pollut. 2016, 211, 382–388. [Google Scholar] [CrossRef] [PubMed]
- Dietz, R.; Sonne, C.; Basu, N.; Braune, B.; O’Hara, T.; Letcher, R.J.; Scheuhammer, T.; Andersen, M.; Andreasen, C.; Andriashek, D. What are the toxicological effects of mercury in Arctic biota? Sci. Total Environ. 2013, 443, 775–790. [Google Scholar] [CrossRef] [PubMed] [Green Version]
- Hansson, S.V.; Desforges, J.-P.; van Beest, F.M.; Bach, L.; Halden, N.M.; Sonne, C.; Mosbech, A.; Søndergaard, J. Bioaccumulation of mining derived metals in blood, liver, muscle and otoliths of two Arctic predatory fish species (Gadus ogac and Myoxocephalus scorpius). Environ. Res. 2020, 183, 109194. [Google Scholar] [CrossRef]
- Kicińska, A.; Gruszecka-Kosowska, A. Long-term changes of metal contents in two metallophyte species (Olkusz area of Zn-Pb ores, Poland). Environ. Monit. Assess 2016, 188, 339. [Google Scholar] [CrossRef] [Green Version]
- Kicińska, A. Assessment of the road traffic impact on accumulation of selected elements in soils developed on Krynica and Bystrica subunit (Magura Nappe, Polish Outer Carpathians). Carpathian J. Earth Environ. Sci. 2016, 11, 245–254. [Google Scholar]
- Szczepaniak, K.; Biziuk, M. Aspects of the biomonitoring studies using mosses and lichens as indicators of metal pollution. Environ. Res. 2003, 93, 221–230. [Google Scholar] [CrossRef]
- Grodzińska, K.; Szarek-Łukaszewska, G. Response of mosses to the heavy metal deposition in Poland-an overview. Environ. Pollut. 2001, 114, 443–451. [Google Scholar] [CrossRef]
- Zechmeister, H.; Hohenwallner, D.; Riss, A.; Hanus-Illnar, A. Variations in heavy metal concentrations in the moss species Abietinella abietina (Hedw.) Fleisch. according to sampling time, within site variability and increase in biomass. Sci. Total Environ. 2003, 301, 55–65. [Google Scholar] [CrossRef]
- Harmens, H.; Buse, A.; Büker, P.; Norris, D.; Mills, G.; Williams, B.; Reynolds, B.; Ashenden, T.W.; Rühling, Å.; Steinnes, E. Heavy metal concentrations in European mosses: 2000/2001 survey. J. Atmos. Chem. 2004, 49, 425–436. [Google Scholar] [CrossRef]
- Kłos, A.; Ziembik, Z.; Rajfur, M.; Dołhańczuk-Śródka, A.; Bochenek, Z.; Bjerke, J.W.; Tømmervik, H.; Zagajewski, B.; Ziółkowski, D.; Jerz, D.; et al. Using moss and lichens in biomonitoring of heavy-metal contamination of forest areas in southern and north-eastern Poland. Sci. Total Environ. 2018, 627, 438–449. [Google Scholar] [CrossRef]
- Reimann, C.; Niskavaara, H.; Kashulina, G.; Filzmoser, P.; Boyd, R.; Volden, T.; Tomilina, O.; Bogatyrev, I. Critical remarks on the use of terrestrial moss (Hylocomium splendens and Pleurozium schreberi) for monitoring of airborne pollution. Environ. Pollut. 2001, 113, 41–57. [Google Scholar] [CrossRef]
- Buse, A.; Norris, D.; Harmens, H.; Büker, P.; Ashenden, T.; Mills, G. Heavy Metals in European Mosses: 2000/2001 Survey; ICP Vegetation Programme Coordination Centre, Centre for Ecology and Hydrology: Bangor, UK, 2003; Available online: http://icpvegetation.ceh.ac.uk (accessed on 19 October 2020).
- Harmens, H.; Norris, D.; Steinnes, E.; Kubin, E.; Piispanen, J.; Alber, R.; Aleksiayenak, Y.; Blum, O.; Coşkung, M.; Dam, M. Mosses as biomonitors of atmospheric heavy metal deposition: Spatial patterns and temporal trends in Europe. Environ. Pollut. 2010, 158, 3144–3156. [Google Scholar] [CrossRef] [PubMed]
- Schnyder, E.; Štrok, M.; Kosonen, Z.; Skudnik, M.; Mazej, D.; Jeran, Z.; Thöni, L. Lead concentrations and stable lead isotope ratios in moss in Slovenia and Switzerland. Ecol. Indic. 2018, 95, 250–259. [Google Scholar] [CrossRef]
- Wojtuń, B.; Samecka-Cymerman, A.; Kolon, K.; Kempers, A.J.; Skrzypek, G. Metals in some dominant vascular plants, mosses, lichens, algae, and the biological soil crust in various types of terrestrial tundra, SW Spitsbergen, Norway. Polar. Biol. 2013, 36, 1799–1809. [Google Scholar] [CrossRef] [Green Version]
- Jia, N.; Sun, L.; He, X.; You, K.; Zhou, X.; Long, N. Distributions and impact factors of antimony in topsoils and moss in Ny-Ålesund, Arctic. Environ. Pollut. 2012, 171, 72–77. [Google Scholar] [CrossRef]
- Hisdal, V.; Polarinstitutt, N. Svalbard: Nature and History; Norsk Polarinstitutt: Oslo, Norway, 1998. [Google Scholar]
- Jiang, S.; Liu, X.; Sun, J.; Yuan, L.; Sun, L.; Wang, Y. A multi-proxy sediment record of late Holocene and recent climate change from a lake near Ny-Ålesund Svalbard. Boreas 2011, 40, 468–480. [Google Scholar] [CrossRef]
- Beine, H.J.; Argentini, S.; Maurizi, A.; Mastrantonio, G.; Viola, A. The local wind field at Ny-Ålesund and the Zeppelin mountain at Svalbard. Meteorol. Atmos. Phys. 2001, 78, 107–113. [Google Scholar] [CrossRef]
- Aboal, J.; Pérez-Llamazares, A.; Carballeira, A.; Giordano, S.; Fernández, J. Should moss samples used as biomonitors of atmospheric contamination be washed? Atmos. Environ. 2011, 45, 6837–6840. [Google Scholar] [CrossRef]
- Markert, B.; Wappelhorst, O.; Weckert, V.; Herpin, U.; Siewers, U.; Friese, K.; Breulmann, G. The use of bioindicators for monitoring the heavy-metal status of the environment. J. Radioanal. Nucl. Chem. 1999, 240, 425–429. [Google Scholar] [CrossRef]
- Migaszewski, Z.M.; Gałuszka, A.; Pasławski, P. Polynuclear aromatic hydrocarbons, phenols, and trace metals in selected soil profiles and plant bioindicators in the Holy Cross Mountains, South-Central Poland. Environ. Int. 2002, 28, 303–313. [Google Scholar] [CrossRef]
- Riget, F.; Asmund, G.; Aastrup, P. The use of lichen (Cetraria nivalis) and moss (Rhacomitrium lanuginosum) as monitors for atmospheric deposition in Greenland. Sci. Total Environ. 2000, 245, 137–148. [Google Scholar] [CrossRef]
- Aceto, M.; Abollino, O.; Conca, R.; Malandrino, M.; Mentasti, E.; Sarzanini, C. The use of mosses as environmental metal pollution indicators. Chemosphere 2003, 50, 333–342. [Google Scholar] [CrossRef]
- Turner, A.; Simmonds, L. Elemental concentrations and metal bioaccessibility in UK household dust. Sci. Total Environ. 2006, 371, 74–81. [Google Scholar] [CrossRef]
- Meza-Figueroa, D. Heavy metal distribution in dust from elementary schools in Hermosillo, Sonora, México. Atmos. Environ. 2007, 41, 276–288. [Google Scholar] [CrossRef]
- Shi, G.; Li, Y.; Jiang, S.; An, C.; Ma, H.; Sun, B.; Wang, Y. Large-scale spatial variability of major ions in the atmospheric wet deposition along the China Antarctica transect (31°N~69°S). Tellus B 2012, 64, 17134. [Google Scholar] [CrossRef]
- Lawrence, C.R.; Neff, J.C. The contemporary physical and chemical flux of aeolian dust: A synthesis of direct measurements of dust deposition. Chem. Geol. 2009, 267, 46–63. [Google Scholar] [CrossRef]
- Jiang, S.Y.N.; Yang, F.; Chan, K.L.; Ning, Z. Water solubility of metals in coarse PM and PM2.5 in typical urban environment in Hong Kong. Atmos. Pollut. Res. 2014, 5, 236–244. [Google Scholar] [CrossRef] [Green Version]
- Rudnick, R.; Gao, S. Composition of the continental crust. Treatise Geochem. 2003, 3, 1–64. [Google Scholar]
- Chiarenzelli, J.R.; Aspler, L.B.; Ozarko, D.L.; Hall, G.; Powis, K.B.; Donaldson, J. Heavy metals in lichens, southern district of Keewatin, Northwest Territories, Canada. Chemosphere 1997, 35, 1329–1341. [Google Scholar] [CrossRef]
- France, R.; Coquery, M. Lead concentrations in lichens from the Canadian high arctic in relation to the latitudinal pollution gradient. Water Air Soil Pollut. 1996, 90, 469–474. [Google Scholar] [CrossRef]
- Grodzińska, K.; Godzik, B. Heavy metals and sulphur in mosses from southern Spitsbergen. Polar. Res. 1991, 9, 133–140. [Google Scholar] [CrossRef]
- Gulińska, J.; Rachlewicz, G.; Szczuciński, W.; Barałkiewicz, D.; Kózka, M.; Bulska, E.; Burzyk, M. Soil contamination in high Arctic areas of human impact, central Spitsbergen, Svalbard. Pol. J. Environ. Stud. 2003, 12, 701–707. [Google Scholar]
- Koz, B.; Cevik, U. Lead adsorption capacity of some moss species used for heavy metal analysis. Ecol. Indic. 2014, 36, 491–494. [Google Scholar] [CrossRef]
- Lajayer, B.A.; Moghadam, N.K.; Maghsoodi, M.R.; Ghorbanpour, M.; Kariman, K. Phytoextraction of heavy metals from contaminated soil, water and atmosphere using ornamental plants: Mechanisms and efficiency improvement strategies. Environ. Sci. Pollut. Res. 2019, 26, 8468–8484. [Google Scholar] [CrossRef] [PubMed]
- Shi, G.; Chen, Z.; Xu, S.; Zhang, J.; Wang, L.; Bi, C.; Teng, J. Potentially toxic metal contamination of urban soils and roadside dust in Shanghai, China. Environ. Pollut. 2008, 156, 251–260. [Google Scholar] [CrossRef]
- Wolterbeek, B. Biomonitoring of trace element air pollution: Principles, possibilities and perspectives. Environ. Pollut. 2002, 120, 11–21. [Google Scholar] [CrossRef]
- Wolterbeek, H.T.; Verburg, T. Judging survey quality: Local variances. Environ. Monit. Assess 2002, 73, 7–16. [Google Scholar] [CrossRef]
- Shi, G.; Chen, Z.; Teng, J.; Bi, C.; Zhou, D.; Sun, C.; Li, Y.; Xu, S. Fluxes, variability and sources of cadmium, lead, arsenic and mercury in dry atmospheric depositions in urban, suburban and rural areas. Environ. Res. 2012, 113, 28–32. [Google Scholar] [CrossRef]
- Berg, T.; Steinnes, E. Recent trends in atmospheric deposition of trace elements in Norway as evident from the 1995 moss survey. Sci. Total Environ. 1997, 208, 197–206. [Google Scholar] [CrossRef]
- Steinnes, E. A critical evaluation of the use of naturally growing moss to monitor the deposition of atmospheric metals. Sci. Total Environ. 1995, 160, 243–249. [Google Scholar] [CrossRef]
- Hao, Z.L.; Wang, F.; Yang, H.Z. Baseline values for heavy metals in soils on Ny-Ålesund, Spitsbergen Island, Arctic: The extent of anthropogenic pollution. Adv. Mater. Res. 2013, 779–780, 1260–1265. [Google Scholar] [CrossRef]
- Poland, J.S.; Riddle, M.J.; Zeeb, B.A. Contaminants in the Arctic and the Antarctic: A comparison of sources, impacts, and remediation options. Polar Rec. 2003, 39, 369. [Google Scholar] [CrossRef]
- Singh, D.K.; Kawamura, K.; Yanase, A.; Barrie, L.A. Distributions of polycyclic aromatic hydrocarbons, aromatic ketones, carboxylic acids, and trace metals in arctic aerosols: Long-range atmospheric transport, photochemical degradation/production at polar sunrise. Environ. Sci. Technol. 2017, 51, 8992–9004. [Google Scholar] [CrossRef]
- Macdonald, R.; Barrie, L.; Bidleman, T.; Diamond, M.; Gregor, D.; Semkin, R.; Strachan, W.; Li, Y.; Wania, F.; Alaee, M. Contaminants in the Canadian Arctic: 5 years of progress in understanding sources, occurrence and pathways. Sci. Total Environ. 2000, 254, 93–234. [Google Scholar] [CrossRef]
- Halbach, K.; Mikkelsen, Ø.; Berg, T.; Steinnes, E. The presence of mercury and other trace metals in surface soils in the Norwegian Arctic. Chemosphere 2017, 188, 567–574. [Google Scholar] [CrossRef]
- Obrist, D.; Agnan, Y.; Jiskra, M.; Olson, C.L.; Colegrove, D.P.; Hueber, J.; Moore, C.W.; Sonke, J.E.; Helmig, D. Tundra uptake of atmospheric elemental mercury drives Arctic mercury pollution. Nature 2017, 547, 201–204. [Google Scholar] [CrossRef] [Green Version]


| Element | Mean | Minimum | Maximum | Standard Deviation | Coefficient of Variation |
|---|---|---|---|---|---|
| Pb | 3.70 | 0.50 | 17.90 | 4.70 | 1.27 |
| Ni | 2.90 | 0.50 | 7.40 | 2.10 | 0.72 |
| Cr | 2.10 | 0.40 | 8.50 | 2.30 | 1.10 |
| Cu | 5.00 | 1.20 | 12.00 | 2.70 | 0.54 |
| Co | 0.99 | 0.12 | 4.50 | 1.11 | 1.12 |
| As | 0.40 | 0.06 | 1.46 | 0.40 | 1.00 |
| Cd | 0.20 | 0.04 | 0.77 | 0.21 | 1.05 |
| Sb | 0.13 | 0.03 | 0.26 | 0.08 | 0.62 |
| Hg | 0.06 | 0.01 | 0.16 | 0.05 | 0.83 |
| Se | 0.20 | 0.01 | 1.34 | 0.31 | 1.55 |
| Fe | 1264 | 181 | 4445 | 1250 | 0.99 |
| Zn | 44 | 17 | 114 | 29 | 0.66 |
| Mn | 154 | 27 | 494 | 141 | 0.92 |
| Al | 2690 | 352 | 8686 | 2101 | 0.78 |
| Ti | 166 | 17 | 644 | 163 | 0.98 |
| Region | Pb | Ni | Cr | Cu | As | Cd | Sb | Hg | Fe | Zn | Mn | Al | Ti | Reference |
|---|---|---|---|---|---|---|---|---|---|---|---|---|---|---|
| Ny-Ålesund | 3.7 | 2.9 | 2.1 | 5.0 | 0.40 | 0.20 | 0.13 | 0.06 | 1264 | 44 | 154 | 2690 | 166 | This study |
| NW Canada | 6.75 | 3.19 | 3.88 | 3.54 | 0.37 | 0.19 | 0.029 | n.a. | n.a. | 21.24 | n.a. | n.a. | n.a. | [43] |
| Canadian High Arctic | 2.0 | n.a. | n.a. | n.a. | n.a. | n.a. | n.a. | n.a. | n.a. | n.a. | n.a. | n.a. | n.a. | [44] |
| Southern Spitsbergen | 7.07 | 4.25 | n.a. | 6.01 | n.a. | 0.59 | n.a. | n.a. | n.a. | 21.13 | n.a. | n.a. | n.a. | [45] |
| Taimyr Peninsula, Siberian Arctic | 1.84 | 4.24 | n.a. | 4.57 | 0.39 | 0.166 | n.a. | 0.051 | 2640 | 27.5 | 113 | 2820 | 220 | [8] |
| Finland, 2005 | 2.70 | 1.45 | 0.91 | 3.08 | 0.11 | 0.14 | n.a. | 0.040 | 186 | 31.6 | n.a. | 176 | n.a. | [25] |
| Iceland, 2005 | 1.35 | 3.15 | 3.33 | 7.70 | 0.11 | 0.052 | n.a. | n.a. | n.a. | 21.2 | n.a. | n.a. | n.a. | [25] |
| Norway, 2005 | 2.17 | 1.24 | 0.58 | 4.37 | 0.12 | 0.089 | 0.070 | 0.054 | 273 | 31.4 | n.a. | 255 | n.a. | [25] |
| Russian Federation, 2005 | n.a. | 2.74 | 3.64 | 8.94 | 0.23 | 0.24 | 0.12 | n.a. | 679 | 40.1 | n.a. | 850 | n.a. | [25] |
| Sweden, 2005 | 2.15 | 0.61 | 0.61 | 3.56 | 0.065 | 0.14 | n.a. | n.a. | 117 | 30.6 | n.a. | n.a. | n.a. | [25] |
| Ny-Ålesund | n.a. | n.a. | n.a. | n.a. | n.a. | n.a. | 0.108 | n.a. | n.a. | n.a. | n.a. | n.a. | n.a. | [28] |
| Pb | Ni | Cr | Cu | Co | As | Cd | Sb | Hg | Se | Fe | Zn | Mn | Al | Ti | |
|---|---|---|---|---|---|---|---|---|---|---|---|---|---|---|---|
| Pb | 1.00 | 0.57 * | 0.80 ** | 0.21 | 0.67 ** | 0.84 ** | 0.48 * | 0.51 * | 0.85 ** | 0.62 ** | 0.70 ** | 0.26 | −0.11 | 0.65 ** | 0.61 ** |
| Ni | 1.00 | 0.78 ** | 0.14 | 0.81 ** | 0.73 ** | 0.36 | 0.30 | 0.34 | 0.47 | 0.73 ** | 0.53 * | 0.06 | 0.62 ** | 0.73 ** | |
| Cr | 1.00 | 0.37 | 0.91 ** | 0.93 ** | 0.22 | 0.48 * | 0.58 ** | 0.58 * | 0.92 ** | 0.22 | 0.07 | 0.79 ** | 0.88 ** | ||
| Cu | 1.00 | 0.51 * | 0.40 | −0.07 | 0.24 | 0.07 | 0.42 | 0.42 | 0.14 | 0.58 ** | 0.24 | 0.33 | |||
| Co | 1.00 | 0.86 ** | 0.33 | 0.51 * | 0.43 | 0.56 * | 0.93 ** | 0.44 | 0.25 | 0.80 ** | 0.90 ** | ||||
| As | 1.00 | 0.20 | 0.64 ** | 0.70 ** | 0.57 * | 0.89 ** | 0.31 | −0.05 | 0.81 ** | 0.82 ** | |||||
| Cd | 1.00 | 0.05 | 0.33 | 0.49 | 0.21 | 0.55 * | 0.28 | 0.16 | 0.24 | ||||||
| Sb | 1.00 | 0.58 ** | 0.28 | 0.67 ** | 0.32 | −0.02 | 0.74 ** | 0.56 * | |||||||
| Hg | 1.0 0 | 0.61 * | 0.53 * | 0.22 | −0.26 | 0.60 ** | 0.43 | ||||||||
| Se | 1.00 | 0.54 * | 0.26 | 0.58 * | 0.31 | 0.44 | |||||||||
| Fe | 1.00 | 0.41 | 0.22 | 0.91 ** | 0.96 ** | ||||||||||
| Zn | 1.00 | 0.37 | 0.40 | 0.38 | |||||||||||
| Mn | 1.00 | 0.01 | 0.20 | ||||||||||||
| Al | 1.00 | 0.93 ** | |||||||||||||
| Ti | 1.00 |
Publisher’s Note: MDPI stays neutral with regard to jurisdictional claims in published maps and institutional affiliations. |
© 2020 by the authors. Licensee MDPI, Basel, Switzerland. This article is an open access article distributed under the terms and conditions of the Creative Commons Attribution (CC BY) license (http://creativecommons.org/licenses/by/4.0/).
Share and Cite
Ma, H.; Shi, G.; Cheng, Y. Accumulation Characteristics of Metals and Metalloids in Plants Collected from Ny-Ålesund, Arctic. Atmosphere 2020, 11, 1129. https://doi.org/10.3390/atmos11101129
Ma H, Shi G, Cheng Y. Accumulation Characteristics of Metals and Metalloids in Plants Collected from Ny-Ålesund, Arctic. Atmosphere. 2020; 11(10):1129. https://doi.org/10.3390/atmos11101129
Chicago/Turabian StyleMa, Hongmei, Guitao Shi, and Yongqian Cheng. 2020. "Accumulation Characteristics of Metals and Metalloids in Plants Collected from Ny-Ålesund, Arctic" Atmosphere 11, no. 10: 1129. https://doi.org/10.3390/atmos11101129