Article

The Effect of the Covid-19 Lockdown on Air Quality in Three Italian Medium-Sized Cities

by
Gabriele Donzelli
1,2,*,
Lorenzo Cioni
3,
Mariagrazia Cancellieri
4,
Agustin Llopis Morales
1 and
Maria M. Morales Suárez-Varela
1,5
1
Department of Preventive Medicine and Public Health, Food Sciences, Toxicology, and Legal Medicine, School of Pharmacy, University of Valencia, Avenida Vicente Andres Estellés s/n, Burjassot, 46100 Valencia, Spain
2
Department of Health Sciences, University of Florence, Viale GB Morgagni 48, 50134 Florence, Italy
3
Scuola Normale Superiore, Piazza dei Cavalieri 7, 56126 Pisa, Italy
4
Hygiene and Public Health Unit, Department of Public Health, AUSL Imola, 40026 Bologna, Italy
5
Biomedical Research Consortium in Epidemiology and Public Health Network (CIBERESP), Avenida Monforte de Lemos, 3-5. Pabellón 11. Planta 0, 28029 Madrid, Spain
*
Author to whom correspondence should be addressed.
Atmosphere 2020, 11(10), 1118; https://doi.org/10.3390/atmos11101118
Submission received: 15 September 2020 / Revised: 13 October 2020 / Accepted: 16 October 2020 / Published: 19 October 2020
(This article belongs to the Section Air Quality)

Abstract

:
Despite the societal and economic impacts of the COVID-19 pandemic, the lockdown measures put in place by the Italian government provided an unprecedented opportunity to increase our knowledge of the effect transportation and industry-related emissions have on the air quality in our cities. This study assessed the effect of reduced emissions during the lockdown period, due to COVID-19, on air quality in three Italian cities, Florence, Pisa, and Lucca. For this study, we compared the concentration of particulate matter PM10, PM2.5, NO2, and O3 measured during the lockdown period, with values obtained in the same period of 2019. Our results show no evidence of a direct relationship between the lockdown measures implemented and PM reduction in urban centers, except in areas with heavy traffic. Consistent with recently published studies, we did, however, observe a significant decrease in NO2 concentrations among all the air-monitoring stations for each city in this study. Finally, O3 levels remained unchanged during the lockdown period. Of note, there were slight variations in the meteorological conditions for the same periods of different years. Our results suggest a need for further studies on the impact of vehicular traffic and industrial activities on PM air pollution, including adopting holistic source-control measures for improved air quality in urban environments.

1. Introduction

Air pollution has been one of Europe’s leading political concerns since the late 1970s. It continues to significantly impact the health of the European population today, particularly in urban areas. In terms of harm to human health, Europe’s most serious pollutants are particulate matter (PM), NO2, and ground-level O3. Italy is among the European countries most affected by air pollution, with 58,600 premature deaths attributed to PM2.5 exposure, 14,600 to NO2 exposure, and 3000 to O3 exposure [1].
Meteorological parameters play an important role in determining air-pollution concentrations. Generally, PM concentrations decrease with an increase in precipitation rate, wind speed, and temperature [2]. The NO2 in our atmosphere is primarily a function of the magnitude of nitrogen oxide (NOx) emissions and weather factors, such as sun angle, wind speed, and temperature. Meteorological variations between years can cause column NO2 differences of ~15% over monthly timescales [3]. O3 generally increases with increasing temperature and decreases with increasing relative humidity [4].
Road traffic is the leading cause of air pollution in cities, and it is responsible for almost a quarter of Europe’s greenhouse gas emissions [5]. According to a recent report published by Legambiente, a recognized environmental organization in Italy, each year, several Italian cities exceed air-pollution limits, especially PM and O3 pollutant levels [6]. In 2020, as in previous years, Italy’s largest cities were forced to ban hundreds of thousands of vehicles from the road after days of persistent smog.
Despite the societal and economic impacts of the COVID-19 pandemic [7,8], the lockdown measures put in place by the Italian government provided an unprecedented opportunity to increase our knowledge on the contribution of transportation and industrial emissions on air quality in our cities. As expected, after Italy adopted the mandatory measures, there was a significant reduction in transport- and industry-related emissions. Recent research clearly discloses that the restrictive measures adopted during March–April 2020 brought about a significant reduction (−64.6%) in Rome’s personal vehicle usage [9].
On the evening of 9 March 2020, Italian Prime Minister Giuseppe Conte imposed a national quarantine in response to the growing COVID-19 pandemic restricting people’s movement, except for reasons related to basic human needs, work, and health [10]. On 22 March 2020, a new decree closed down all non-essential industries throughout the country and restricted inter-city movement further by requiring travelers to provide justification and documentation to the authorities, when moving between and within cities [11]. The restrictions lasted three months up to 3 June 2020.
This study aimed to assess the effects of the reduced emissions during the COVID-19 period on the air quality in three Italian cities, Florence, Pisa, and Lucca. For this study’s purpose, we compared the concentrations of PM10, PM2.5, NO2, and O3 measured before, during, and after the lockdown, with the corresponding values.

2. Methods

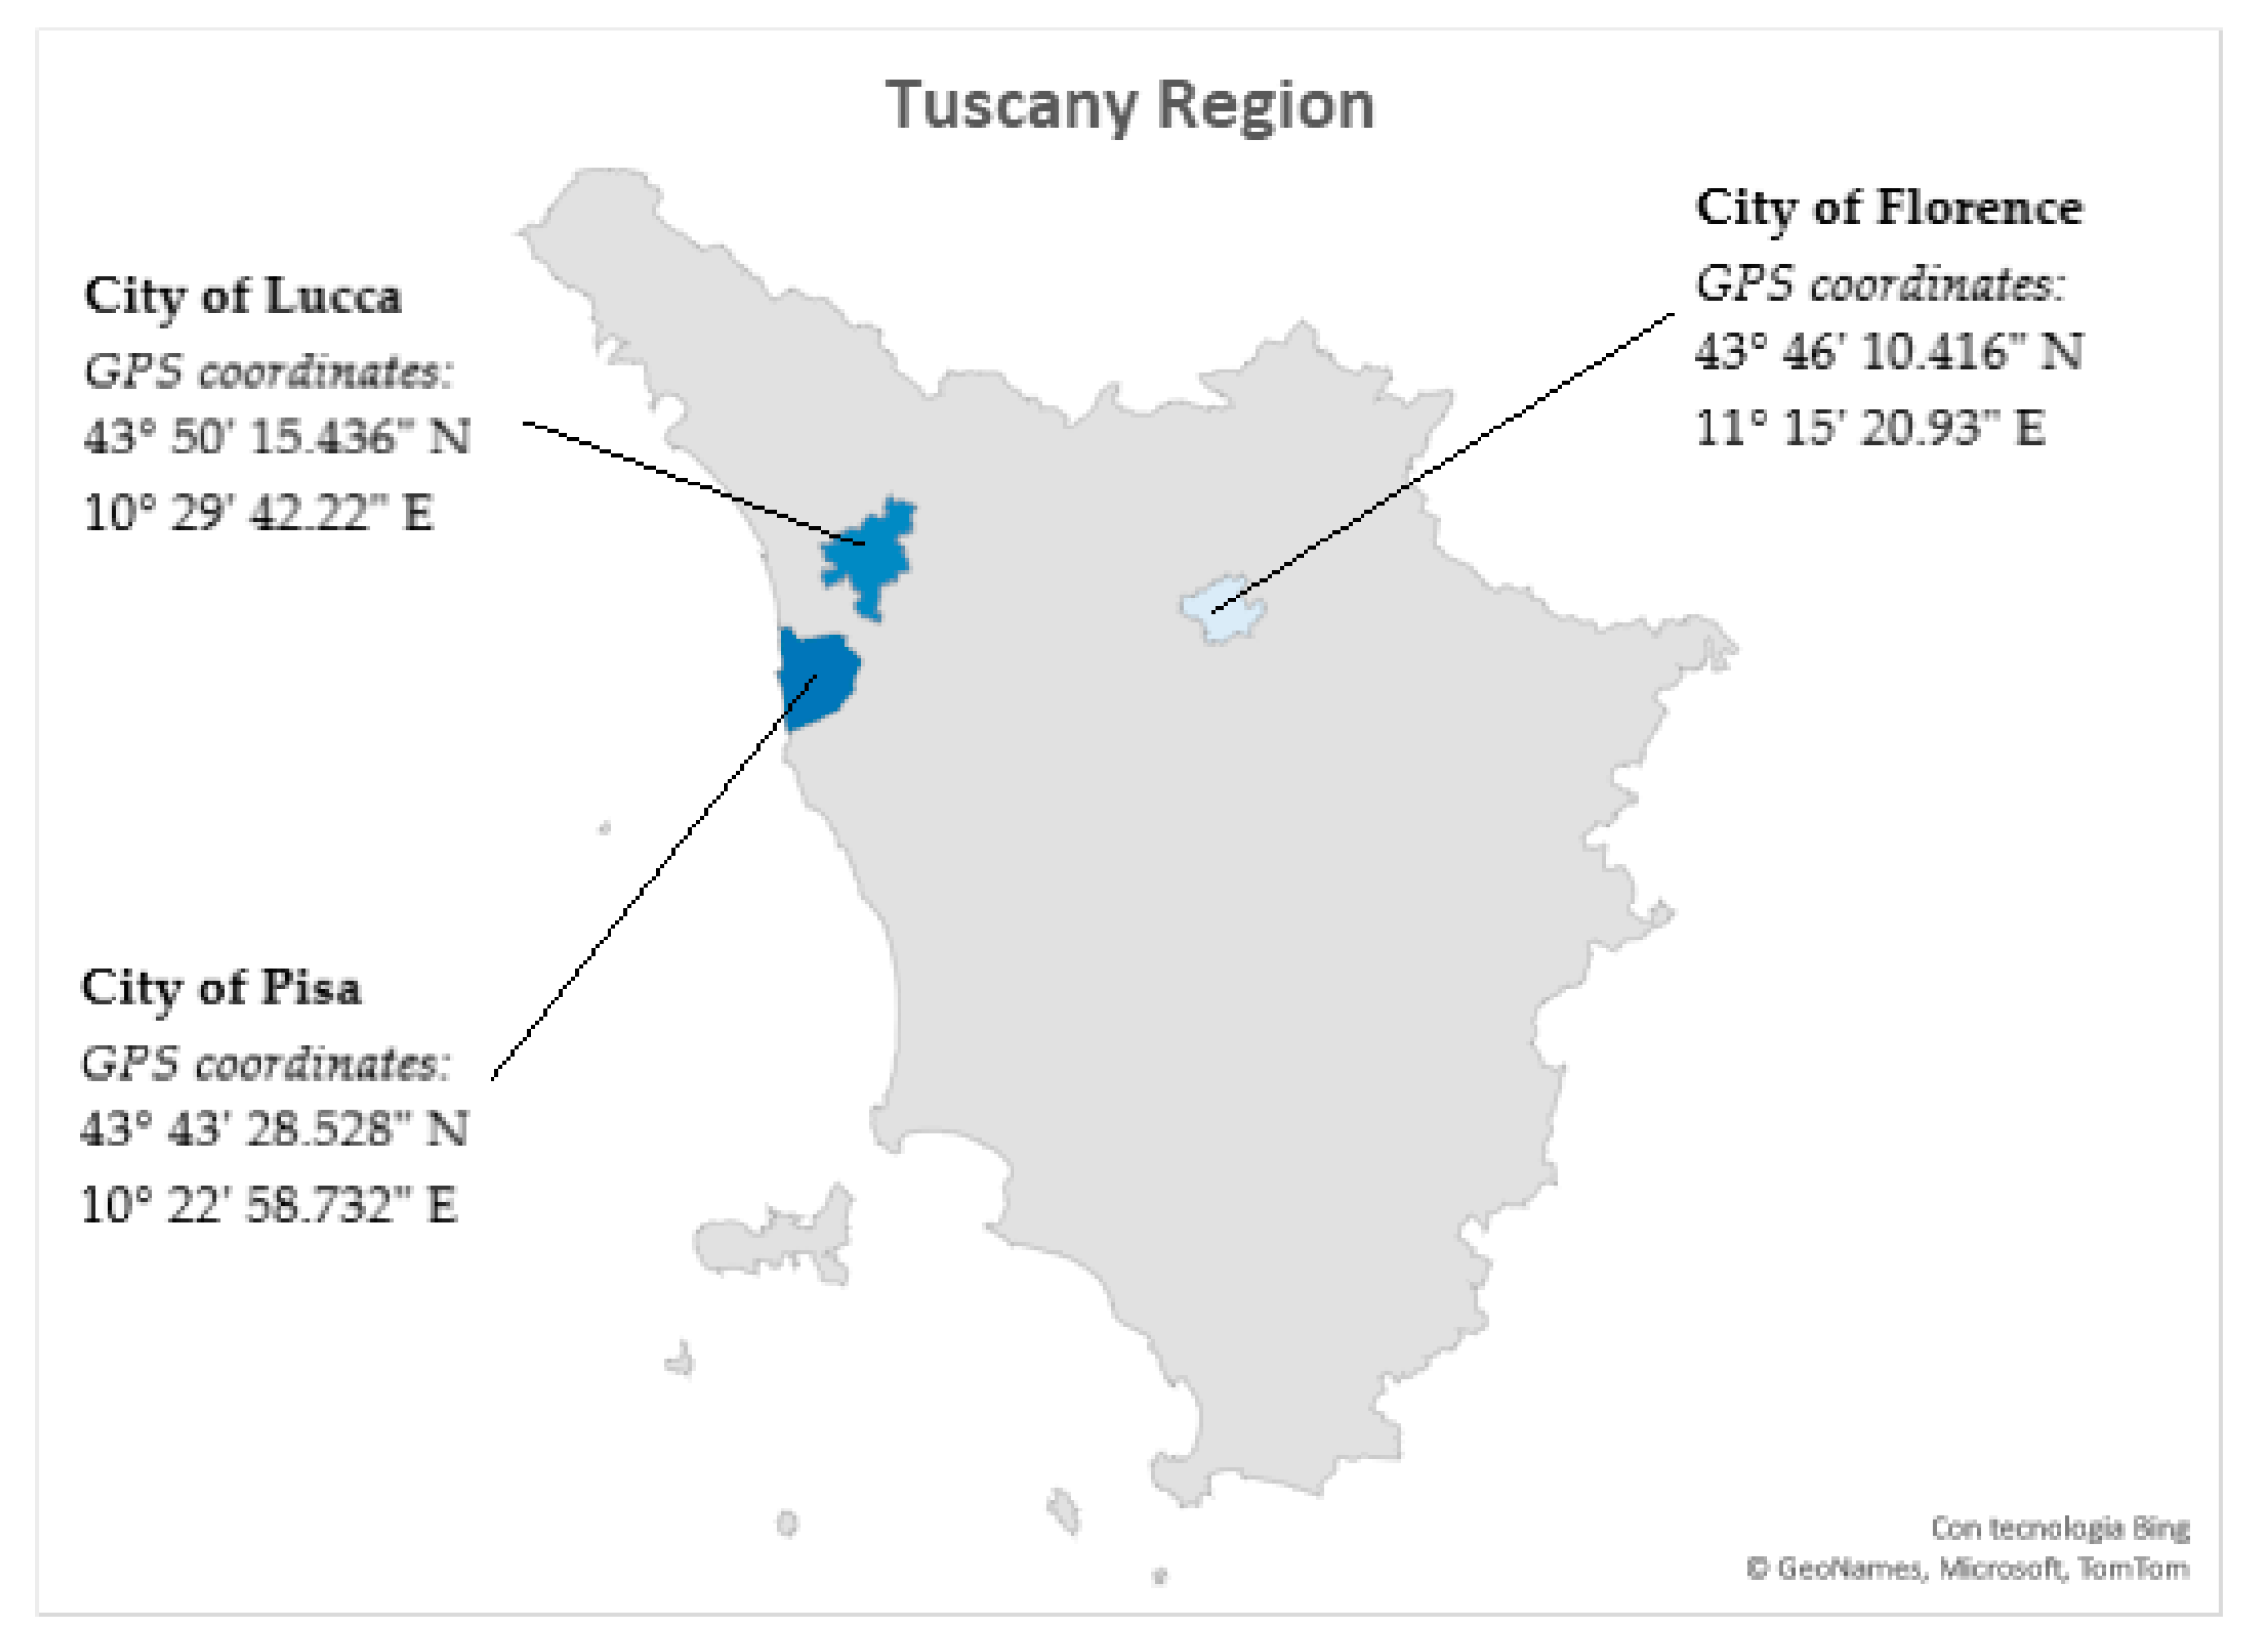
2.1. Area of the Study

We identified three cities for this study (Figure 1), all located in Tuscany’s northern region:
  • Florence, the capital city of the Tuscany region and the Province of Florence, is the most populated, with about 372,000 inhabitants that live in the municipality, but over 1,520,000 that live in the greater metropolitan area;
  • Pisa, the capital city of the Province of Pisa, has over 91,000 residents living in the municipality and about 200,000 living in the surrounding area;
  • Lucca, the capital city of the Province of Lucca, which has more than 90,000 residents.
Each of these cities has problems related to air quality, with the measured pollutant values often exceeding EU law’s daily limits. In contrast, the selected cities differ amongst several characteristics, such as the number of inhabitants (http://demo.istat.it/pop2020/index.html) and geophysical attributes. While Pisa’s and Lucca’s population is similar, we must consider that Pisa is a city with three universities. During the day, Pisa’s population practically doubles, except during the lockdown period, when the universities’ activities were minimal because of the government-imposed restrictions.

2.2. Air-Quality and Meteorological Data Collection and Processing

We based the data used in the following analyses from ARPAT (Agenzia Regionale per la Protezione Ambientale della Toscana, the Regional Agency for the Environmental Protection of Tuscany) website (http://www.arpat.toscana.it/temi-ambientali/aria/qualita-aria/). The analyses include measures of the four pollutants (PM10, PM2.5, NO2, and O3) daily average during the period from 1 January 2019, to 12 August 2020, with gaps, at times, because of unavailable data. We call these eight months the sampling period. In practice, however, we used only the data from 1 January to 12 August 2019, and the same period for the year 2020, to perform the statistical analyses. We call these two timeframes the standard periods.
We collected the data from the three cities (Firenze, Lucca, and Pisa). For each city and each pollutant, we specify the number of measuring stations in Table 1. The number of stations in each city varies according to the contaminant measured and the actual city. ARPAT provided data verification and validation by monitoring the instrumental performance and applying quality-control procedures.
For each pollutant, from 1 January 2019, we focused on the two standard periods dividing it further into the following subperiods:
  • [1 January–8 March 2019] vs. [1 January–8 March 2020] → pre-lockdown period;
  • [9 March–3 June 2019] vs. [9 March–3 June 2020] → lockdown period;
  • [4 June–12 August 2019] vs. [4 June–12 August 2020] → post-lockdown period.
We used a paired t-test to determine whether the mean difference between the two sets of observations was significant. The null hypothesis (H0) assumed that the true mean difference between the paired samples was zero, while the alternative hypothesis (H1) assumed that the true mean difference between the paired samples was not equal to zero. We chose the cutoff value of 0.05 to determine statistical significance. This value corresponds to a 5% (or less) chance of obtaining a result like the one that was observed if the null hypothesis was true. Regarding the main assumptions of the paired t-test, it is reasonable to assume that the observations were independent of one another. Furthermore, we tested the assumption of normality and found that the data were approximately normally distributed. Finally, we examined the relative percentage variation of the average concentrations throughout the subperiods.
For this analysis, we downloaded data on wind speed, rainfall, relative humidity, temperature, and solar irradiance for the entire period from the Meteoblue AG–Switzerland website (https://www.meteoblue.com) and from the Meteorological Archive of Tuscany website (https://www.ilmeteo.it/portale/archivio-meteo/toscana). Moreover, on 28–29 March 2020, the local environmental protection agency reported only one transport dust phenomenon from Asia and North Africa [12]. Therefore, we excluded PM10 and PM2.5 values for the same days in our analysis, ensuring we considered only significant and comparable data.
To give further details concerning the meteorological data, we used the following data measured at the Pisa San Giusto, Firenze Peretola, and Lucca meteorological stations: average daily air temperature (as Celsius degrees), average daily air humidity (as a percentage value), average daily wind speed (as km/h), and average daily sea-level air pressure (as mbar). For both 2019 and 2020, we did not derive statistically significant differences. In particular, we considered the wind speed as average daily wind speed and not the wind directions during each period for the two years, 2019 and 2020, since the measuring stations are distant from each other, and since we are not interested in the directions in which the pollutants are spread but only in their values as measured by every measuring station. In all the three cases of Pisa San Giusto, Firenze Peretola, and Lucca, we found that the average daily wind speed differences between the same periods of the two years 2019 and 2020 were not statistically significant at a α = 0.05 level.

3. Results and Discussion

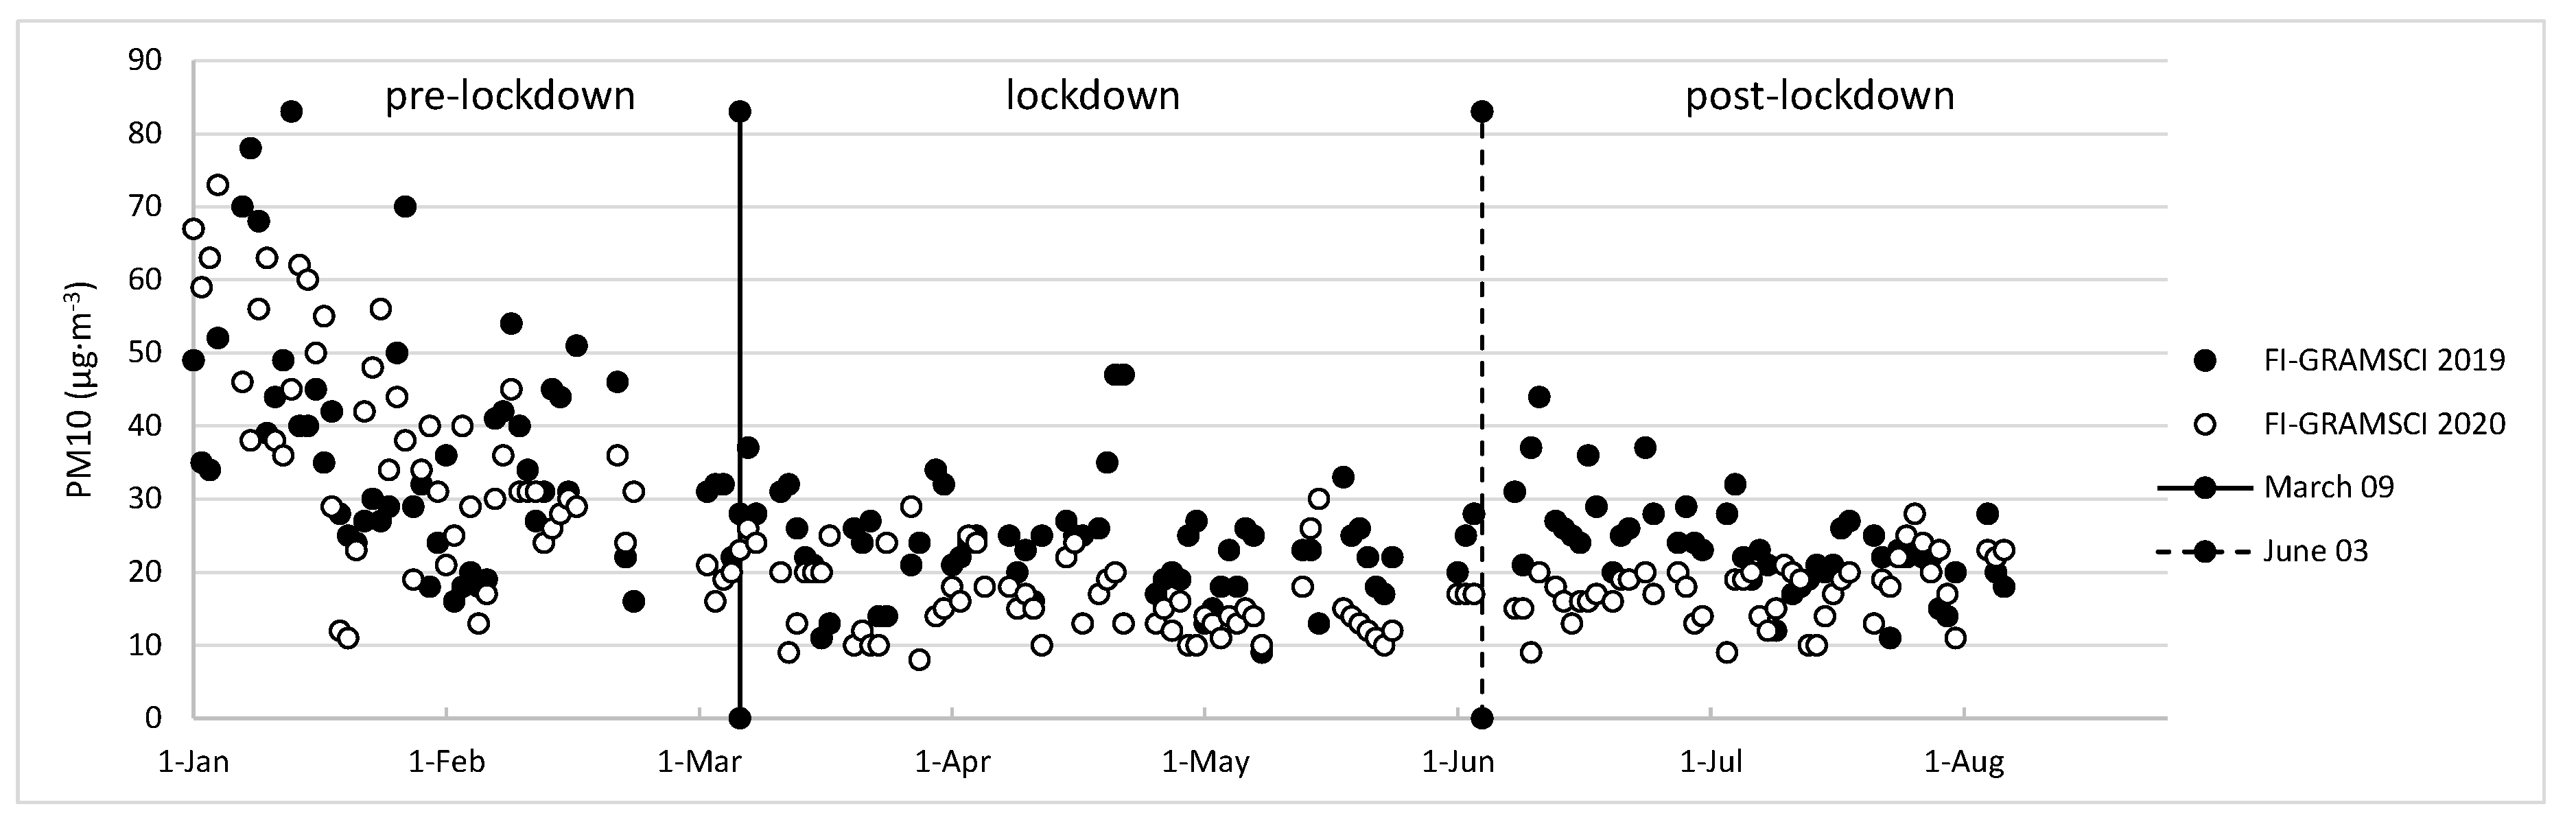
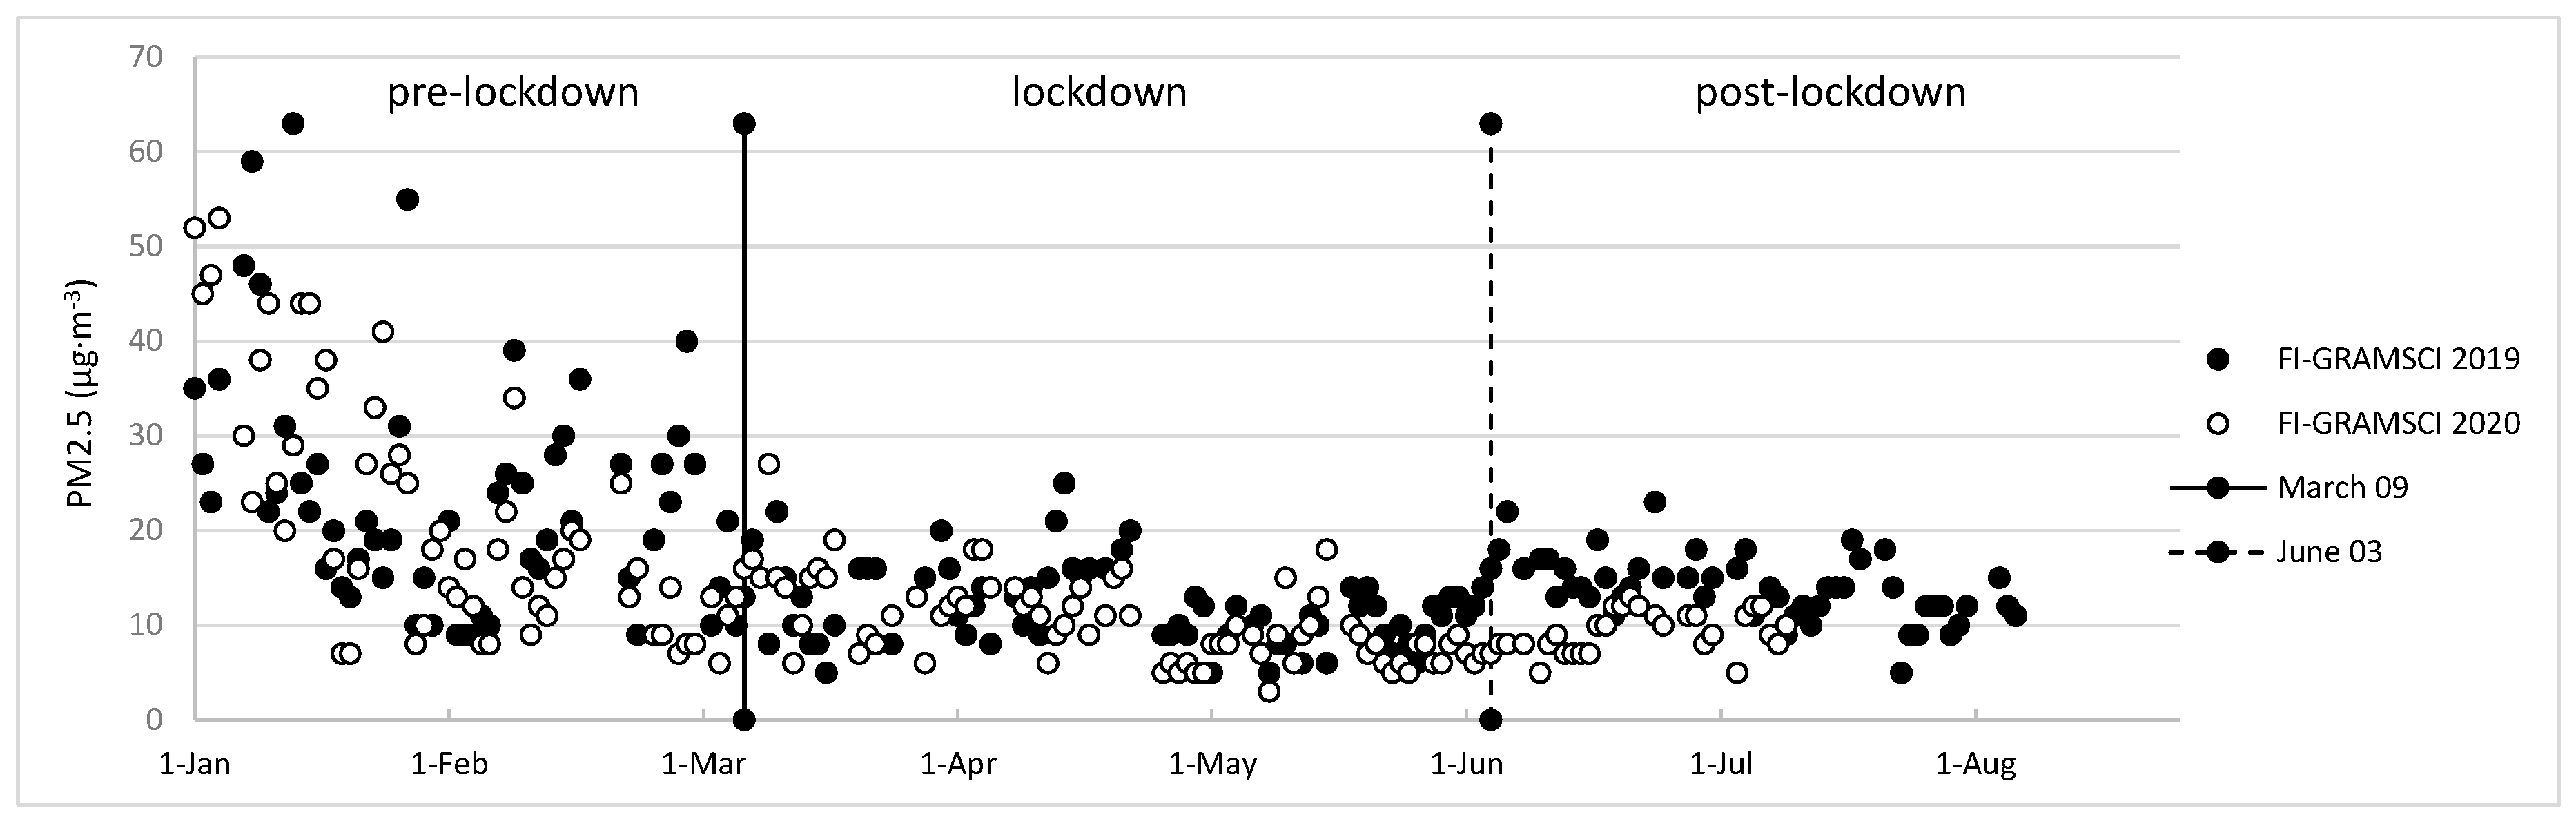
3.1. Particulate Matter

Compared to the same period in 2019, PM10 and PM2.5 concentrations during the pre-lockdown period are not significantly different between the air-monitoring stations across the three cities, Florence, Pisa, and Lucca. Table 2 and Table 3 show that the FI-GRAMSCI monitoring station is the only air-monitoring station in which there was a statistically significant reduction of PM10 and PM2.5 during the lockdown period, with a variation of about 30.8% and 50.1%, respectively. On the other hand, there was no significant difference between the remaining air-monitoring stations. This result is in line with a recent report on outdoor air pollution changes in Scotland during the COVID-19 lockdown, which showed that PM concentrations did not decline, despite reducing vehicular traffic [13]. It is very likely that the environmental response, measured as the reduction in PM concentrations, varies according to the dominant source of emission in each country and because of the specific meteorological conditions [14].
Unexpectedly, we also observed an increase in the PM2.5 concentration at the PI-BORGHETTO monitoring station, the Pisa city center traffic station, with a variation of about 33.3%. Changes in meteorological conditions do not explain these variations, given the absence of a significant difference between the two years. We hypothesize that because people spent more time indoors during the lockdown period, the higher levels of PM2.5 are associated with the increased use of heating systems in buildings. Moreover, we hypothesize there was only a small change in the volume of traffic in this area of the city. This hypothesis highlights that other PM sources are significantly present and that holistic source-control measures are needed for improved air quality in urban environments [15].
Figure 2 and Figure 3 graph the PM10 and PM2.5 daily mean concentrations for the three stations in which we note a statistically significant difference. Although previous studies reported a decrease of PM10 and PM2.5 concentrations [16,17,18,19], we noticed that they had compared the two periods of the same year: the pre-lockdown and lockdown period. In our view, this methodology represents a bias since, every year, it is possible to observe a decrease of particulate matter concentrations due to seasonal variations [20]. However, other studies reported a reduction in PM, using a methodology similar to ours, for example, by comparing the same periods of the previous year or with averages of several prior years [21,22,23,24]. These differences should be interpreted in light of the aforementioned variations in meteorological conditions and sources of emissions between different countries and cities. Regarding the FI-GRAMSCI measuring station, we must consider that it is the critical point (hot spot) in Tuscany, with much higher values than any other air-monitoring station. Therefore, this result should be interpreted with this peculiarity in mind and confirmed with further analyses by comparing this station with similar hot-spot air-monitoring stations in other cities than Pisa, Lucca, and Florence itself. Overall, our results show no direct evidence of a relationship between the implementation of the lockdown measures and the reduction of particulate matter in urban centers, except heavy traffic areas. Further research is needed to clarify this relationship, and it would also be interesting to examine the citizens’ risk perception of air pollution in the context of the current Covid-19 emergency [25].

3.2. Nitrogen Dioxide
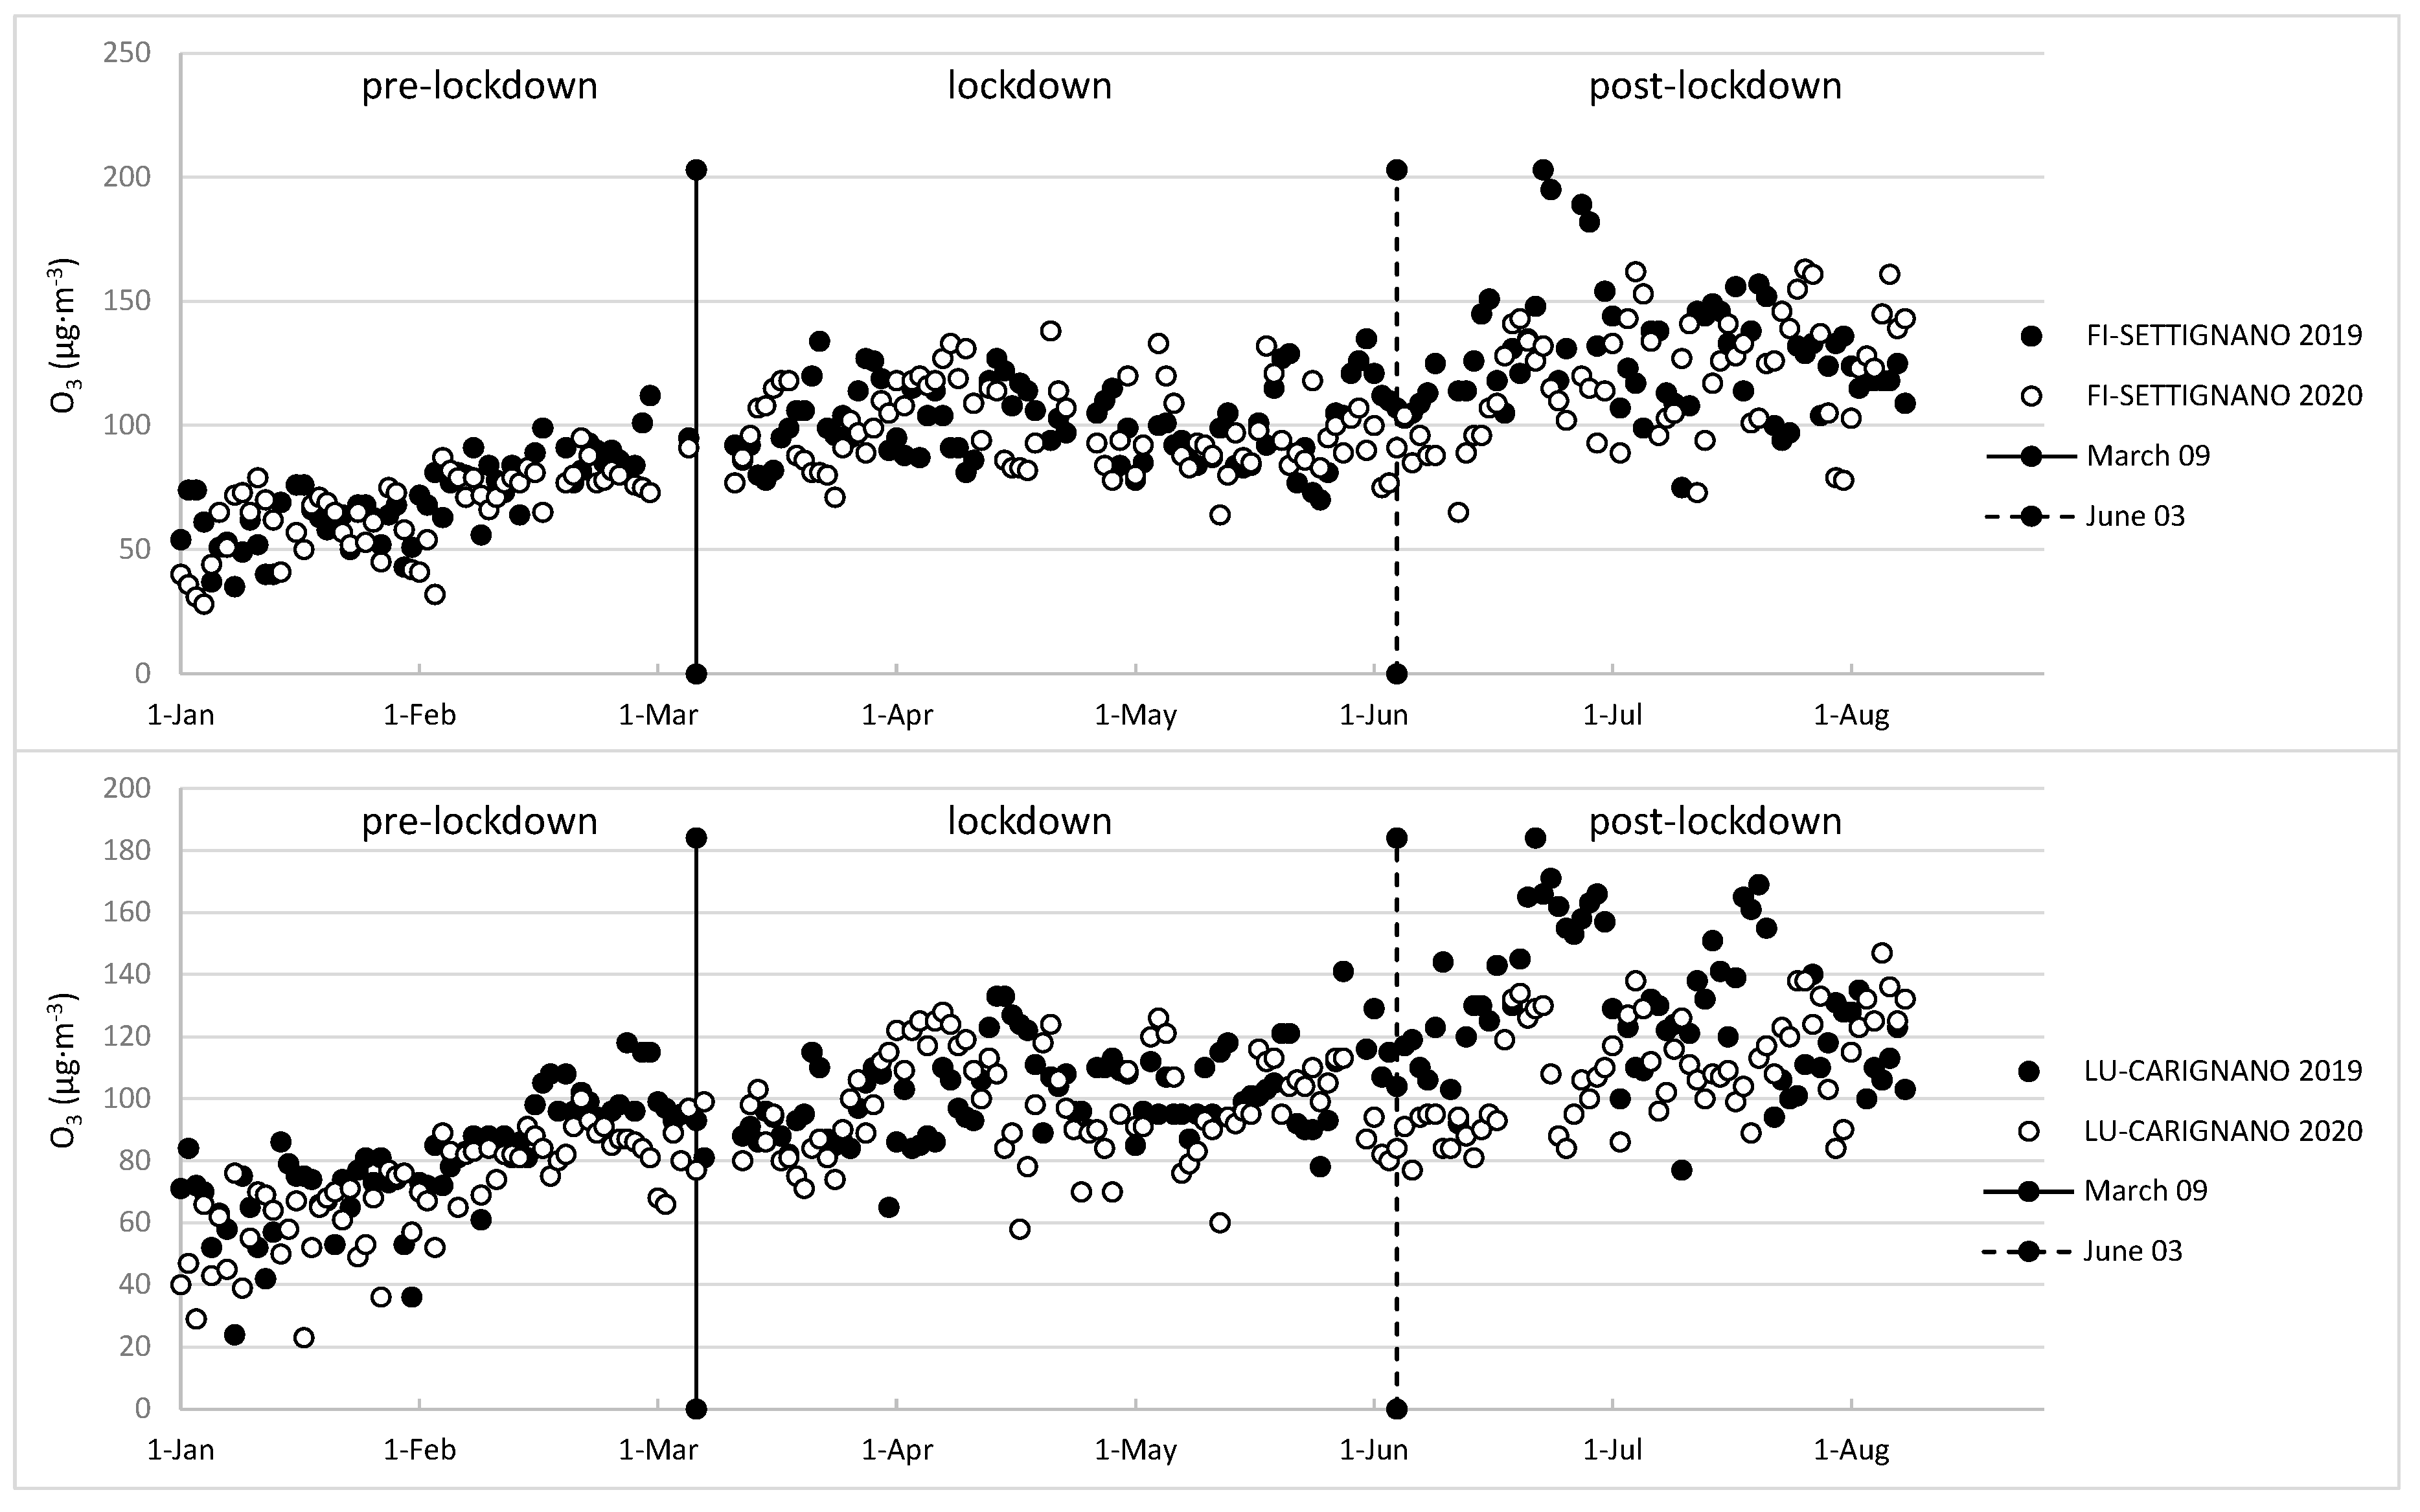
NO2 primarily gets in the air from burning fuel from cars, trucks, buses, power plants, and off-road equipment. It reacts with other chemicals in the air to form both PM and O3, and it is harmful when inhaled due to the effect it has on the respiratory system. While we noted fluctuating NO2 levels in different areas, the concentration of NO2, during the lockdown was significantly less among all the air-monitoring stations across the cities included in this study. Table 4 indicates statistically significant reductions (p < 0.05) of NO2 concentration during the lockdown period, compared to the same period of 2019. These results clearly indicate that reducing traffic emissions contributes to lower NO2 concentration levels and represents a significant improvement in public health. They should motivate us to adopt new urban mobility policies to reduce pollution in our cities and protect human health even after the COVID-19 crisis [26].
Figure 4 exhibits the daily mean of NO2 concentration during the three periods.
In detail, compared to the levels in 2019, concentrations of NO2 decreased by 38.5%, 32.1%, 39.4%, 40.1%, 41.6%, 35.0%, and 39.4%, respectively, at the FI-GRAMSCI, FI-BASSI, FI-MOSSE, PI-BORGHETTO, PI-PASSI, LU-MICHELETTO, and LU-CARIGNANO measuring stations. These results are consistent with the findings of previously published works. For example, Nakada et al., 2020 [22], observed a decrease of up to 54.3% in NO2 concentrations (μg∙m−3) in the urban roads of São Paulo state, Brazil. Moreover, Collivignarelli et al., 2020, observed a drastic drop in the concentration of NOx and NO2 in all the areas covered by that study on air quality in Milan, Italy. Researchers also noted an apparent decrease in NO2 levels in Rio de Janeiro, Brazil [19], in 22 cities covering different regions of India [21], the megacity Delhi, India [18], the Yangtze River Delta Region [23], and 44 cities in Northern China [24]. Satellite measurements also capture regional NO2 concentration reductions in air quality by the TROPOspheric Monitoring Instrument (TROPOMI) on the European Space Agency’s Sentinel-5 satellite [27].
As shown in Table 5, we must point out that the NO2 concentration during 2020, is statistically lower than that of 2019, even before the lockdown. However, the variations during the lockdown are higher, leading us to deduce that the decrease in vehicular traffic positively affected the air quality. Road traffic is the principal outdoor source of nitrogen dioxide [28], and the relationship between traffic and NO2 has been examined in many studies [29,30,31].

3.3. Ozone

Tropospheric O3 is a harmful air pollutant created by chemical reactions between NOx and volatile organic compounds (VOC) in the presence of sunlight. A recent study showed that the lockdown measures caused an increase of O3 concentrations at urban stations of four Southern European cities and Wuhan (China). This phenomenon’s explanation is mainly based on the unprecedented reduction in NOx emissions leading to a lower O3 titration by NO [32]. On the other hand, our results show that the O3 concentration did not show significant reductions during the period of lockdown (Table 6). Figure 5 shows the increasing ozone trend across the three periods, a typical phenomenon observed during the spring season due to the higher solar radiation [33]. However, we must point out that our data are related to background and suburban stations, and, for this reason, we cannot compare them with the aforementioned study, and we cannot draw any significant conclusions about O3 general trends in urban areas.

4. Conclusions

In this article, we assessed the impact of the Italian nationwide lockdown due to the COVID-19 outbreak on air quality in three medium-sized cities. The strict travel restrictions and limitations on the movement between and within the cities during the Italian lockdown period provided an unprecedented opportunity to assess anthropogenic activities’ effect on urban air quality. More specifically, the adopted restrictive measures resulted mainly in a significant reduction in vehicular traffic and industrial activities. We aimed to evaluate the effects of these restrictive measures on the concentration of four primary air pollutants collected by the Regional Agency for the Environmental Protection of Tuscany, which are PM10, PM2.5, NO2, and O3. Our results did not show significant reductions in PM levels during the lockdown period, except at one monitoring station in an area of heavy traffic, which is considered a hot spot because of the consistently high levels recorded for all of Tuscany. These results are not consistent with the published studies on this topic, and we can assume that the environmental response varies according to the dominant emission source and the specific meteorological conditions. Our research field should further explore the interrelationship between the different sources of emissions and particulate matter concentration. On the other hand, the reduction in NO2 pollution levels, consistent with other studies, was statistically significant at all the air-monitoring stations across the cities used in this study, showing a relevant traffic volume relationship. These results should motivate the politicians to adopt new urban policies to reduce pollution in our cities and protect human health even after the COVID-19 crisis. Finally, for O3 pollutant levels, we did not observe a significant reduction during the lockdown period. However, we should take into account that none of these monitoring stations are placed in the traffic areas, and, therefore, we cannot draw significant conclusions on the trend of O3 during the lockdown period. In conclusion, we believe it is necessary to adopt holistic source-control measures for improved air quality in urban environments.

Author Contributions

Conceptualization, M.M.M.S.-V. and G.D.; methodology, G.D., L.C., M.C., and A.L.M.; software, G.D., L.C., M.C., and A.L.M.; validation, G.D., L.C., and A.L.M.; formal analysis, G.D., L.C., and A.L.M.; G.D., L.C., and A.L.M.; writing—original draft preparation, G.D., L.C., and A.L.M.; writing—review and editing, M.M.M.S.-V. and G.D.; supervision, M.M.M.S.-V. All authors have read and agreed to the published version of the manuscript.

Funding

This research received no external funding.

Acknowledgments

We wish to thank Maria Grazia De Agazio for proofreading, editing, and assisting with translating the English manuscript.

Conflicts of Interest

The authors declare no conflict of interest.

References

  1. European Environment Agency. Air Quality in Europe 2019. Available online: https://www.eea.europa.eu/publications/air-quality-in-europe-2019 (accessed on 29 August 2020).
  2. Galindo, N.; Varea, M.; Gil-Molto, J.; Yubero, E.; Nicolas, J. The Influence of Meteorology on Particulate Matter Concentrations at an Urban Mediterranean Location. Water Air Soil Pollut. 2009, 215, 365–372. [Google Scholar] [CrossRef]
  3. Goldberg, D.L.; Anenberg, S.C.; Griffin, D.; McLinden, C.A.; Lu, Z.; Streets, D.G. Disentangling the Impact of the COVID-19 Lockdowns on Urban NO2 From Natural Variability. Geophys. Res. Lett. 2020, 47, e2020GL089269. [Google Scholar] [CrossRef] [PubMed]
  4. Camalier, L.; Cox, W.; Dolwick, P. The effects of meteorology on ozone in urban areas and their use in assessing ozone trends. Atmos. Environ. 2007, 41, 7127–7137. [Google Scholar] [CrossRef]
  5. Tomassetti, L.; Torre, M.; Tratzi, P.; Paolini, V.; Rizza, V.; Segreto, M.; Petracchini, F. Evaluation of air quality and mobility policies in 14 large Italian cities from 2006 to 2016. J. Environ. Sci. Health A Toxic Hazard. Subst. Environ. Eng. 2020, 55, 886–902. [Google Scholar] [CrossRef] [PubMed]
  6. Legambiente. Mal’Aria di Città; Legambiente: Rovigo, Italy, 2020. [Google Scholar]
  7. Cerami, C.; Santi, G.C.; Galandra, C.; Dodich, A.; Cappa, S.F.; Vecchi, T.; Crespi, C. Covid-19 Outbreak in Italy: Are We Ready for the Psychosocial and the Economic Crisis? Baseline Findings from the PsyCovid Study. Front. Psychiatry 2020, 11. [Google Scholar] [CrossRef] [PubMed]
  8. Favieri, F.; Forte, G.; Tambelli, R.; Casagrande, M. The Italians in the Time of Coronavirus: Psychosocial Aspects of Unexpected COVID-19 Pandemic; Social Science Research Network: Rochester, NY, USA, 2020. [Google Scholar]
  9. Aletta, F.; Brinchi, S.; Carrese, S.; Gemma, A.; Guattari, C.; Mannini, L.; Patella, S.M. Analysing urban traffic volumes and mapping noise emissions in Rome (Italy) in the context of containment measures for the COVID-19 disease. Noise Mapp. 2020, 7, 114–122. [Google Scholar] [CrossRef]
  10. Gazzetta Ufficiale della Republica Italiana n. 62, 09.03.2020. Covid-19, D.P.C.M. 09.03.2020. Available online: http://www.regioni.it/news/2020/03/12/covid-19-d-p-c-m-09-03-2020-pubblicato-nella-gazzetta-ufficiale-n-62-del-09-03-2020-607000/ (accessed on 29 August 2020).
  11. Gazzetta Ufficiale della Republica Italiana n. 76 del 22.03.2020. Covid-19, Ulteriori Disposizioni Attuative Dl 6/2020, DPCM 22.03.2020. Available online: http://www.regioni.it/news/2020/03/23/covid-19-ulteriori-disposizioni-attuative-dl-62020-dpcm-22-03-2020-gazzetta-ufficiale-n-76-del-22-03-2020-607770/ (accessed on 29 August 2020).
  12. ARPAT—Agenzia Regionale per la Protezione Ambientale della Toscana. Valori anomali di PM10 in Toscana il 28 e 29 marzo 2020. Available online: http://www.arpat.toscana.it/notizie/notizie-brevi/2020/valori-anomali-di-pm10-in-toscana-il-28-e-29-marzo (accessed on 29 August 2020).
  13. Dobson, R.; Semple, S. Changes in outdoor air pollution due to COVID-19 lockdowns differ by pollutant: Evidence from Scotland. Occup. Environ. Med. 2020. [Google Scholar] [CrossRef]
  14. Giani, P.; Castruccio, S.; Anav, A.; Howard, D.; Hu, W.; Crippa, P. Short-term and long-term health impacts of air pollution reductions from COVID-19 lockdowns in China and Europe: A modelling study. Lancet Planet. Health 2020. [Google Scholar] [CrossRef]
  15. Kumar, P.; Hama, S.; Omidvarborna, H.; Sharma, A.; Sahani, J.; Abhijith, K.V.; Debele, S.E.; Zavala-Reyes, J.C.; Barwise, Y.; Tiwari, A. Temporary reduction in fine particulate matter due to ‘anthropogenic emissions switch-off’ during COVID-19 lockdown in Indian cities. Sustain. Cities Soc. 2020, 62, 102382. [Google Scholar] [CrossRef]
  16. Abdullah, S.; Mansor, A.A.; Napi, N.N.L.M.; Mansor, W.N.W.; Ahmed, A.N.; Ismail, M.; Ramly, Z.T.A. Air quality status during 2020 Malaysia Movement Control Order (MCO) due to 2019 novel coronavirus (2019-nCoV) pandemic. Sci. Total Environ. 2020, 729, 139022. [Google Scholar] [CrossRef]
  17. Collivignarelli, M.C.; Abbà, A.; Bertanza, G.; Pedrazzani, R.; Ricciardi, P.; Carnevale Miino, M. Lockdown for CoViD-2019 in Milan: What are the effects on air quality? Sci. Total Environ. 2020, 732, 139280. [Google Scholar] [CrossRef] [PubMed]
  18. Mahato, S.; Pal, S.; Ghosh, K.G. Effect of lockdown amid COVID-19 pandemic on air quality of the megacity Delhi, India. Sci. Total Environ. 2020, 730, 139086. [Google Scholar] [CrossRef] [PubMed]
  19. Dantas, G.; Siciliano, B.; França, B.B.; da Silva, C.M.; Arbilla, G. The impact of COVID-19 partial lockdown on the air quality of the city of Rio de Janeiro, Brazil. Sci. Total Environ. 2020, 729, 139085. [Google Scholar] [CrossRef]
  20. Karar, K.; Gupta, A.K.; Kumar, A.; Biswas, A.K. Seasonal Variations of PM10 and TSP in Residential and Industrial Sites in an Urban Area of Kolkata, India. Environ. Monit. Assess. 2006, 118, 369–381. [Google Scholar] [CrossRef] [PubMed]
  21. Sharma, S.; Zhang, M.; Gao, J.A.; Zhang, H.; Kota, S.H. Effect of restricted emissions during COVID-19 on air quality in India. Sci. Total Environ. 2020, 728, 138878. [Google Scholar] [CrossRef]
  22. Nakada, L.Y.K.; Urban, R.C. COVID-19 pandemic: Impacts on the air quality during the partial lockdown in São Paulo state, Brazil. Sci. Total Environ. 2020, 730, 139087. [Google Scholar] [CrossRef]
  23. Li, L.; Li, Q.; Huang, L.; Wang, Q.; Zhu, A.; Xu, J.; Liu, Z.; Li, H.; Shi, L.; Li, R.; et al. Air quality changes during the COVID-19 lockdown over the Yangtze River Delta Region: An insight into the impact of human activity pattern changes on air pollution variation. Sci. Total Environ. 2020, 732, 139282. [Google Scholar] [CrossRef] [PubMed]
  24. Bao, R.; Zhang, A. Does lockdown reduce air pollution? Evidence from 44 cities in northern China. Sci. Total Environ. 2020, 731, 139052. [Google Scholar] [CrossRef]
  25. Cori, L.; Donzelli, G.; Gorini, F.; Bianchi, F.; Curzio, O. Risk Perception of Air Pollution: A Systematic Review Focused on Particulate Matter Exposure. Int. J. Environ. Res. Public Health 2020, 17, 6424. [Google Scholar] [CrossRef]
  26. Baldasano, J.M. COVID-19 lockdown effects on air quality by NO2 in the cities of Barcelona and Madrid (Spain). Sci. Total Environ. 2020, 741, 140353. [Google Scholar] [CrossRef]
  27. Nitrogen Dioxide. Available online: http://www.tropomi.eu/data-products/nitrogen-dioxide (accessed on 29 August 2020).
  28. Jarvis, D.J.; Adamkiewicz, G.; Heroux, M.-E.; Rapp, R.; Kelly, F.J. Nitrogen Dioxide; World Health Organization: Geneva, Switzerland, 2010. [Google Scholar]
  29. Hamra, G.B.; Laden, F.; Cohen, A.J.; Raaschou-Nielsen, O.; Brauer, M.; Loomis, D. Lung Cancer and Exposure to Nitrogen Dioxide and Traffic: A Systematic Review and Meta-Analysis. Environ. Health Perspect. 2015, 123, 1107–1112. [Google Scholar] [CrossRef] [PubMed]
  30. Zhang, L.; Guan, Y.; Leaderer, B.P.; Holford, T.R. Estimating Daily Nitrogen Dioxide Level: Exploring Traffic Effects. Ann. Appl. Stat. 2013, 7. [Google Scholar] [CrossRef] [PubMed] [Green Version]
  31. Gilbert, N.L.; Woodhouse, S.; Stieb, D.M.; Brook, J.R. Ambient nitrogen dioxide and distance from a major highway. Sci. Total Environ. 2003, 312, 43–46. [Google Scholar] [CrossRef]
  32. Sicard, P.; De Marco, A.; Agathokleous, E.; Feng, Z.; Xu, X.; Paoletti, E.; Rodriguez, J.J.D.; Calatayud, V. Amplified ozone pollution in cities during the COVID-19 lockdown. Sci. Total Environ. 2020, 735, 139542. [Google Scholar] [CrossRef] [PubMed]
  33. Agudelo–Castaneda, D.M.; Calesso Teixeira, E.; Norte Pereira, F. Time–series analysis of surface ozone and nitrogen oxides concentrations in an urban area at Brazil. Atmos. Pollut. Res. 2014, 5, 411–420. [Google Scholar] [CrossRef] [Green Version]
Figure 1. Map of the cities included in the study.
Atmosphere 11 01118 g001
Figure 2. The daily mean concentration of PM10 (μg∙m−3). In each graph, the lockdown period is depicted between the two vertical bars.
Atmosphere 11 01118 g002
Figure 3. The daily mean concentration of PM2.5 (μg∙m−3). In each graph, the lockdown period is depicted between the two vertical bars.
Atmosphere 11 01118 g003
Figure 4. The daily mean concentration of NO2 (μg∙m−3). The area between the vertical bars in each graph indicates the duration of the lockdown.
Atmosphere 11 01118 g004
Figure 5. The daily mean concentration of O3 (μg∙m−3). The area between the vertical bars in each graph indicates the duration of the lockdown duration.
Atmosphere 11 01118 g005
Table 1. Characteristics of the air-monitoring stations included in the study.
Air-Monitoring StationCityStation TypeArea TypePollutants
PM10PM2.5NO2O3
FI-GRAMSCIFlorenceTrafficUrban
FI-BASSIFlorenceBackgroundUrban
FI-MOSSEFlorenceTrafficUrban
FI-SETTIGNANOFlorenceBackgroundSuburban
PI-BORGHETTOPisaTrafficUrban
PI-PASSIPisaBackgroundUrban
LU-MICHELETTOLuccaTrafficUrban
LU-CARIGNANOLuccaBackgroundRural
LU-SAN-CONCORDIOLuccaBackgroundUrban
Station type. Traffic-measuring stations: air-monitoring stations located in areas where the pollution level is most influenced by traffic emissions from neighboring roads with medium-high traffic intensity. Background (or general) measuring stations: air-monitoring stations located where the pollution level is not influenced mostly by emissions from specific sources (industries, traffic, residential heating, etc.) but rather from a combination of all sources, upwind from the station concerning the predominant wind directions at the site. Area type. Urban fixed sampling site: a fixed site placed in a growing or predominantly built-up area. Suburban fixed sample site: a fixed site placed in largely built-up areas where there are both built-up and non-urbanized areas. Rural fixed sampling site: a fixed site selected in areas other than those identified for urban and suburban locations. The site is defined as remote rural if it is more than 50 km away from the emission sources. PM = particulate matter.
Table 2. Output of the two-sample t-test to evaluate the lockdown effects on PM10 air concentration. The PM10 values are expressed in μg∙m−3.
First Period
1 January–8 March
Second Period (Lockdown)
9 March–3 June
Third Period
4 June–12 August
Mean
(SD)
2019
Mean (SD)
2020
p-ValueMean (SD)
2019
Mean (SD)
2020
p-ValueMean (SD)
2019
Mean (SD)
2020
p-Value
FI-GRAMSCI37
(16)
36
(15)
0.63523
(7)
16
(6)
<0.00124
(9)
17
(4)
<0.001
FI-BASSI23
(16)
28
(14)
0.30014
(7)
15
(6)
0.18619
(7)
15
(4)
0.002
FI-MOSSE30
(18)
32
(16)
0.42714
(8)
15
(5)
0.26921
(8)
15
(4)
<0.001
PI-BORGHETTO39
(17)
36
(17)
0.23719
(8)
18
(7)
0.25526
(9)
18
(4)
<0.001
PI-PASSI35
(17)
33
(16)
0.22316
(7)
17
(6)
0.98222
(7)
15
(4)
<0.001
LU-MICHELETTO42
(20)
42
(25)
0.99617
(7)
19
(9)
0.14120
(7)
18
(7)
0.131
LU-SAN-CONCORDIO40
(18)
37
(21)
0.32215
(7)
18
(8)
0.03721
(7)
15
(4)
<0.001
Table 3. Output of the two-sample t-test to evaluate the lockdown effects on PM2.5 air concentration. The PM2.5 values are expressed in μg∙m−3.
First Period
1 January–8 March
Second Period (Lockdown)
9 March–3 June
Third Period
4 June–12 August
Mean (SD)
2019
Mean
(SD)
2020
p-ValueMean (SD)
2019
Mean
(SD)
2020
p-ValueMean (SD)
2019
Mean
(SD)
2020
p-Value
FI-GRAMSCI24
(12)
21
(13)
0.20712
(4)
10
(4)
0.04514
(3)
10
(3)
<0.001
FI-BASSI19
(13)
20
(14)
0.5529
(4)
10
(4)
0.05612
(3)
9
(3)
<0.001
PI-BORGHETTO25
(14)
22
(15)
0.1798
(3)
11
(5)
<0.00111
(3)
8
(3)
<0.001
PI-PASSI29
(15)
26
(17)
0.24511
(4)
12
(6)
0.43715
(4)
10
(3)
<0.001
Table 4. Output of the two-sample t-test to evaluate the effects of lockdown on NO2 air concentrations. The NO2 values are expressed in μg∙m−3.
First Period
1 January–8 March
Second Period (Lockdown)
9 March–3 June
Third Period
4 June–12 August
Mean (SD)
2019
Mean (SD)
2020
p-ValueMean (SD)
2019
Mean (SD)
2020
p-ValueMean (SD)
2019
Mean (SD)
2020
p-Value
FI-GRAMSCI117
(22)
110
(21)
0.08198
(18)
60
(22)
<0.00194
(22)
76
(13)
<0.001
FI-BASSI61
(23)
60
(18)
0.85636
(18)
25
(15)
<0.00131
(9)
22
(8)
<0.001
FI-MOSSE89
(23)
79
(18)
0.00559
(16)
36
(16)
<0.00146
(15)
34
(8)
<0.001
PI-BORGHETTO85
(14)
76
(16)
0.00358
(18)
35
(15)
<0.00148
(13)
34
(11)
<0.001
PI-PASSI64
(15)
55
(15)
0.00134
(15)
20
(11)
<0.00124
(6)
16
(4)
<0.001
LU-MICHELETTO69
(12)
58
(12)
<0.00145
(15)
29
(11)
<0.00135
(11)
27
(8)
<0.001
LU-CARIGNANO77
(17)
62
(13)
<0.00146
(18)
28
(14)
<0.00136
(10)
26
(8)
<0.001
Table 5. Variations NO2 (μg∙m−3) during the three periods.
First Period 2020 vs. 2019
1 January–8 March
Second Period 2020 vs. 2019
9 March–3 June
Third Period 2020 vs. 2019
4 June–12 August
FI-GRAMSCI5.7%38.5%19.6%
FI-BASSI1.0%32.1%28.3%
FI-MOSSE11.3%39.4%26.2%
PI-BORGHETTO9.7%40.1%29.4%
PI-PASSI13.2%41.6%33.1%
LU-MICHELETTO17.1%35.0%23.3%
LU-CARIGNANO19.6%39.4%25.9%
Table 6. Output of the two-sample t-test to evaluate the effects of lockdown on O3 air concentrations. The O3 values are expressed in μg∙m−3.
Pre-LockdownLockdownPost-Lockdown
Mean (SD)
2019
Mean
(SD)
2020
p-ValueMean (SD)
2019
Mean (SD)
2020
p-ValueMean (SD)
2019
Mean
(SD)
2020
p-Value
FI-SETTIGNANO70
(17)
66
(16)
0.067100
(15)
100
(17)
0.939128
(23)
116
(25)
0.007
PI-PASSI61
(19)
62
(20)
0.88692
(12)
95
(14)
0.198107
(16)
99
(15)
0.008
LU-CARIGNANO80
(19)
70
(17)
<0.001100
(14.0)
98.42 (17)0.423129
(23)
108
(18)
<0.001
Publisher’s Note: MDPI stays neutral with regard to jurisdictional claims in published maps and institutional affiliations.

