Hygienic Condition of Different Water Sources in the Kharaa River Basin, Mongolia in the Light of a Rapid Warming Trend

 ,
, 
Abstract
:1. Introduction
2. Methods
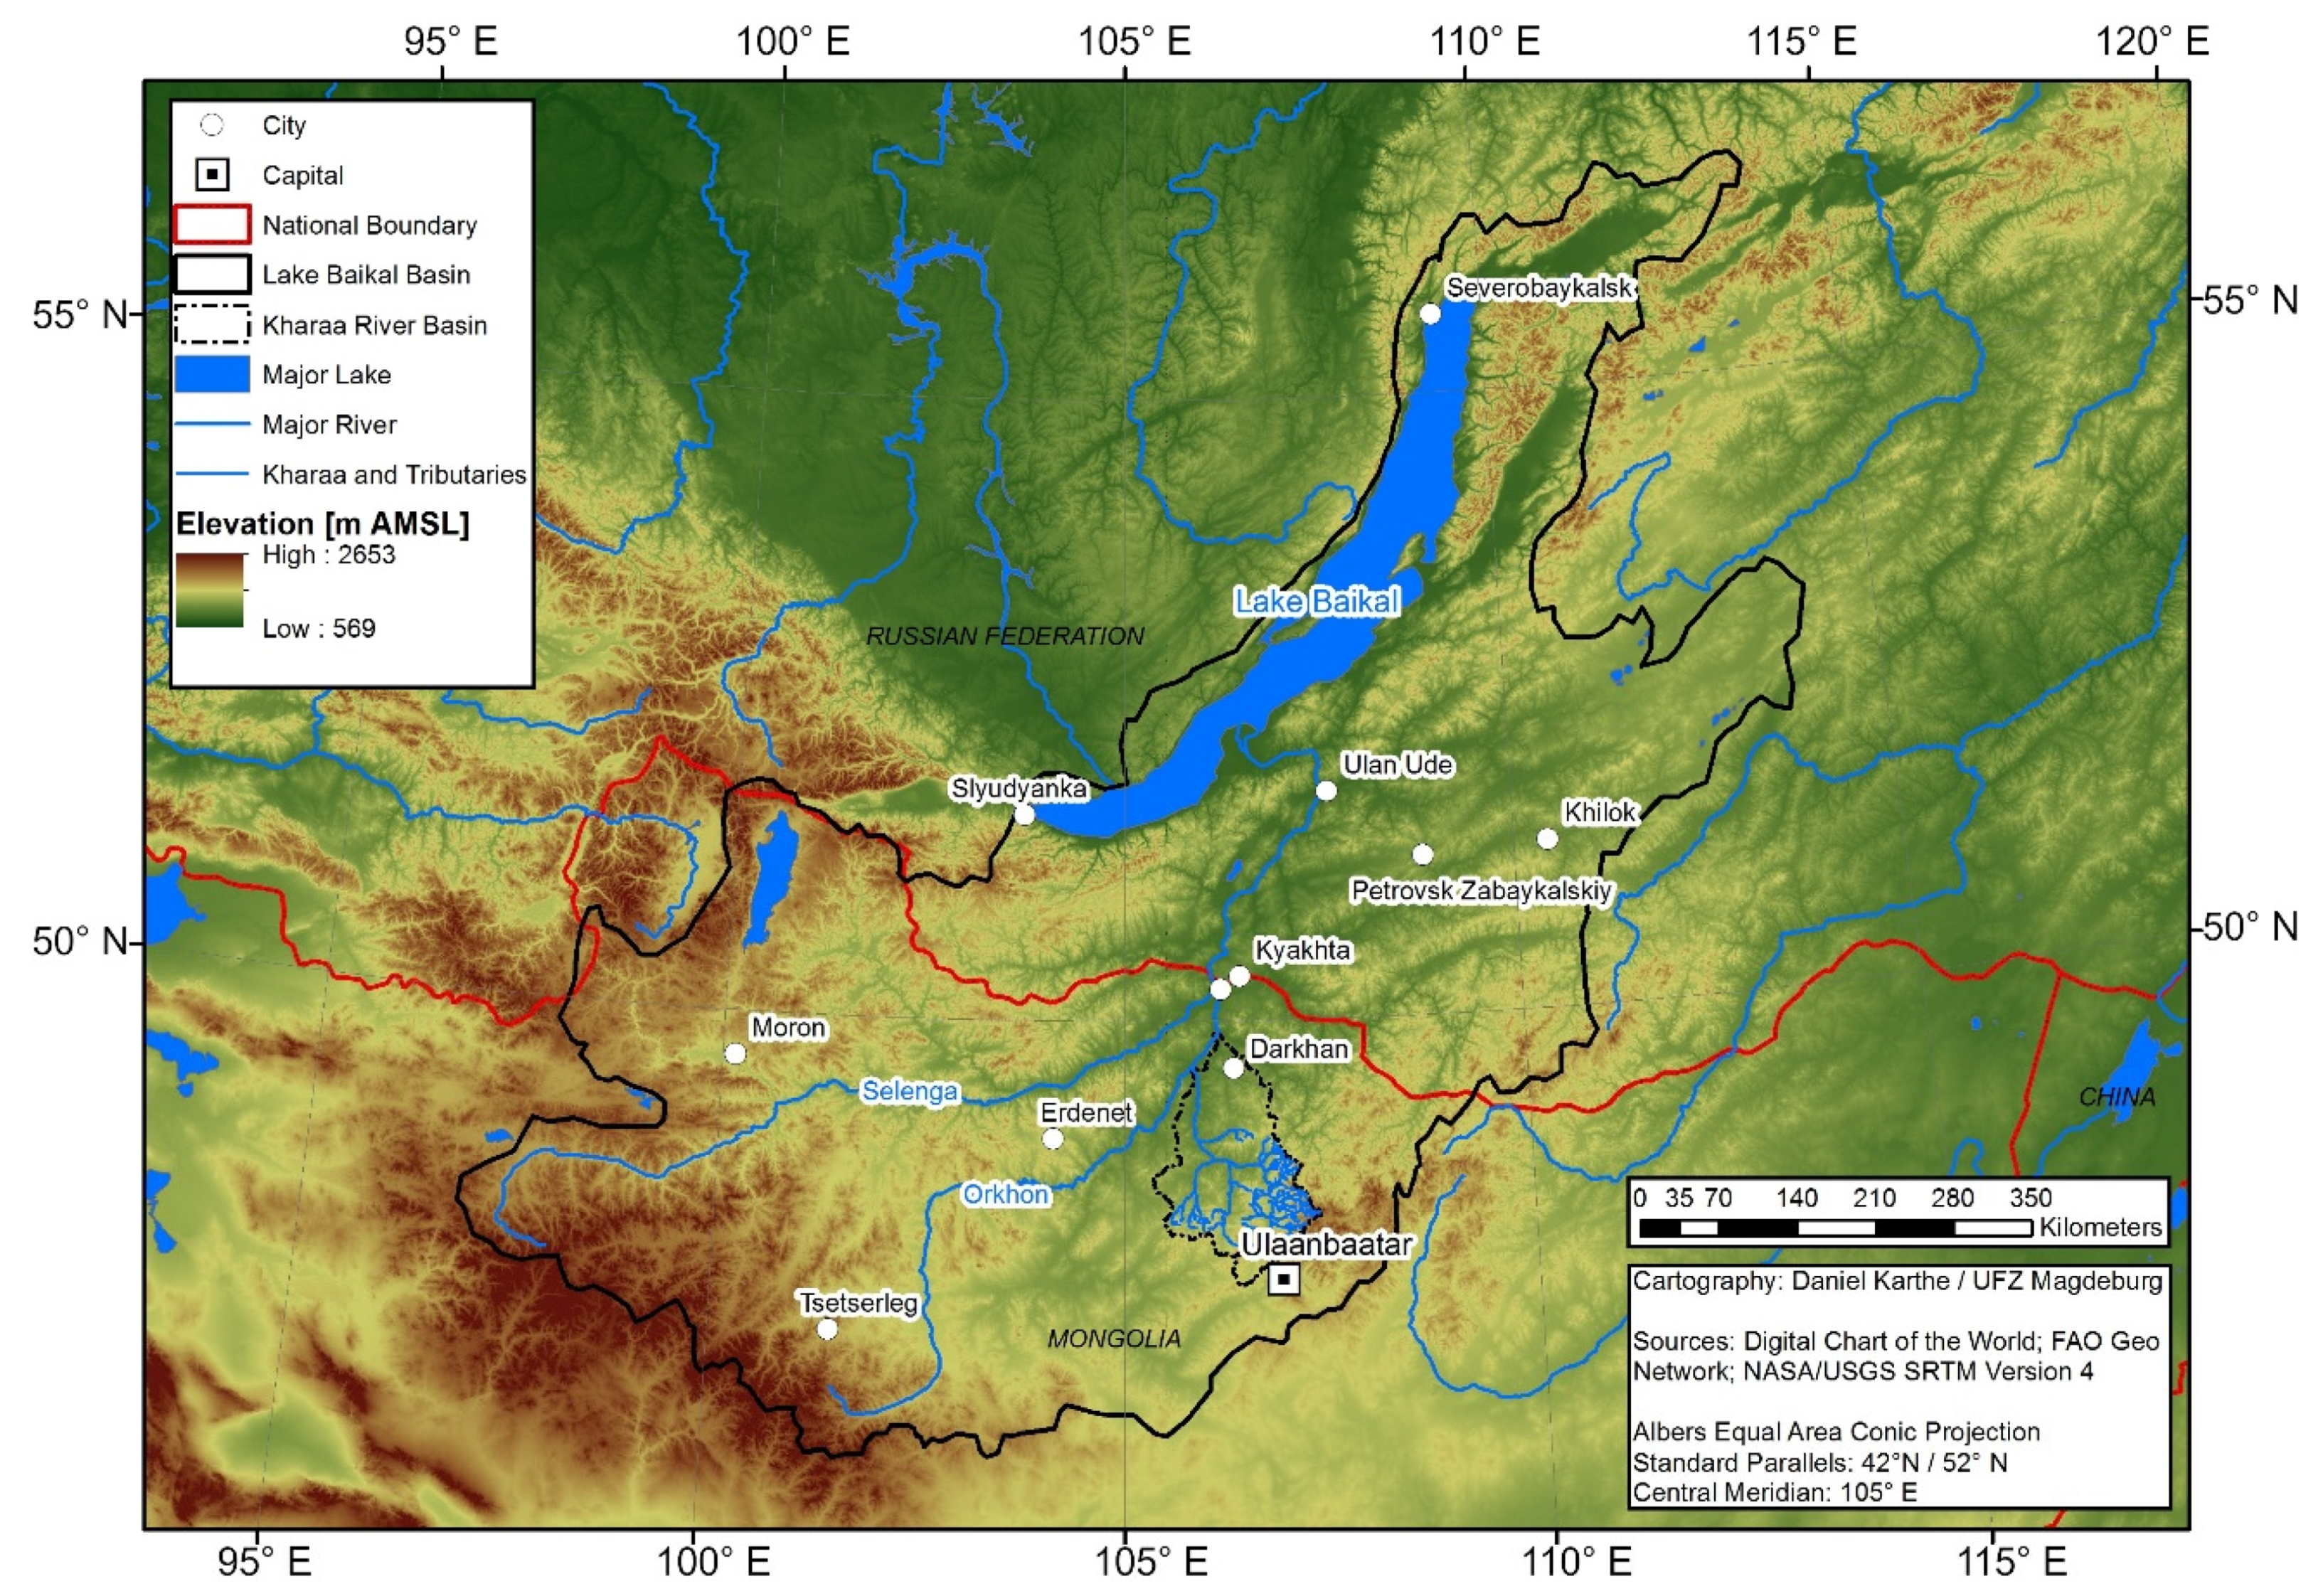
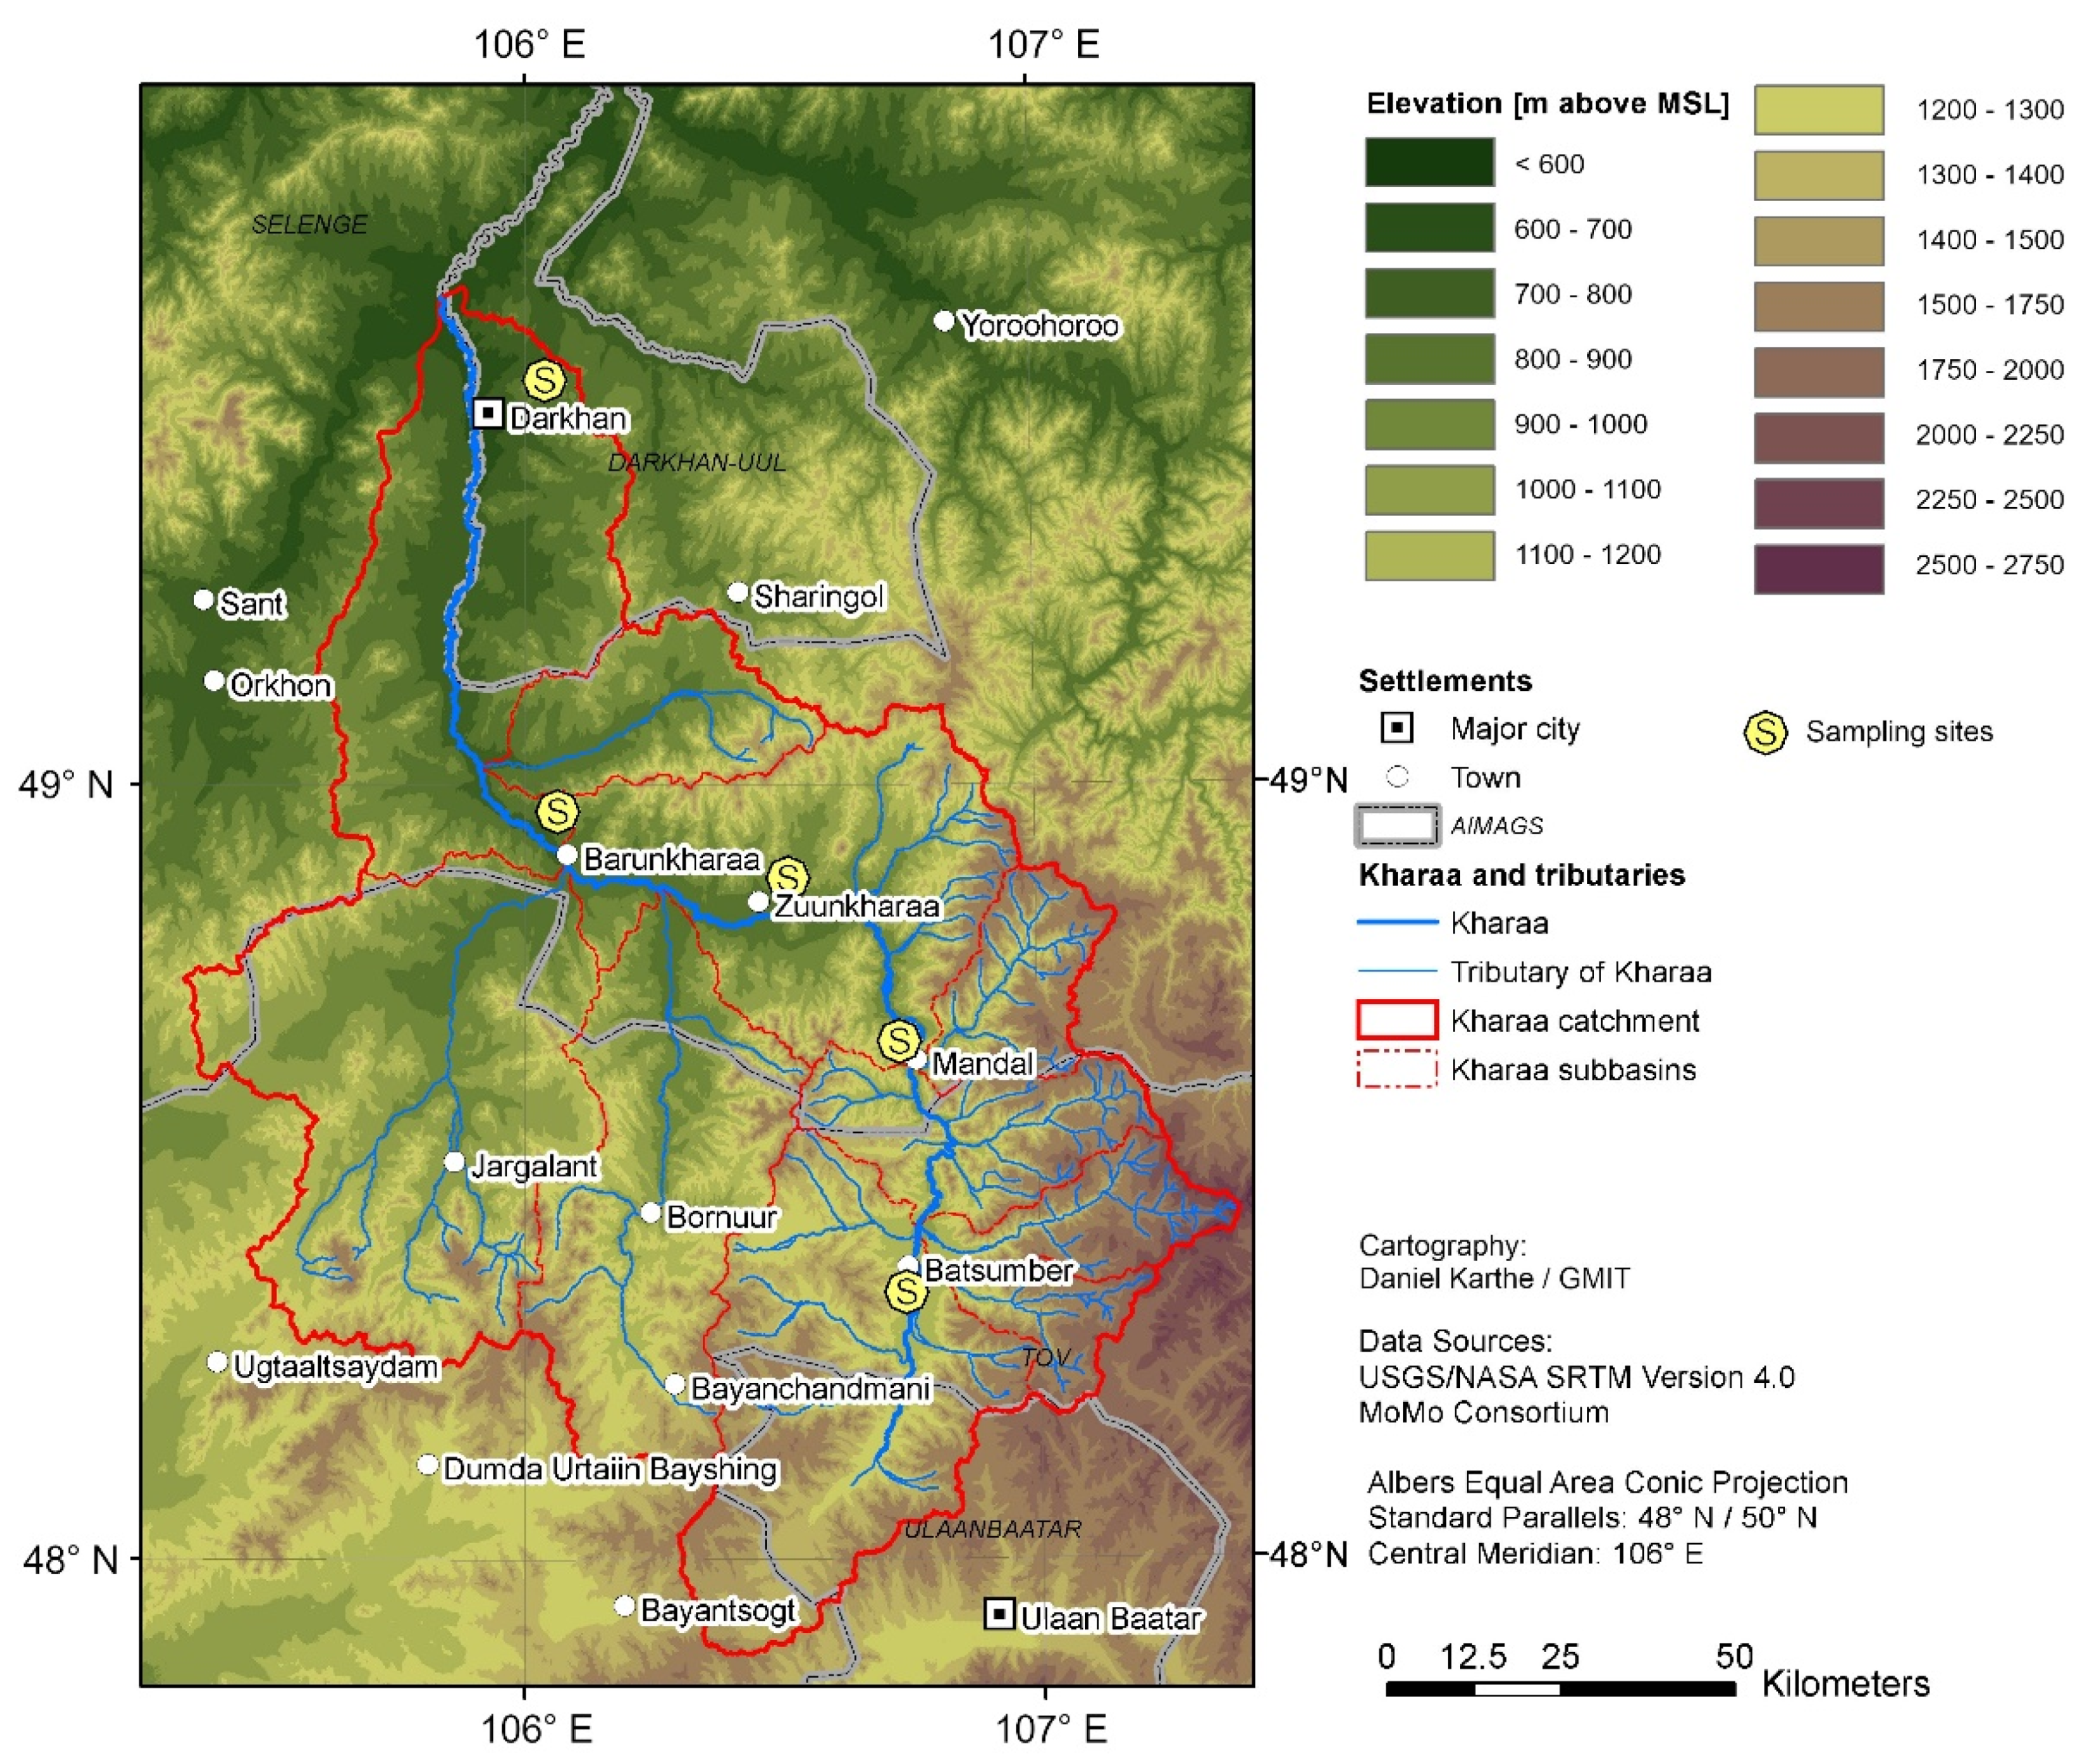
2.1. Study Site
2.2. Data Collection
2.3. Data Analysis
3. Results
3.1. Physicochemical Characteristics
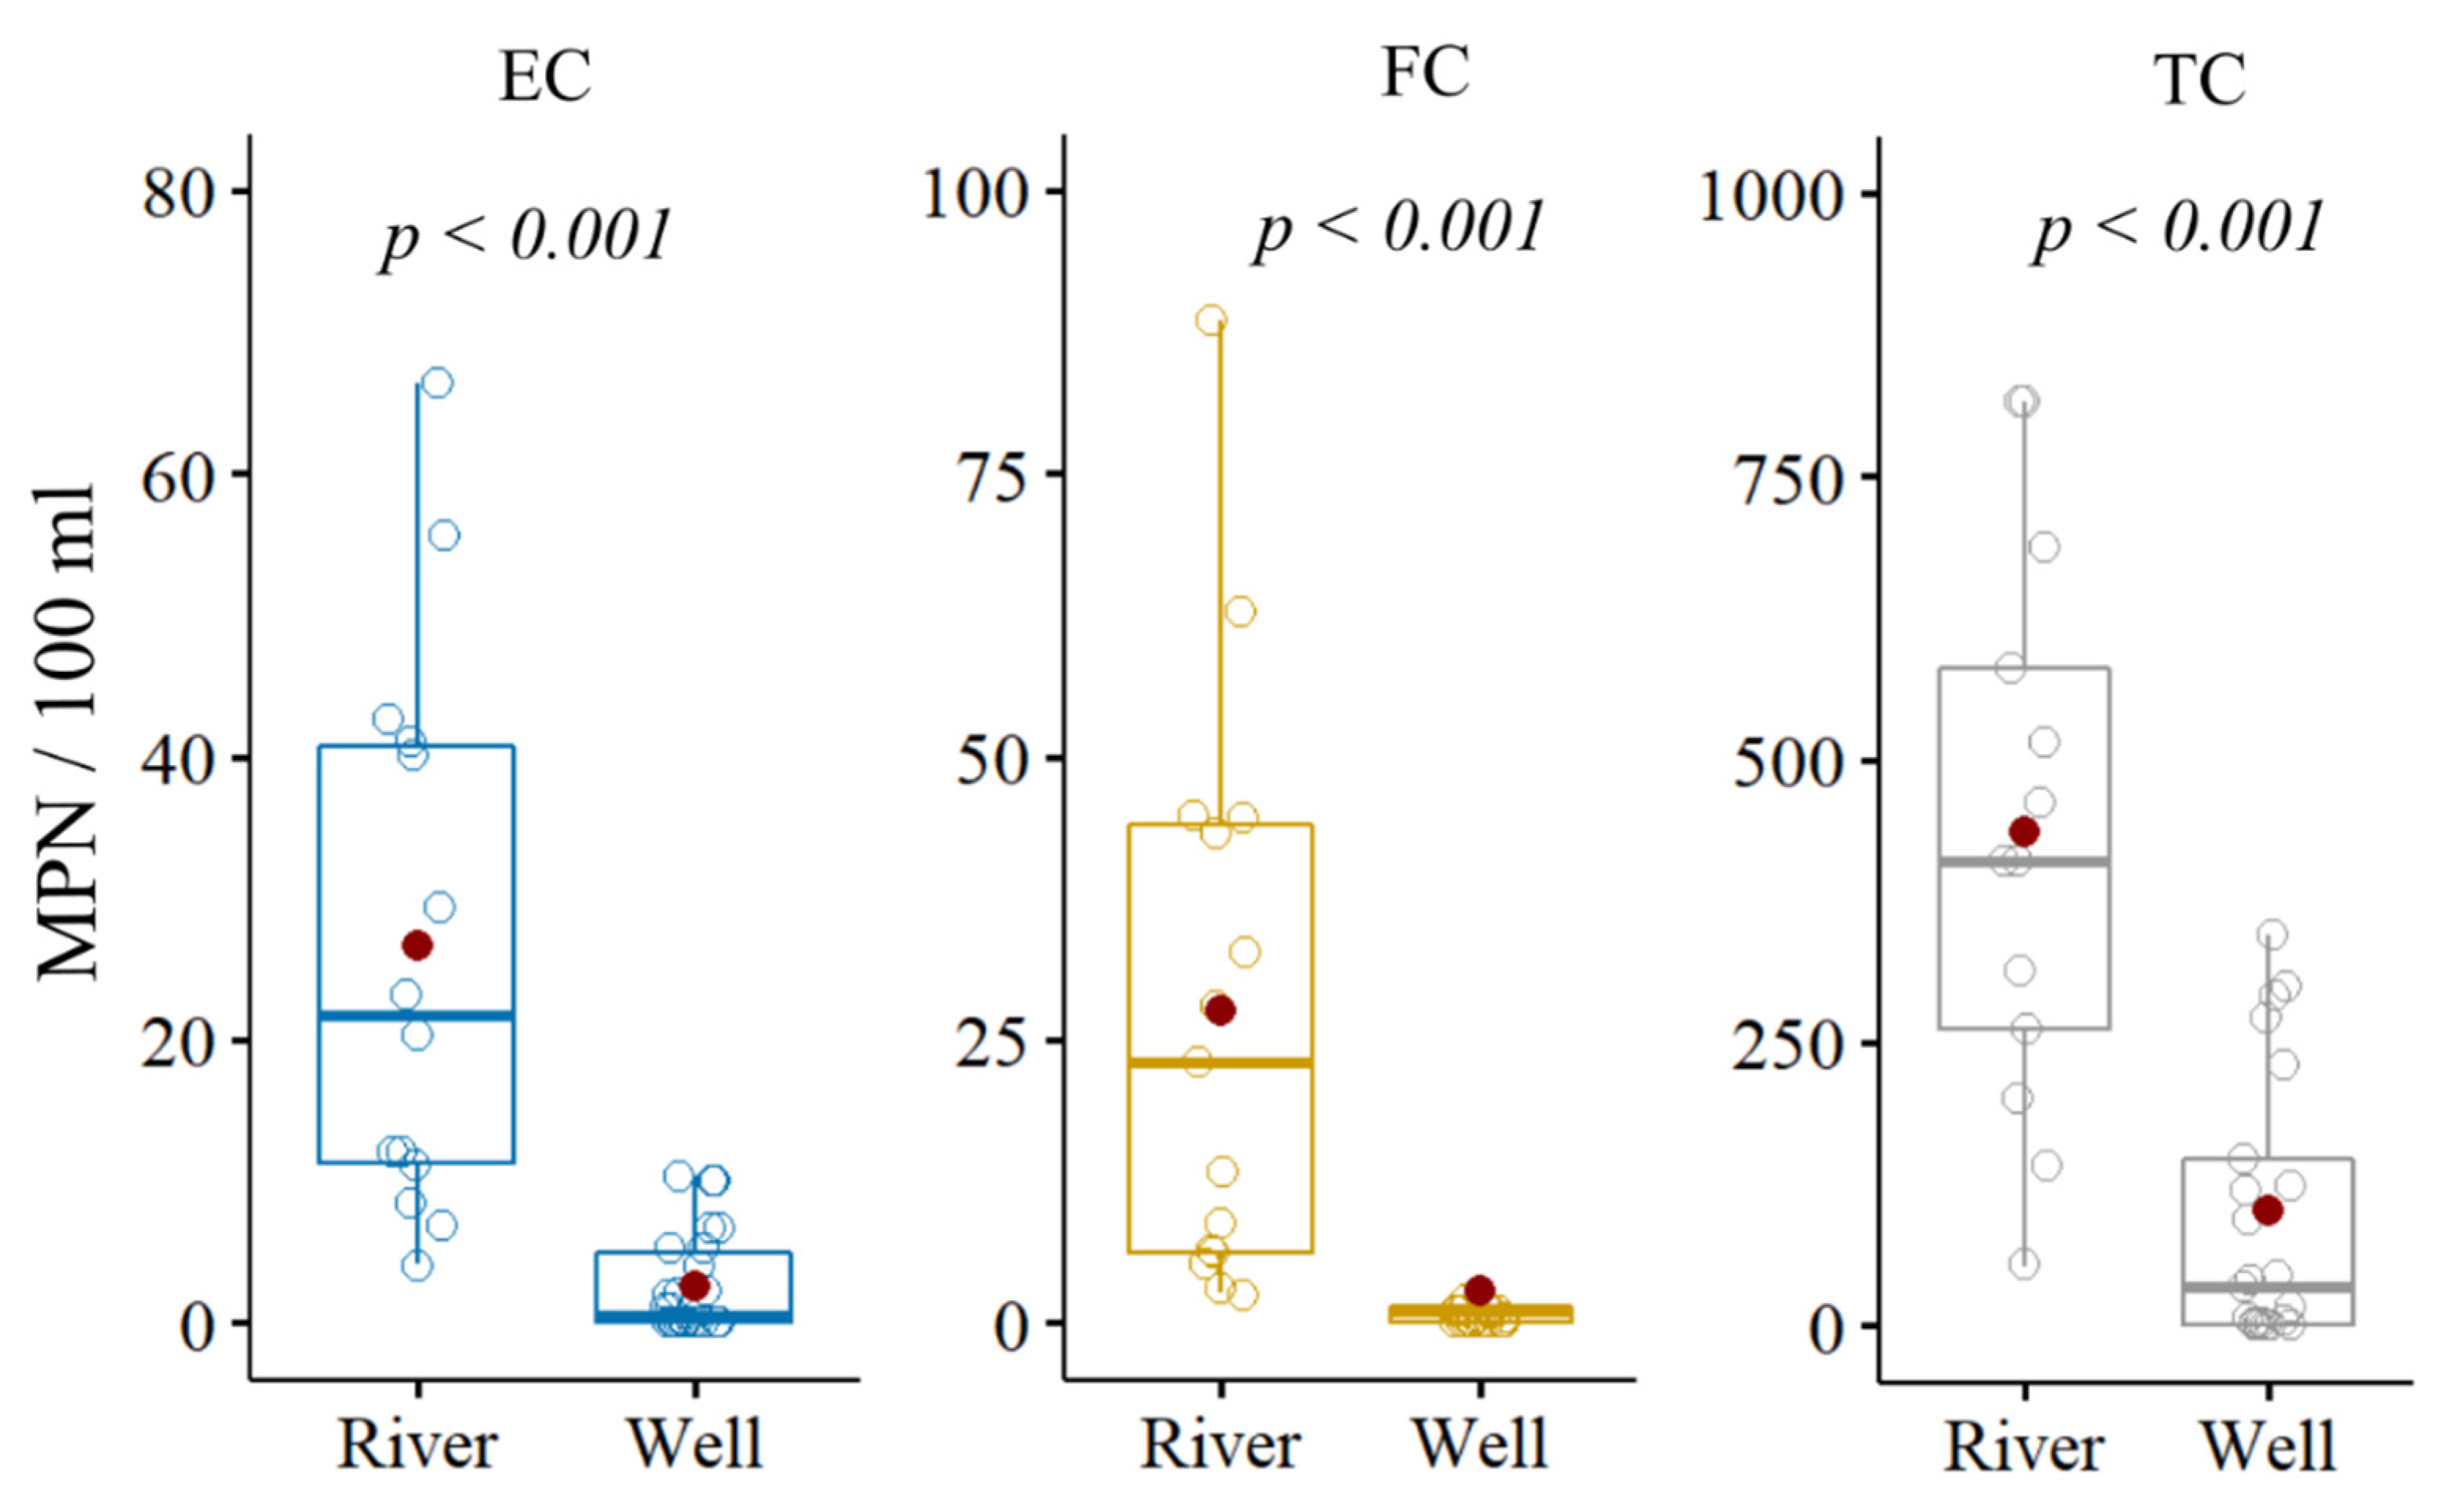
3.2. General Microbiological Characteristics
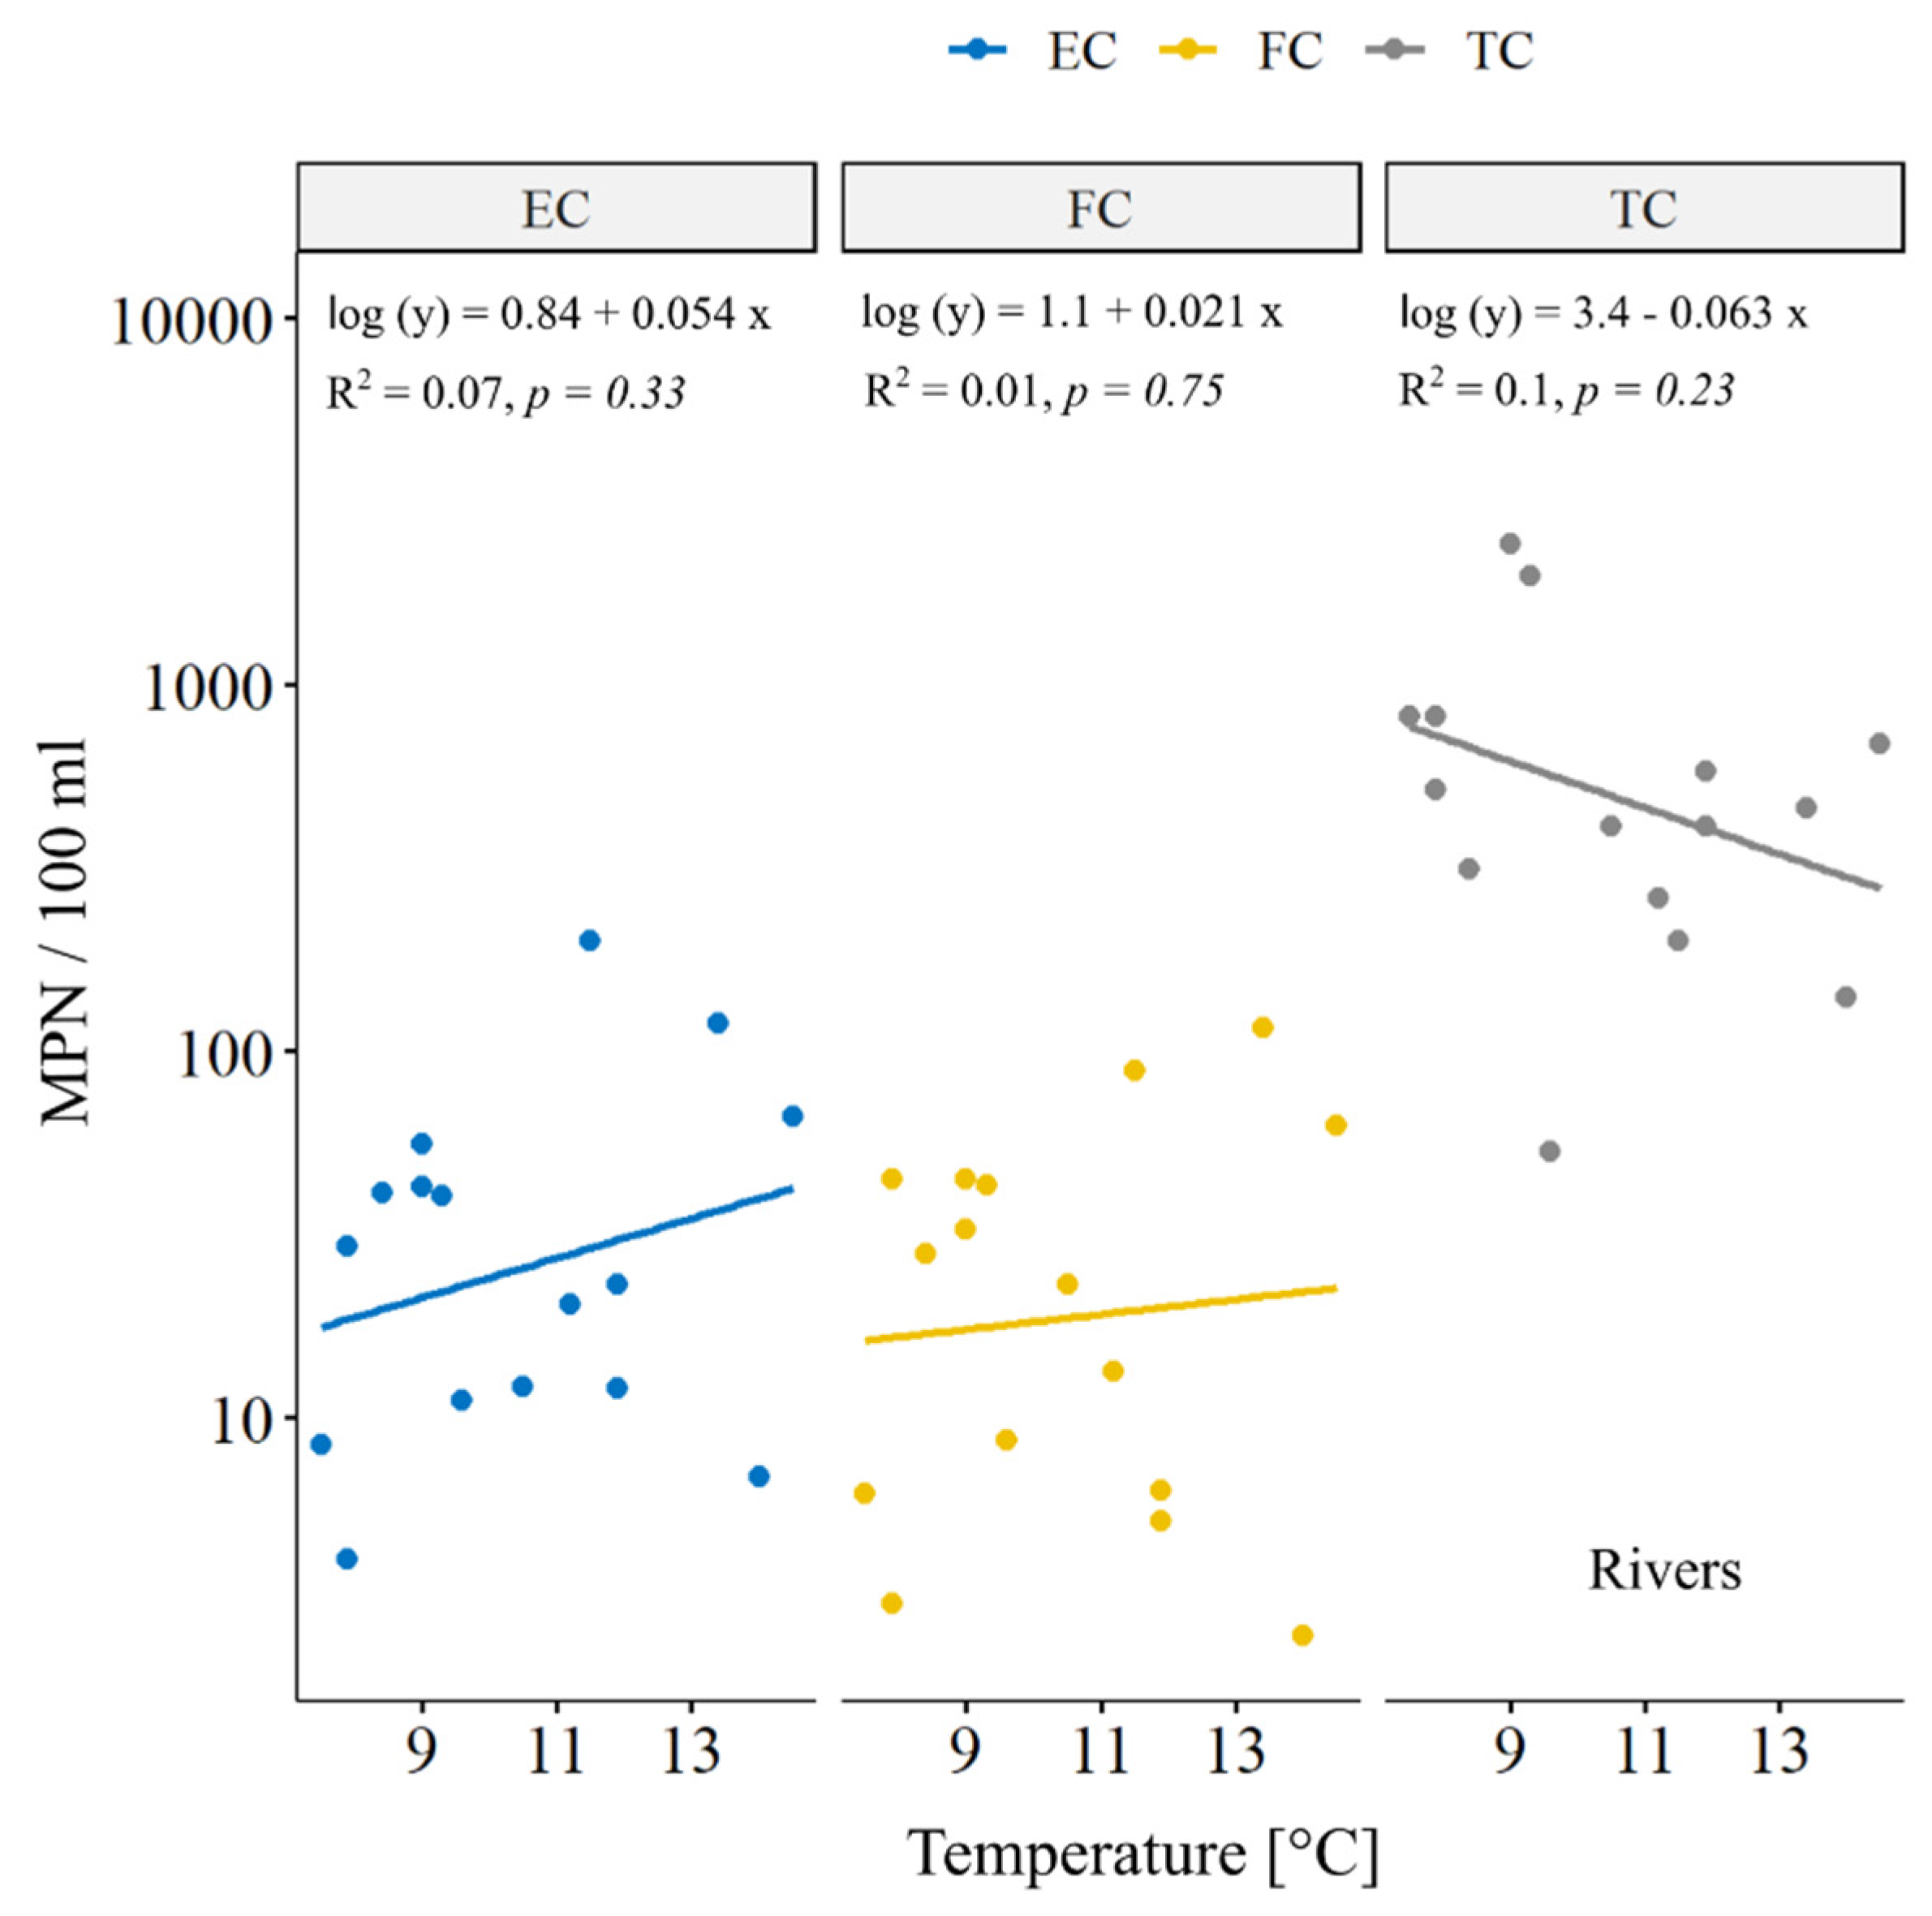
3.3. Relationship between Temperature and Coliforms in River Samples
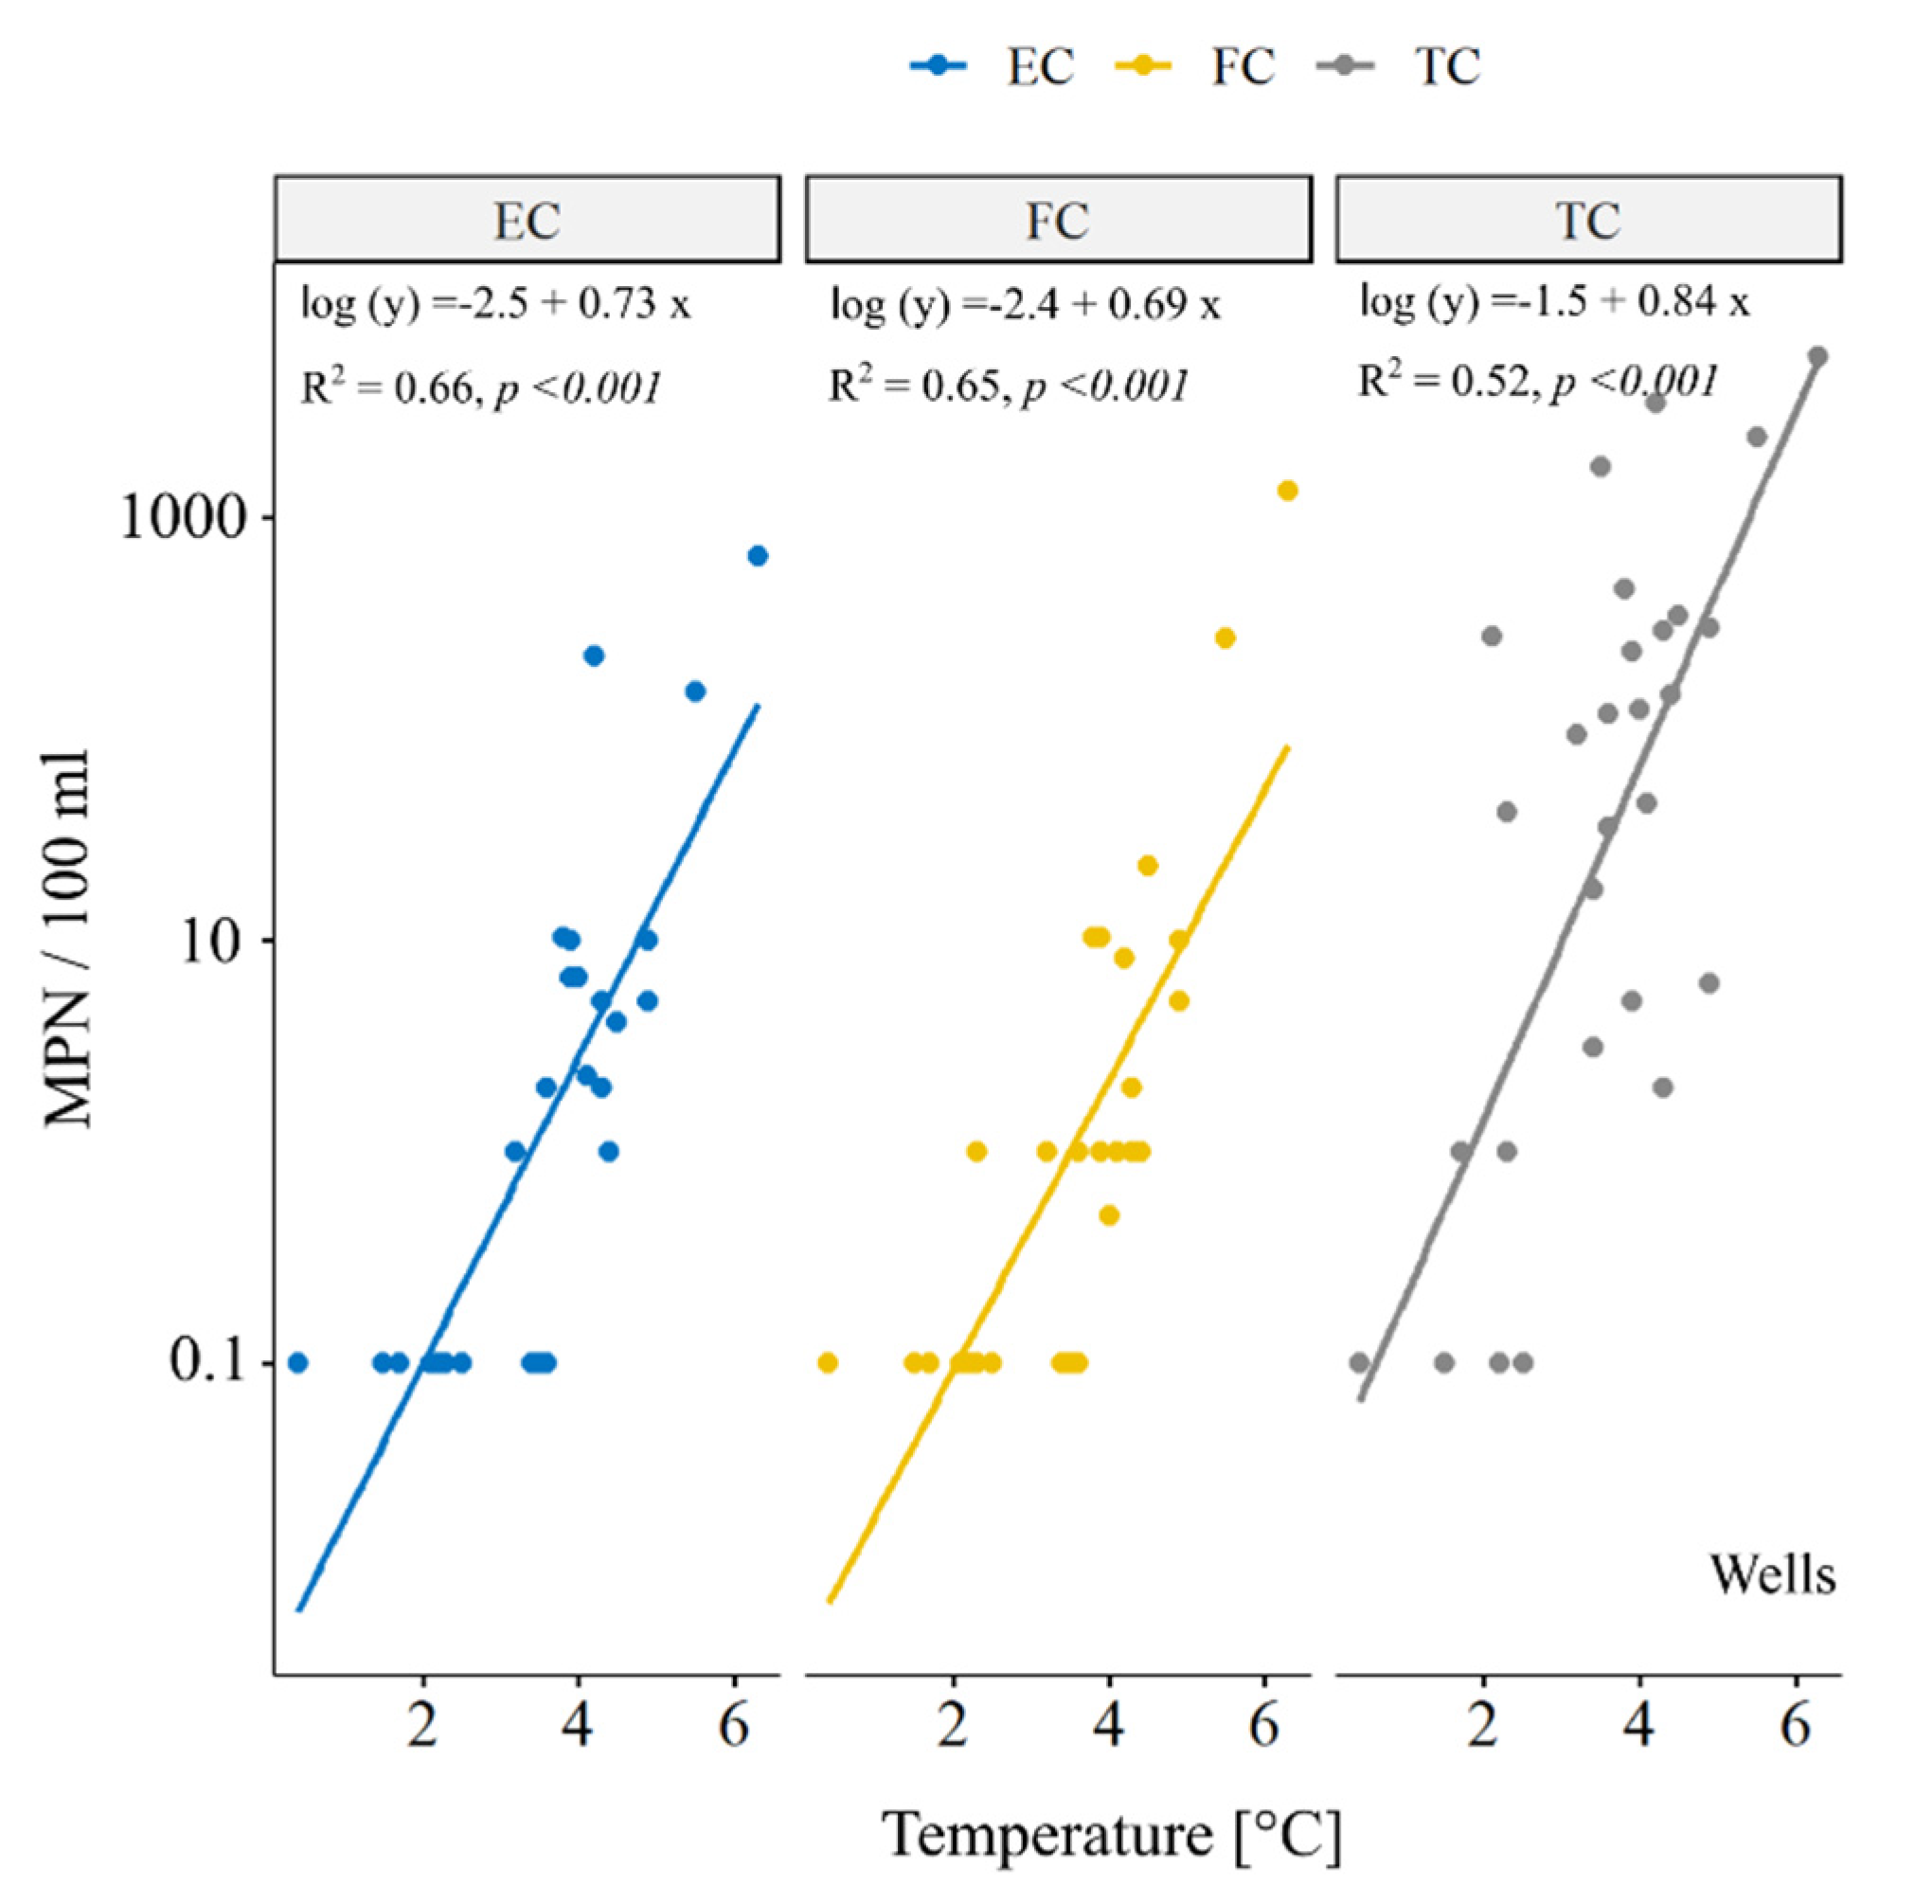
3.4. Relationship between Temperature and Coliforms in Well Samples
4. Discussion
5. Conclusions
Author Contributions
Funding
Conflicts of Interest
References
- United Nations. The Sustainable Development Goals Report; United Nations: New York, NY, USA, 2020. [Google Scholar]
- Mongolian National CSOs Network on SDGs. Mongolian Civil Society Joint Report on Implementation of Sustainable Development Goals; Mongolian National CSOs Network on SDGs: Ulaanbaatar, Mongolia, 2019.
- Davgasuren, B.; Nyam, S.; Altangerel, T.; Ishdorj, O.; Amarjargal, A.; Choi, J.Y. Evaluation of the trends in the incidence of infectious diseases using the syndromic surveillance system, early warning and response unit, Mongolia, from 2009 to 2017: A retrospective descriptive multi-year analytical study. BMC Infect. Dis. 2019, 19, 705. [Google Scholar] [CrossRef] [Green Version]
- Sorokovikova, L.M.; Popovskaya, G.I.; Tomberg, I.V.; Sinyukovich, V.N.; Kravchenko, O.S.; Marinaite, I.I.; Bashenkhaeva, N.V.; Khodzher, T.V. The Selenga River water quality on the border with Mongolia at the beginning of the 21st century. Russ. Meteorol. Hydrol. 2013, 38, 126–133. [Google Scholar] [CrossRef]
- Uddin, S.; Zifu, L.; Gaillard, J.C.; Tedoff, P.F.; Mang, H.P.; Lapegue, J.; Huba, E.M.; Kummel, O.; Rheinstein, E. Exposure to WASH-borne hazards: A scoping study on peri-urban Ger areas in Ulaanbaatar, Mongolia. Habitat Int. 2014, 44, 403–411. [Google Scholar] [CrossRef]
- Ebright, J.; Altantsetseg, T.; Oyungerel, R. Emerging Infectious Diseases in Mongolia. Emerg. Infect. Dis. 2003, 9, 1509–1515. [Google Scholar] [CrossRef] [PubMed]
- Karthe, D.; Sigel, K.; Scharaw, B.; Stäudel, J.; Hufert, F.; Borchardt, D. Towards an integrated concept for monitoring and improvements in water supply, sanitation and hygiene (WASH) in urban Mongolia. Water Risk 2012, 20, 1–5. [Google Scholar]
- Sigel, K.; Altantuul, K.; Basandorj, D. Household needs and demand for improved water supply and sanitation in peri-urban ger areas: The case of Darkhan, Mongolia. Environ. Earth Sci. 2012, 65, 1561–1566. [Google Scholar] [CrossRef]
- Oyunchimeg, M.; Burmaajav, B.; Enkhjargal, A.; Tsegmed, S.; Suvd, B.; Oyun-Erdene, O.; Zolzaya, D.; Otgonbayar, D.; Oyunchimeg, D.; Azjargal, L.; et al. Soil Microbial Contamination And Its Impact On Child Diarrheal Disease Incidence In Ulaanbaatar. Geogr. Environ. Sustain. 2019, 12, 243–251. [Google Scholar] [CrossRef]
- Foggin, P.; Farkas, O.; Shiirev-Adiya, S.; Chinbat, B. Health Status and Risk Factors of Seminomadic Pastoralists in Mongolia: A Geographical Approach. Soc. Sci. Med. 1997, 44, 1623–1647. [Google Scholar] [CrossRef]
- Karthe, D.; Londong, J.; Reeh, T.; Hufert, F. Wassermanagement in mongolischen Tourist Ger Camps: Status Quo und Herausforderungen. Z. Tour. 2013, 5, 215–221. (In German) [Google Scholar]
- Malsy, M.; Flörke, M.; Borchardt, D. What drives the water quality changes in the Selenga Basin: Climate change or socio-economic development? Reg. Environ. Chang. 2016, 17, 1977–1989. [Google Scholar] [CrossRef]
- Cho, K.H.; Pachepsky, Y.A.; Kim, M.; Pyo, J.; Park, M.H.; Kim, Y.M.; Kim, J.W.; Kim, J.H. Modeling seasonal variability of fecal coliform in natural surface waters using the modified SWAT. J. Hydrol. 2016, 535, 377–385. [Google Scholar] [CrossRef]
- Hong, H.; Qiu, J.; Liang, Y. Environmental factors influencing the distribution of total and fecal coliform bacteria in six water storage reservoirs in the Pearl River Delta Region, China. J. Environ. Sci. 2010, 22, 663–668. [Google Scholar] [CrossRef]
- St Laurent, J.; Mazumder, A. Influence of seasonal and inter-annual hydro-meteorological variability on surface water fecal coliform concentration under varying land-use composition. Water Res. 2014, 48, 170–178. [Google Scholar] [CrossRef]
- Cha, S.M.; Lee, S.W.; Park, Y.E.; Cho, K.H.; Lee, S.; Kim, J.H. Spatial and temporal variability of fecal indicator bacteria in an urban stream under different meteorological regimes. Water Sci. Technol. 2010, 61, 3102–3108. [Google Scholar] [CrossRef] [PubMed]
- Islam, M.M.M.; Hofstra, N.; Islam, M.A. The Impact of Environmental Variables on Faecal Indicator Bacteria in the Betna River Basin, Bangladesh. Environ. Processes 2017, 4, 319–332. [Google Scholar] [CrossRef]
- Howard, G.; Calow, R.; Macdonald, A.; Bartram, J. Climate Change and Water and Sanitation: Likely Impacts and Emerging Trends for Action. Ann. Rev. Environ. Resour. 2016, 41, 253–276. [Google Scholar] [CrossRef] [Green Version]
- Carlton, E.J.; Woster, A.P.; DeWitt, P.; Goldstein, R.S.; Levy, K. A systematic review and meta-analysis of ambient temperature and diarrhoeal diseases. Int. J. Epidemiol. 2015, 45, 117–130. [Google Scholar] [CrossRef] [PubMed] [Green Version]
- Philipsborn, R.; Ahmed, S.M.; Bsrosi, B.J.; Levy, K. Climatic drivers of diarrheagenic Escherichia coli incidence: A systematic review and meta-analysis. J. Infect. Dis. 2016, 214, 6–15. [Google Scholar] [CrossRef] [PubMed] [Green Version]
- Levy, K.; Woster, A.P.; Goldstein, R.S.; Carlton, E.J. Untangling the Impacts of Climate Change on Waterborne Diseases: A Systematic Review of Relationships between Diarrheal Diseases and Temperature, Rainfall, Flooding, and Drought. Environ. Sci. Technol. 2016, 50, 4905–4922. [Google Scholar] [CrossRef] [PubMed] [Green Version]
- El-Fadel, M.; Ghanimeh, S.; Maroun, R.; Alameddine, I. Climate change and temperature rise: Implications on food- and water-borne diseases. Sci. Total Environ. 2012, 437, 15–21. [Google Scholar] [CrossRef]
- Funari, E.; Manganelli, M.; Sinisi, L. Impact of climate change on waterborne diseases. Ann. Inst. Super. Sanità 2012, 48, 473–487. [Google Scholar] [CrossRef] [PubMed]
- Hofmann, J.; Hürdler, J.; Ibisch, R.; Schaeffer, M.; Borchardt, D. Analysis of Recent Nutrient Emission Pathways, Resulting Surface Water Quality and Ecological Impacts under Extreme Continental Climate: The Kharaa River Basin (Mongolia). Int. Rev. Hydrobiol. 2011, 96, 484–519. [Google Scholar] [CrossRef]
- Malsy, M.; aus der Beek, T.; Flörke, M. Evaluation of large-scale precipitation data sets for water resources modelling in Central Asia. Environ. Earth Sci. 2015, 73, 787–799. [Google Scholar] [CrossRef]
- Unger-Shayesteh, K.; Vorogushyn, S.; Merz, B.; Frede, H.G. Introduction to Water in Central Asia—Perspectives under global change. Glob. Planet. Chang. 2013, 110, 1–152. [Google Scholar] [CrossRef]
- Vandandorj, S.; Munkhjargak, E.; Boldgiv, B.; Gantsetseg, B. Changes in event number and duration of rain types over Mongolia from 1981 to 2014. Environ. Earth Sci. 2017, 76, 70. [Google Scholar] [CrossRef] [Green Version]
- Krüger, E.; Rao, S.P.; Borchardt, D. Quantifying urban water supply security under global change. Glob. Environ. Chang. 2019, 56, 66–74. [Google Scholar] [CrossRef]
- Kopp, B.; Lange, J.; Menzel, L. Effects of wildfire on runoff generating processes in northern Mongolia. Reg. Environ. Chang. 2017, 17, 1951–1963. [Google Scholar] [CrossRef]
- Auld, H.; MacIver, D.; Klaassen, J. Heavy rainfall and waterborne disease outbreaks: The Walkerton example. J. Toxicol. Environ. Health A 2004, 67, 1879–1887. [Google Scholar] [CrossRef]
- Karthe, D. Bedeutung hydrometeorologischer Extremereignisse im Kontext des Klimawandels für die Trinkwasserhygiene in Deutschland und Mitteleuropa. Hydrol. Wasserbewirtsch. 2015, 59, 264–270. (In German) [Google Scholar] [CrossRef]
- Tornevi, A.; Bergstedt, O.; Forsberg, B. Precipitation Effects on Microbial Pollution in a River: Lag Structures and Seasonal Effect Modification. PLoS ONE 2014, 9, e98546. [Google Scholar] [CrossRef]
- Karthe, D.; Chalov, S.; Moreydo, V.; Pashkina, M.; Romanchenko, A.; Batbayar, G.; Kalugin, A.; Westphal, K.; Malsy, M.; Flörke, M. Assessment and Prediction of Runoff, Water and Sediment Quality in the Selenga River Basin aided by a Web-Based Geoservice. Water Resour. 2017, 44, 399–416. [Google Scholar] [CrossRef]
- Kasimov, N.; Karthe, D.; Chalov, S. Environmental change in the Selenga River-Lake Baikal Basin. Reg. Environ. Chang. 2017, 17, 1945–1949. [Google Scholar] [CrossRef]
- Heldt, S.; Rodriguez, J.C.; Dombrowsky, I.; Feld, C.; Karthe, D. Is the EU WFD suitable to support IWRM Planning in non-European countries? Lessons Learnt from the Introduction of IWRM and River Basin Management in Mongolia. Environ. Sci. Pol. 2017, 75, 27–37. [Google Scholar] [CrossRef]
- Menzel, L.; Hofmann, J.; Ibisch, R. Untersuchung von Wasser- und Stoffflüssen als Grundlage für ein Integriertes Wasserressourcen—Management im Kharaa-Einzugsgebiet (Mongolei). Hydrol. Wasserbewirtsch. 2011, 55, 88–103. [Google Scholar]
- Karthe, D.; Heldt, S.; Rost, G.; Londong, J.; Ilian, J.; Heppeler, J.; Khurelbaatar, G.; Sullivan, C.; van Afferden, M.; Stäudel, J.; et al. Modular Concept for Municipal Waste Water Management in the Kharaa River Basin, Mongolia. In Integrated Water Resources Management: Concept, Research and Implementation; Borchardt, D., Bogardi, J., Ibisch, R., Eds.; Springer: Heidelberg, Germany; New York, NY, USA, 2016; pp. 649–681. [Google Scholar]
- Karthe, D.; Westphal, K. Water and hygiene in the Kharaa River Basin, Mongolia: Current knowledge and research needs. Geogr. Environ. Sustain. 2017, 10, 44–53. [Google Scholar] [CrossRef] [Green Version]
- Ochirbold, B.E. Hygienic Assessment of Surface, Ground and Drinking Water in the Kharaa River Basin. Bachelor’s Thesis, German-Mongolian Institute for Resources and Technology, Ulaanbaatar, Mongolia, 2018. [Google Scholar]
- Angerer, J.; Han, G.; Fujisaki, I.; Havstad, K. Climate Change and Ecosystems of Asia with Emphasis on Inner Mongolia and Mongolia. Rangelands 2008, 30, 46–51. [Google Scholar] [CrossRef] [Green Version]
- Pan, C.G.; Pope, A.; Kamp, U.; Dashtseren, A.; Walther, M.; Syromyatina, M.V. Glacier recession in the Altai Mountains of Mongolia in 1990–2016. Geogr. Ann. A 2018, 100, 185–203. [Google Scholar] [CrossRef]
- Sharkhuu, A.; Sharkhuu, N.; Etzelmüller, B.; Heggem, E.S.F.; Nelson, F.E.; Shiklomanov, N.I.; Goulden, C.E.; Brown, J. Permafrost monitoring in the Hovsgol mountain region, Mongolia. J. Geophys. Res. 2007, 102, F02S06. [Google Scholar] [CrossRef] [Green Version]
- Safronov, A.N. Effects of Climatic Warming and Wildfires on Recent Vegetation Changes in the Lake Baikal Basin. Climate 2020, 8, 57. [Google Scholar] [CrossRef]
- Rao, M.P.; Davi, N.K.; D’Arrigo, R.D.; Skees, J.; Nachin, B.; Leland, C.; Lyon, B.; Wang, S.Y.; Byambasuren, O. Dzuds, droughts, and livestock mortality in Mongolia. Environ. Res. Lett. 2015, 10, 074012. [Google Scholar] [CrossRef]
- Sternberg, T. Investigating the presumed causal links between drought and dzud in Mongolia. Nat. Hazards 2018, 92, 27–43. [Google Scholar] [CrossRef] [Green Version]
- Kistemann, T.; Classen, T.; Koch, C.; Dangendorf, F.; Fischeder, R.; Gebel, J.; Vacata, V.; Exner, M. Microbial load of drinking water reservoir tributaries during extreme rainfall and runoff. Appl. Environ. Microbiol. 2002, 68, 2188–2197. [Google Scholar] [CrossRef] [Green Version]
- Mälzer, H.J.; aus der Beek, T.; Müller, S.; Gebhardt, J. Comparison of different model approaches for a hygiene early warning system at the lower Ruhr River, Germany. Int. J. Hyg. Environ. Health 2016, 219, 671–680. [Google Scholar] [CrossRef] [PubMed]
- Reder, K.; Flörke, M.; Alcamo, J. Modeling historical fecal coliform loadings to large European rivers and resulting in-stream concentrations. Environ. Model. Softw. 2015, 63, 251–263. [Google Scholar] [CrossRef]
- Kaeseberg, T.; Schubert, S.; Oertel, R.; Zhang, J.; Berendonk, T.U.; Krebs, P. Hot spots of antibiotic tolerant and resistant bacterial subpopulations in natural freshwater biofilm communities due to inevitable urban drainage system overflows. Environ. Pollut. 2018, 242, 164–170. [Google Scholar] [CrossRef] [PubMed]
- Rompré, A.; Servais, P.; Baudart, J.; de-Roubin, M.R.; Laurent, P. Detection and enumeration of coliforms in drinking water: Current methods and emerging approaches. J. Microbiol. Methods 2002, 49, 31–54. [Google Scholar] [CrossRef]
- Pitkänen, T.; Paakkari, P.; Miettinen, I.T.; Heinonen-Tanski, H.; Paulin, L.; Hänninen, M.L. Comparison of media for enumeration of coliform bacteria and Escherichia coli in non-disinfected water. J. Microbiol. Methods 2007, 68, 522–529. [Google Scholar] [CrossRef]
- R Core Team. R: A Language and Environment for Statistical Computing; R Foundation for Statistical Computing: Vienna, Austria, 2018. [Google Scholar]
- Kirschner, A.K.T.; Kavka, G.G.; Velimirov, B.; Mach, R.L.; Sommer, R.; Farnleitner, A.H. Microbiological water quality along the Danube River: Integrating data from two whole-river surveys and a transnational monitoring network. Water Res. 2009, 43, 3673–3684. [Google Scholar] [CrossRef] [PubMed]
- Mongolian Drinking Water Standard MNS 0900:2018. Available online: http://estandard.gov.mn/standard/v/4763 (accessed on 24 September 2020).
- Karthe, D.; Lin, P.Y.; Westphal, K. Gradients of Water Hygiene in the Holtemme, a Small Headwater Stream in the Elbe River Basin, Northern Germany. Front. Earth Sci. 2017, 11, 544–553. [Google Scholar] [CrossRef]
- Bagde, U.S.; Rangari, A.K. Periodicity of coliform bacteria in an aquatic environment. Water Sci. Technol. 1999, 40, 151–157. [Google Scholar] [CrossRef]
- Tiefenthaler, L.; Stein, E.; Lyon, G. Fecal indicator bacteria (FIB) levels during dry weather from Southern California reference streams. Environ. Monit. Assess. 2009, 155, 477–492. [Google Scholar] [CrossRef]
- Shelton, D.R.; Pachepsky, Y.A.; Kiefer, L.A.; Blaustein, R.A.; McCarty, G.W.; Dao, T.H. Response of coliform populations in streambed sediment and water column to changes in nutrient concentrations in water. Water Res. 2014, 59, 316–324. [Google Scholar] [CrossRef] [PubMed]
- Taylor, C.A.; Stefan, H.G. Shallow groundwater temperature response to climate change and urbanization. J. Hydrol. 2009, 375, 601–612. [Google Scholar] [CrossRef]
- Menberg, K.; Blum, P.; Kurylyk, B.L.; Bayer, P. Observed groundwater temperature response to recent climate change. Hydrol. Earth Syst. Sci. 2014, 18, 4453–4466. [Google Scholar] [CrossRef] [Green Version]
- Hoxie, N.J.; Davis, J.P.; Vergeront, J.M.; Nashold, R.D.; Blair, K.A. Cryptosporidiosis-associated mortality following a massive waterborne outbreak in Milwaukee, Wisconsin. Am. J. Public Health 1997, 87, 2032–2035. [Google Scholar] [CrossRef] [PubMed] [Green Version]
- Mac Kenzie, W.R.; Hoxie, N.J.; Proctor, M.E.; Gradus, M.S.; Blair, K.A.; Peterson, D.E.; Kazmierczak, J.J.; Addiss, D.G.; Fox, K.R.; Rose, J.B.; et al. A massive outbreak in Milwaukee of cryptosporidium infection transmitted through the public water supply. N. Engl. J. Med. 1994, 331, 161–167. [Google Scholar] [CrossRef]
- Cann, K.F.; Thomas, D.R.; Salmon, R.L.; Wyn-Jones, A.P.; Kay, D. Extreme water-related weather events and waterborne disease. Epidemiol. Infect. 2013, 141, 671–686. [Google Scholar] [CrossRef] [PubMed]
- Nichols, G.; Lane, C.; Asgari, N.; Verlander, N.Q.; Charlett, A. Rainfall and outbreaks of drinking water related disease in England and Wales. J. Water Health 2009, 7, 1–8. [Google Scholar] [CrossRef] [PubMed] [Green Version]


| 2014 | 2015 | 2016 | 2017 | 2018 | |
|---|---|---|---|---|---|
| Camel | 0.16 | 0.13 | 0.14 | 0.09 | 0.12 |
| Cow | 94.57 | 96.62 | 100.81 | 94.14 | 84.75 |
| Goat | 176.40 | 157.49 | 172.07 | 163.99 | 168.29 |
| Horse | 32.47 | 33.62 | 37.49 | 37.88 | 38.72 |
| Sheep | 277.46 | 252.36 | 276.33 | 255.06 | 247.40 |
| Total | 581.06 | 540.22 | 586.84 | 551.16 | 539.28 |
| Type of Sample | Temperature (°C) | El. Conductivity (µS/cm) | pH | |||
|---|---|---|---|---|---|---|
| 2017 | 2018 | 2017 | 2018 | 2017 | 2018 | |
| River (n = 17) | 10.3 ± 1.9 | 9.4 ± 2.4 | 227 ± 115 | 126 ± 69 | N/A | 7.9 ± 0.4 |
| Wastewater channel (n = 8) | 11.9 ± 6.5 | 15.8 ± 3.3 | 1083 ± 394 | 1120 ± 345 | N/A | 8.1 ± 0.2 |
| Household well (n = 32) | 3.6 ± 1.2 | 2.4 ± 1.2 | 502 ± 324 | 314 ± 69 | N/A | 7.7 ± 0.3 |
| Other well (n = 4) | 4.3 ± 0.4 | 4.0 ± 0.5 | 418 ± 60 | 320 ± 41 | N/A | 7.7 ± 0.1 |
| Water kiosk (n = 8) | 6.2 ± 1.3 | 7.3 ± 1.6 | 543 ± 246 | 391 ± 170 | N/A | 7.8 ± 0.4 |
| Tap water (n = 8) | 13.5 ± 9.4 | 13.0 ± 5.8 | 471 ± 64 | 423 ± 76 | N/A | 7.6 ± 0.1 |
| Type of Sample | Positive for EC (%) | Positive for FC (%) | Positive for TC (%) | |||
|---|---|---|---|---|---|---|
| 2017 | 2018 | 2017 | 2018 | 2017 | 2018 | |
| River | 100 | 100 | 100 | 100 | 100 | 100 |
| Wastewater channel | 100 | 100 | 100 | 100 | 100 | 100 |
| Household well | 35 | 22 | 90 | 67 | 45 | 33 |
| Other well | 67 | 100 | 100 | 100 | 67 | 100 |
| Water kiosk | 0 | 25 | 25 | 25 | 0 | 25 |
| Tap water | 0 | 0 | 33 | 20 | 17 | 0 |
| Total | 55 | 52 | 83 | 68 | 60 | 55 |
| Descriptive Statistics | EC | FC | TC | |||
|---|---|---|---|---|---|---|
| River | Well | River | Well | River | Well | |
| n | 16 | 30 | 16 | 30 | 16 | 30 |
| median | 26.2 | 1.0 | 25.5 | 1.0 | 488.0 | 44.3 |
| mean | 43.3 | 37.9 | 33.1 | 58.5 | 780.6 | 549.6 |
| min | 4.1 | 0.1 | 2.6 | 0.1 | 53.1 | 0.1 |
| max | 200.5 | 660.1 | 115.9 | 1350.0 | 2419.6 | 5794.0 |
| SD | 51.3 | 129.0 | 33.0 | 253.3 | 778.4 | 1286.1 |
| IQR | 34.1 | 6.6 | 38.4 | 5.1 | 516.3 | 288.9 |
| range | 196.4 | 660.0 | 113.4 | 1349.9 | 2366.5 | 5793.9 |
| p-value | <0.001 | <0.001 | <0.001 | |||
Publisher’s Note: MDPI stays neutral with regard to jurisdictional claims in published maps and institutional affiliations. |
© 2020 by the authors. Licensee MDPI, Basel, Switzerland. This article is an open access article distributed under the terms and conditions of the Creative Commons Attribution (CC BY) license (http://creativecommons.org/licenses/by/4.0/).
Share and Cite
Ochirbold, B.-E.; Tserendorj, A.; Westphal, K.; Karthe, D. Hygienic Condition of Different Water Sources in the Kharaa River Basin, Mongolia in the Light of a Rapid Warming Trend. Atmosphere 2020, 11, 1113. https://doi.org/10.3390/atmos11101113
Ochirbold B-E, Tserendorj A, Westphal K, Karthe D. Hygienic Condition of Different Water Sources in the Kharaa River Basin, Mongolia in the Light of a Rapid Warming Trend. Atmosphere. 2020; 11(10):1113. https://doi.org/10.3390/atmos11101113
Chicago/Turabian StyleOchirbold, Bolor-Erdene, Ariuntuya Tserendorj, Katja Westphal, and Daniel Karthe. 2020. "Hygienic Condition of Different Water Sources in the Kharaa River Basin, Mongolia in the Light of a Rapid Warming Trend" Atmosphere 11, no. 10: 1113. https://doi.org/10.3390/atmos11101113