Article

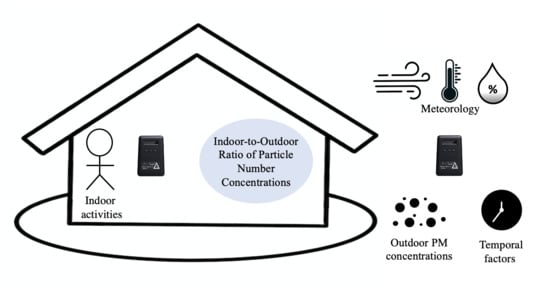
Predictors of the Indoor-to-Outdoor Ratio of Particle Number Concentrations in Israel

1
Braun School of Public Health and Community Medicine, The Hebrew University of Jerusalem, Jerusalem 91120, Israel
2
National Institute of Occupational Health and Poison Control, Chinese Center for Disease Control and Prevention, Beijing 100050, China
3
Faculty of Civil and Environmental Engineering, Technion—Israel Institute of Technology, Haifa 32000, Israel
*
Author to whom correspondence should be addressed.
Atmosphere 2020, 11(10), 1074; https://doi.org/10.3390/atmos11101074
Submission received: 2 September 2020 / Revised: 30 September 2020 / Accepted: 5 October 2020 / Published: 9 October 2020
(This article belongs to the Special Issue Air Pollution and Human Exposures in Israel)

Abstract

:
Exposure to airborne particles is a risk factor of many short- and long-term health effects. Most epidemiological studies include estimates of exposure to ambient particles, however, people living in developed countries spend most of their time indoors. This work presents an analysis of a field campaign of simultaneous measurements of indoor-to-outdoor particle number concentrations (PNCs) in Israel. Fine and coarse PNCs were continuously measured using Dylos DC1700 devices from October 2016 to October 2017. The median outdoor PNC was always higher than the indoor PNC in all the five sampling locations. Outdoor fine PNCs peak during the night and experience a trough in the afternoon. The median of the fine indoor-to-outdoor PNC ratio (IOR) was 0.83, with an inter quartile range (IQR) of 0.59. The median of the coarse IOR was 0.70, with an IQR of 0.77. Lower IORs were experienced at night than during the day, with a daily peak (IOR > 1) around noon. Information about the IOR in different regions and seasons may help epidemiologists and policy makers understand the true health effects of particulate air pollution, and correct their exposure estimations such that they account for indoor exposure as well.

Graphical Abstract

1. Introduction

Exposure to particulate matter (PM) is a risk factor of many short- and long-term health effects, especially for respiratory and cardiovascular diseases [1]. PM is consisted of a mixture of solid and liquid particles, with actual components that vary according to its source, season, geographic region, and meteorological conditions [2,3]. Coarse PM (aerodynamic diameter of 2.5–10 μm) is likely deposited in the tracheobronchial tree, while fine PM (aerodynamic diameter <2.5 μm) has a higher probability to deposit in the respiratory bronchioles and the alveoli [4]. Although numerous epidemiological studies already found associations between PM and adverse health effects, most studies accounted only for ambient PM. However, people living in developed countries spend most of their time indoors [5,6], where much less is known about the particle levels and composition. Indoor particles can originate from both outdoor and indoor sources, with the prominent anthropogenic indoor sources being cooking, smoking, heating, and domestic activities that can be impacted by many factors [7,8]. Penetration of outdoor particles to indoor environments occurs by three main mechanisms: mechanical (forced) ventilation, natural ventilation and infiltration [9]. Other factors that affect the penetration of ambient particles into built environments are the geographic location, meteorology and the particle composition [10], as well as the occupants personal preferences regarding open windows and heating, ventilation and air conditioning (HEVAC).
Israel is located in a unique geographical region, on the cross-border of Asia, Africa and the Mediterranean, and is impacted by dust originating from the nearby Sahara and Arabian deserts and by aerosols imported by long-range transboundary transport from Europe, having a substantial contribution to the ambient PM levels in Israel [11,12,13]. Both dust and transboundary transported particles contain mostly particles with aerodynamic diameter larger than 1 μm, while traffic emissions and particles that originate from other combustion processes are mostly smaller than 0.5 μm and are thus expected to have higher probability to penetrate into the indoor environment [4,14].
Concentrations of airborne particles are usually measured in terms of mass per volume of air (and the terminology used is PM), but can also be reported in terms of the particle number concentration (PNC), which is more relevant for sub-micron particles that carry relatively little mass but due to their distinct composition may possibly result in more severe adverse health effects [4,15,16], as they have a much higher surface area-to-volume ratio. The particle surface area is where heterogeneous chemical reactions (redox/oxidation, catalysis) and physical processes (dissolution, absorption–desorption) take place. The indoor-to-outdoor PNC ratio (IOR) is a simple measure that directly represents the relationship between indoor and outdoor particle concentrations [17]. The IOR is influenced by the distinct characteristics of indoor and outdoor sources, deposition rates, concentrations and the size-specific penetration process from the outdoor to the indoor environment [9,18]. Information about the IOR in different regions and seasons can help epidemiologists and policy makers understand the health effects of airborne particles and correct their exposure assessment such that it accounts for indoor exposure as well. This could be especially useful if the latter can be predicted by environmental variables that are commonly measured, such as meteorological factors, month of the year and ambient particle levels, since indoor measurements do not exist on a large spatial scale due to privacy issues and practical (technological and economic) limitations.
Several studies examined the relationships between outdoor particle concentrations, meteorology, and indoor particle concentrations [19,20,21,22]. However, most studies examined mass-based particle concentrations and accounted for these factors univariately and based on relatively short field campaigns (short datasets), ignoring correlations among factors as well as their seasonal variation. In contrast, this study presents an analysis of data collected in a one-year field campaign, with simultaneous indoor and outdoor PNC in several locations, exploring how their relationship was affected by varying meteorological and temporal parameters.

2. Material and Methods

2.1. Study Area

Particle concentrations were collected in three areas in central Israel (Figure 1). The main data collection was held in the city of Elad (approximately 45,000 residents) and the nearby rural community of Einat. A major highway traverse Israel from north to south just to the west of these two localities. A stone quarry is situated to the north of Elad, about 1 km apart, with no significant topographical obstacles in between them. A previous study found that the quarry has no measurable impact on the city of Elad [23]. The population of Elad consists of orthodox Jews, thus, there is no transportation or commerce in the city from Friday evening to Saturday evening. The northern measurement site, Givat Haim, is a small rural community that is traditionally based on agriculture and is surrounded by few roads.

2.2. Sample Collection

Fine and coarse PNC data were collected by Dylos DC1700 optical particle counters (OPCs; Dylos Corporation, Riverside, CA, USA). The device measures continuously PNC in two size fractions: >0.5 μm and >2.5 μm using a light-scattering method, and records average PNC for each of these fractions every minute. Calibration of the devices was done against a MetOne device (model 804 OPC with four size channels, 0.3–10 μm), with all the sensors collocated indoors and later outdoors for two weeks. Sensor-specific calibration was performed once by linear regressions, obtaining high calibration coefficients (0.98 ± 0.13 for fine PNC, 0.77 ± 0.15 for coarse PNC) between the Dylos OPC observations and the reference measurements [23]. During the field campaign, the OPCs were deployed as indoor–outdoor pairs in each location, with data downloading and device maintenance performed once a week.
The PNC data were collected continuously from 1st October 2016 to 1st October 2017 (data in October 2017 cover only a fraction of the first day of the month) in three localities in parallel. Figure 2 presents a detailed temporal coverage at each deployment site. In Elad, three pairs of OPCs were deployed in private houses (in the Ben Zakai, Raabad and Rashbi streets). Outdoor PNC was measured at the house porch, and the indoor OPCs were placed in the living rooms at breathing zone heights. In Einat and Givat Haim, the OPCs were deployed in two community schools with the indoor devices in classrooms and the outdoor devices mounted outside at about 1.2 m above the ground. All locations, including schools, were equipped with air conditioning systems that only circulated the indoor air, with fresh air entering the indoor environment only when windows or doors were open. According to the residents, the air conditioning systems were turned on mostly during the summer, and windows were generally closed during the summer and during the nights and open otherwise. Unfortunately, we were not able to retrieve information on the air conditioning usage patterns in the schools. Ambient temperature, relative humidity and wind data were obtained from the closest meteorological station, located at the Ben Gurion airport, about 7 km southwest of Elad. Since the topography of the study area is relatively flat, the meteorological data are assumed to represent the conditions at Elad and its vicinity [23].

2.3. Sample Preparation and Analysis

Following a quality assurance process and a calibration (for details, see [23]), hourly average PNCs of the fine (0.5–2.5 μm) and coarse (>2.5 μm) particle fractions were calculated for each device, and simultaneous data from the paired indoor–outdoor devices were used to calculate hourly fine and coarse IOR at each location. Due to lack of compatibility with reference measurements, for most descriptive statistics, we used the median and the interquartile range (IQR) to report the PNC distributions. ANOVA analyses were conducted to compare the results between fine and coarse particles and among locations. Multivariate generalized linear models (GLM) were used for estimating the contributions of outdoor PNC, hour of the day, weekend/workday, season, ambient temperature, ambient relative humidity, and wind speed to the fine and coarse log-transformed IORs. PNC and IOR outliers were excluded by first removing both extreme 1% tails of the PNC distributions, and then by removing the extreme 1% tails of the IOR distribution.

3. Results

3.1. Descriptive Statistics

A total of 140,383 indoor and outdoor observations were collected in five sampling locations. All comparisons among locations and between fine and coarse particles from ANOVA analyses were statistically significant at the 0.05 alpha level. In all locations, the median of the fine PNC level is from 5.49 to 10.91 per cm3 (i.e., cm−3), and 0.34 to 1.20 cm−3 for coarse PNCs. The median fine PNC levels were much higher than those of coarse PNCs, both indoors and outdoors (Figure 3). In addition, median outdoor PNC levels were always higher than those of the corresponding indoor PNCs, in agreement with previous studies [24,25]. In the two school locations (Einat and Givat Haim), the differences between indoor and outdoor PNC levels were larger than those in the three residential locations in Elad. The fine and coarse PNC fractions varied similarly but with distinct variability span along the day, both indoors and outdoors. Outdoor fine PNC levels peak during the night (with the highest level of 10.05 cm−3) and experience a trough in the afternoon (with the lowest level of 4.57 cm−3) with concentrations lower than the fine indoor PNC levels (Figure 4a). The hourly distribution of outdoor coarse PNCs is similar to that of the fine particles, but indoor coarse PNCs are much lower during the night, with the lowest level of 0.29 cm−3 (Figure 4b).
Overall, the median IORs of the fine and the coarse fractions are 0.83 and 0.70, with an IQR of 0.59 and 0.77, respectively. The IOR medians were <1 in all the five locations (Figure 5), in agreement with previous studies [25,26,27]. This represents a considerable contribution of ambient particles to the observed indoor PNC. As expected, fine particles penetrate indoors more easily in comparison to coarse particles due to their enhanced mobility and diffusive nature. The daily IOR variation shows clear trends that were not revealed when shorter sampling periods of indoor and outdoor particle concentrations were analyzed (Figure 6) [26,28]. Lower IORs were experienced at night than during the day, with the daily peak in IOR (>1) around noon, possibly representing indoor activities such as cooking, cleaning, or playing [17,25,29]. When examining seasonal patterns, a trough was found during summer for the median of PNCs both indoors and outdoors, and for both fractions. Lower PNC IORs are seen during the spring and the autumn and higher IORs are observed during the summer (Figure 7).

3.2. Multivariate Models

Associations of different predictors with log-transformed IOR of the fine and coarse PNC fractions are presented in Table 1. The IOR shows a strong association with the outdoor PNCs, especially for fine particles, possibly due to the enhanced infiltration rates and smaller deposition velocities of fine particles [25]. Meteorological factors presented weaker associations with the IOR. For both the fine and coarse fractions, high temperatures have the strongest associations with the IOR among the meteorological variables.
Figure 8 and Figure 9 present the model results for the fine and coarse PNCs, respectively, stratified by season. The IOR of the fine fraction was found to be weakly associated with the hour of day, especially in winter, in contrast to findings from India, where higher IOR was observed in winter and attributed to bonfire emission [30]. The weekend impact on fine PNC IOR is evident during the summer and the winter, while for the coarse PNC, it is observed only in the summer. This may result from seasonal variations of the time spent indoors [17,25,29]. Stronger associations between the ambient temperature and IOR were observed in summer and winter for both PNC fractions. However, in the summer, the association is negative, whereas in the winter, it is positive.

4. Discussion

This study provides basic data about IOR of two PNC size fractions in Israel and attempts to assess different factors that may affect it based on year-round measurements. The purpose of this work is to serve future epidemiological studies in Israel, and possibly elsewhere after required adaptations, to partially account for actual exposure to airborne pollutants while staying indoors, but when the main source of the airborne particles is of outdoor nature. We hope to encourage researchers and policy makers to consider indoor exposure when people stay indoors rather than to use only outdoor particle levels as exposure metrics.
The observed hourly PNC distribution may reflect a larger impact of indoor human activities on PNC of the coarse fraction than on PNC of the fine fraction, since suspended dust is commonly found in the coarse size fraction. The PNC of the fine fraction was found to be more affected by meteorological conditions [31], with the major effect possibly related to atmospheric stability (with mostly stable conditions at night and unstable conditions during the day) and the thickness of the atmospheric boundary layer (shallow at night and rather high during the day). Thus, the trough in the indoor PNC between 4:00 and 5:00 a.m. may represent particle deposition during periods of minimal human activity, whereas the calm winds that often prevail outdoors at this time of the day result in advection that diminishes the effect of particle settling. The latter is especially relevant for coarse PNC due to the much faster settling velocity of large particles. A similar trend of a decrease in IOR after the end of daily activities was also found in Perrino’ study [32], but it can also be related to the effect of the high humidity during the night [30]. The seasonal PNC pattern may be related to the fact that in Israel, both winter and summer are characterized by closed windows, saving cooling or heating energy, respectively. Spring and the autumn in Israel are characterized by warm and dry weather [33], and people often opt to open windows. Hence, in spring and autumn, the IOR is closer to unity, in particular for the fine fraction which tends to be less affected by gravitational settling.
The coefficients of different seasons in the multivariate models suggest that the spring is associated with higher IOR than the other seasons, possibly due to longer times in which windows and doors are open and airborne particles can penetrate the indoor environment and stay airborne for long times. This was also found in Switzerland during warm season, where the IOR was close to 1 because of the use of nature ventilation [25]. Among such spring airborne particles, allergens (pollen) are well known to cause the spring fever. It is noteworthy that the summer and winter PNC IOR model coefficients are different from those found elsewhere, with the wind speed showing very weak association with the IOR in particular, in contrast to findings in other studies [34]. The different associations of the ambient temperature and the IOR in different seasons may reflect personal preferences with respect to the use of air conditioners and its direct effect on the penetration of particles indoors [30]. In winter and summer, the slope (β) of the temperature has opposite signs since the temperatures are below (above) the annual average (and the thermal comfort), respectively.
Our study has several limitations. Firstly, ventilation rates and air exchange preference were not measured quantitatively due to technical difficulties, so we could not examine the variation of PNC IOR with respect to the air exchange rate. Secondly, the OPCs we have used were limited to measuring only particles >0.5μm. As such, our PNC does not represent ultrafine particles or particles in the 0.1–0.5 μm size fraction, which may have higher importance for health effects studies. Thirdly, we could not document the behavior of the residents, in particular cooking and cleaning activities, that are known to result in emission/generation of particles in indoor environments.
Nonetheless, our study had several unique advantages. Firstly, it is based on a field campaign that lasted for a full year with a 1 min measurement resolution in five different locations, simultaneously, and with a true pair of indoor–outdoor OPC measurements in each of these locations. We were able to deploy such a network of OPCs due to their relatively low price and low maintenance requirements. Using such a network is not optimal for gathering exact personal exposure estimates, but is very efficient in order to compare concentrations among sites over a long period of time [23]. Secondly, we used a multivariate model in order to examine the independent associations of each variable with the PNC IOR. We suggest that future studies consider the residents’ behavior/activities and ventilation practices/preferences, possibly using a video diary or a detailed questionnaire, and measure ventilation rates as well if possible.

5. Conclusions

The relationship between indoor and outdoor PNC depends on many factors, including particle size, outdoor PNC, meteorological conditions, integrity of the building envelope, and the residents’ preferences with respect to mechanical/natural ventilation. We were able to examine the impact of some of these factors using a generalized linear model with one-year field data. The outdoor PNC was found to be the most important predictor of indoor PNC at all meteorological conditions [30,35], but the residents’ preferences and activities may dominate the IOR when considerable indoor activities prevail, e.g., smoking, stir and fry cooking, vacuum cleaning, dusting, etc. While smoking and cooking tend to elevate the fine PNC, house holding activities affect to a larger extent the coarse fraction [20,36].Information about the indoor-to-outdoor ratio (IOR) of particle concentrations in different regions and seasons may help epidemiologists and policy makers understand the health effects of ambient air pollution and correct their exposure assessments with a measure that represents indoor exposure as well.

Author Contributions

Conceptualization, R.R.; methodology, R.R., Y.; formal analysis, R.R., S.Z.; investigation, R.R., S.Z.; data curation, Y., S.Z.; writing—original draft preparation, S.Z.; writing—review and editing, R.R., D.M.B., Y. and S.Z. All authors have read and agreed to the published version of the manuscript.

Funding

This research was funded by the Israel Ministry of National Infrastructure, Energy and Water Resources grant #215–17–15, and the Leona H. and Harry B. Helmsley Charitable Trust Grant #2015PG–ISL006 to the Technion–Shantou University Collaboration in Environmental Health.

Conflicts of Interest

The authors declare no conflict of interest.

References

  1. U.S. Environmental Protection Agency. Integrated Science Assessment (ISA) for Particulate Matter (Final Report, 2019); EPA/600/R–19/188; U.S. Environmental Protection Agency: Washington, DC, USA, 2019.
  2. Du, Y.; Xu, X.; Chu, M.; Guo, Y.; Wang, J. Air particulate matter and cardiovascular disease: The epidemiological, biomedical and clinical evidence. J. Thorac. Dis. 2016, 8, E8–E19. [Google Scholar] [CrossRef] [PubMed]
  3. Pavilonis, B.T.; Anthony, T.R.; O’Shaughnessy, P.T.; Humann, M.J.; Merchant, J.A.; Moore, G.; Thorne, P.S.; Weisel, C.P.; Sanderson, W.T. Indoor and outdoor particulate matter and endotoxin concentrations in an intensely agricultural county. J. Expo. Sci. Environ. Epidemiol. 2013, 23, 299–305. [Google Scholar] [CrossRef] [PubMed] [Green Version]
  4. Kim, K.H.; Kabir, E.; Kabir, S. A review on the human health impact of airborne particulate matter. Environ. Int. 2015, 74, 136–143. [Google Scholar] [CrossRef] [PubMed]
  5. Buonanno, G.; Stabile, L.; Morawska, L. Personal exposure to ultrafine particles: The influence of time–activity patterns. Sci. Total Environ. 2014, 468–469, 903–907. [Google Scholar] [CrossRef] [PubMed] [Green Version]
  6. Klepeis, N.E.; Nelson, W.C.; Ott, W.R.; Robinson, J.P.; Tsang, A.M.; Switzer, P.; Behar, J.V.; Hern, S.C.; Engelmann, W.H. The National Human Activity Pattern Survey (NHAPS): A resource for assessing exposure to environmental pollutants. J. Expo. Sci. Environ. Epidemiol. 2001, 11, 231. [Google Scholar] [CrossRef] [PubMed] [Green Version]
  7. Leavey, A.; Londeree, J.; Priyadarshini, P.; Puppala, J.; Schechtman, K.B.; Yadama, G.; Biswas, P. Real–time particulate and CO concentrations from cookstoves in rural households in Udaipur, India. Environ. Sci. Technol. 2015, 49, 7423–7431. [Google Scholar] [CrossRef]
  8. Ferro, A.R.; Kopperud, R.J.; Hildemann, L.M. Source strengths for indoor human activities that resuspend particulate matter. Environ. Sci. Technol. 2004, 38, 1759–1764. [Google Scholar] [CrossRef] [PubMed]
  9. Chen, C.; Zhao, B. Review of relationship between indoor and outdoor particles: I/O ratio, infiltration factor and penetration factor. Atmos. Environ. 2011, 45, 275–288. [Google Scholar] [CrossRef]
  10. Taylor, J.; Shrubsole, C.; Davies, M.; Biddulph, P.; Das, P.; Hamilton, I.; Vardoulakis, S.; Mavrogianni, A.; Jones, B.; Oikonomou, E. The modifying effect of the building envelope on population exposure to PM2.5 from outdoor sources. Indoor Air 2014, 24, 639–651. [Google Scholar] [CrossRef] [Green Version]
  11. Ganor, E.; Stupp, A.; Alpert, P. A method to determine the effect of mineral dust aerosols on air quality. Atmos. Environ. 2009, 43, 5463–5468. [Google Scholar] [CrossRef]
  12. Erel, Y.; Kalderon–Asael, B.; Dayan, U.; Sandler, A. European atmospheric pollution imported by cooler air masses to the Eastern Mediterranean during the summer. Environ. Sci. Technol. 2007, 41, 5198–5203. [Google Scholar] [CrossRef] [PubMed]
  13. Sarnat, J.A.; Moise, T.; Shpund, J.; Liu, Y.; Pachon, J.E.; Qasrawi, R.; Abdeen, Z.; Brenner, S.; Nassar, K.; Saleh, R.; et al. Assessing the spatial and temporal variability of fine particulate matter components in Israeli, Jordanian, and Palestinian cities. Atmos. Environ. 2010, 40, 2383–2392. [Google Scholar] [CrossRef]
  14. Kanakidou, M.; Mihalopoulos, N.; Kindap, T.; Im, U.; Vrekoussis, M.; Gerasopoulos, E.; Dermitzaki, E.; Unal, A.; Koçak, M.; Markakis, K.; et al. Megacities as hot spots of air pollution in the East Mediterranean. Atmos. Environ. 2011, 45, 1223–1235. [Google Scholar] [CrossRef]
  15. Wichmann, H.E.; Spix, C.; Tuch, T.; Wölke, G.; Peters, A.; Heinrich, J.; Kreyling, W.G.; Heyder, J. Daily mortality and fine and ultrafine particles in Erfurt, Germany part I: Role of particle number and particle mass. Res. Rep. (Health Eff. Inst.) 2000, 98, 5–86. [Google Scholar]
  16. Bischof, O.F. Recent Developments in the Measurement of Low Particulate Emissions from Mobile Sources: A Review of Particle Number Legislations. Emiss. Control. Sci. Technol. 2015, 1, 203–212. [Google Scholar] [CrossRef] [Green Version]
  17. Monn, C.H.; Fuchs, A.; Högger, D.; Junker, M.; Kogelschatz, D.; Roth, N.; Hu, W. Particulate matter less than 10 μm (PM10) and fine particles less than 2.5 μm (PM2. 5): Relationships between indoor, outdoor and personal concentrations. Sci. Total Environ. 1997, 208, 15–21. [Google Scholar] [CrossRef]
  18. Liu, D.L.; Nazaroff, W.W. Modeling pollutant penetration across building envelopes. Atmos. Environ. 2001, 35, 4451–4462. [Google Scholar] [CrossRef] [Green Version]
  19. Krasnov, H.; Katra, I.; Friger, M. Insights into Indoor/Outdoor PM Concentration Ratios due to Dust Storms in an Arid Region. Atmosphere 2015, 6, 879–890. [Google Scholar] [CrossRef] [Green Version]
  20. Chithra, V.S.; Shiva Nagendra, S.M. Chemical and morphological characteristics of indoor and outdoor particulate matter in an urban environment. Atmos. Environ. 2013, 77, 579–587. [Google Scholar] [CrossRef]
  21. Chen, A.; Gall, E.T.; Chang, V.W. Indoor and outdoor particulate matter in primary school classrooms with fan–assisted natural ventilation in Singapore. Environ. Sci. Pollut. Res. Int. 2016, 23, 17613–17624. [Google Scholar] [CrossRef]
  22. Hystad, P.U.; Setton, E.M.; Allen, R.W.; Keller, P.C.; Brauer, M. Modeling residential fine particulate matter infiltration for exposure assessment. J. Expo. Sci. Environ. Epidemiol. 2009, 19, 570–579. [Google Scholar] [CrossRef] [PubMed] [Green Version]
  23. Yuval; Magen Molho, H.; Zivan, O.; Broday, D.M.; Raz, R. Application of a sensor network of low cost optical particle counters for assessing the impact of quarry emissions on its vicinity. Atmos. Environ. 2019, 211, 29–37. [Google Scholar] [CrossRef]
  24. Tippayawong, N.; Khuntong, P.; Nitatwichit, C.; Khunatorn, Y.; Tantakitti, C. Indoor/outdoor relationships of size–resolved particle concentrations in naturally ventilated school environments. Build. Environ. 2009, 44, 188–197. [Google Scholar] [CrossRef]
  25. Meier, R.; Eeftens, M.; Phuleria, H.C.; Ineichen, A.; Corradi, E.; Davey, M.; Fierz, M.; Ducret–Stich, R.E.; Aguilera, I.; Schindler, C.; et al. Differences in indoor versus outdoor concentrations of ultrafine particles, PM2.5, PMabsorbance and NO2 in Swiss homes. J. Expo. Sci. Environ. Epidemiol. 2015, 25, 499–505. [Google Scholar] [CrossRef]
  26. Cyrys, J.; Pitz, M.; Bischof, W.; Wichmann, H.E.; Heinrich, J. Relationship between indoor and outdoor levels of fine particle mass, particle number concentrations and black smoke under different ventilation conditions. J. Expo. Anal. Environ. Epidemiol. 2004, 14, 275–283. [Google Scholar] [CrossRef] [Green Version]
  27. Fuller, C.H.; Brugge, D.; Williams, P.L.; Mittleman, M.A.; Lane, K.; Durant, J.L.; Spengler, J.D. Indoor and outdoor measurements of particle number concentration in near–highway homes. J. Expo. Sci. Environ. Epidemiol. 2013, 23, 506–512. [Google Scholar] [CrossRef]
  28. Huang, L.; Pu, Z.; Li, M.; Sundell, J. Characterizing the Indoor–Outdoor Relationship of Fine Particulate Matter in Non–Heating Season for Urban Residences in Beijing. PLoS ONE 2015, 10, e0138559. [Google Scholar] [CrossRef]
  29. Jones, N.C.; Thornton, C.A.; Mark, D.; Harrison, R.M. Indoor/outdoor relationships of particulate matter in domestic homes with roadside, urban and rural locations. Atmos. Environ. 2000, 34, 2603–2612. [Google Scholar] [CrossRef]
  30. Massey, D.; Kulshrestha, A.; Masih, J.; Taneja, A. Seasonal trends of PM10, PM5.0, PM2.5 & PM1.0 in indoor and outdoor environments of residential homes located in North–Central India. Build. Environ. 2012, 47, 223–231. [Google Scholar] [CrossRef]
  31. Yuval; Levi, Y.; Dayan, U.; Levy, I.; Broday, D.M. On the association between characteristics of the atmospheric boundary layer and air pollution concentrations. Atmos. Res. 2020, 231. [Google Scholar] [CrossRef]
  32. Perrino, C.; Tofful, L.; Canepari, S. Chemical characterization of indoor and outdoor fine particulate matter in an occupied apartment in Rome, Italy. Indoor Air 2016, 26, 558–570. [Google Scholar] [CrossRef] [PubMed]
  33. Goldreich, Y. The Climate of Israel: Observation, Research and Application; Springer Science & Business Media: Berlin/Heidelberg, Germany, 2012. [Google Scholar]
  34. Chithra, V.S.; Shiva Nagendra, S.M. Impact of outdoor meteorology on indoor PM10, PM2.5 and PM1 concentrations in a naturally ventilated classroom. Urban. Clim. 2014, 10, 77–91. [Google Scholar] [CrossRef]
  35. Bozlaker, A.; Peccia, J.; Chellam, S. Indoor/Outdoor Relationships and Anthropogenic Elemental Signatures in Airborne PM2.5 at a High School: Impacts of Petroleum Refining Emissions on Lanthanoid Enrichment. Environ. Sci. Technol. 2017, 51, 4851–4859. [Google Scholar] [CrossRef] [PubMed]
  36. Hassanvand, M.S.; Naddafi, K.; Faridi, S.; Arhami, M.; Nabizadeh, R.; Sowlat, M.H.; Pourpak, Z.; Rastkari, N.; Momeniha, F.; Kashani, H.; et al. Indoor/outdoor relationships of PM10, PM2.5, and PM1 mass concentrations and their water–soluble ions in a retirement home and a school dormitory. Atmos. Environ. 2014, 82, 375–382. [Google Scholar] [CrossRef]
Figure 1. Study area and deployment locations, central Israel (source: Google maps).
Atmosphere 11 01074 g001
Figure 2. Temporal coverage of the quality controlled indoor and outdoor particle number concentration (PNC) time series in each site. Green and black denote valid and missing data, respectively.
Atmosphere 11 01074 g002
Figure 3. Distribution of the median (solid symbols) and interquartile range (vertical bars) of the five study locations combined. (a) Fine indoor (red) and outdoor (blue) PNCs; (b) coarse indoor (red) and outdoor (blue) PNCs.
Atmosphere 11 01074 g003
Figure 4. Daily variation of the median (solid line) and interquartile range (vertical bars) of indoor (red) and outdoor (blue) PNCs (all locations combined). (a) Fine PNCs; (b) coarse PNCs.
Atmosphere 11 01074 g004
Figure 5. Variation of the median (solid symbols) and interquartile range (vertical bars) of indoor-to-outdoor ratio (IOR) of the fine (red) and coarse (blue) PNC fractions across all the deployment locations.
Atmosphere 11 01074 g005
Figure 6. Daily patterns of the IOR median (solid lines) and interquartile range (vertical bars) of fine (red) and coarse (blue) PNC fractions. Data from all locations combined.
Atmosphere 11 01074 g006
Figure 7. Annual variation of the medians (solid lines) and their interquartile ranges (vertical bars) of fine (a) and coarse (b) PNCs and of the IOR (c). Data from October 2016 to October 2017 and from all locations were combined.
Atmosphere 11 01074 g007
Figure 8. GLM for log(IORfine) and different parameters categorized by season.
Atmosphere 11 01074 g008
Figure 9. GLM for log(IORcoarse) and different parameters categorized by season.
Atmosphere 11 01074 g009
Table 1. Generalized linear model (GLM) for log(IORfine) or log(IORcoarse) and different parameters.
log(IORfine)log(IORcoarse)
EstimateCIp-ValueEstimateCIp-Value
2.5%97.5%2.5%97.5%
Intercept−0.43−0.44−0.42<0.01−0.78−0.92−0.65<0.01
Categorical Outdoor PNC0–2 (cm−3)0.340.320.36<0.010.260.130.39<0.01
2–10 (cm−3)0.160.150.16<0.010.10−0.030.230.14
>10 (cm−3)Ref. Ref.
Categorical Hour of the Day0–07Ref. Ref.
07–180.110.100.11<0.010.230.210.24<0.01
18–240.080.070.08<0.010.170.160.18<0.01
Categorical Temperature2–12 °CRef. Ref.
12–18 °C0.060.050.07<0.010.060.050.08<0.01
>18 °C0.060.050.08<0.010.080.060.09<0.01
Weekend vs. Workdays 0.020.010.02<0.010.020.010.03<0.01
Categorical Relative Humidity0–15%0.00−0.020.020.640.040.010.07<0.01
15–70%0.060.050.07<0.010.050.040.06<0.01
>70%Ref. Ref.
Categorical Wind Speed>3.3 m/s vs.
0–3.3 m/s
0.010.010.02<0.010.020.010.03<0.01
Seasonspring0.100.090.10<0.010.080.070.09<0.01
summerRef. Ref.
autumn0.050.050.06<0.010.040.030.05<0.01
winter0.050.030.06<0.010.020.000.030.06

