Adaption of an Evaporative Desert Cooler into a Liquid Desiccant Air Conditioner: Experimental and Numerical Analysis


Abstract
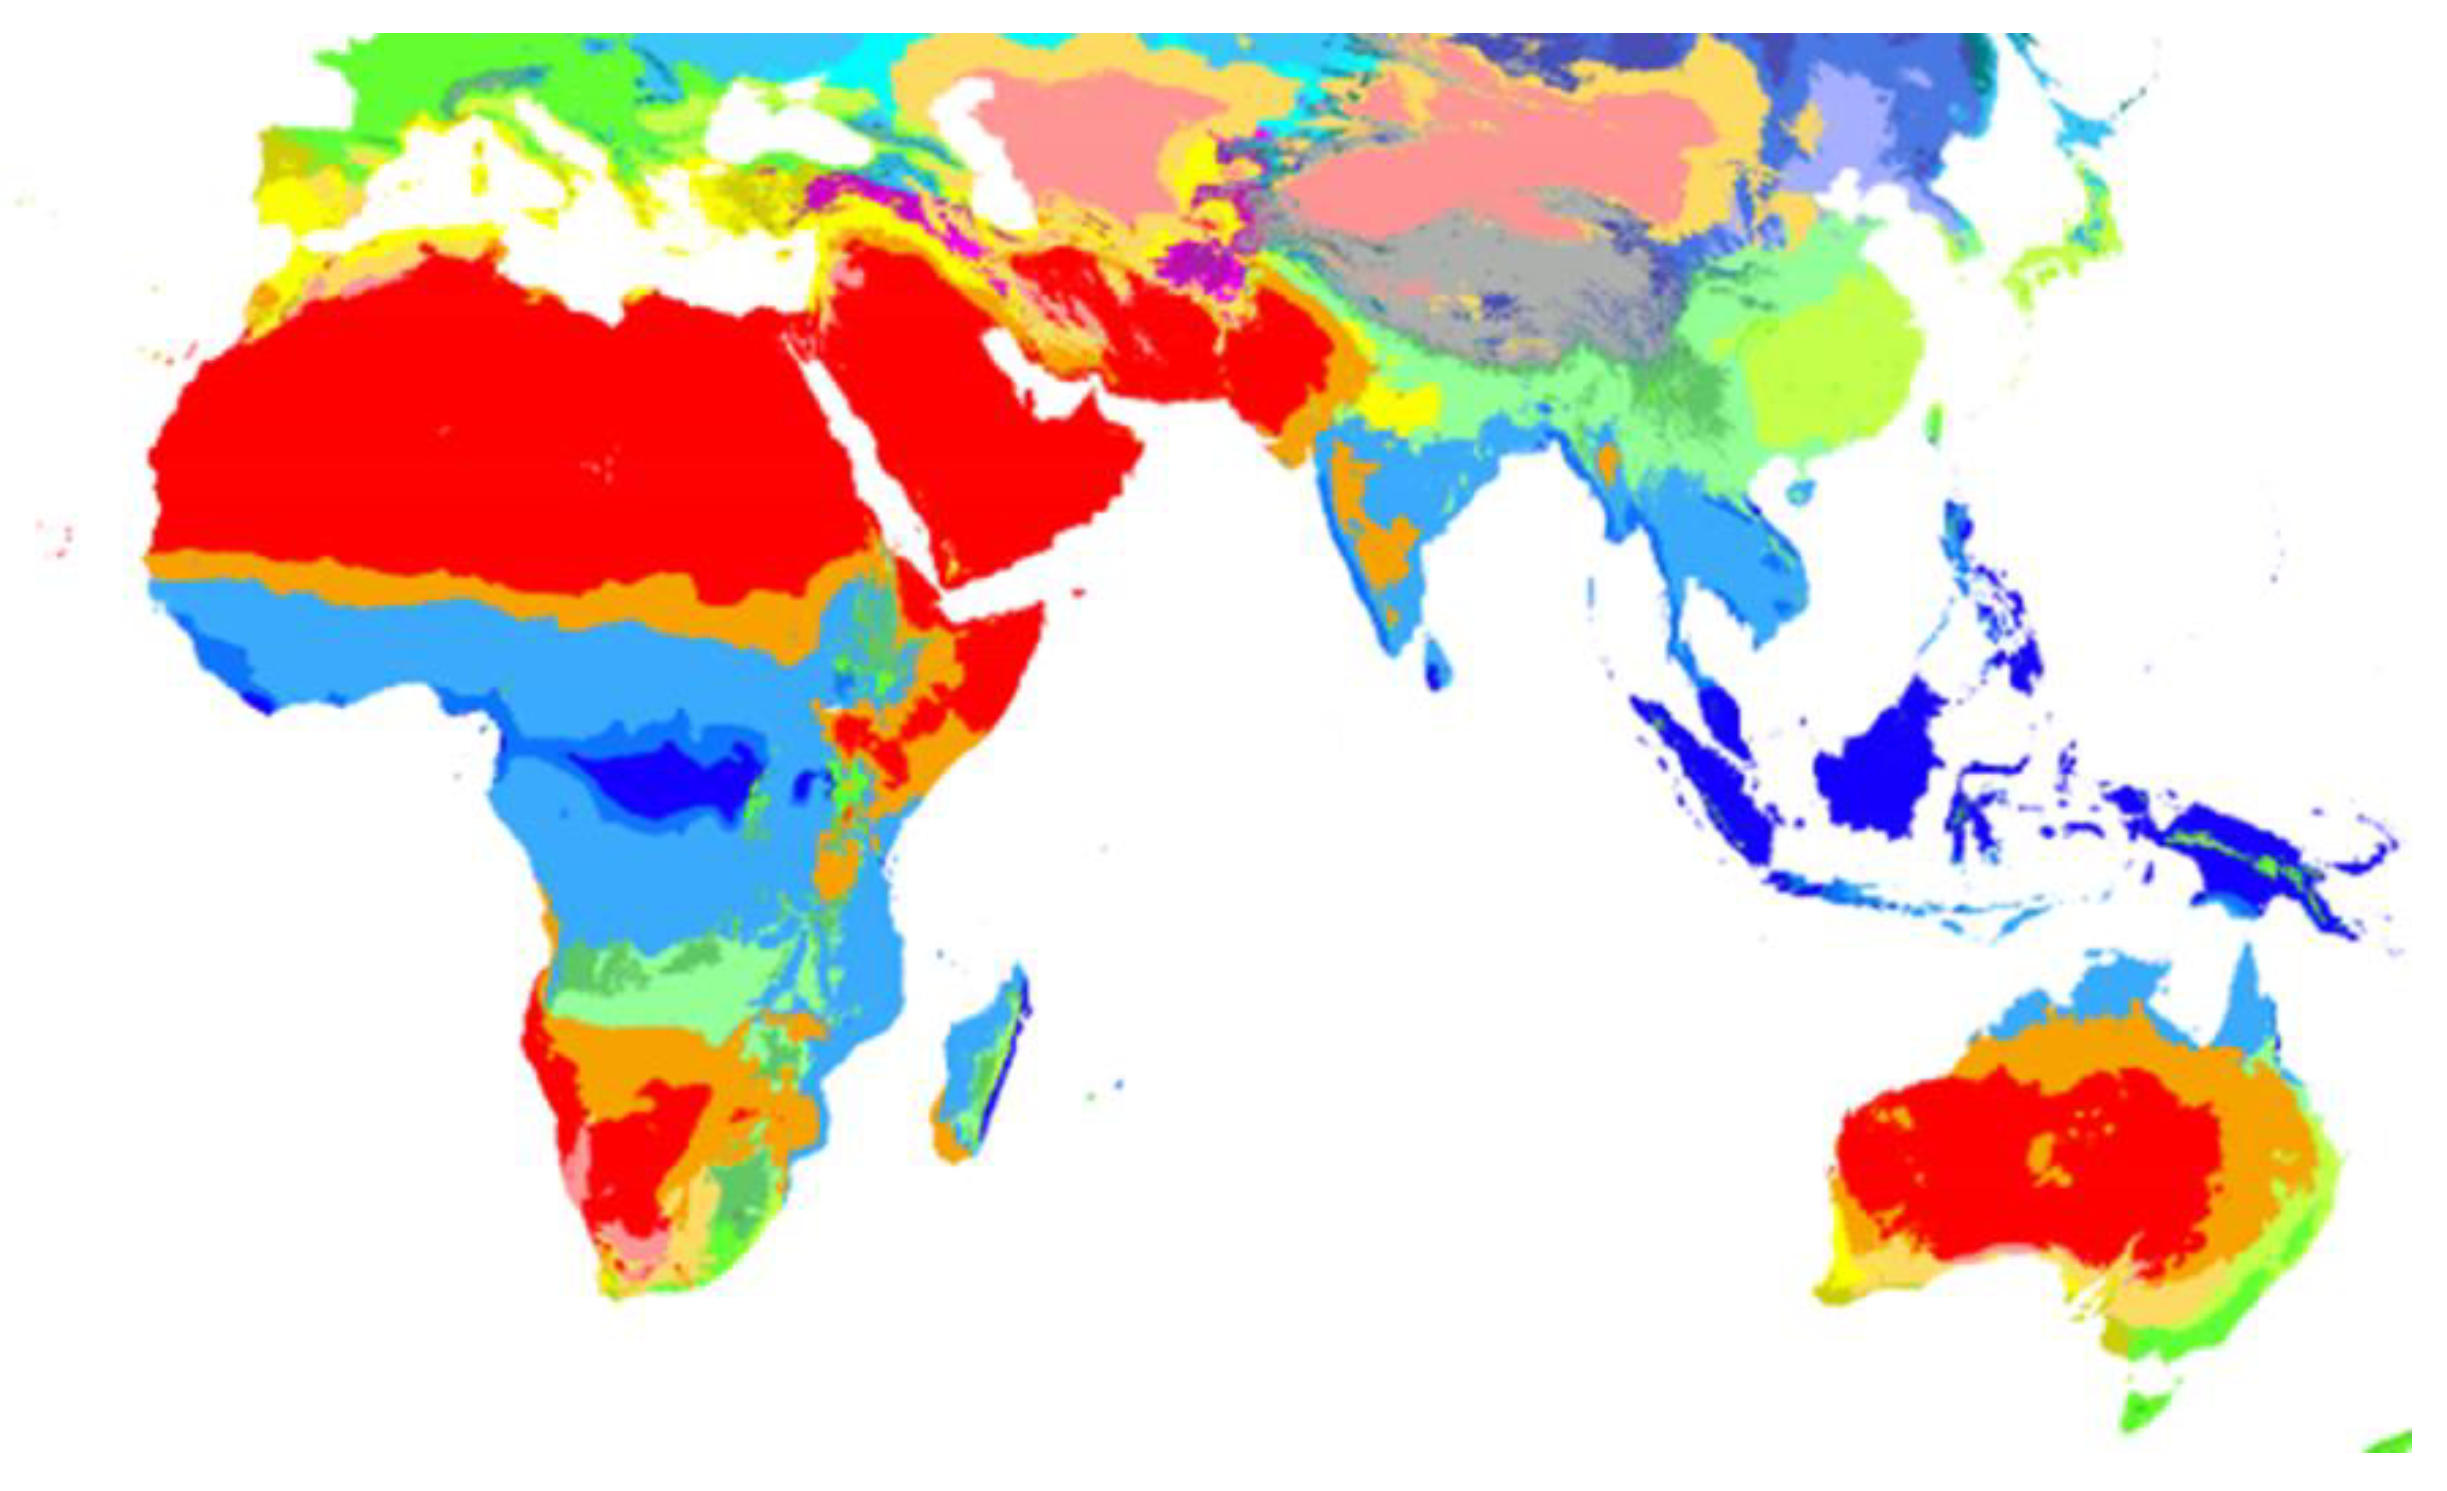
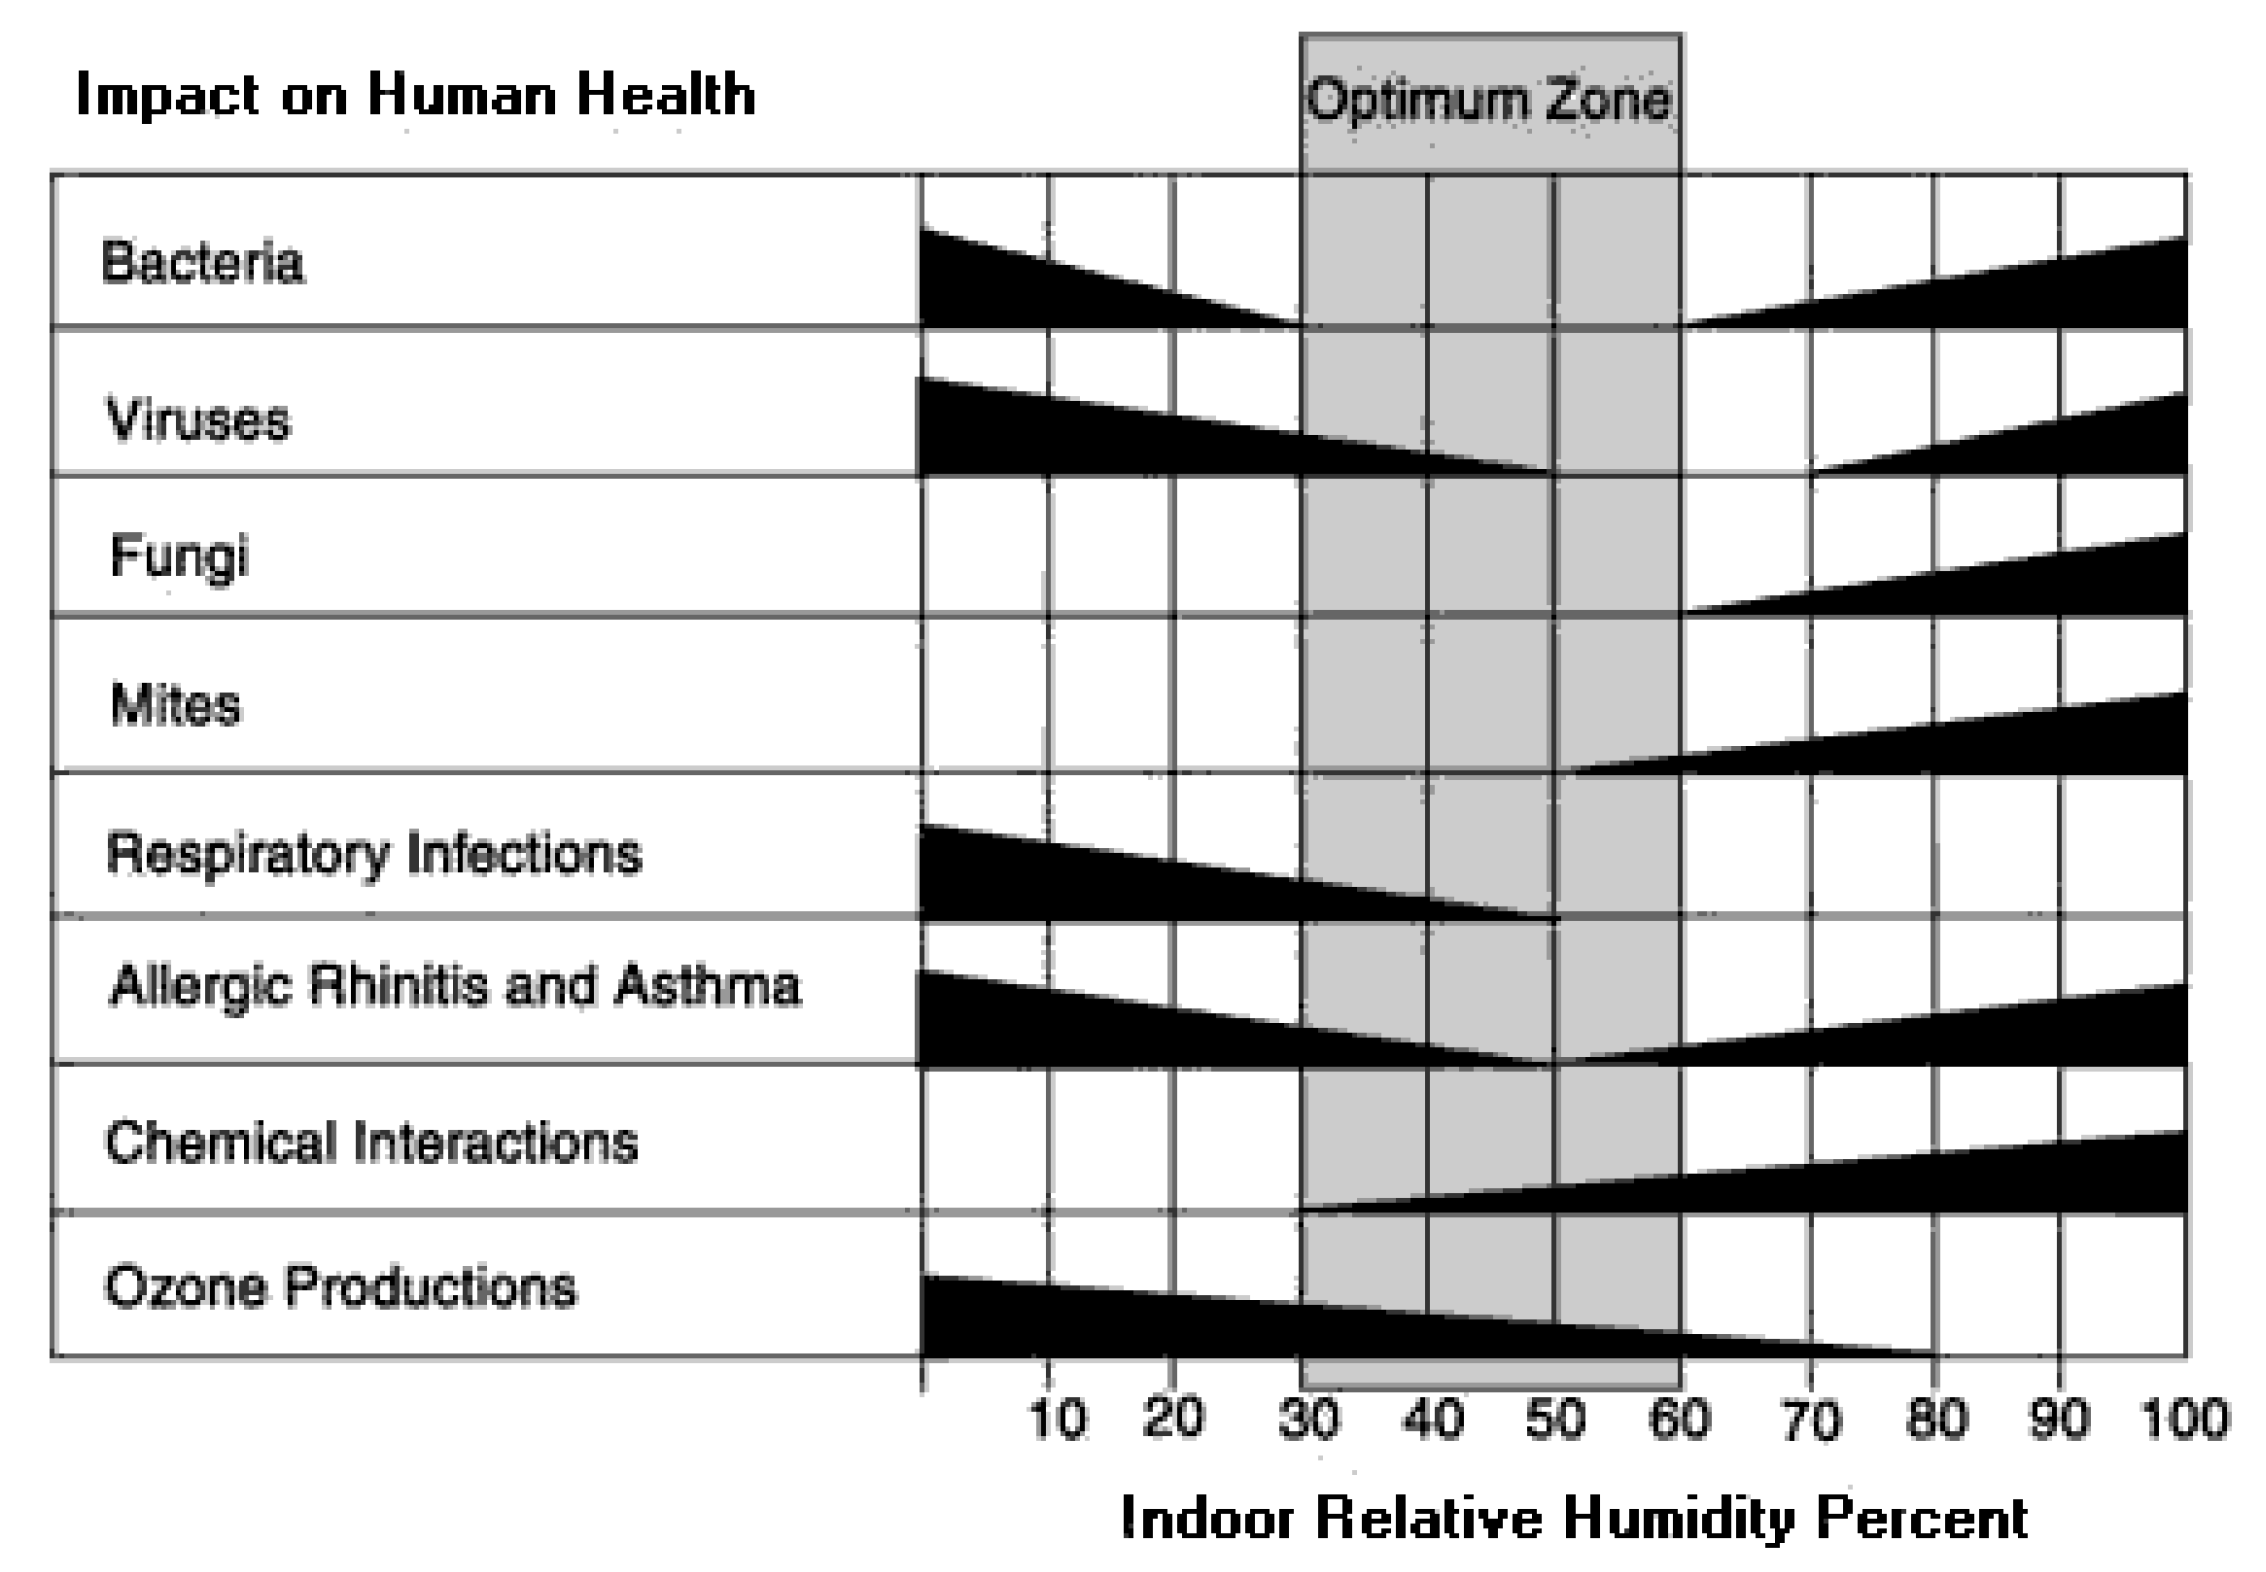
:1. Introduction
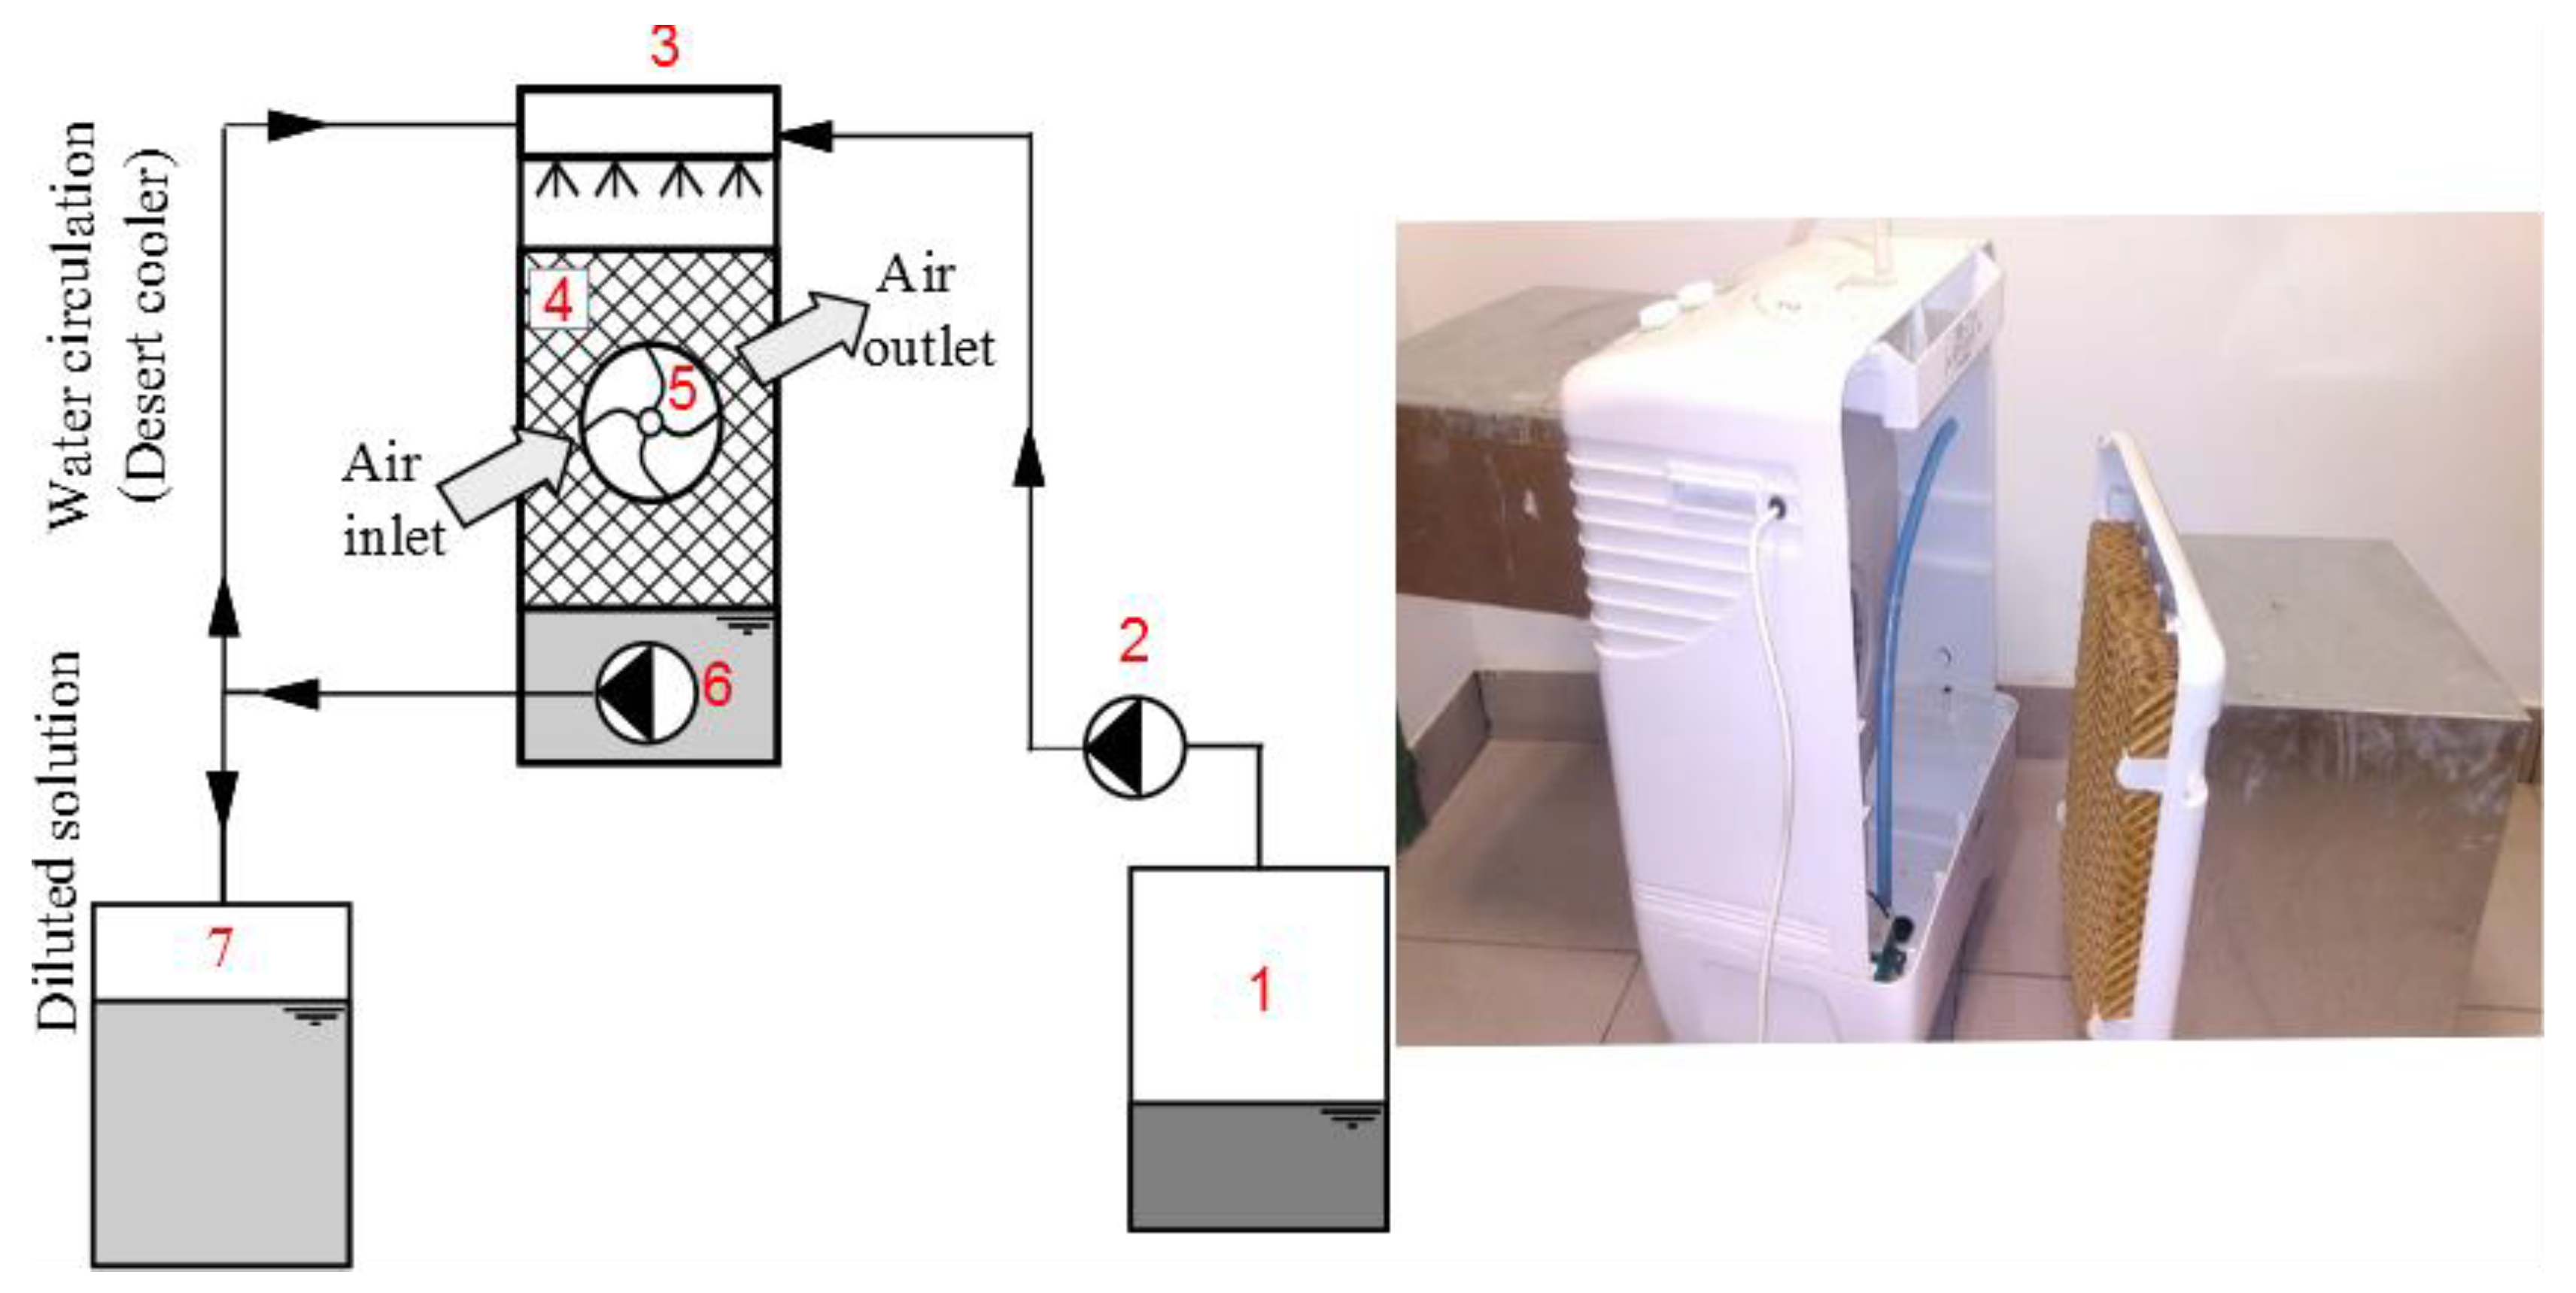
2. Description of the Modified Desert Cooler
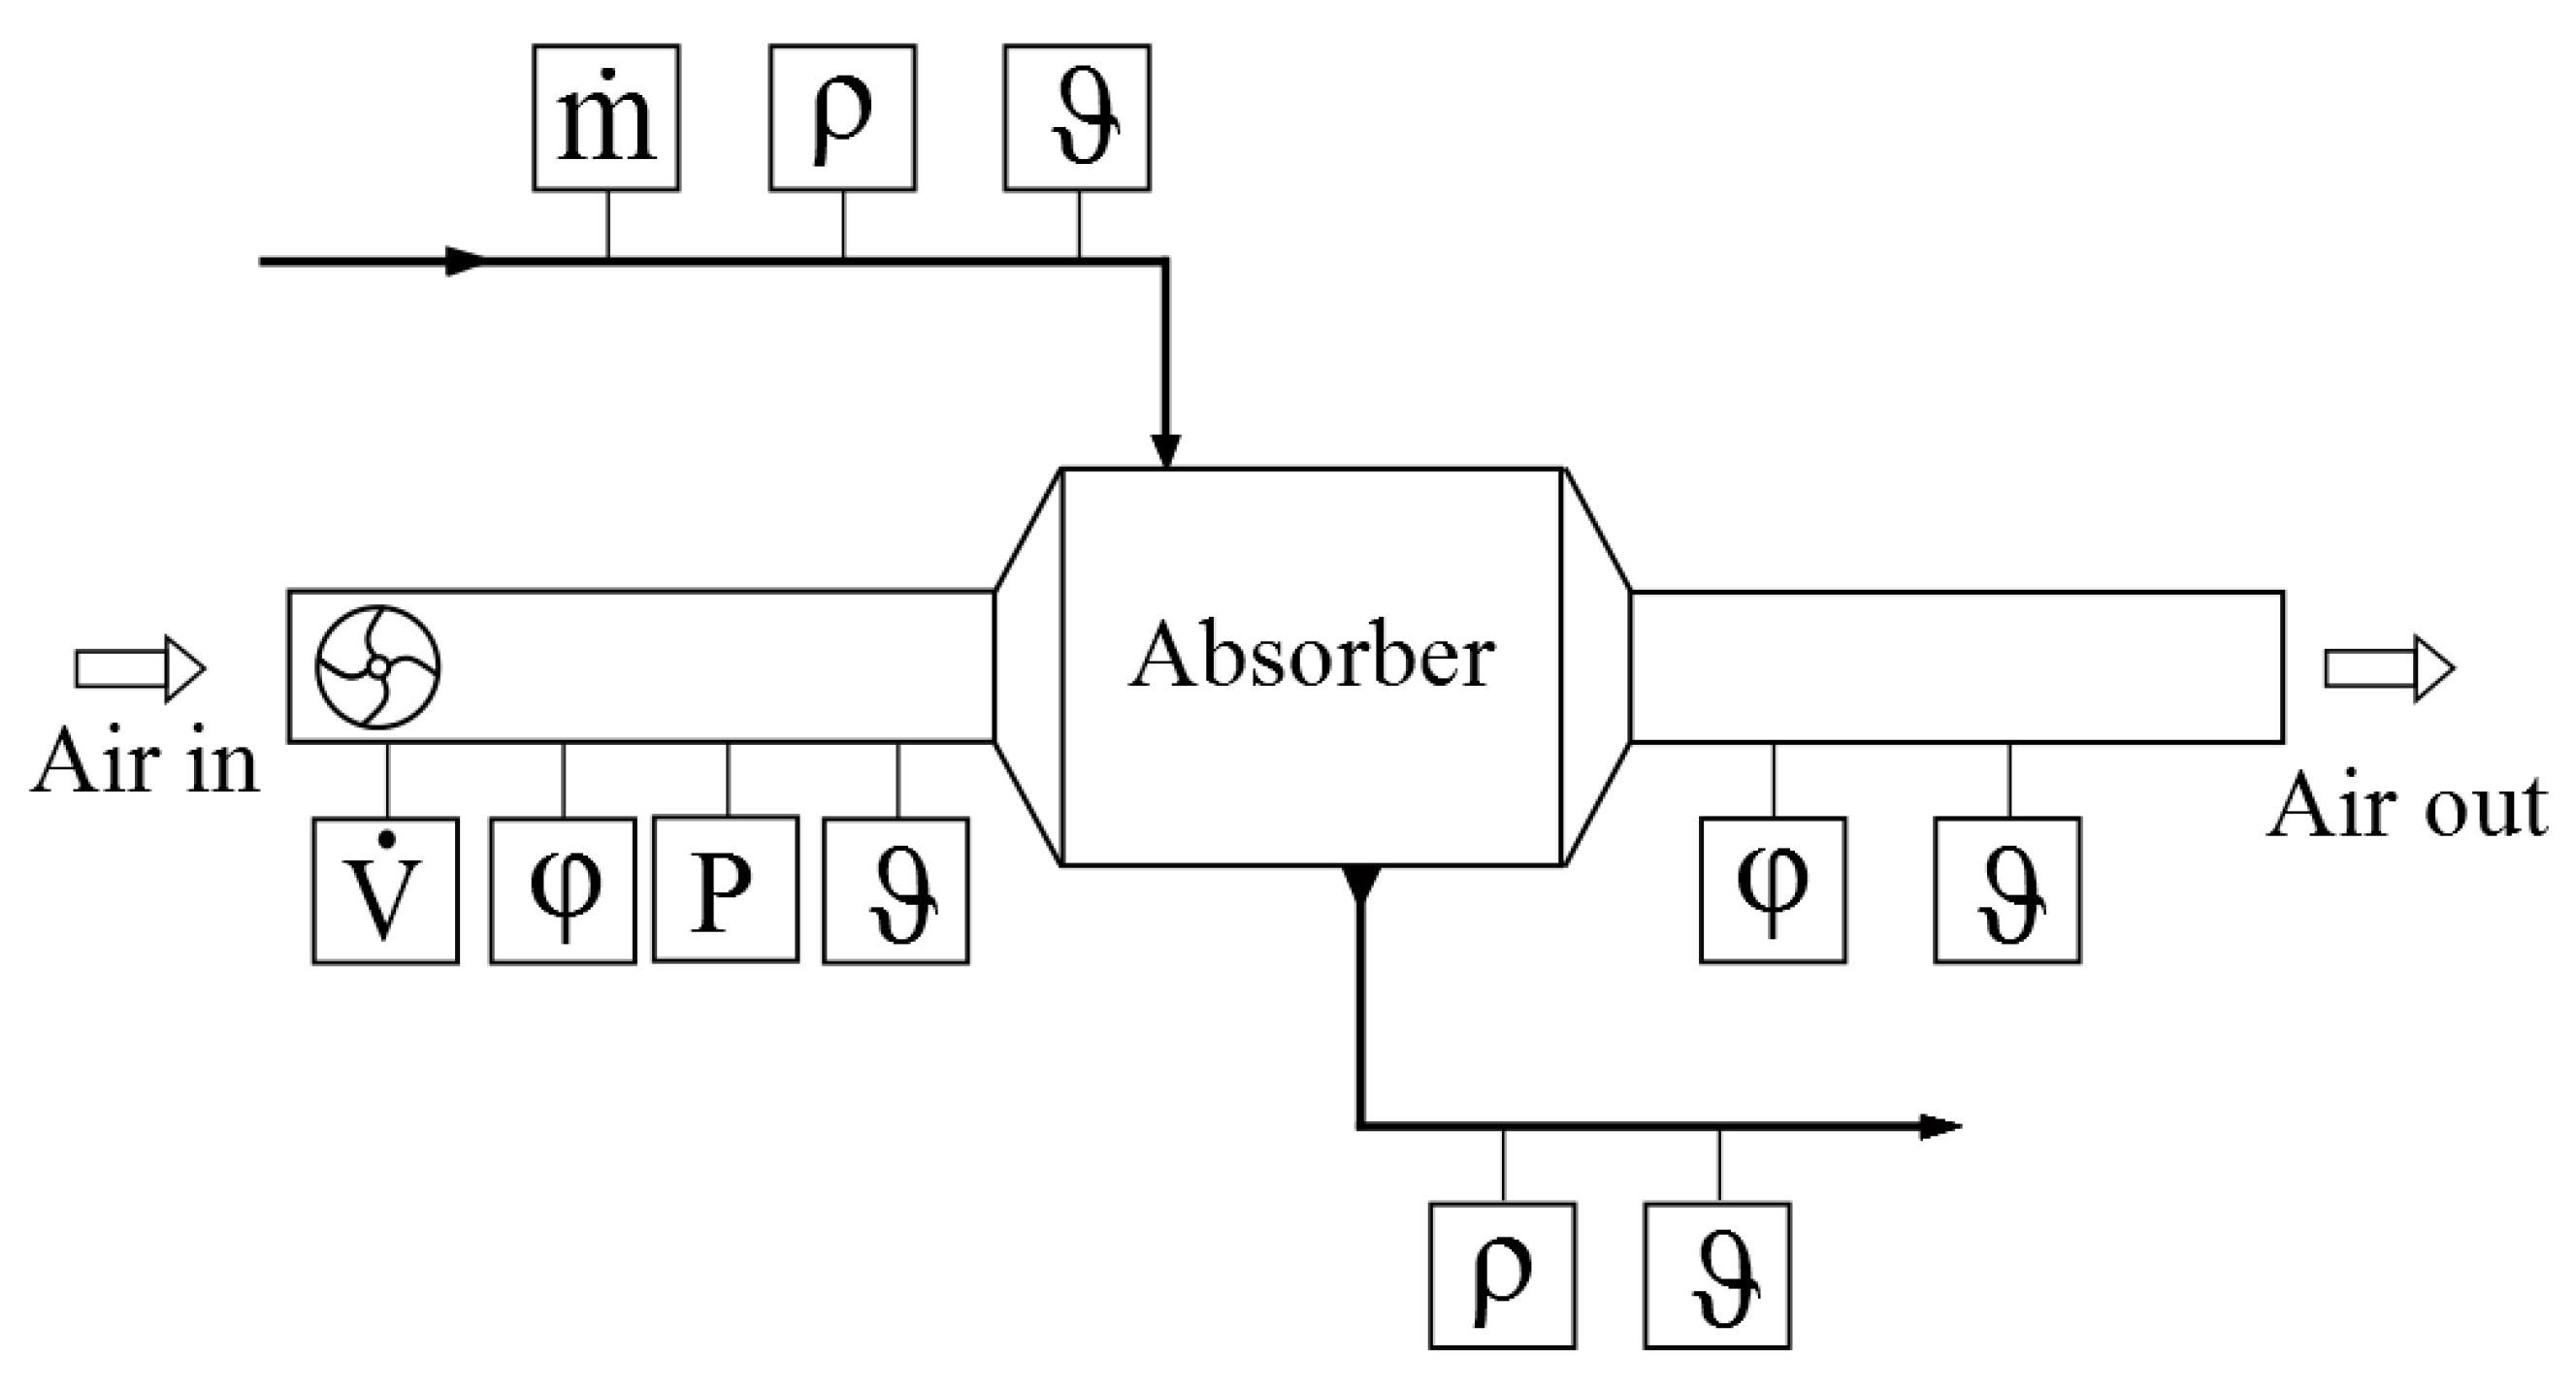
3. Instrumentation and Experimental Setup
4. Numerical Model
5. Results and Discussion
5.1. Conventional Direct Evaporative Cooling
5.2. Modified Desert Cooler: Adiabatic Liquid Desiccant Dehumidification
5.3. Dehumidification Load
6. Conclusions
Author Contributions
Funding
Acknowledgments
Conflicts of Interest
Nomenclature
| Symbol | Meaning | Unit |
| A | Area | |
| heat transfer coefficient | ||
| mass transfer coefficient | ||
| effectiveness | ||
| enthalpy of vaporization | ||
| mass flow rate | ||
| pressure | ||
| air to solution mass flow ratio | ||
| mass of water per mass of salt | ||
| volume | ||
| difference | ||
| thermal conductivity | ||
| humidity ratio | ||
| relative humidity | ||
| density | ||
| temperature | ||
| mass fraction of the desiccant | ||
| Subscripts | ||
| a | air | |
| CaCl2 | calcium chloride | |
| i | inlet conditions | |
| da | dry air | |
| deh | dehumidification | |
| LiCl | lithium chloride as salt | |
| NTU | number of transfer units | |
| o | outlet conditions | |
| s | saturated | |
| sol | solution | |
| v | water vapor | |
| w | water |
References
- Damiano, L.; Dougan, D. ANSI/ASHRAE Standard 62.1-2004. In Encyclopedia of Energy Engineering and Technology—3 Volume Set (Print Version); Capehart, B., Ed.; CRC Press: Boca Raton, FL, USA, 2007; pp. 50–62. [Google Scholar] [CrossRef]
- Abdel-Salam, A.H.; Simonson, C.J. State-of-the-art in liquid desiccant air conditioning equipment and systems. Renew. Sustain. Energy Rev. 2016, 58, 1152–1183. [Google Scholar] [CrossRef]
- International Energy Agency (IEA). World Energy Outlook 2018. ISBN 9789264306776 (PDF). Available online: https://doi.org/10.1787/weo-2018-en (accessed on 27 August 2019).
- Zegenhagen, M.T.; Ricart, C.; Meyer, T.; Kühn, R.; Ziegler, F. Experimental Investigation of A Liquid Desiccant System for Air Dehumidification Working With Ionic Liquids. Energy Procedia 2015, 70, 544–551. [Google Scholar] [CrossRef] [Green Version]
- Wang, S.K. Handbook of Air Conditioning and Refrigeration, 2nd ed.; McGraw-Hill Handbooks; McGraw-Hill: New York, NY, USA, 2001. [Google Scholar]
- Tu, M.; Ren, C.-Q.; Tang, G.-F.; Zhao, Z.-S. Performance comparison between two novel configurations of liquid desiccant air-conditioning system. Build. Environ. 2010, 45, 2808–2816. [Google Scholar] [CrossRef]
- Bishoyi, D.; Sudhakar, K. Experimental performance of a direct evaporative cooler in composite climate of India. Energy Build. 2017, 153, 190–200. [Google Scholar] [CrossRef] [Green Version]
- Lemons, A.R.; Hogan, M.B.; Gault, R.A.; Holland, K.J.; Sobek, E.; Olsen-Wilson, K.A.; Green, B.J. Fungal Metagenomic Analysis of Indoor Evaporative Cooler Environments in the Great Basin Desert Region. J. Allergy Clin. Immunol. 2016, 137, AB181. [Google Scholar] [CrossRef]
- Kim, W.; Dong, H.-W.; Park, J.; Sung, M.; Jeong, J.-W. Impact of an Ultraviolet Reactor on the Improvement of Air Quality Leaving a Direct Evaporative Cooler. Sustainability 2018, 10, 1123. [Google Scholar] [CrossRef] [Green Version]
- Feddema, J.J. A Revised Thornthwaite-Type Global Climate Classification. Phys. Geogr. 2005, 26, 442–466. [Google Scholar] [CrossRef]
- Xuan, Y.M.; Xiao, F.; Niu, X.F.; Huang, X.; Wang, S.W. Research and application of evaporative cooling in China: A Review (I)—Research. Renew. Sustain. Energy Rev. 2012, 16, 3535–3546. [Google Scholar] [CrossRef]
- Kang, D.; Strand, R.K. Analysis of the system response of a spray passive downdraft evaporative cooling system. Build. Environ. 2019, 157, 101–111. [Google Scholar] [CrossRef]
- Yang, Y.; Cui, G.; Lan, C.Q. Developments in evaporative cooling and enhanced evaporative cooling—A review. Renew. Sustain. Energy Rev. 2019, 113, 109230. [Google Scholar] [CrossRef]
- ASHRAE. Ventilation for Acceptable Indoor Air Quality; ASHRAE Standard 62-1999; Thermal Comfort; American Society of Heating, Refrigerating and Air-Conditioning Engineers: Atlanta, GA, USA, 1999. [Google Scholar]
- Arundel, A.; Sterling, E.; Biggin, J.; Sterling, T. Indirect Health Effects of Relative Humidity in Indoor Environments. Environ. Health Perspect. 1986, 65, 351. [Google Scholar] [CrossRef] [PubMed]
- Al-Sulaiman, F. Evaluation of the performance of local fibers in evaporative cooling. Energy Convers. Manag. 2002, 43, 2267–2273. [Google Scholar] [CrossRef]
- Liao, C.-M.; Chiu, K.-H. Wind tunnel modeling the system performance of alternative evaporative cooling pads in Taiwan region. Build. Environ. 2002, 37, 177–187. [Google Scholar] [CrossRef]
- Darwesh, M.; Abouzaher, S.; Fouda, T.; Helmy, M. Effect of Using Pad Manufactured from Agricultural Residues on the Performance of Evaporative Cooling System. Jordan J. Agric. Sci. 2009, 5, 17. [Google Scholar]
- Ahmed, E.M.; Abaas, O.; Ahmed, M.; Ismail, M.R. Performance evaluation of three different types of local evaporative cooling pads in greenhouses in Sudan. Saudi J. Biol. Sci. 2011, 18, 45–51. [Google Scholar] [CrossRef] [Green Version]
- Malli, A.; Seyf, H.R.; Layeghi, M.; Sharifian, S.; Behravesh, H. Investigating the performance of cellulosic evaporative cooling pads. Energy Convers. Manag. 2011, 52, 2598–2603. [Google Scholar] [CrossRef]
- Harby, K.; Al-Amri, F. An investigation on energy savings of a split air-conditioning using different commercial cooling pad thicknesses and climatic conditions. Energy 2019, 182, 321–336. [Google Scholar] [CrossRef]
- Wang, J.; Meng, Q.; Zhang, L.; Zhang, Y.; He, B.-J.; Zheng, S.; Santamouris, M. Impacts of the water absorption capability on the evaporative cooling effect of pervious paving materials. Build. Environ. 2019, 151, 187–197. [Google Scholar] [CrossRef]
- Sharma, A.K.; Bishnoi, P. Development and testing of natural draught desert cooler. Int. J. Sci. Eng. Appl. 2013, 2, 19–22. [Google Scholar] [CrossRef]
- Elhelw, M. Performance evaluation for solar liquid desiccant air dehumidification system. Alex. Eng. J. 2016, 55, 933–940. [Google Scholar] [CrossRef] [Green Version]
- Jaradat, M.; Fleig, D.; Vajen, K.; Jordan, U. Investigations of a Dehumidifier in a Solar-Assisted Liquid Desiccant Demonstration Plant. J. Sol. Energy Eng. 2018, 141, 031001. [Google Scholar] [CrossRef]
- Öberg, V.; Goswami, D.Y. Experimental Study of the Heat and Mass Transfer in a Packed Bed Liquid Desiccant Air Dehumidifier. J. Sol. Energy Eng. 1998, 120, 289. [Google Scholar] [CrossRef]
- Lowenstein, A. Review of Liquid Desiccant Technology for HVAC Applications. HVAC&R Res. 2008, 14, 819–839. [Google Scholar] [CrossRef]
- Kessling, W.; Laevemann, E.; Peltzer, M. Energy storage in open cycle liquid desiccant cooling systems. Int. J. Refrig. 1998, 21, 150–156. [Google Scholar] [CrossRef]
- Yu, N.; Wang, R.Z.; Wang, L.W. Sorption thermal storage for solar energy. Prog. Energy Combust. Sci. 2013, 39, 489–514. [Google Scholar] [CrossRef]
- Kabeel, A.E.; Khalil, A.; Elsayed, S.S.; Alatyar, A.M. Theoretical investigation on energy storage characteristics of a solar liquid desiccant air conditioning system in Egypt. Energy 2018, 158, 164–180. [Google Scholar] [CrossRef]
- Jaradat, M. Construction and Analysis of Heat-and Mass Exchangers for Liquid Desiccant Systems. Ph.D. Thesis, Universität Kassel, Kassel, Germany, 2016. [Google Scholar]
- Rafique, M.M.; Gandhidasan, P.; Bahaidarah, H.M.S. Liquid desiccant materials and dehumidifiers—A review. Renew. Sustain. Energy Rev. 2016, 56, 179–195. [Google Scholar] [CrossRef]
- Park, J.-Y.; Yoon, D.-S.; Li, S.; Park, J.; Bang, J.-I.; Sung, M.; Jeong, J.-W. Empirical analysis of indoor air quality enhancement potential in a liquid-desiccant assisted air conditioning system. Build. Environ. 2017, 121, 11–25. [Google Scholar] [CrossRef]
- Al-Farayedhi, A.A.; Gandhidasan, P.; Al-Mutairi, M.A. Evaluation of heat and mass transfer coefficients in a gauze-type structured packing air dehumidifier operating with liquid desiccant. Int. J. Refrig. 2002, 25, 330–339. [Google Scholar] [CrossRef]
- Abdul-Wahab, S.A.; Zurigat, Y.H.; Abu-Arabi, M.K. Predictions of moisture removal rate and dehumidification effectiveness for structured liquid desiccant air dehumidifier. Energy 2004, 29, 19–34. [Google Scholar] [CrossRef]
- Elsarrag, E. Performance study on a structured packed liquid desiccant regenerator. Sol. Energy 2006, 80, 1624–1631. [Google Scholar] [CrossRef]
- ASHRAE. Handbook—Fundamentals; Chapter 6: Psychrometrics; American Society of Heating, Refrigerating and Air-Conditioning Engineers: Atlanta, GA, USA, 1997. [Google Scholar]
- Conde, M.R. Properties of aqueous solutions of lithium and calcium chlorides: Formulations for use in air conditioning equipment design. Int. J. Therm. Sci. 2004, 43, 367–382. [Google Scholar] [CrossRef]
- Stevens, D.I.; Braun, J.E.; Klein, S.A. An effectiveness model of liquid-desiccant system heat/mass exchangers. Sol. Energy 1989, 42, 449–455. [Google Scholar] [CrossRef]
- Baehr, H.D.; Stephan, K. Heat and Mass Transfer, 3rd ed.; Springer-Verlag: Berlin, Germany, 2011. [Google Scholar]
- ASHRAE. Handbook—Fundamentals; Chapter 8: Thermal Comfort; American Society of Heating, Refrigerating and Air-Conditioning Engineers: Atlanta, GA, USA, 1997. [Google Scholar]


| Instrument | Model | Uncertainty | Range of Operation |
|---|---|---|---|
| Air temperature | Hygroflex 420 | 0.5 K | −50–100 °C |
| Relative humidity | Hygroflex 420 | 2% | 0%–100% |
| Air volume flow rate | Optiswirl 4070 DN 150 | 3% | 370–4800 m3/h |
| Solution temperature | Pt100 | 0.5 K | |
| Solution volume flow rate | Optiflux 1050 | 1% | 20–3900 L/h |
| Solution density | L-Dens 323 | 1 g/cm3 | 0.5–2 g/cm3 |
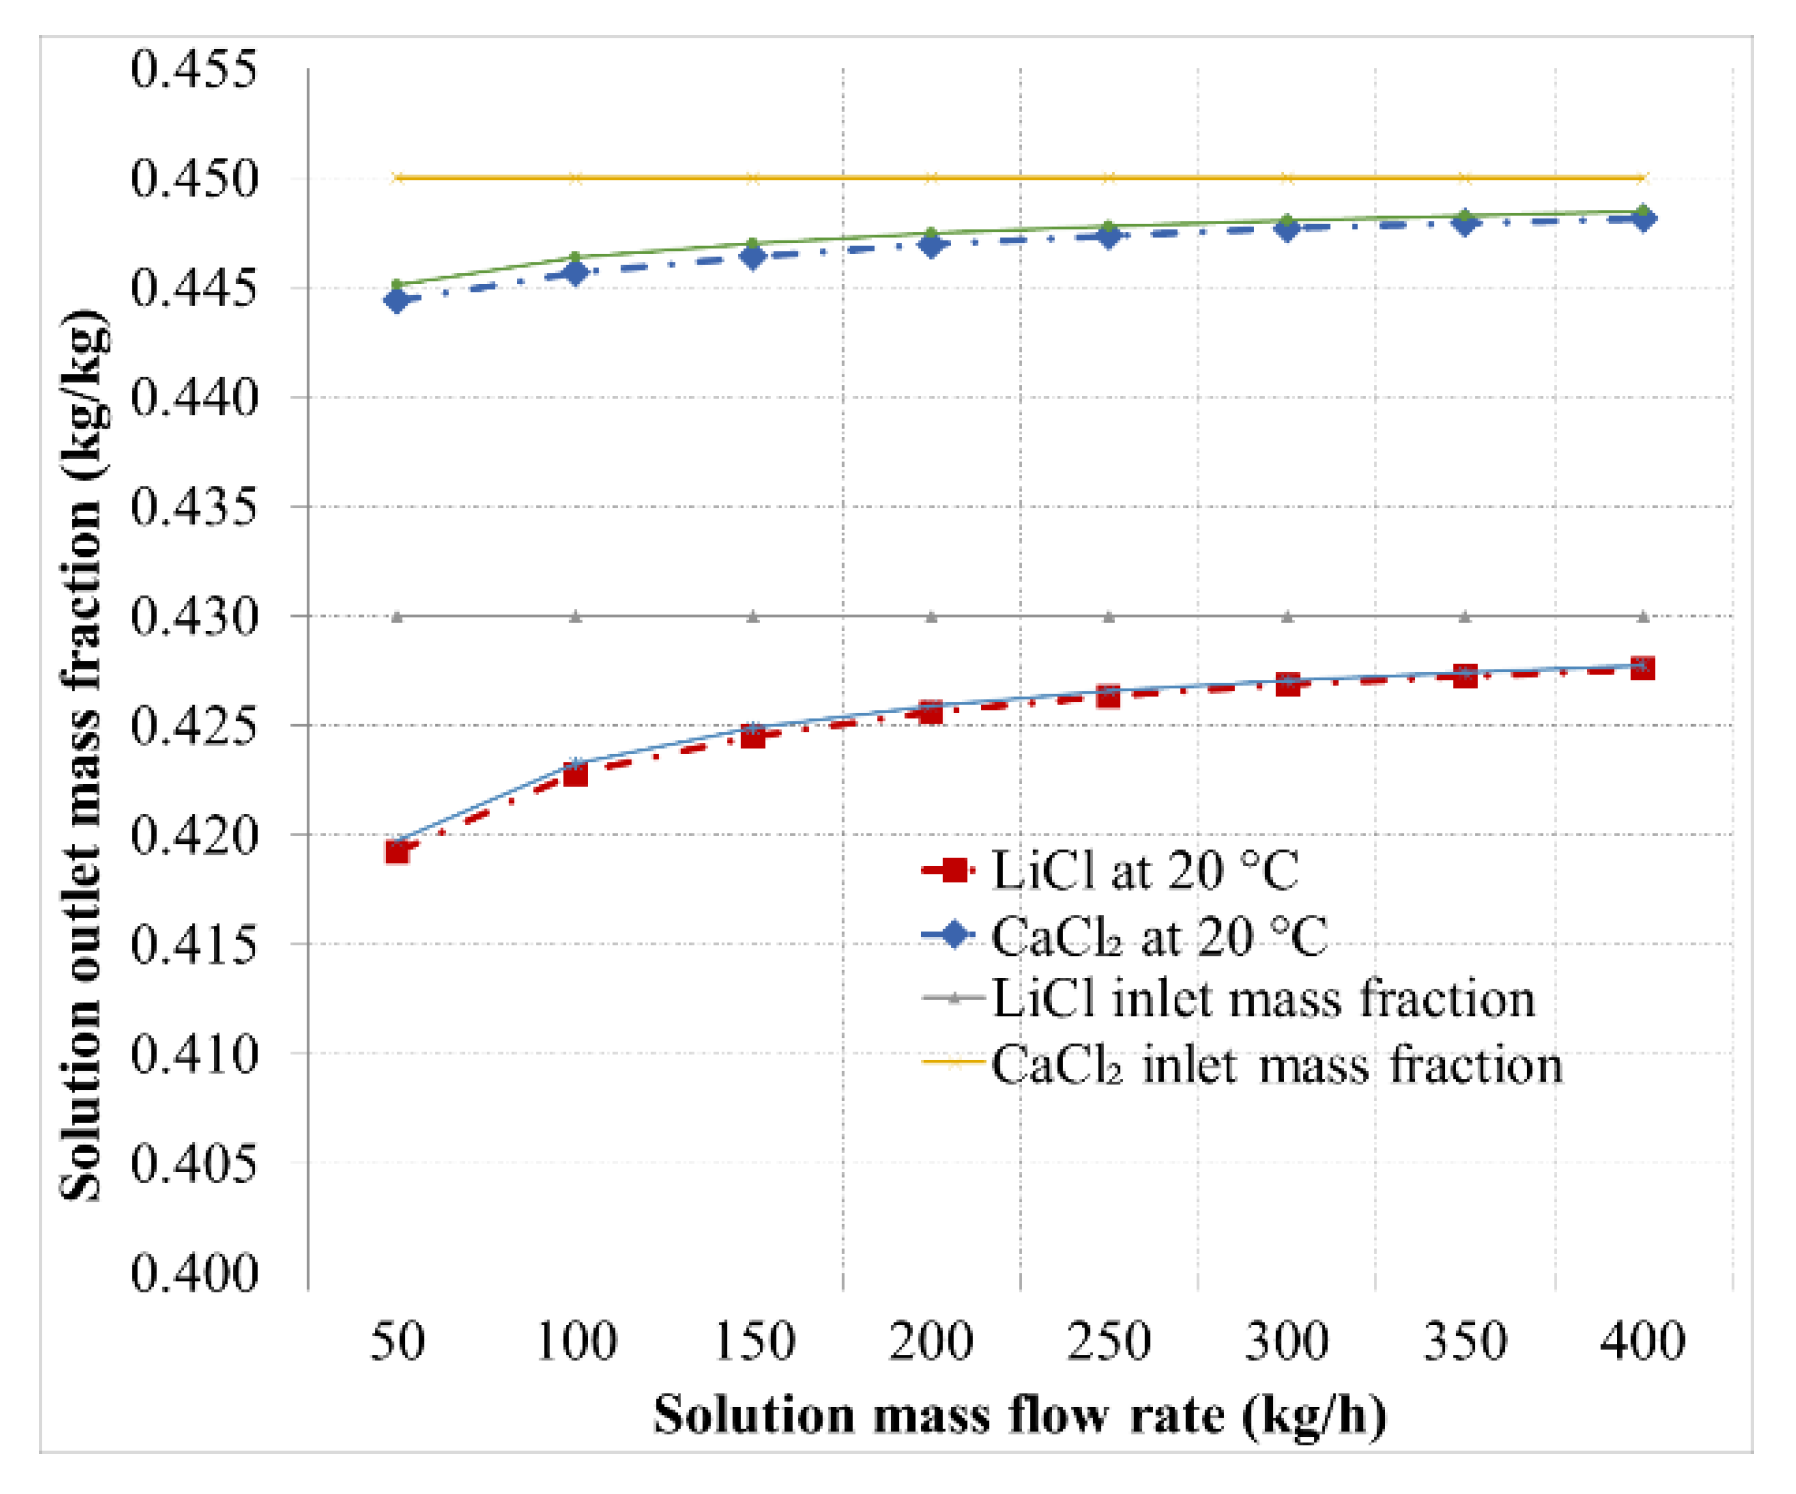
| 50–400 | 400 | 32 | 13.12 | 20–24 | 0.43 | 0.45 |
| ° | |||||
|---|---|---|---|---|---|
| 400 | 32.0 | 13.12 | 24.7 | 16.07 | 0.68 |
| Air Outlet Conditions Using LiCl-H2O as Desiccant | Air Outlet Conditions Using CaCl2-H2O as Desiccant | |||||||
|---|---|---|---|---|---|---|---|---|
| Exp. | ||||||||
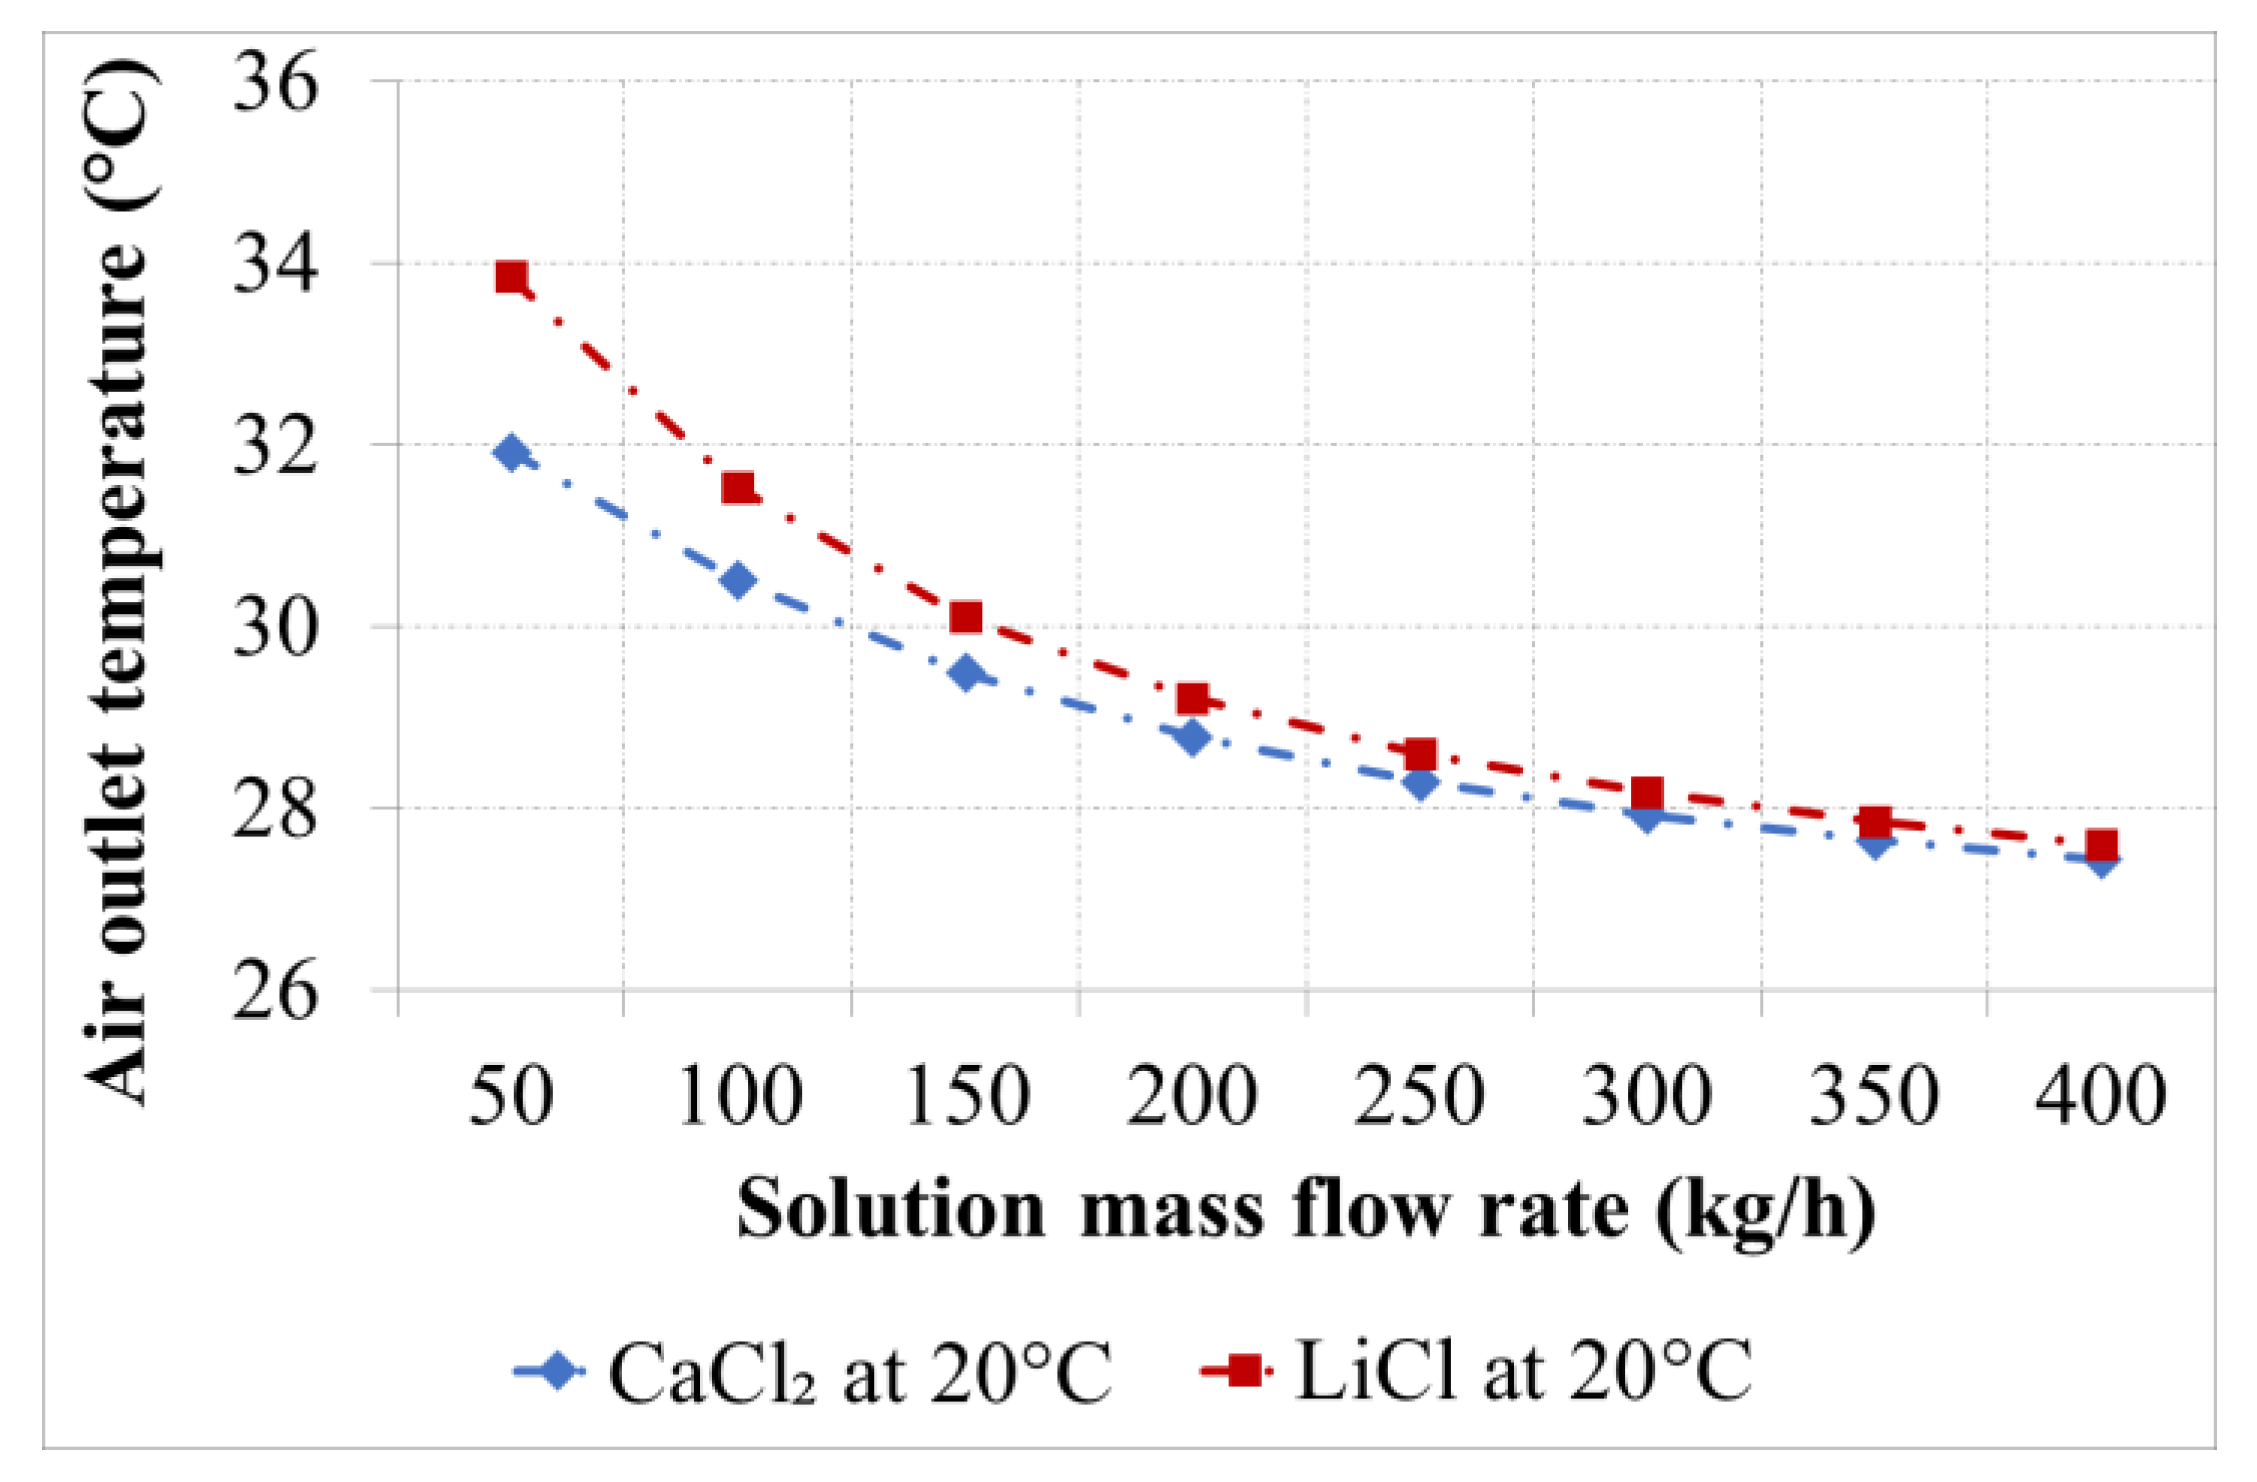
| 1 | 33.8 | 9.87 | 59.4 | 0.71 | 31.9 | 11.53 | 61.6 | 0.46 |
| 2 | 31.5 | 8.81 | 54.3 | 1.27 | 30.5 | 10.67 | 58.0 | 0.86 |
| 3 | 30.1 | 8.22 | 51.3 | 1.60 | 29.5 | 10.07 | 55.4 | 1.15 |
| 4 | 29.2 | 7.89 | 49.5 | 1.80 | 28.8 | 9.67 | 53.7 | 1.34 |
| 5 | 28.6 | 7.68 | 48.4 | 1.93 | 28.3 | 9.41 | 52.5 | 1.47 |
| 6 | 28.2 | 7.54 | 47.6 | 2.02 | 27.9 | 9.22 | 51.6 | 1.57 |
| 7 | 27.9 | 7.43 | 47.0 | 2.08 | 27.6 | 9.07 | 51.0 | 1.64 |
| 8 | 27.6 | 7.36 | 46.6 | 2.13 | 27.4 | 8.97 | 50.5 | 1.70 |
© 2019 by the authors. Licensee MDPI, Basel, Switzerland. This article is an open access article distributed under the terms and conditions of the Creative Commons Attribution (CC BY) license (http://creativecommons.org/licenses/by/4.0/).
Share and Cite
Jaradat, M.; Al-Addous, M.; Albatayneh, A. Adaption of an Evaporative Desert Cooler into a Liquid Desiccant Air Conditioner: Experimental and Numerical Analysis. Atmosphere 2020, 11, 40. https://doi.org/10.3390/atmos11010040
Jaradat M, Al-Addous M, Albatayneh A. Adaption of an Evaporative Desert Cooler into a Liquid Desiccant Air Conditioner: Experimental and Numerical Analysis. Atmosphere. 2020; 11(1):40. https://doi.org/10.3390/atmos11010040
Chicago/Turabian StyleJaradat, Mustafa, Mohammad Al-Addous, and Aiman Albatayneh. 2020. "Adaption of an Evaporative Desert Cooler into a Liquid Desiccant Air Conditioner: Experimental and Numerical Analysis" Atmosphere 11, no. 1: 40. https://doi.org/10.3390/atmos11010040