Article

Analysis of NOx Pollution Characteristics in the Atmospheric Environment in Changchun City

College of New Energy and Environment, Jilin University, Changchun 130012, China
*
Author to whom correspondence should be addressed.
Atmosphere 2020, 11(1), 30; https://doi.org/10.3390/atmos11010030
Submission received: 2 December 2019 / Revised: 21 December 2019 / Accepted: 25 December 2019 / Published: 27 December 2019
(This article belongs to the Section Air Quality)

Abstract

:
Nitrogen oxide (NOx) pollution has become one of the most challenging problems in China in the past 20 years. In this study, on the basis of the Jilin Province Atmospheric Environmental Quality Bulletin and hourly NOx data from the Atmospheric Environment Automatic Monitoring Station in Changchun, temporal and spatial variations in NOx concentration in the province and Changchun and their relationships with various pollutants and meteorological factors were analyzed. The results show that Changchun had the highest NOx concentration of all cities in the province, with a high concentration in the center and a low concentration in the east and west. The areas with high NOx concentrations in Changchun were mainly distributed in urban centers, and the concentration in the northern part of the city was higher than that in the south. The seasonal variation and average daily variation in NOx concentration in Changchun had a bimodal distribution, and the NOx concentration in autumn and winter was higher than that in spring and summer. The maximum monthly average concentrations of NOx and nitric oxide (NO) were reached in October, and the maximum monthly average concentration of nitrogen dioxide (NO2) was reached in March. The average daily variation in NOx concentration first peaked at 07:00–08:00 in the morning, and the second peak occurred between 20:00 and 22:00 at night. The NOx concentration in Changchun was positively correlated with NO2, NO, PM2.5 (fine particulate matter), PM10 (particulate matters), CO (carbon monoxide), and pressure, and it showed a significant negative correlation with O3, temperature, wind speed, and humidity.

1. Introduction

Among various air pollutants, Nitrogen oxide (NOx) emissions have the closest relationship with the human use of fossil energy. In the past 20 years, the growth rate of NOx emissions in China has been the largest compared with other pollutants [1]. With the continuous development of China’s economy and the continuous consumption of various mineral resources, the levels of secondary pollutants, such as particulate matter (PM10), ozone (O3), and nitrogen dioxide (NO2), have not significantly improved in metropolitan areas [2,3]. Studies have shown that NOx is a pollutant that has substantially contributed to regional atmospheric pollution and environmental quality, and it has played an important role in the formation of tropospheric O3, peroxyacetyl nitrate (PAN), and aerosols [4]. Nitrogen oxide emissions and detection concentrations have continually increased every year [5,6]. NOx includes compounds such as nitrous oxide (N2O), nitric oxide (NO), NO2, dinitrogen trioxide (N2O3), and dinitrogen tetroxide (N2O4). NO and NO2 are the main atmospheric NOx compounds that affect human health and the ecological environment, while the nitric acid and nitrate formed by the oxidation of NO2 (formed by the photo-oxidation of NO and hydrocarbons (HC) and O3) are the main sources of nitric acid rain [7]. NO can irritate the respiratory system; it can also bind to heme to form nitrosohemoglobin and is poisonous. NO2 can severely stimulate the respiratory system and result in heme nitration, and it is more environmentally harmful than NO because it forms acid rain pollution.
In the past, ground-based real-time monitoring [8], aerial survey [9], and satellite remote sensing have been used to study the temporal and spatial variation in NOx and other atmospheric pollutants on urban and larger spatial scales [10]. Studies have shown that the daily variation in NOx tends to be significantly bimodal. The NOx concentration has been found to be higher at night than during the day [11], but the time at which the maximum concentration occurred has differed among studies [11,12]. For example, Robert Cichowicz found that the maximum values appeared at different times between 08:00 and 09:00 in five neighboring provinces in central Poland, Central Europe [13]. Changes in concentrations of atmospheric pollutants such as NOx during special periods (such as during the Beijing Olympics) or during atmospheric pollution events might vary significantly [14]. Since 2013, there have been several serious air pollution events in Northeast China, and air pollution has been intensifying [15,16,17]. Thus, research on nitrogen oxides is crucial. The aim of this study was to analyze the characteristics and main causes of NOx concentration changes in Changchun. The analyzed data were obtained from the Jilin Province Atmospheric Environmental Quality Bulletin and NOx monitoring data in Changchun in 2018, as well as data on several other pollutants and meteorological factors.

2. Experiments

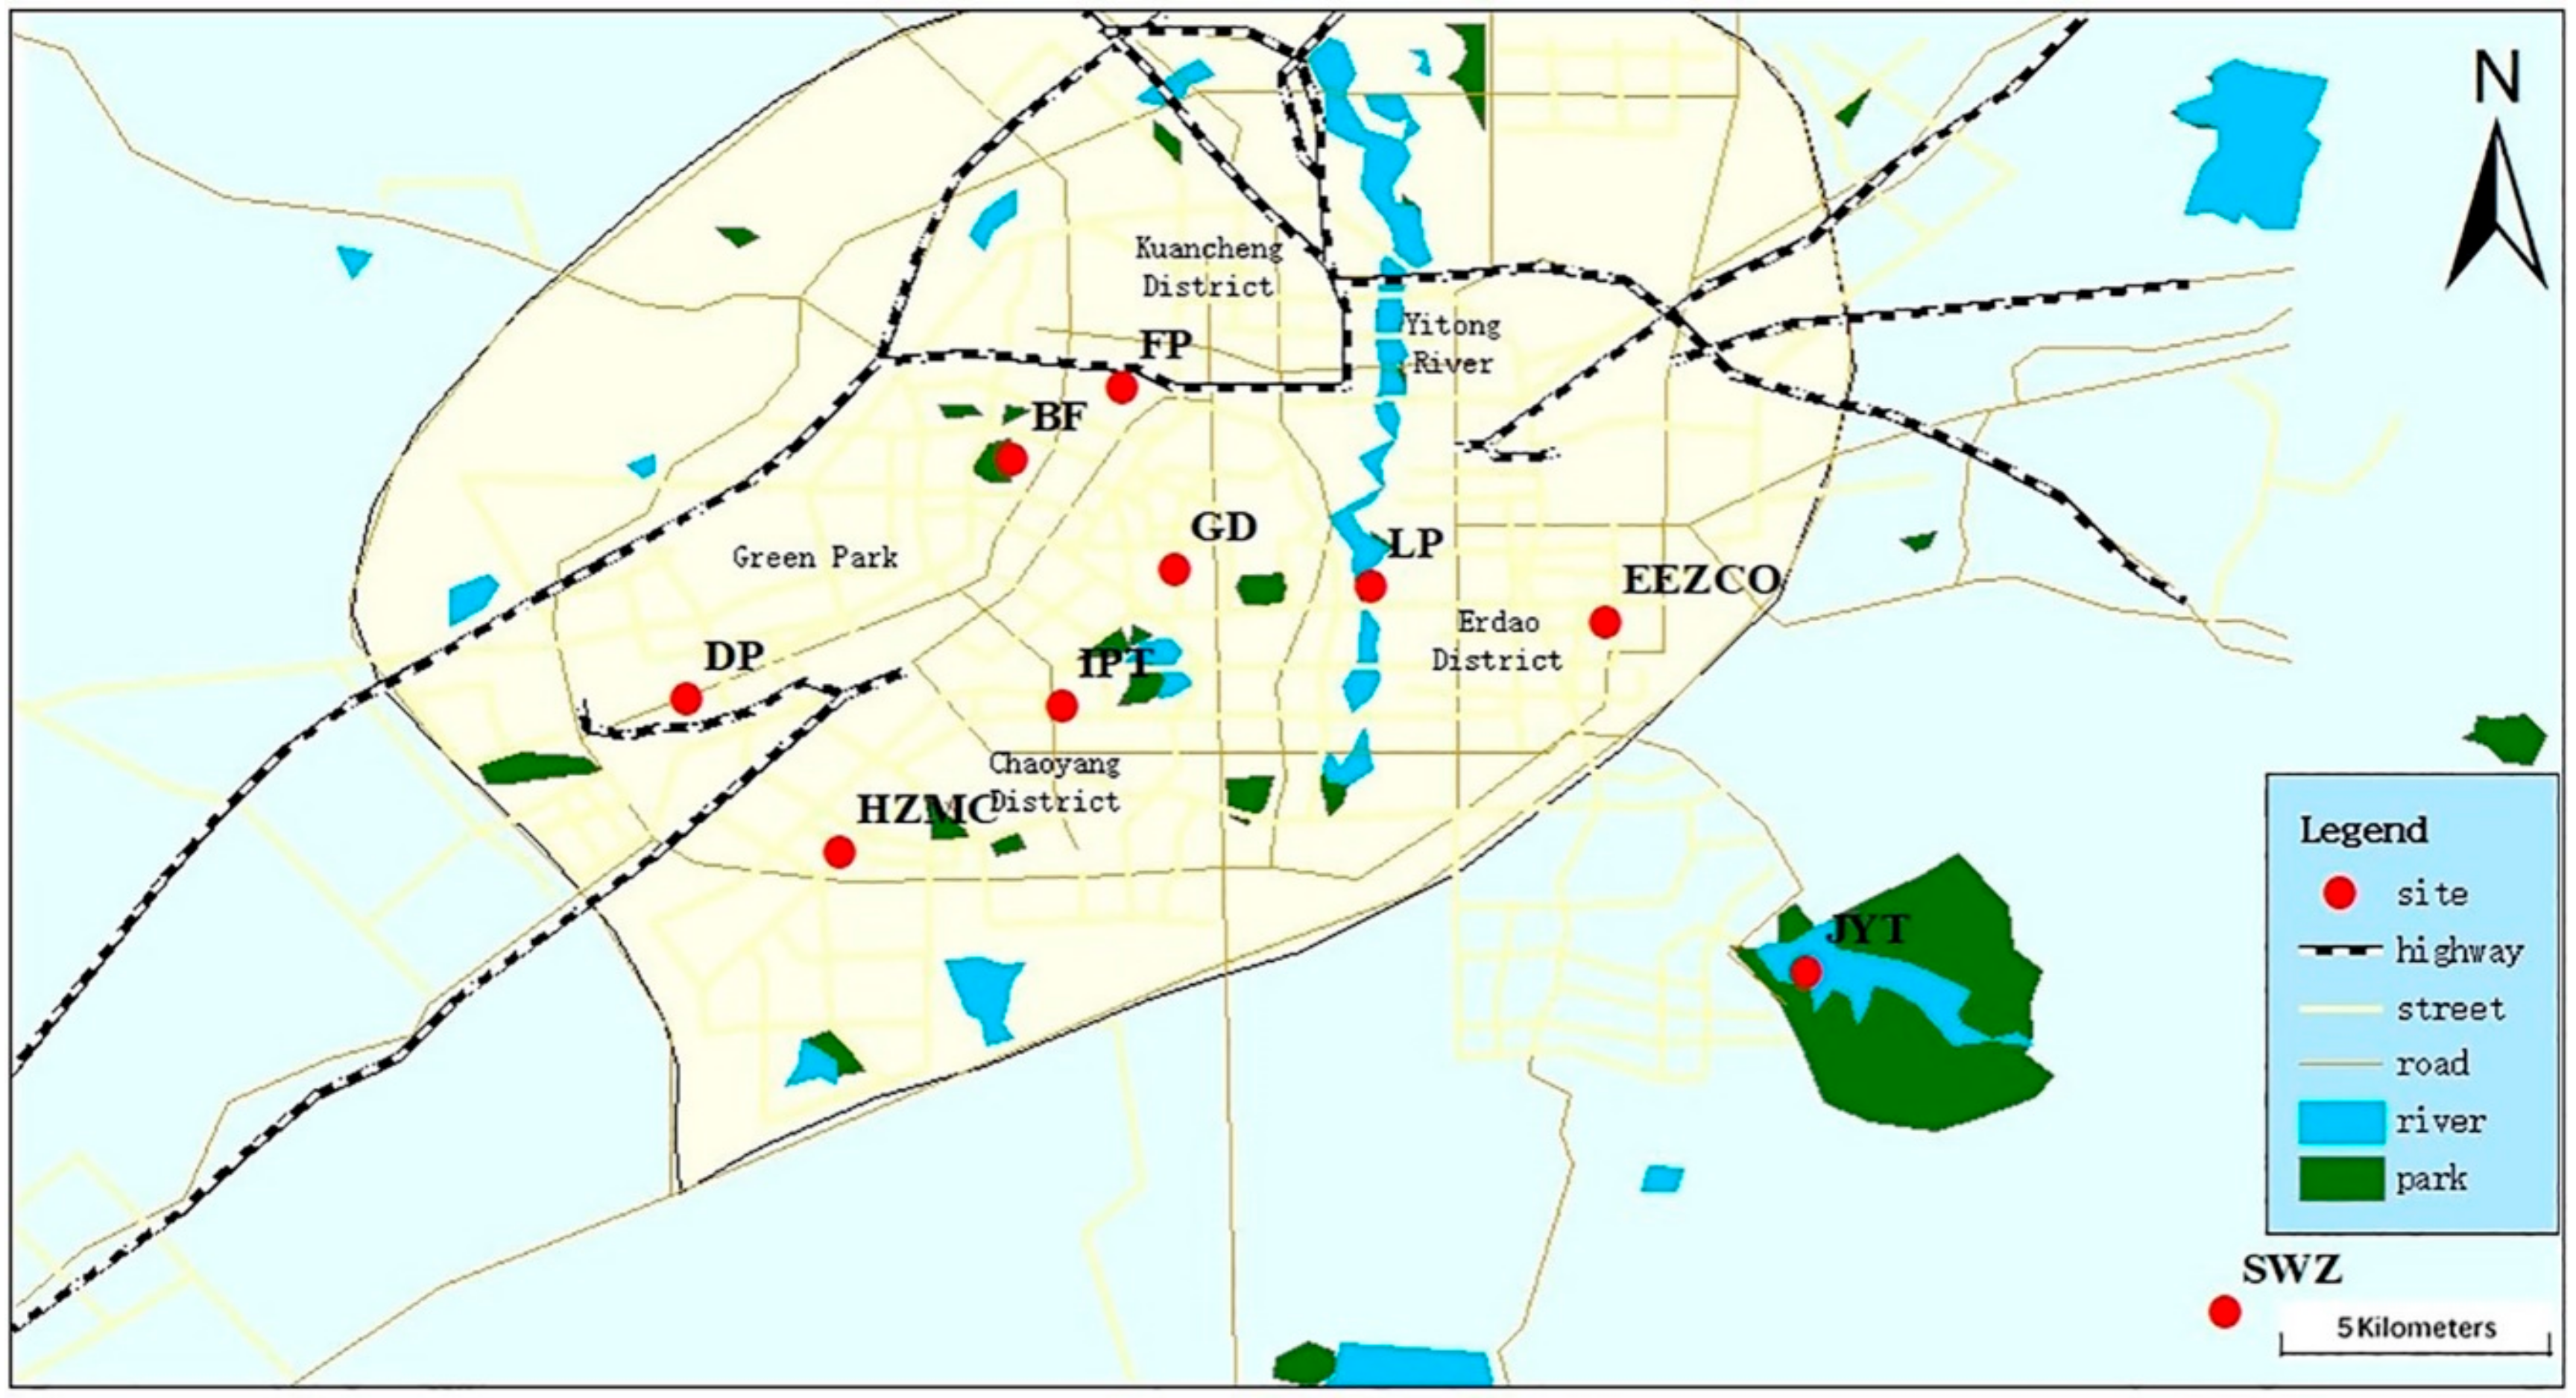
2.1. Research Area and Experimental Design

Jilin Province is located in the northeastern part of China at a longitude of 122–131° E and latitude of 41–46° N, with an area of 187,400 km2, accounting for 2% of the total area of the country. The altitude is high in the southeast, with predominantly mountainous hills, and low in the northwest. It is mainly a terraced plain and a central plain in the central and western regions. The cities of Jilin Province are Changchun, Jilin, Siping, Tonghua, Baishan, Liaoyuan, Baicheng, Songyuan, Yanbian Korean Autonomous Prefecture, and Changbai Mountain Administrative Committee. The provincial capital is Changchun, which is located in the hinterland of Songliao Plain in northeastern China. The urban area is 250–350 m above sea level and is located in the continental monsoon climate zone. The most frequent wind direction in summer is southeast. The wind speed in autumn is lower than that in spring. The dominant wind direction is southwest; the wind direction in winter is almost northwest.
The observations used in this study were collected from 10 automatic monitoring stations for the atmospheric environment in Changchun (Figure 1). NOx was also measured continuously using a NOx analyzer (Model 42i, Thermo Scientific, Waltham, MA, USA). This instrument analyzes the ambient air using the principle of chemiluminescence at an interval of 1 min. Ozone was also measured using an ultraviolet photometric ozone analyzer (Model 49i ozone analyzer, Thermo Scientific, Waltham, MA, USA), which was regularly calibrated using pure ozone and ozone-free air. Both instruments were regularly calibrated during the study period. In addition, CO was simultaneously measured directly by gas filter correlation analysis technology (Model 48i, Thermo Scientific, Waltham, MA, USA).
Since 2013, the Ministry of Environmental Protection has deployed 1497 state-controlled automatic monitoring stations for atmospheric environmental quality throughout the country, and they are starting to be put into operation. Among the 10 sites in Changchun, 9 are located in the built-up area of Changchun, namely, Daishan Park (DP), High-tech Zone Management Committee (HZMC), Economic Exploitation Zone Sanitation Office (EEZCO), Jingyuetan (JYT), Bus Factory (BF), Labor Park (LP), Food Plant (FP), Institute of Post and Telecommunications (IPT), and Garden Department (GD); a clean control site is located in Shuangyang District of Changchun, namely, Shuaiwanzi (SWZ). JYT and SWZ are first-class ambient air functional zones, while the remaining stations are second-class ambient air functional zones. The instruments and equipment of the automatic monitoring station for atmospheric environmental quality automatically collect samples and analyze and generate data every 15 min. Data are then automatically uploaded to the national and provincial environmental protection departments. Table S1 shows the details of the sites.

2.2. Meteorological Factors and Pollutant Information

In the continental monsoon climate, the seasonal division of Changchun in 2018 is in accordance with the meteorological industry standard “Climate Season Division” (QX/T152-2012). In Changchun, the annual difference is adjusted from April 17 to June 16 for the spring (61 days), June 17 to August 24 for the summer (69 days), August 25 to October 26 for the autumn (63 days), and October 27 to April 16 for the winter (172 days). Photochemical smog is formed by primary pollutants such as hydrocarbons (HC) and nitrogen oxides (NOx) discharged into the atmosphere from pollution sources such as automobiles and factories. In winter, because of the frequent occurrence of inversion, the high atmospheric stability causes pollutants to accumulate near the ground, producing a brown haze called photochemical smog [18,19]. In this study, all measured data were selected according to the “Regulations on Ambient Air Quality Monitoring”, and unreasonable values were removed to control the data quality. The calculation, statistical analysis, and evaluation of monitoring data of various pollutants were carried out in accordance with the Ambient Air Quality Standard (GB3095-2012) and the Technical Regulation for Ambient Air Quality Assessment (Trial) (HJ663-2013).

3. Results

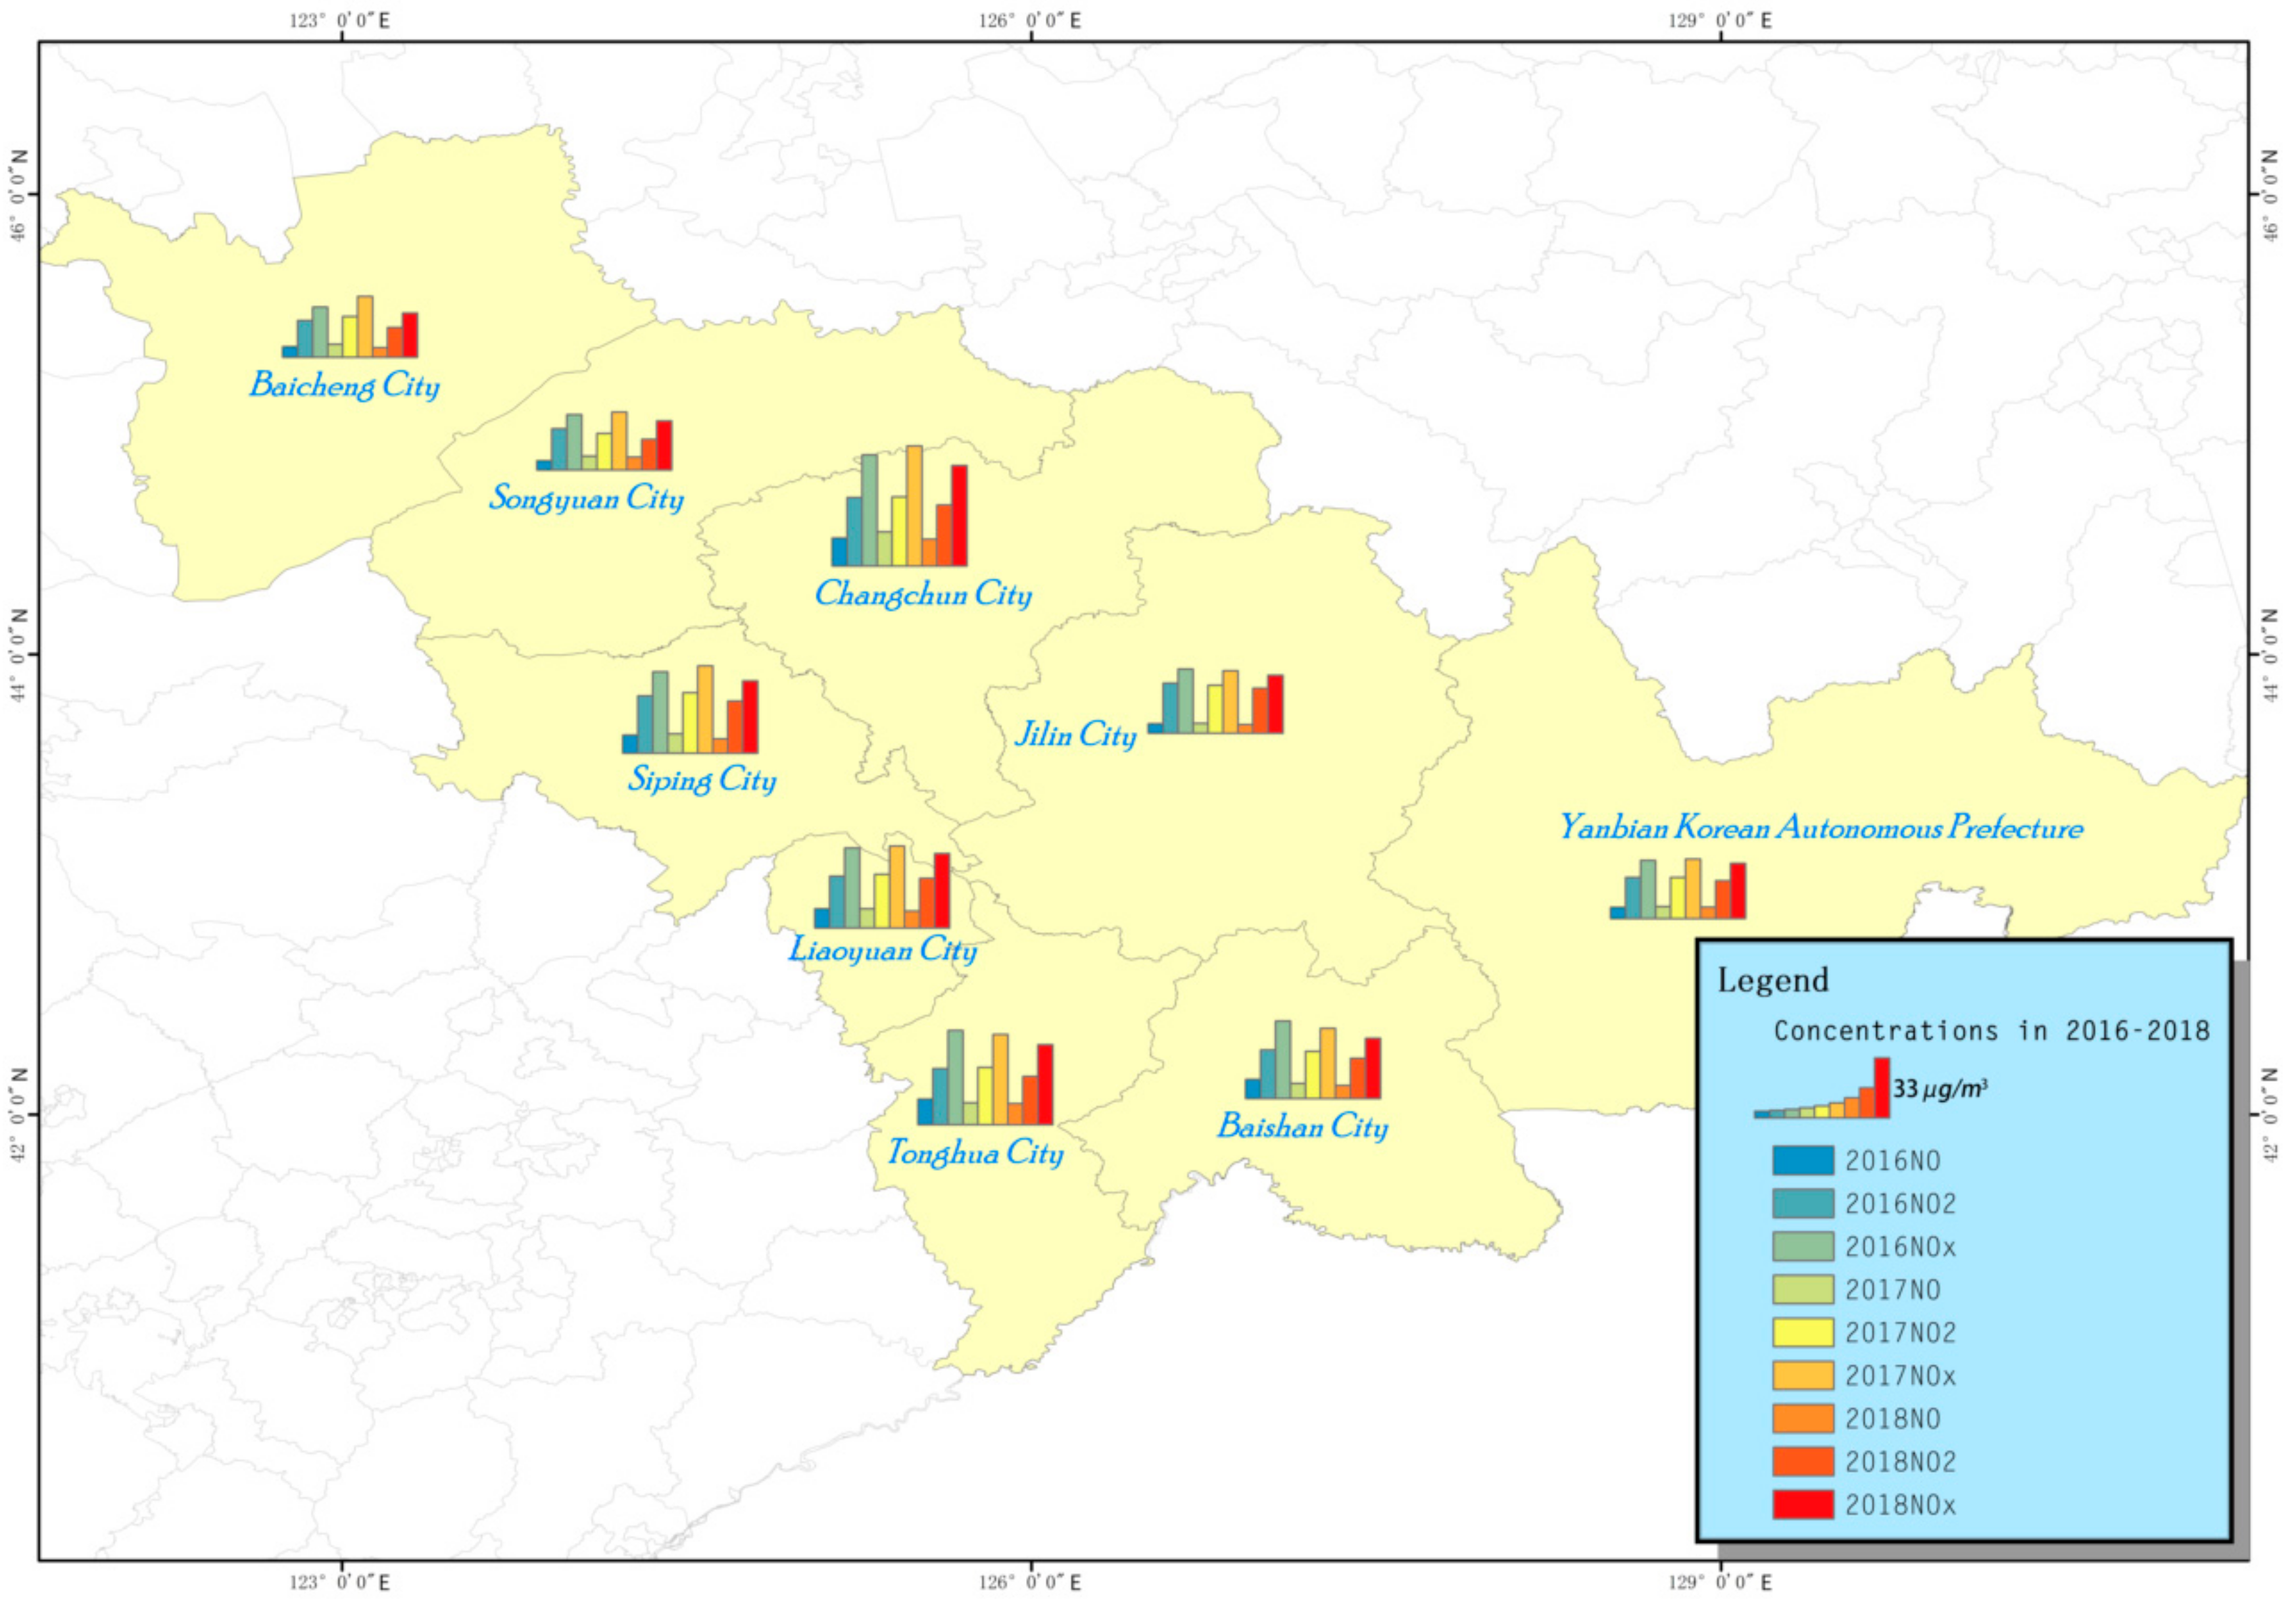
3.1. Analysis of the NOx Pollution Degree in the Whole Province

Kriging interpolation is a method based on the theoretical analysis of semi-variograms and the unbiased optimal estimation of variable values in finite regions [20]. Similar studies have applied this method to determine the spatial distribution of O3 and PM2.5 (fine particulate matter) [21,22]. The spatial distribution of NOx, NO2, and NO in Jilin Province (Figure 2) was suitable for Kriging interpolation. The high average annual NOx concentrations were mainly found in densely populated and relatively developed areas, such as Changchun, Tonghua, Liaoyuan, and Siping. In addition, high concentrations of NOx were found in high-volume areas. For example, a high NOx concentration was found in Baishan City, which is also rich in mineral resources, accounting for 73% of the minerals found in Jilin Province. In addition, Jiangyuan County and Badaojiang District in this city are among the 60 key coal-producing counties in China. The NOx concentration in the western and eastern mountainous areas of Jilin Province was low, which may be a result of the high vegetation coverage and low anthropogenic emissions in these regions. The province’s NOx concentration was high in the middle and low in the east and west.
The trends of NOx, NO2, and NO concentrations in the nine cities and states of Jilin Province were similar. The NO concentration fluctuated between 4.5 and 18.7 μg/m3 in 2016–2018. The NO2 concentration varied between 16 and 38 μg/m3 in 2016–2018, which did not exceed the national average secondary air standard (40 μg/m3). The NOx concentration varied between 24 and 66 μg/m3 in 2016–2018, and only Changchun exceeded the national average secondary air quality standard (50 μg/m3).

3.2. Trend Analysis of NOx Pollution in Changchun

For the pollutants studied in this work, Changchun had the highest annual average concentration, and it was used as a typical city for the analyses described in the following subsections.

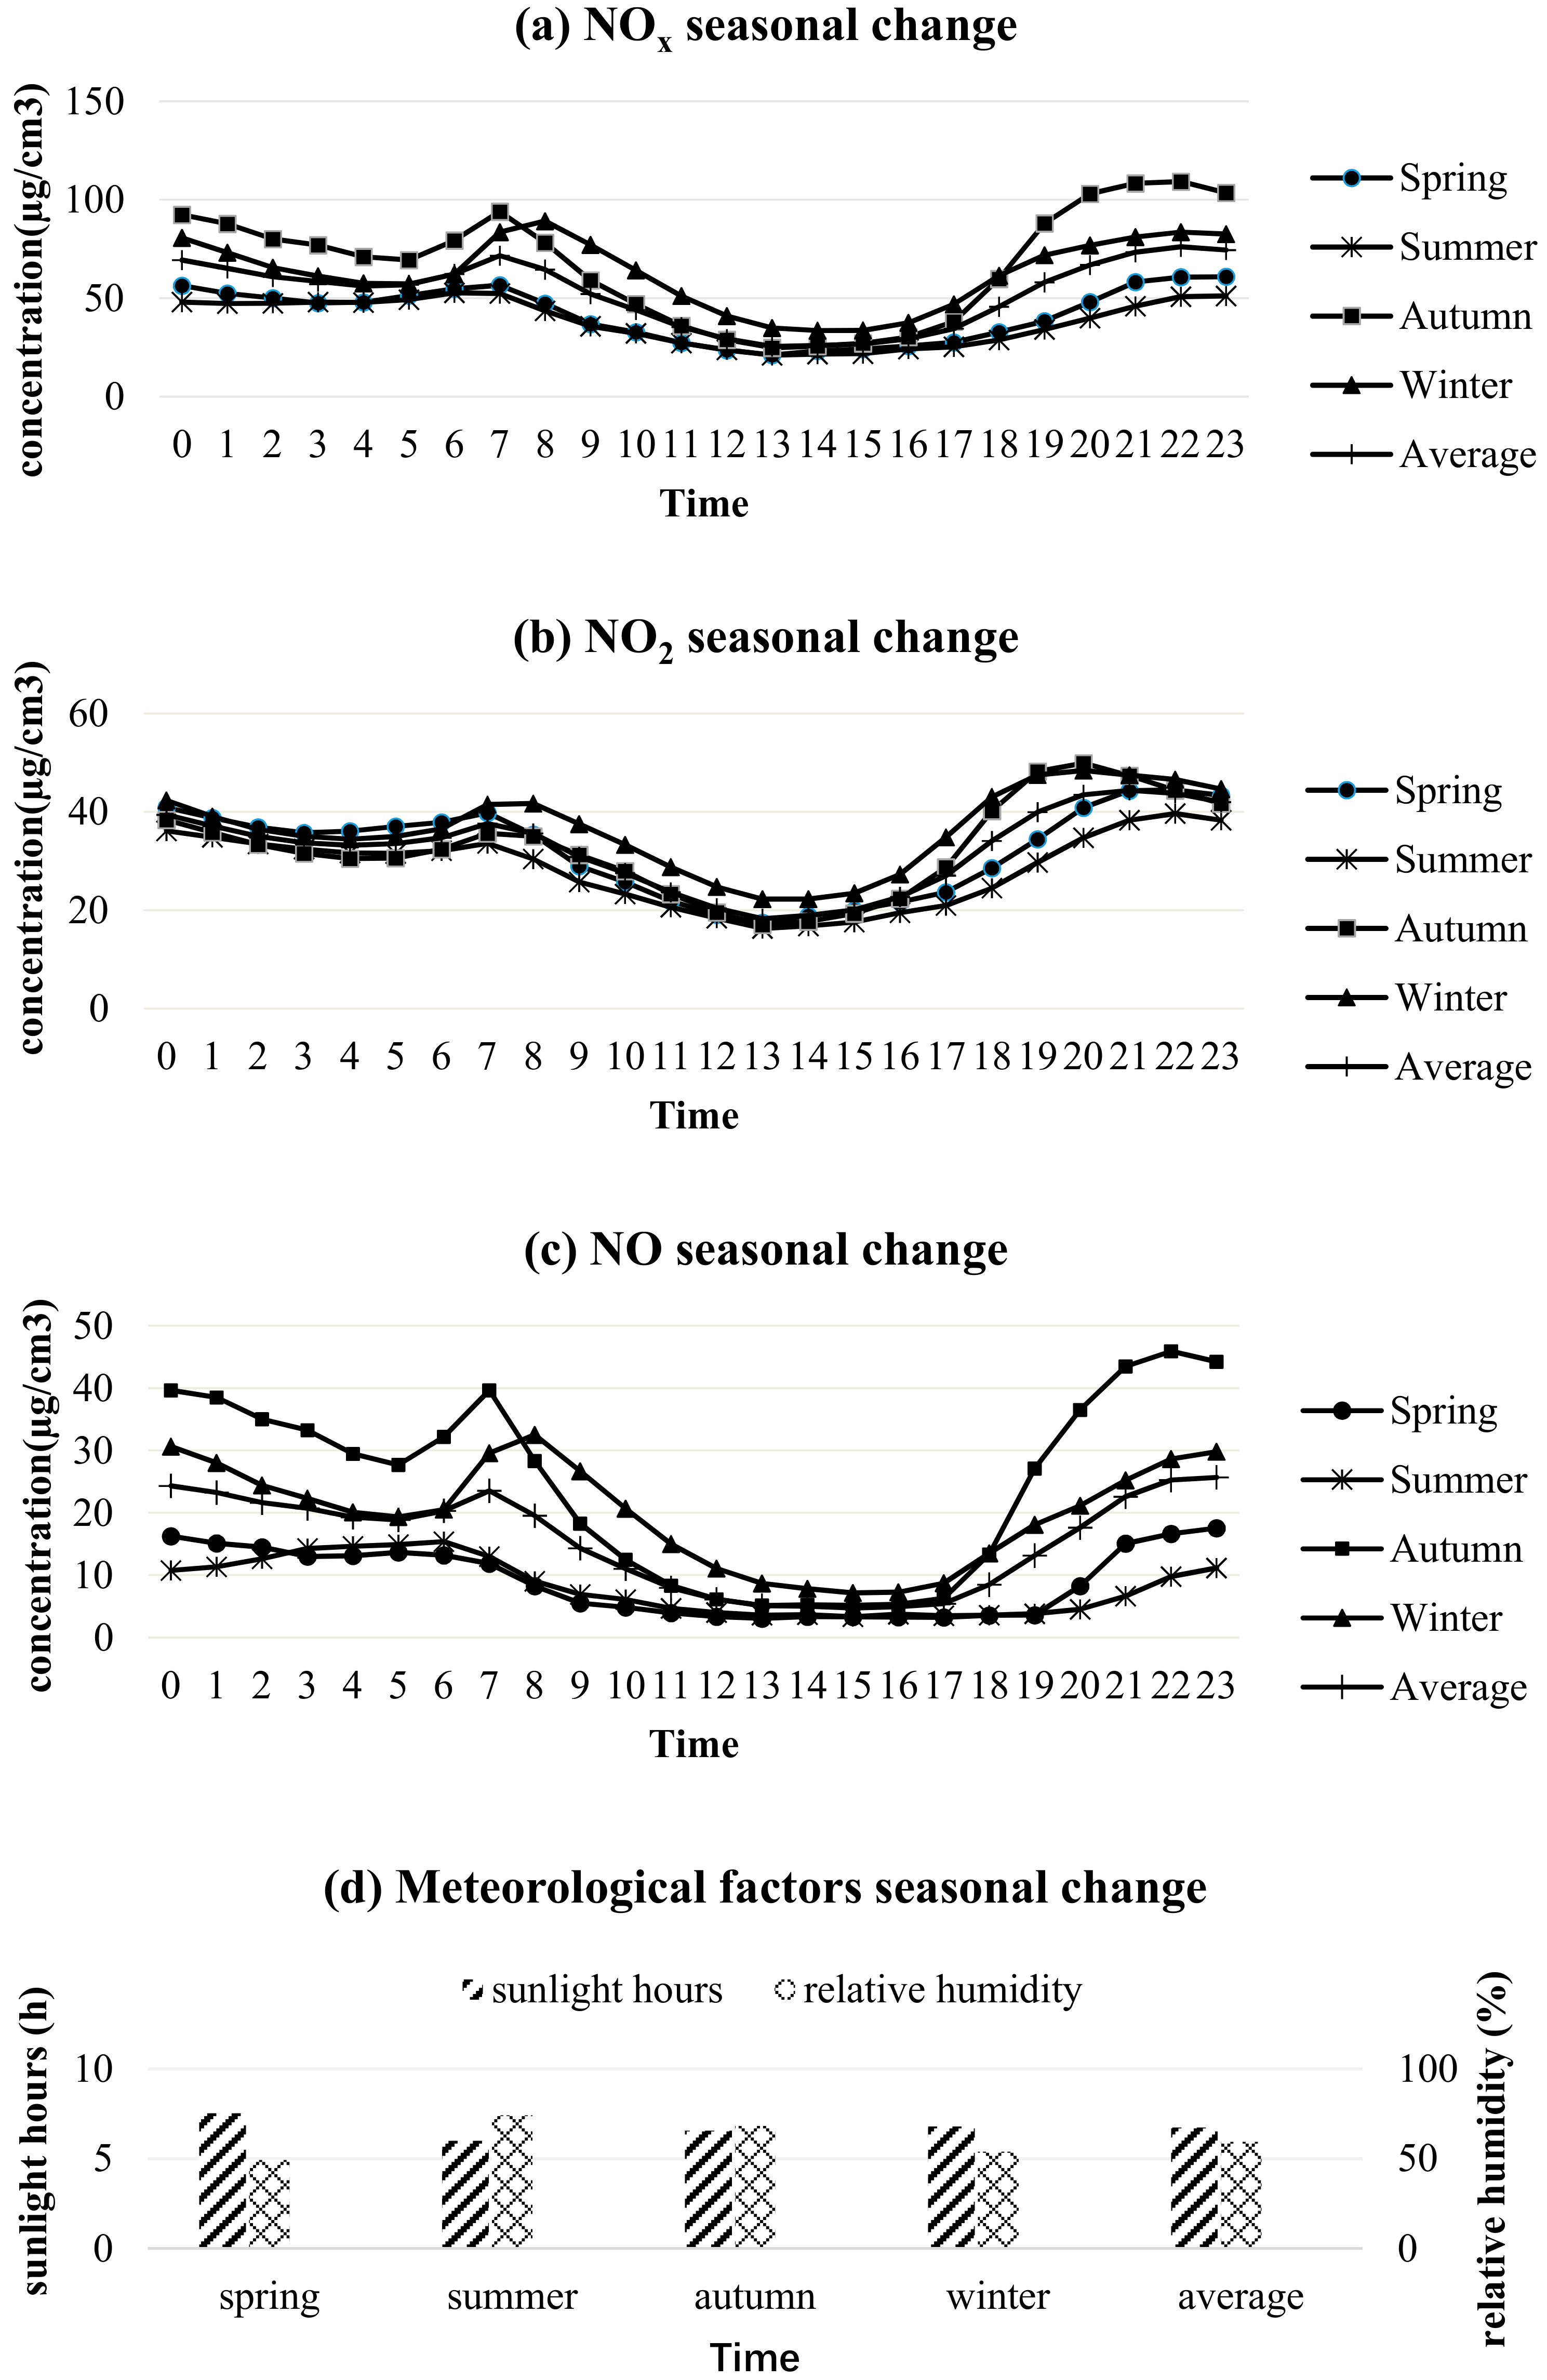
3.2.1. Seasonal Change Analysis

The seasonal variations in NOx, NO2, and NO average concentrations are shown in Figure 3. The seasonal patterns of NOx, NO2, and NO found in our study are consistent with those reported in other studies [23,24,25]. The concentrations of NOx, NO2, and NO were generally higher in autumn and winter, and the change in the concentration trend was related to meteorological conditions. On the one hand, the low temperature in winter and the long life of NO2 are not conducive to the conversion of NO2, so it gradually accumulates. On the other hand, it was also related to winter heating in Changchun. Changchun is a city in Northeast China, and its heating time is earlier and longer from autumn to winter. Heating increases the amount of coal used and increases the concentration of NO2. For example, the planetary boundary layer (PBL) height over the North China Plain is usually less than 500 m in winter [26], resulting in less efficient vertical transport of particles, as well as their mixing, to higher altitudes. The NO2 concentrations exhibited a large decrease from winter to summer. During the summer season, the atmospheric temperatures and humidity were relatively high, which are conditions that accelerate the oxidization of NO2 in the air [27]. In addition, Changchun features a seasonal monsoon climate with an uneven distribution of annual precipitation, and the frequent rainfall in the summer greatly reduces the concentration of NO2 in the atmosphere.

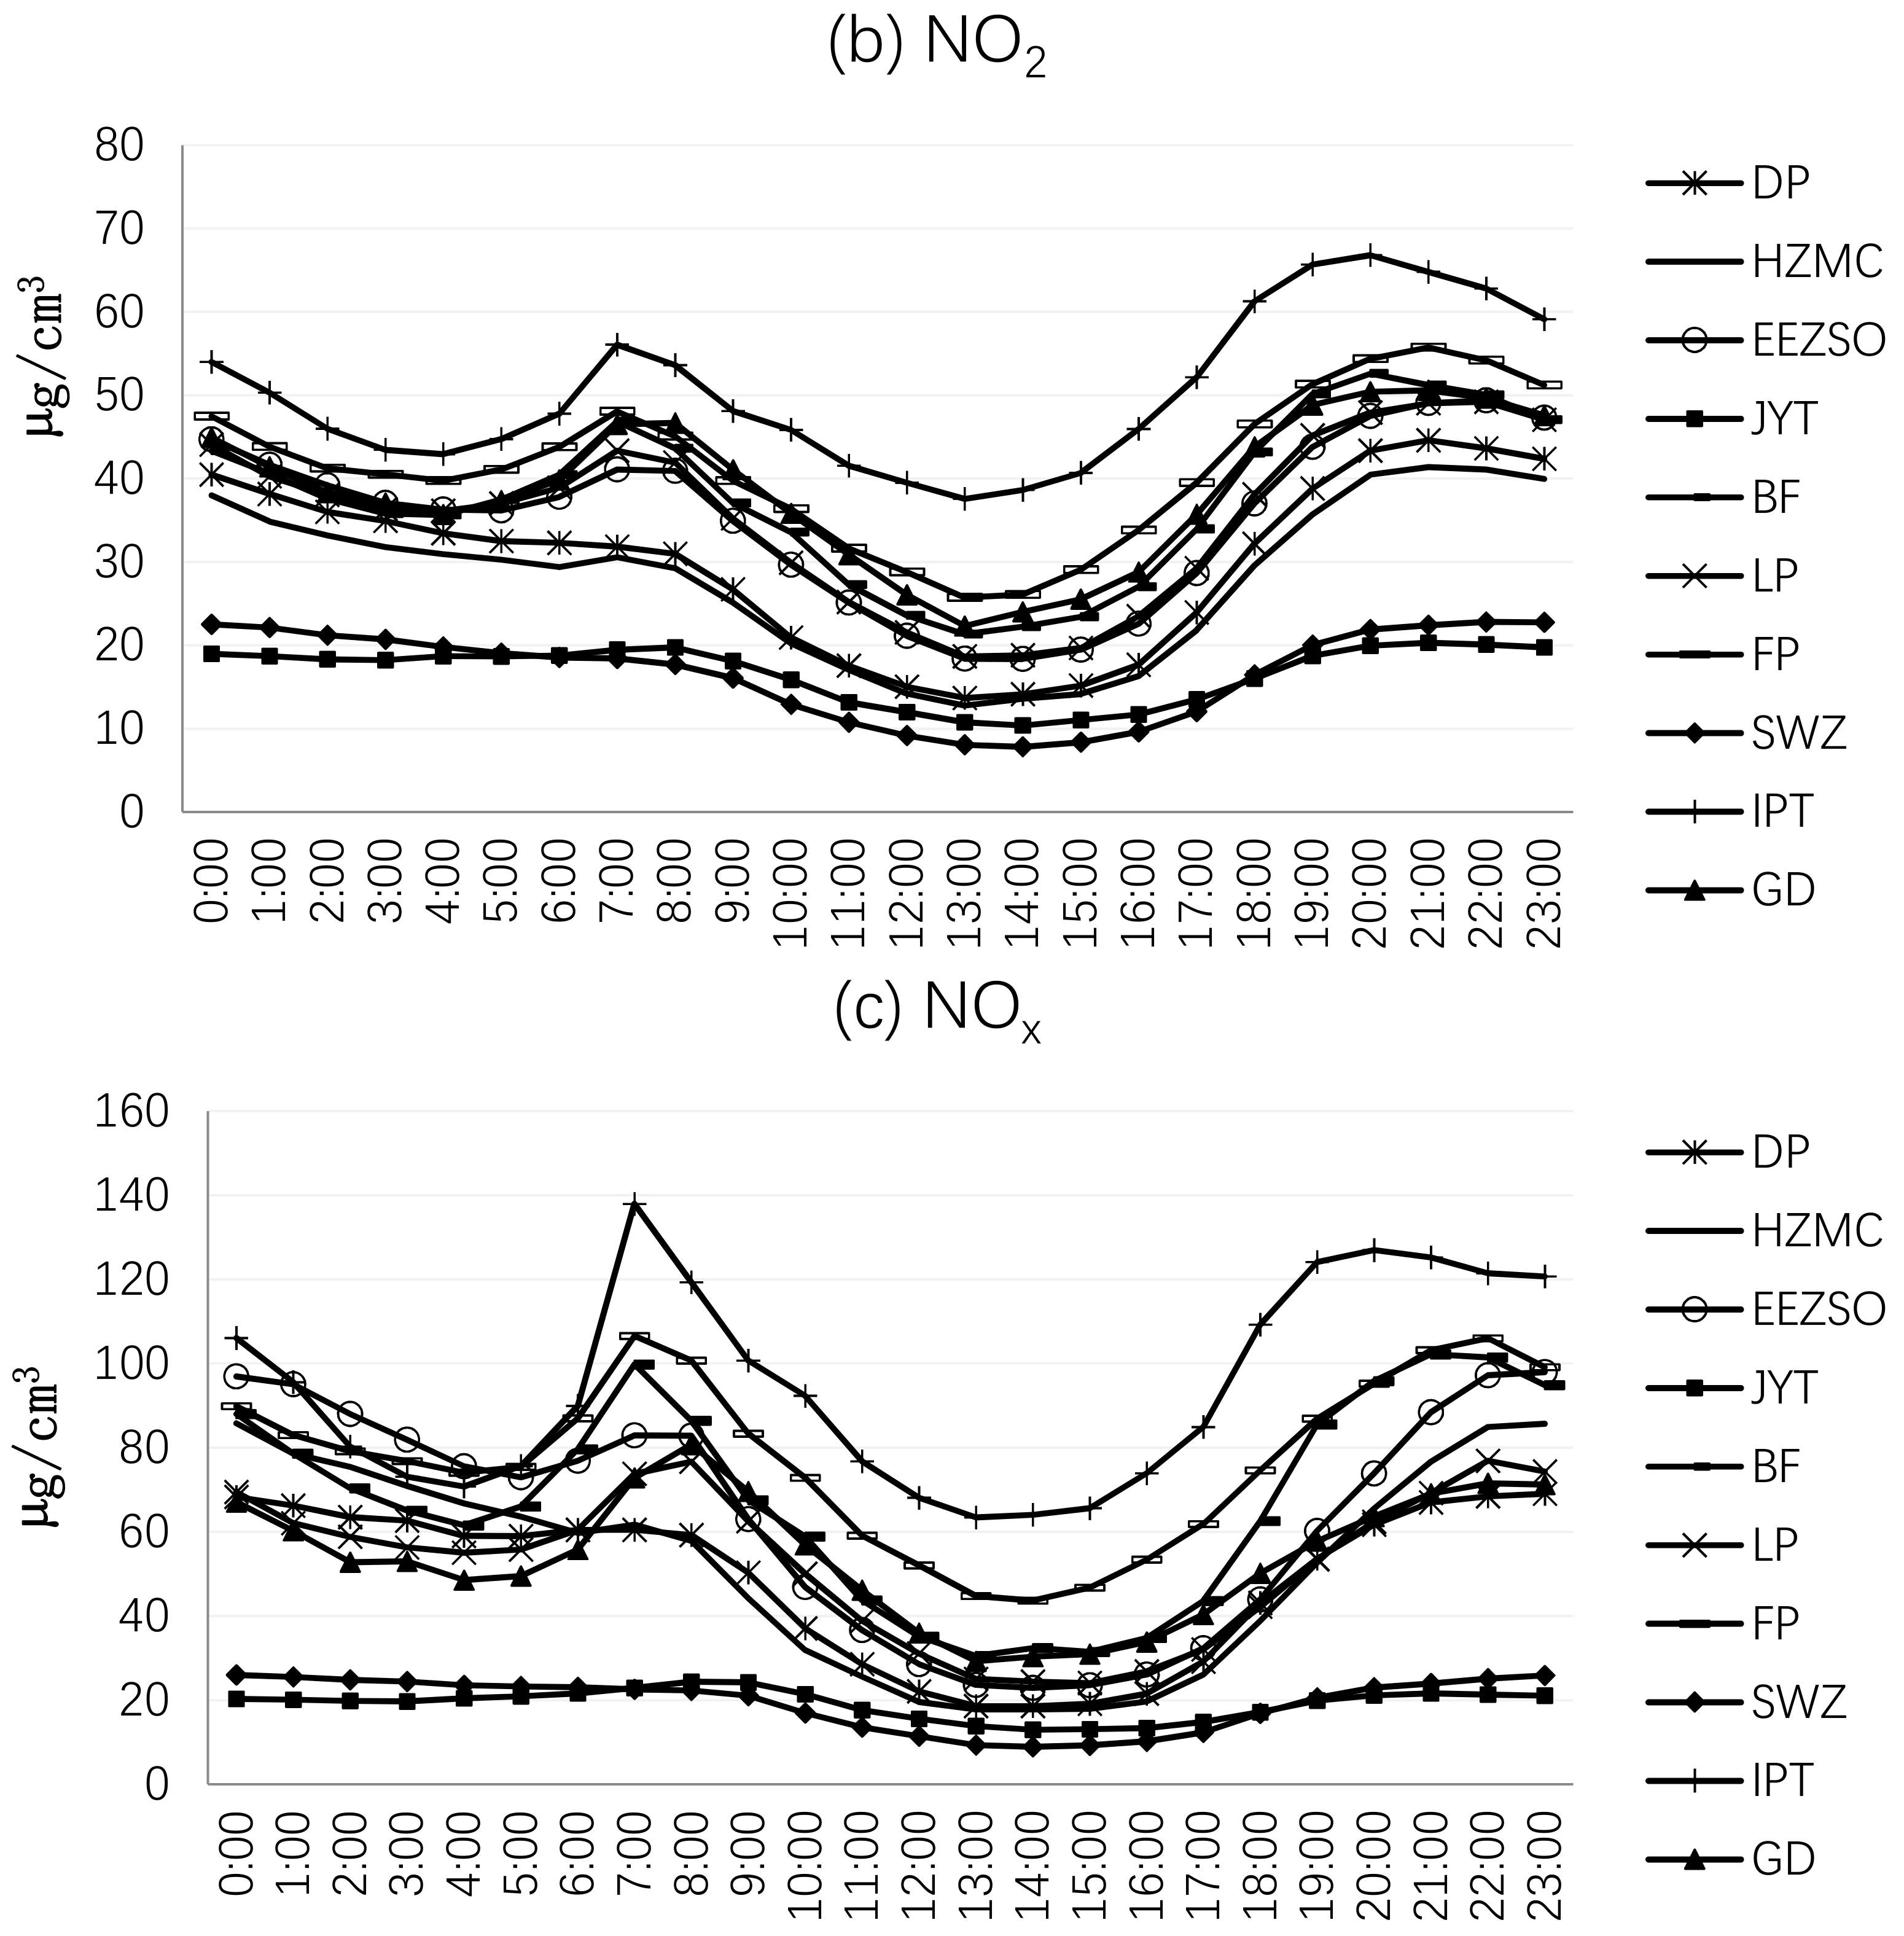
3.2.2. Daily Average Change Analysis

As shown in Figure 4, the daily average concentration of NOx, NO2, and NO in Changchun’s various stations had a bimodal distribution: the first peak appeared at 07:00–08:00 in the morning, and the second peak occurred between 20:00 and 22:00 at night. The second peak concentration of NOx and NO was significantly lower than the first peak; the nighttime peak might be related to higher emissions from diesel vehicles [28]. The lower nighttime peak might be a response to less congested traffic from the traffic rush being spread over 2 h, whereas in the morning, rush hour is shorter but more intense. The second peak concentration of NO2 was significantly higher than the first peak. The morning peak was consistent with the traffic peak. The peak of NO2 at night was higher than the peak in the morning; this is a result of a reaction between NO and O3 to form NO2 at night when the photolysis reaction of NO2 is stagnant, resulting in its gradual accumulation.
The current national standard GB 3095-2012 “Environmental Air Standard” does not list NO in the ambient air pollutant project, and therefore, the NO data cannot be compared to this standard. The daily average value of the second-level concentration limit of the NO2 second-class zone in the ambient air pollutant project was 80 μg/m3, and the NO2 concentration did not exceed this limit. The daily average concentration limit of the NOx secondary zone in the ambient air pollutant project was 100 μg/m3, and only individual sites (IPT, FP) had some outliers of NOx concentration that exceeded the limit at 07:00–08:00 in the morning and 18:00 at night. The concentration was consistently higher in the morning and consistent with the morning peak travel. The high concentration at night was dependent on the repeated oxidation of O3 during the day, indicating that the NOx emission and distribution phenomena were closely connected to O3 concentration.

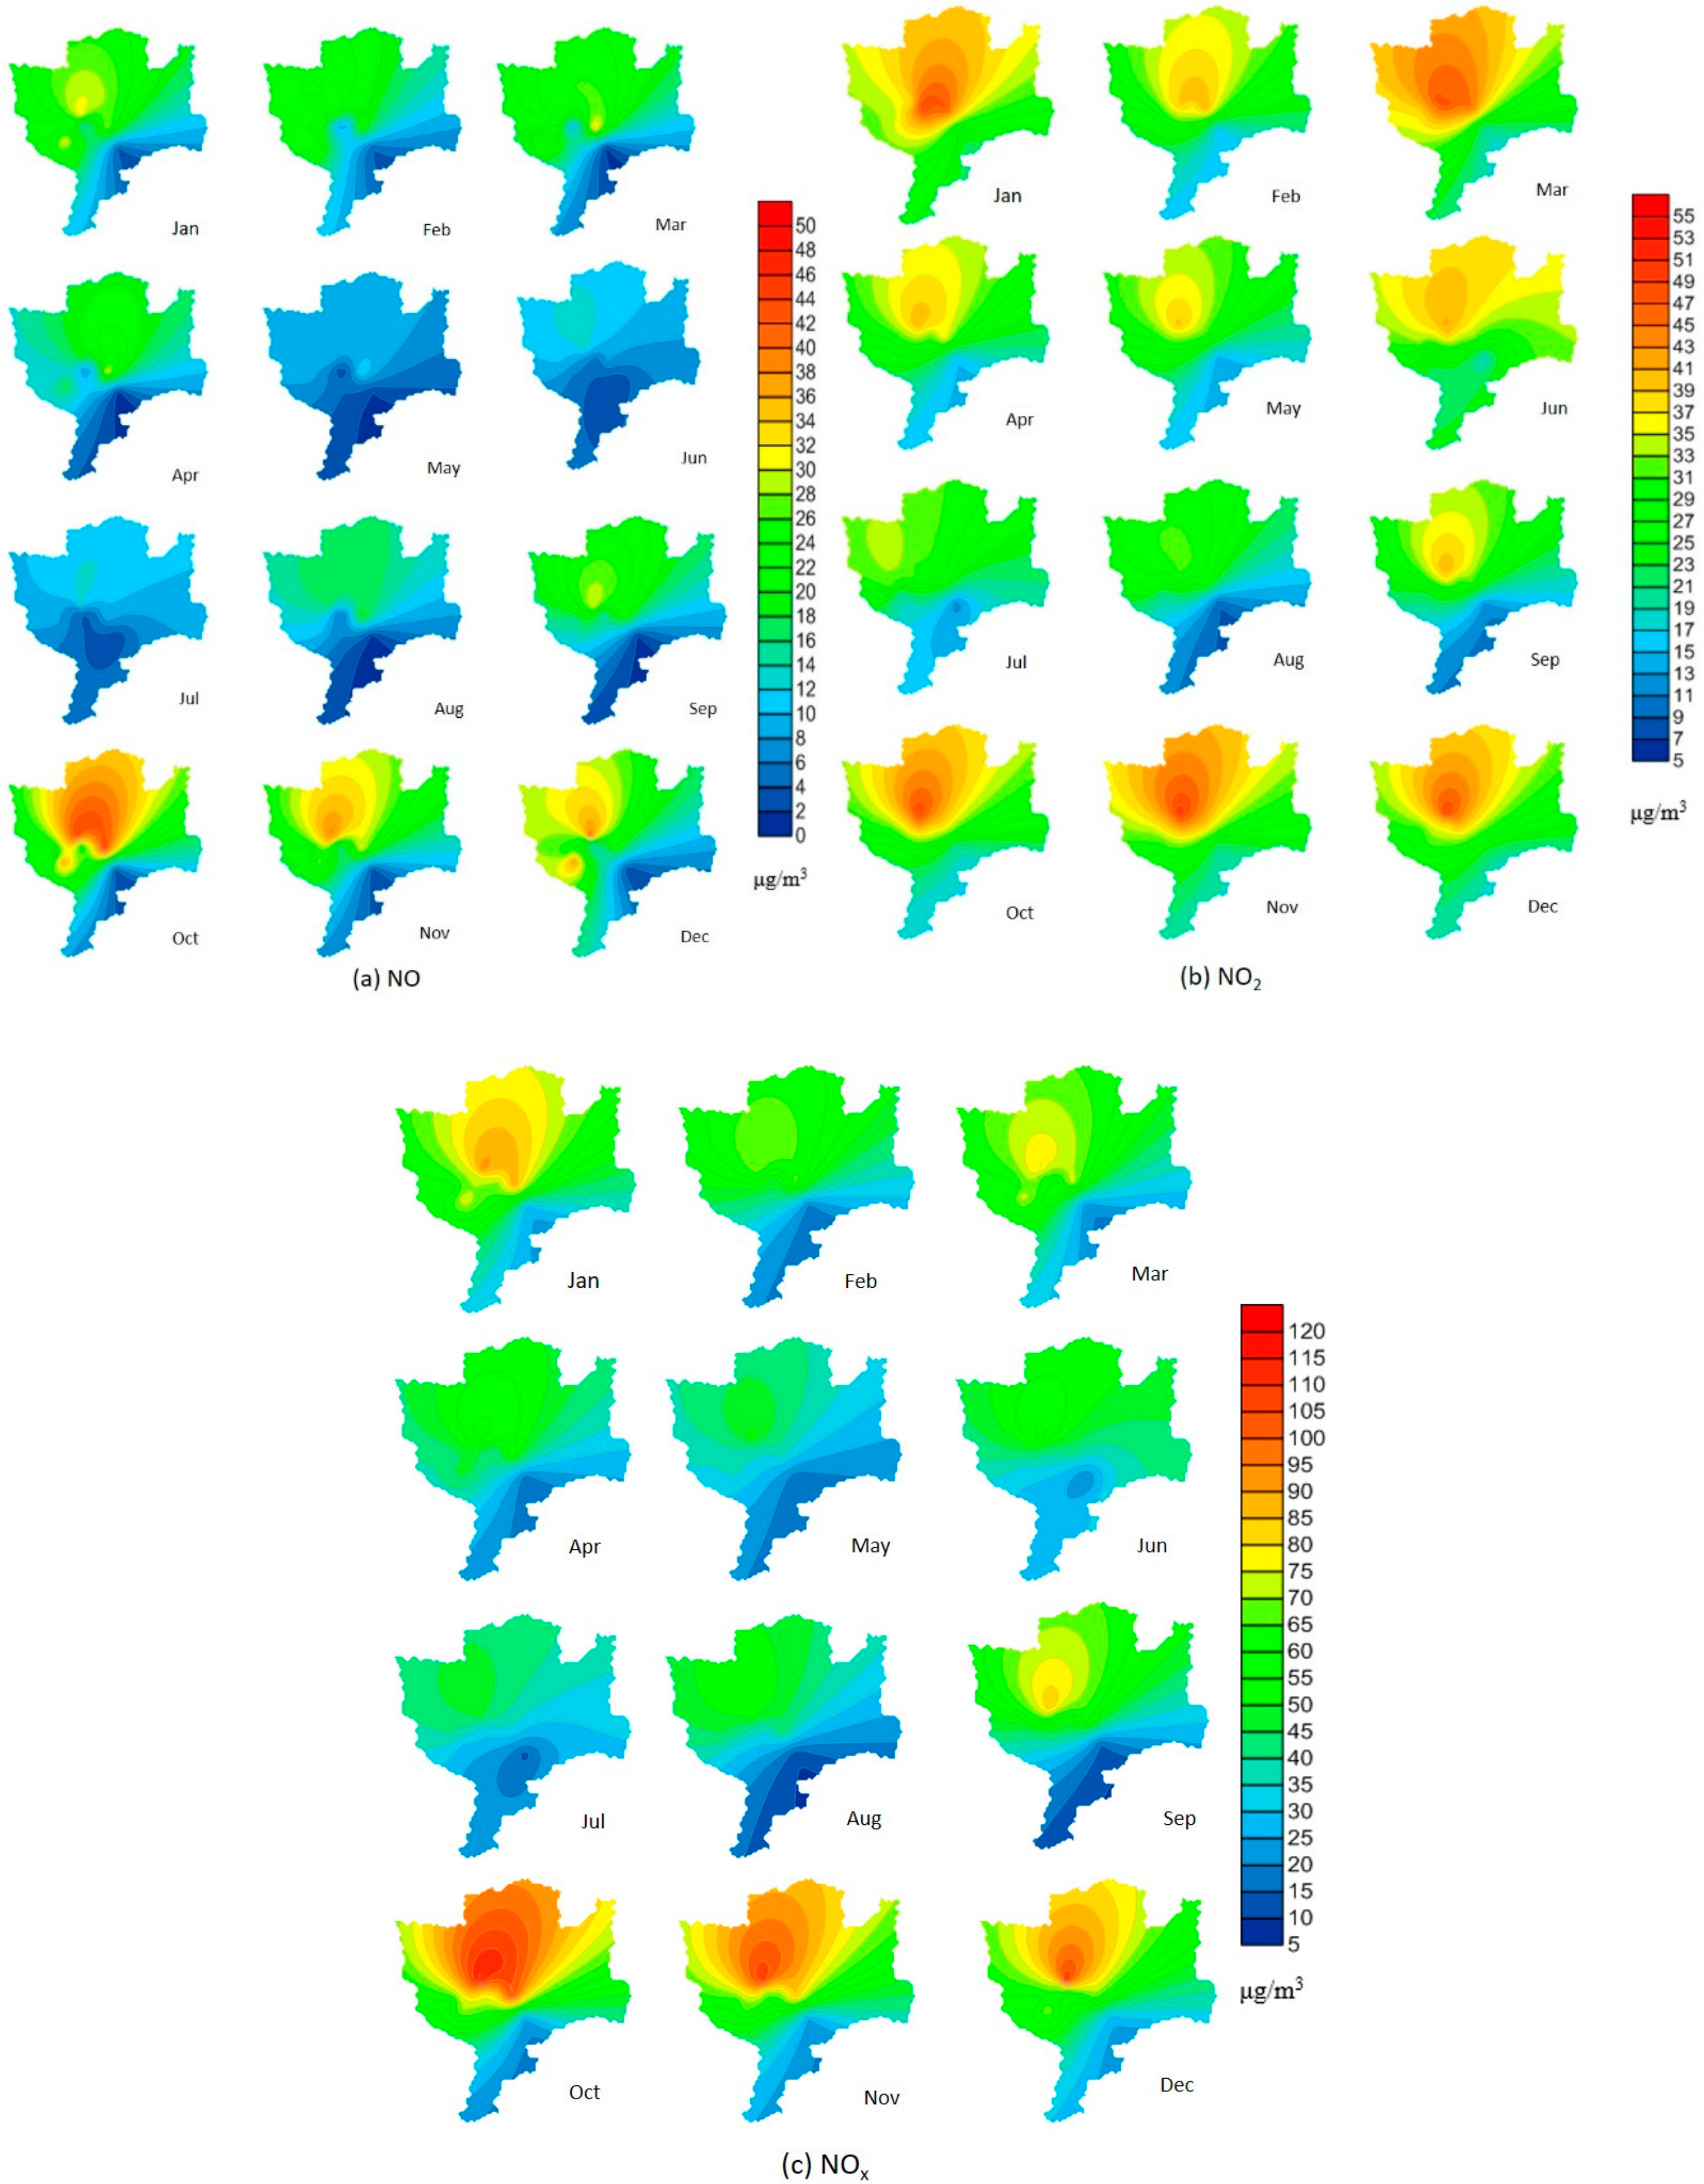
3.2.3. Spatiotemporal Variation

It can be seen from Figure 5 that the NO concentration in October, November, December, and January was higher than that in the other months in Changchun, 2018. The NO concentration decreased in February and continued to decrease in March, April, and May. In June and July, the NO concentration was at its lowest value and remained statistically unchanged. The concentration of NO increased sharply in August, September, and October, and it was the lowest in May, June, and July. This phenomenon is caused by the increase in solar radiation intensity: NO is transformed into NO2 through a photochemical reaction with atmospheric oxidants. After August, the conversion of NO to NO2 was weakened with the decrease in solar radiation. The monthly average concentration of NO2 was higher in October, November, December, January, and March, and it also reached a high concentration in winter in the analysis of seasonal concentration changes. Among the winter months, March had the highest concentration of NO2, and the main reason is that there were 12 days of mild pollution in March in Changchun, with 1 day of heavy pollution. The concentration of NO2 decreased in April and May. There was a brief rise in NO2 concentration in June, followed by a large decrease in July and August, and it rose sharply in September, October, and November. The concentration of NOx was higher in October, November, December, and January compared with other months, and the spatial distribution and annual average spatial distribution characteristics were the same.

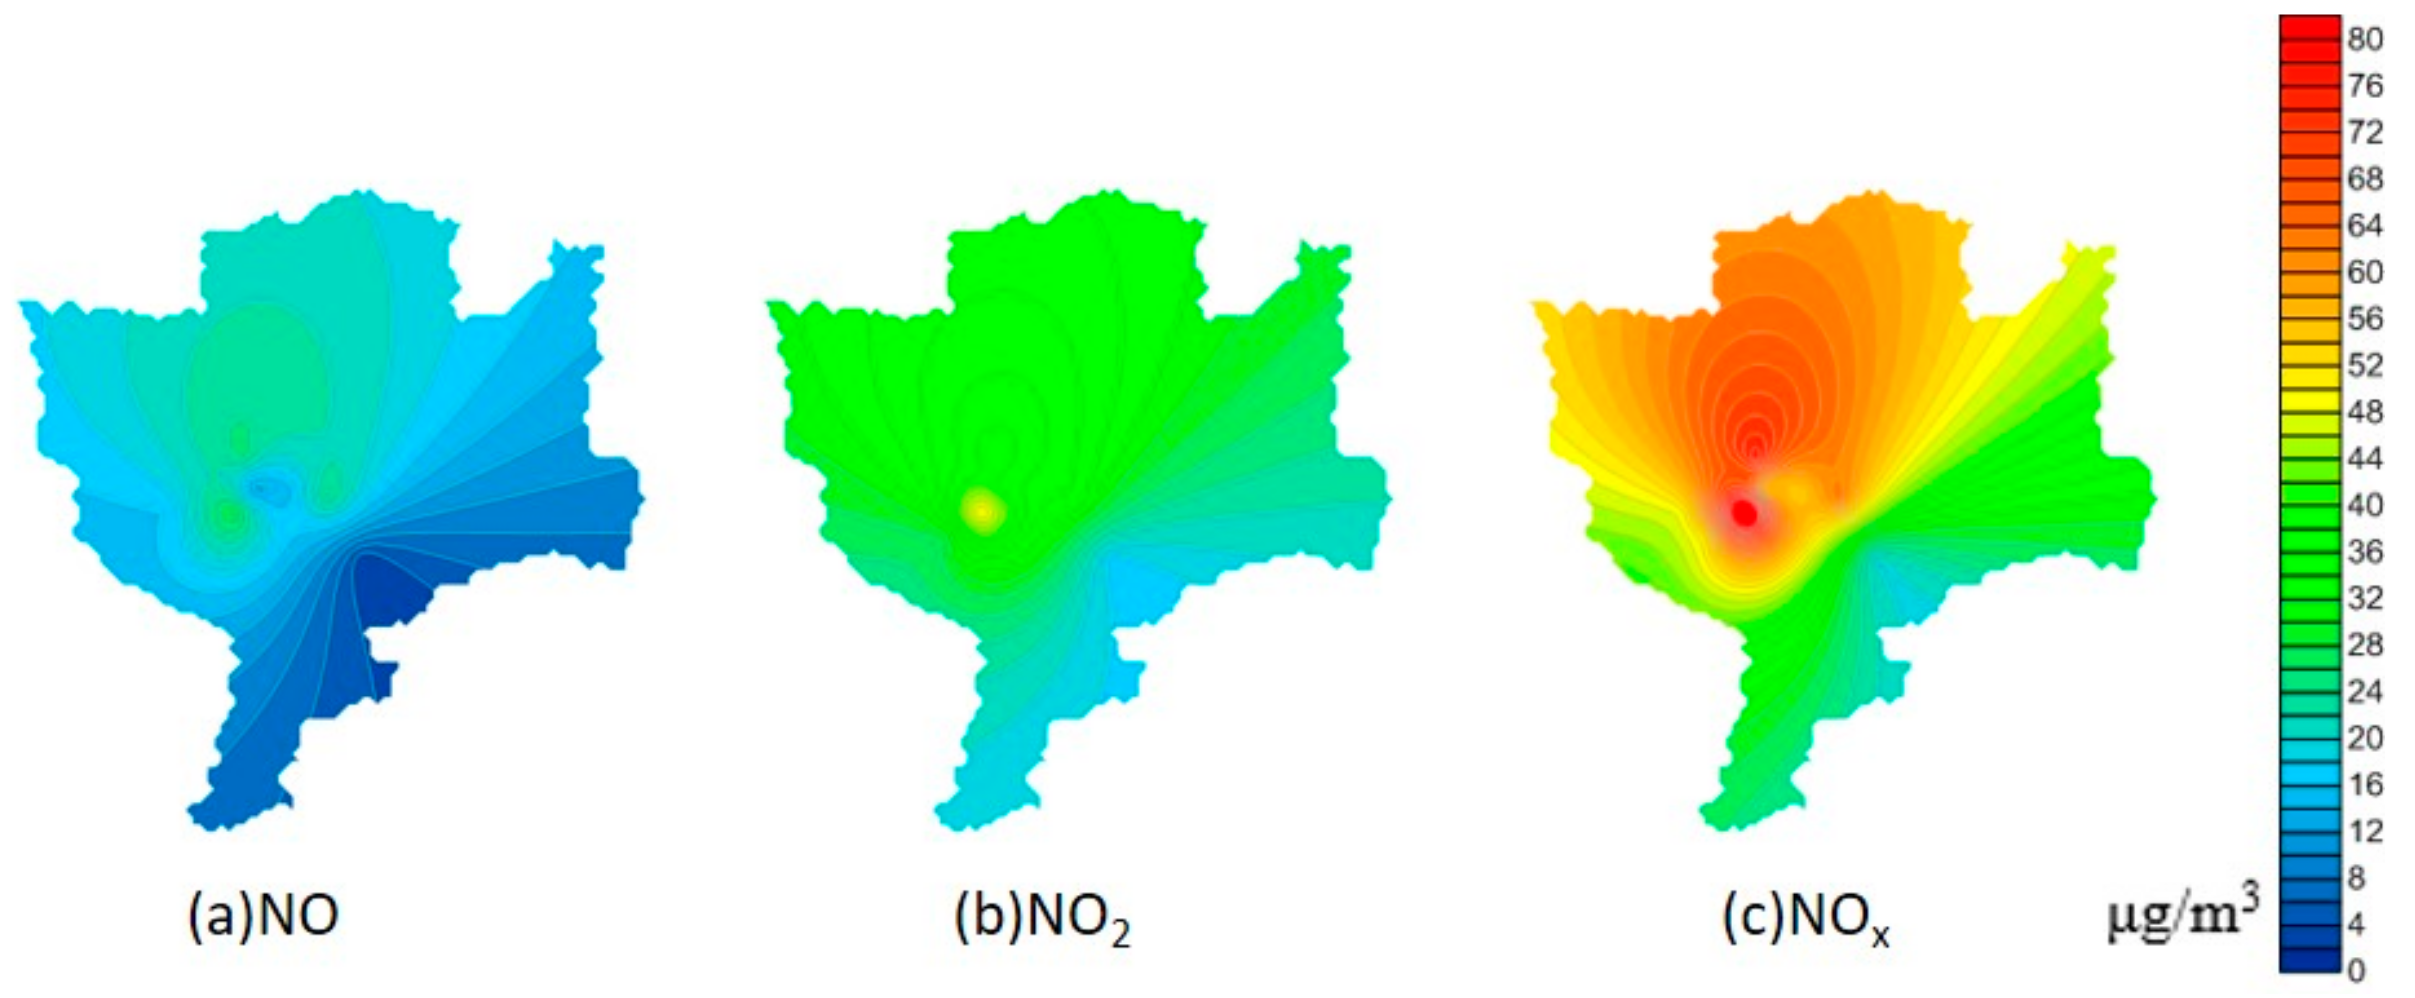
3.2.4. Spatial Variation Analysis

Figure 6 shows the spatial distribution of NOx, NO2, and NO in Changchun, 2018. The overall spatial distribution characteristics of the three pollutants were similar. The concentrations of all the NOx pollutants were the same in Changchun center and higher than in the periphery, with a clear hierarchical structure. This is most likely related to the relatively extensive development and high population in urban centers. Among the nine stations, IPT had the highest concentration, and JYT had the lowest. The center of the city covered by IPT, FP, and BF was an area of high nitrogen oxide concentration.
The coefficient of divergence (COD) method was also used to evaluate the spatial distribution differences in NOx concentrations at the monitored sites in Changchun. The COD is defined as
C O D f n = 1 n i = 1 n x i f x i h x i f + x i h 2
where xif is the ith concentration measured at the fth site, f and h represent two monitoring sites, and n is the number of observations. The COD is a coefficient used extensively in numerical analyses of ecological data to determine the resemblance either between objects under study or between the variables describing them. For a spatial distribution, the COD approaches zero if the measured values at two monitoring sites are similar. In contrast, if the measured values are very different, then the COD approaches unity. The spatial disparity of NOx was analyzed from 2016 to 2018 (Table 1). The CODs for NOx showed an identical trend to that of the GIS analysis above. The COD between IPT, FP, and BF was generally less than 0.2, which means that these sites had the smallest spatial variability. The CODs between JYT and IPT, FP, and BF were generally more than 0.5, while the smallest spatial variability was between JYT and SWZ.

3.2.5. Relationship Between NOx and Meteorological Factors

The relationship between NOx, NO2, and NO and meteorological factors was slightly different in different regions, but roughly the same conclusions were drawn in terms of temperature (T), wind speed (WS), pressure (P), and humidity (H). The influence of other pollutants on NOx, NO2, and NO was analyzed in this study by selecting several typical atmospheric pollutants, such as O3, PM2.5, PM10, and CO (carbon monoxide). On the basis of the selected meteorological factors, 11 factors were analyzed by correlation analysis (Table 2). The total number of data points for the 11 factors was 4015.
The correlation coefficient between NO and NOx was 0.963, and that between NO2 and NOx was 0.779. The correlation coefficient between NO and NO2 was 0.591, which indicates that the correlation between NO, NO2, and NOx was very strong. The results also confirm that these pollutants had a common source. The NO2 concentrations were notably positively correlated with PM2.5 concentrations, with a correlation coefficient of above 0.60. It was verified that the secondary conversion of NO2 had a significant effect on PM2.5 concentrations. There was a significant negative correlation between NO2 concentration and O3 concentration because the precursors were consumed and produced by photochemical reactions. The correlation between NO2 concentration and PM2.5 concentration was much greater than the correlation with O3 concentration. The reason may be that Changchun has a lower average annual temperature, higher humidity, less volatile organic compound (VOC) emissions from vegetation, and lower O3 concentration. The NO2 concentration was significantly positively correlated with the CO concentration, with a correlation coefficient of above 0.70.
The concentrations of NOx, NO2, and NO in Changchun had a strong negative correlation with temperature, wind speed, and humidity, and they had a strong positive correlation with air pressure. The correlation coefficients of NOx, NO2, and NO concentrations with T were −0.298, −0.28, and −0.274, respectively. The ground temperature increased, mainly in summer and daytime, and the vertical mixing degree increased, thus minimizing the concentration of nitrogen oxides in the low-altitude atmosphere [29]. The correlation coefficients of NOx, NO2, and NO concentrations with WS were −0.42, −0.34, and −0.402, respectively, which could be explained by the fact that higher wind speeds exacerbate the dispersion and mixing of these atmospheric pollutants emitted from local sources, such as automotive engines, thereby minimizing their cumulative concentration in the atmosphere. This result is consistent with the results of several studies in which wind speed showed a negative correlation with NOx concentration. It has been reported that low wind speeds might increase the impact of local sources of emissions [30,31]. The correlation coefficients of NOx, NO2, and NO concentrations with P were 0.442, 0.341, and 0.426, respectively, indicating that high pressure was more likely to cause pollution accumulation during the observation period.

4. Conclusions

On the basis of the Jilin Province Atmospheric Environmental Quality Bulletin and the hourly NOx (including NO and NO2) monitoring data of Atmospheric Environment Automatic Monitoring Station in Changchun, the pollution degree of NOx in the province, temporal and spatial variations of NOx concentrations in Changchun, and the relationships of NOx concentration with various pollutants and meteorological factors were analyzed for 2018. The analysis of concentration changes included seasonal changes and daily average changes, and spatial changes included monthly average changes and annual changes. Changchun had the highest NOx concentration of all cities in the province, with a high concentration in the middle and a low concentration in the east and west. The areas with high NOx concentrations in Changchun were mainly distributed in urban centers, and the NOx concentration in the northern part of the city was higher than that in the south.
The seasonal variation and average daily variation in NOx concentration in Changchun had a bimodal distribution, and the seasonal variation in NOx concentration was obvious; both analyses showed that the NOx concentration in autumn and winter was higher than that in spring and summer. The change in the concentration trend was related to meteorological conditions. Both low temperature and heating cause an increase in NOx concentrations. The low temperatures in winter are not conducive to the conversion of NO2, resulting in the accumulation of NOx. Heating increases the amount of coal used and increases the concentration of NO2. The maximum monthly average concentration of NOx and NO was reached in October, and the maximum monthly average concentration of NO2 was reached in March. The spatial distribution characteristics and annual average spatial distribution were the same. The average daily variation in NOx concentration occurred at 07:00–08:00 in the morning, and the second peak occurred between 20:00 and 22:00 at night. The second peak concentration of NOx and NO was significantly lower than the first peak, and the second peak concentration of NO2 was significantly higher than the first peak.
The NOx concentration in Changchun was positively correlated with NO2, NO, PM2.5, PM10, and CO, and it had a significant negative correlation with O3. The NOx concentration had a significant positive correlation with the PM2.5 concentration because the secondary conversion of NOx had a significant effect on PM2.5. There was a significant negative correlation between NOx and O3 because the precursors were consumed and produced by photochemical reactions. The NOx concentration was positively correlated with P and negatively correlated with T, WS, and H. The ground temperature increased, mainly in summer and at daytime, and the vertical mixing degree increased, thus minimizing the concentration of nitrogen oxides in the low-altitude atmosphere. Higher wind speeds exacerbate the dispersion and mixing of these atmospheric pollutants emitted from local sources, such as automotive engines, thereby minimizing their cumulative concentration in the atmosphere. High pressure was more likely to cause pollution accumulation during the observation period.

Supplementary Materials

The following are available online at https://www.mdpi.com/2073-4433/11/1/30/s1, Table S1: Monitoring sites in Changchun.

Author Contributions

All authors have read and agreed to the published version of the manuscript. L.W. worked for the conceptualization, original draft writing, review and editing of the article. X.T. worked for field sampling and filter analysis. J.W. and C.F. worked on the data curation and methodology and also worked as supervisors and directors of this study. All authors have read and agreed to the published version of the manuscript.

Funding

This research was funded by Ecology and Environment Department of Jilin Province. The project numbers are 2018-19 and 2019-08.

Conflicts of Interest

The authors declare no conflict of interest.

References

  1. Zhang, Q.; Streets, D.G.; He, K. Nox emission trends for China, 1995–2004: The view from the ground and the view from space. J. Geophys. Res. Atmos. 2007, 112, 18. [Google Scholar] [CrossRef] [Green Version]
  2. Shan, W.P.; Yin, Y.Q.; Zhang, J.D. Observational study of surface ozone at an urban site in East China. Atmos. Res. 2008, 89, 252–261. [Google Scholar] [CrossRef]
  3. Zong, X.M.; Wang, G.C.; Chen, H.B. Analysis of the Variation Characteristics of Atmospheric Ozone Concentration in the Boundary Layer of Beijing Area. J. Environ. Sci. 2007, 28, 2615–2619. [Google Scholar]
  4. Varshney, C.K.; Singh, A.P. Passive samplers for NOx monitoring: A critical review. Environmentalist 2003, 23, 127–136. [Google Scholar] [CrossRef]
  5. Chen, X.; Xia, X.H.; Zhao, Y. Heavy metal concentrations in roadside soils and correlation with urban traffic in Beijing, China. J. Hazard. Mater. 2010, 181, 640–646. [Google Scholar] [CrossRef]
  6. Zhang, C.Y.; Wang, S.X.; Xing, J. Analysis of current status and development trend of energy-related nitrogen oxide emissions in China. J. Environ. Sci. 2008, 2470–2479. [Google Scholar]
  7. Zhang, Q.; Geng, G.N.; Wang, S.W. Satellite remote sensing of changes in NOx emissions over China during 1996–2010. China Sci. Bull. 2012, 57, 2857–2864. [Google Scholar] [CrossRef] [Green Version]
  8. Cheng, N.L.; Li, Y.T.; Sun, F. Ground-level NO2 in urban Beijing: Trends, distribution, and effects of emission reduction measures. Aerosol Air Qual. Res. 2018, 18, 343–356. [Google Scholar] [CrossRef] [Green Version]
  9. Chen, P.F.; Zhang, W.; Quan, J.N. Temporal and spatial distribution characteristics of pollutants in the 3500 m high altitude in Beijing area. China Environ. Sci. 2012, 32, 1729–1735. [Google Scholar]
  10. Cai, K.; Li, S.S.; Zheng, F.B. Spatio-temporal variations in NO2 and PM2.5 over the central plains economic region of China during 2005–2015 based on satellite observations. Aerosol Air Qual. Res. 2018, 18, 1221–1235. [Google Scholar] [CrossRef]
  11. Nishanth, T.; Kumar, M.K.S.; Valsaraj, K.T. Variations in surface ozone and NOx at kannur: A tropical, coastal site in India. J. Atmos. Chem. 2012, 69, 101–126. [Google Scholar] [CrossRef]
  12. Pan, Y.P.; Wang, Y.S.; Hu, B. Study on atmospheric pollution observation of Xianghe River in Beijing during the Beijing Olympic Games. J. Environ. Sci. 2010, 31, 1–9. [Google Scholar]
  13. Cichowicz, R.; Stelegowski, A. Average Hourly Concentrations of Air Contaminants in Selected Urban, Town, and Rural Sites. Arch. Environ. Contam. Toxicol. 2019, 77, 197–213. [Google Scholar] [CrossRef] [PubMed] [Green Version]
  14. Wang, S.X.; Zhao, M.; Xing, J. Quantifying the air pollutants emission reduction during the 2008 Olympic games in Beijing. Environ. Sci. Technol. 2010, 44, 2490–2496. [Google Scholar] [CrossRef] [PubMed]
  15. Wang, W.F.; Zhu, B.; Wang, Y.S. Vertical gradient observation of O3 and NOx in a photochemical pollution process. J. Environ. Engin. 2010, 4, 411–416. [Google Scholar]
  16. Yang, T.; Gbaguidi, A.; Yan, P.Z. Model elucidating the sources and formation mechanisms of severe haze pollution over northeast mega-city cluster in China. Environ. Pollut. 2017, 230, 692–700. [Google Scholar] [CrossRef]
  17. Lin, X.Q.; Wang, D. Temporal and spatial evolution characteristics and socio-economic drivers of urban air quality in China. Acta Geogr. Sci. 2016, 71, 1357–1371. [Google Scholar]
  18. Tiwari, S.; Srivastava, A.K.; Chate, D.M. Impacts of the high loadings of primary and secondary aerosols on light extinction at Delhi during wintertime. Atmos. Environ. 2014, 92, 60–68. [Google Scholar] [CrossRef]
  19. Tiwari, S.; Dahiya, A.; Kumar, N. Investigation into relationships among NO, NO2, NOx, O3, and CO at an urban background site in Delhi, India. Atmos. Res. 2015, 157, 119–126. [Google Scholar] [CrossRef]
  20. Cao, J.J.; Shen, Z.X.; Chow, J.C. Winter and summer PM2.5 chemical compositions in fourteen Chinese cities. J. Air Waste Manag. Assoc. 2012, 62, 1214–1226. [Google Scholar] [CrossRef]
  21. Song, C.B.; Wu, L.; Xie, Y.C. Air pollution in China: Status and spatiotemporal variations. Environ. Pollut. 2017, 227, 334–347. [Google Scholar] [CrossRef] [PubMed]
  22. Xiao, K.; Wang, Y.K.; Wu, G. Spatiotemporal characteristics of air pollutants (PM10, PM2.5, SO2, NO2, O3, and CO) in the inland basin city of Chengdu, southwest China. Atmosphere 2018, 9, 16. [Google Scholar] [CrossRef] [Green Version]
  23. Boersma, K.F.; Jacob, D.J.; Trainic, M. Validation of urban NO2 concentrations and their diurnal and seasonal variations observed from the sciamachy and omi sensors using in situ surface measurements in Israeli cities. Atmos. Chem. Phys. 2009, 9, 3867–3879. [Google Scholar] [CrossRef] [Green Version]
  24. Ionov, D.V.; Timofeyev, Y.M.; Sinyakov, V.P. Ground-based validation of EOS-Aura OMI NO2 vertical column data in the midlatitude mountain ranges of Tien Shan (Kyrgyzstan) and Alps (France). J. Geophys. Res. Atmos. 2008, 113, 14. [Google Scholar] [CrossRef] [Green Version]
  25. Lamsal, L.N.; Martin, R.V.; van Donkelaar, A. Indirect validation of tropospheric nitrogen dioxide retrieved from the omi satellite instrument: Insight into the seasonal variation of nitrogen oxides at northern midlatitudes. J. Geophys. Res. Atmos. 2010, 115, 15. [Google Scholar] [CrossRef]
  26. Li, S.S.; Yu, C.; Chen, L.F. Inter-comparison of model-simulated and satellite-retrieved componential aerosol optical depths in China. Atmos. Environ. 2016, 141, 320–332. [Google Scholar] [CrossRef] [Green Version]
  27. Khoder, M.I. Atmospheric conversion of sulfur dioxide to particulate sulfate and nitrogen dioxide to particulate nitrate and gaseous nitric acid in an urban area. Chemosphere 2002, 49, 675–684. [Google Scholar] [CrossRef]
  28. Jenkin, M.E. Analysis of sources and partitioning of oxidant in the UK—Part 2: Contributions of nitrogen dioxide emissions and background ozone at a kerbside location in London. Atmos. Environ. 2004, 38, 5131–5138. [Google Scholar] [CrossRef]
  29. Han, S.Q.; Bian, H.; Feng, Y.C. Analysis of the relationship between O3, NO and NO2 in Tianjin, China. Aerosol Air Qual. Res. 2011, 11, 128–139. [Google Scholar] [CrossRef] [Green Version]
  30. Agudelo-Castaneda, D.M.; Teixeira, E.C.; Pereira, F.N. Time-series analysis of surface ozone and nitrogen oxides concentrations in an urban area at Brazil. Atmos. Pollut. Res. 2014, 5, 411–420. [Google Scholar] [CrossRef] [Green Version]
  31. Jones, A.M.; Harrison, R.M.; Baker, J. The wind speed dependence of the concentrations of airborne particulate matter and NOx. Atmos. Environ. 2010, 44, 1682–1690. [Google Scholar] [CrossRef]
Figure 1. Air monitoring stations of Changchun.
Atmosphere 11 00030 g001
Figure 2. Spatial distribution of NOx, NO2, and NO in Jilin Province, 2016–2018.
Atmosphere 11 00030 g002
Figure 3. Concentrations of nitrogen compounds and meteorological factors in the four seasons of Changchun in 2018: (a) NOx, (b) NO2, (c) NO, (d) sunlight hours and humidity.
Atmosphere 11 00030 g003
Figure 4. Daily average concentration of nitrogen compounds at each station in Changchun, 2018: (a) NO, (b) NO2, (c) NOx.
Atmosphere 11 00030 g004aAtmosphere 11 00030 g004b
Figure 5. Spatial distribution of the monthly average concentration of nitrogen compounds in Changchun, 2018: (a) NO, (b) NO2, (c) NOx.
Atmosphere 11 00030 g005
Figure 6. Spatial distribution of the average concentration of nitrogen compounds in Changchun, 2018: (a) NO, (b) NO2, (c) NOx.
Atmosphere 11 00030 g006
Table 1. Coefficients of divergence for NOx obtained at the 10 monitoring sites in 2016–2018.
YearCOD
SiteDPHZMCEEZCOJYTBFLPFPSWZIPTGD
2016DP0.11 0.06 0.43 0.13 0.07 0.21 0.42 0.29 0.08
HZMC 0.11 0.37 0.21 0.10 0.28 0.37 0.35 0.14
EEZCO 0.44 0.13 0.06 0.20 0.43 0.28 0.08
JYT 0.51 0.42 0.57 0.11 0.63 0.45
BF 0.13 0.10 0.50 0.18 0.10
LP 0.21 0.41 0.29 0.06
FP 0.56 0.09 0.17
SWZ 0.62 0.44
IPT 0.25
GD
2017DP0.09 0.13 0.40 0.16 0.04 0.22 0.41 0.30 0.05
HZMC 0.06 0.46 0.11 0.07 0.16 0.45 0.24 0.06
EEZCO 0.49 0.09 0.10 0.13 0.48 0.21 0.10
JYT 0.52 0.43 0.56 0.13 0.62 0.43
BF 0.13 0.09 0.52 0.16 0.13
LP 0.19 0.43 0.27 0.04
FP 0.56 0.10 0.18
SWZ 0.61 0.44
IPT 0.27
GD
2018DP0.10 0.15 0.44 0.16 0.08 0.22 0.46 0.32 0.08
HZMC 0.12 0.45 0.17 0.07 0.22 0.48 0.31 0.08
EEZCO 0.52 0.08 0.10 0.13 0.54 0.22 0.09
JYT 0.55 0.46 0.59 0.16 0.66 0.47
BF 0.13 0.09 0.56 0.17 0.11
LP 0.19 0.49 0.28 0.02
FP 0.60 0.11 0.18
SWZ 0.66 0.49
IPT 0.27
GD
Table 2. Correlation of NOx, NO2, and NO and other influencing factors.
NONO2NOxO3PM2.5PM10COTWSPH
NO1
NO20.5911
NOx0.9630.7791
O3−0.43−0.161−0.4021
PM2.50.3060.620.4270.1031
PM100.2170.4070.2860.3530.7351
CO0.5080.7250.623−0.0850.8530.5551
T−0.274−0.276−0.2980.459−0.376−0.096−0.4681
WS−0.402−0.336−0.420.5280.0590.336−0.1090.1691
P0.4260.3410.442−0.4990.3120.0290.433−0.799−0.2931
H−0.08−0.178−0.11−0.255−0.253−0.442−0.1620.387−0.259−0.3721

