Article

Assessment of a Real-Time Prediction Method for High Clothing Thermal Insulation Using a Thermoregulation Model and an Infrared Camera

1
Energy & Environment Business Division, KCL (Korea Conformity Laboratories), Jincheon 27872, Korea
2
Department of Architecture & Architectural Engineering, Yonsei University, 50 Yonsei-ro, Seodaemun-gu, Seoul 03722, Korea
3
Architectural Engineering Department, KFUPM, Dhahran 31261, Saudi Arabia
*
Author to whom correspondence should be addressed.
Atmosphere 2020, 11(1), 106; https://doi.org/10.3390/atmos11010106
Submission received: 4 November 2019 / Revised: 2 January 2020 / Accepted: 12 January 2020 / Published: 15 January 2020
(This article belongs to the Special Issue Indoor Thermal Comfort)

Abstract

:
For evaluating the thermal comfort of occupants, human factors such as clothing thermal insulation (clo level) and metabolic rate (Met) are one of the important parameters as well as environmental factors such as air temperature (Ta) and humidity. In general, a fixed clo level is commonly used for controlling heating, ventilation, and air conditioning using the thermal comfort index. However, a fixed clo level can lead to errors for estimating the thermal comfort of occupants, because clo levels of occupants can vary with time and by season. The present study assesses a method for predicting the clo level of occupants using a thermoregulation model and an infrared (IR) camera. The Tanabe model and the Fanger model were used as the thermoregulation models, and the predicted performance for high clo level (winter clothing) was compared. The skin and clothing temperatures of eight subjects using a non-contact IR camera were measured in a climate chamber. In addition, the measured values were used for the thermoregulation models to predict the clo levels. As a result, the Tanabe model showed a better performance than the Fanger model for predicting clo levels. In addition, all models tended to predict a clo level higher than the traditional method.

1. Introduction

Maintaining a pleasant thermal environment is one of the major goals of heating, ventilation, and air conditioning (HVAC) systems in buildings [1]. According to American [2] and international standards [3], six factors are needed to assess the thermal comfort of occupants. Four environmental factors—temperature, relative humidity (RH), mean radiant temperature (MRT), and air velocity (V)—and two personal factors—clothing thermal insulation (clo level) and metabolic rate (Met)—are required. While environmental factors can be measured using various types of equipment, personal factors, especially the clo level, are difficult to predict accurately since they can vary by season. In general, a fixed clo level (0.5 clo in summer, 1.0 clo in winter) is generally employed for thermal comfort index-based HVAC control, in accordance with the ASHRAE Standard 55 [2] or ISO 7730 [3].
The clo level of an occupant differs with respect to the time and season. Therefore, a fixed clo level may cause errors in predicting the thermal comfort. Newsham [4] reported that increasing the clo-level flexibility in an office can enhance the comfort of occupants and significantly reduce the building energy consumption. Lee and Schiavon [5] reported that fixing the clo level according to a predicted mean vote (PMV), a representative thermal comfort index, in a PMV-based HVAC control in summer and winter caused poor predictability of the room temperature and energy consumption, and they suggested the need for a dynamic clothing model.
The clo level is typically evaluated using thermal manikins or human subjects under laboratory conditions. Several studies have been performed on predicting the clo levels dynamically. Konarska et al. [6] measured skin temperature by attaching a thermocouple to the body of a subject and applied the measured temperature to the heat-balance equation for calculating the clo level. Although this method can provide accurate clo levels, it is difficult to attach thermocouples to the skin of occupants in real-life situations. Olesen and Nielsen [7] and McCullough et al. [8] analyzed the relationship between the weight of garments and the clo level through regression analysis. De Carli et al. [9] and Schiavon and Lee [10] developed models that consider the selection of clothing based on the weather condition in the morning. Although these methods can predict the clo level more flexibly than the conventional methods, they have limitations for predicting the changing clo level in real time.
Recently, with the development of image-recognition techniques, several attempts have been made to predict clo levels in real time using cameras. Matsumoto et al. [11] proposed a method for estimating the clo level by recognizing the images of clothes after constructing a simple database of clo levels according to the weight of the clothes. However, the experiment was performed only with images in the database, not on an actual person, and it was difficult to predict the clo level without knowing the weights of the clothes in advance. Lee et al. [12] used an infrared (IR) camera and evaluated the clo level according to the measured temperatures of the skin (forehead) and top and bottom clothing surfaces (chest and legs, respectively). In this study, the sensible heat loss from the skin was calculated using the heat-balance equation proposed by Fanger [13]. However, the sensible heat loss from the skin and the skin temperatures of each part of the human body cannot be calculated, owing to the limitation of Fanger model, which considers the human body as one node. The Tanabe model [14] is a multi-node thermoregulation model that overcomes the disadvantages of the Fanger model. It models the temperature of the human body in greater detail. However, there have been no attempts to predict the clo level in a non-contact manner using the Tanabe model and an IR camera. Additionally, the difference in the prediction results between the Fanger and Tanabe thermoregulation models remains unknown.
The objective of this study was to evaluate the applicability of the Tanabe thermoregulation model to predict clo level and to compare the prediction accuracy of two thermoregulation models (Fanger model and Tanabe model). Focusing on the objectives, experiments were performed to measure the temperatures of the skin (forehead) and the top and bottom winter clothing surfaces (chest and thigh, respectively) of subjects using an IR camera since thermoregulation models are better suited to predict higher clo levels (winter clothing) than lower clo levels (summer clothing) [6,12]. The measured skin and clothing surface temperatures were applied to two types of human thermoregulation models to calculate the sensible heat loss from the skin and to predict the clo levels.

2. Methods for Evaluating Clo Level

2.1. Standard Method Using a Thermal Manikin

The clo level is generally evaluated according to the procedures and standards provided by ISO 7730 [15] and ASTM F1291 [16]. This evaluation method uses a human-shaped thermal manikin. The dressed thermal manikin in a standing posture is heated, and the clo level is calculated using the measured skin surface temperature and operative temperature [17]. The clo level is calculated using Equations (1)–(3). The unit of the clo level (clo) is 0.155 m 2 / W .
I T   =   t s k t o H ,
where I T   is the total thermal insulation, including the clo level and boundary air layer ( m 2 / W ); t s k is the skin surface temperature ( ); t o is the operative temperature ( ); and H is the sensible heat loss from the skin ( W / m 2 ).
I a   =   1 h c   +   h r ,
where I a   is the thermal insulation of the boundary air layer ( m 2 / W ), h c is the convective heat-transfer coefficient ( W / m 2 ), and   h r is the radiative heat-transfer coefficient ( W / m 2 ).
I c l   = I T   I a f c l ,  
Here, I c l   is the intrinsic clo level ( m 2 / W ), and f c l is the clothing area factor (dimensionless).

2.2. Evaluation Method Using a Human Thermoregulation Model

Among the many types of thermoregulation models, the model proposed by Fanger [13,18] is most commonly employed. It was constructed according to experimental results for standardized clothing and activities under steady-state laboratory conditions. Figure 1 shows the process of heat transfer between the human body and the surrounding environment. The heat exchanged between the body and the surrounding environment passes through the clothing [19]. If the sensible heat loss from the skin is identified, the clo level can be evaluated using Equation (4).
R c l   = ( t s k t c l ) / ( C + R ) ,
where C is the convective heat loss from the outer surface of the clothed body ( W / m 2 ), R is the radiative heat loss from the outer surface of the clothed body ( W / m 2 ), ( C + R ) is the sensible heat loss from the outer surface of the clothed body ( W / m 2 ), t c l is the clothing surface temperature ( ), and R c l is the clo level ( m 2 K / W ).
Equation (4) differs from Equation (3) because the clo level is directly calculated using the skin and clothing surface temperatures. When a thermal manikin is used, the sensible heat loss from the skin is clearly identified.
The human thermoregulation model involves a series of mathematical processes that remove heat from the body through the skin and respiration to maintain a constant core temperature. Using the thermoregulation model, it is possible to estimate the heat loss from the skin according to the air temperature (Ta), MRT, RH, air velocity (V), clo level, and metabolic rate (Met). The clo level can be calculated by substituting the estimated heat loss from the skin into Equation (4).

2.3. Multi-Node Human Thermoregulation Model

In general, thermoregulation models are classified as one-node, two-node, or multi-node according to the number of nodes representing the human body. As previously shown, the Fanger model has a simple design that only considers the heat characteristic of a human body. Givoni and Goldman [20] proposed another one-node model. Gagge [21,22] studied a two-node model, in which the human body is divided into a core layer and a skin layer. Jones [23] and Takada et al. [24] used a two-node model for the investigation of the physiological response. However, the human body adapts to various thermal environments through physiological responses, such as vasoconstriction, vasodilatation, shivering, and sweating, and heat is transferred to the surrounding environment via these processes [25]. Moreover, in one- and two-node models, it is difficult to describe the physiological phenomena that occur in different parts of the human body.
Considering the responses from various parts of the human body, a multi-node human thermoregulation model was proposed, and numerous thermoregulation models [14,26,27,28] have been developed to quantify the complex physiological phenomena of the human body in a thermal environment. In the multi-node model developed by Stolwijk [29], the human body is divided into six parts: head, trunk, arms, hands, legs, and feet. Each part consists of four layers: core, muscle, fat, and skin. Each layer is connected to the central blood compartment via the bloodstream. Huizenga et al. [26] divided the human body into 16 parts and added a clothing layer to allow for the transfer of heat moisture through clothing. Tanabe et al. [14] proposed a model based on the Stolwijk model and the results of thermal-manikin experiments in which the manikin was divided into 16 parts comprising 65 nodes with 4 layers and a central blood compartment. In other works [26,28,30], multi-node models based on the Stolwijk model were proposed. Owing to the advantages of the multi-node thermoregulation model, the model proposed by Tanabe et al. [14] was employed in the present study.
In the case of the multi-node thermoregulation model, the sensible heat loss from the skin of each part of the body is calculated using Equation (5). The clo level can then be calculated using that equation.
Q t ( i )   = h t ( i ) × ( t s k ( i ) t o ( i ) ) × A D u ( i ) ,
1 h t ( i ) = 0.155 × I c l ( i ) + 1 ( h c ( i )   +   h r ( i ) ) × f c l ( i )   ,
where i is the body-segment number, Q t ( i ) is the sensible heat loss from the skin ( W / m 2 ), t o ( i ) is the operative temperature ( ), A D u ( i ) is the surface area of each segment ( m 2 ), h t ( i ) is the heat-transfer coefficient from the skin to the environment ( W / m 2 K ), h c ( i ) is the convective heat-transfer coefficient ( W / m 2 K ), and h r ( i ) is the radiative heat-transfer coefficient ( W / m 2 K ).

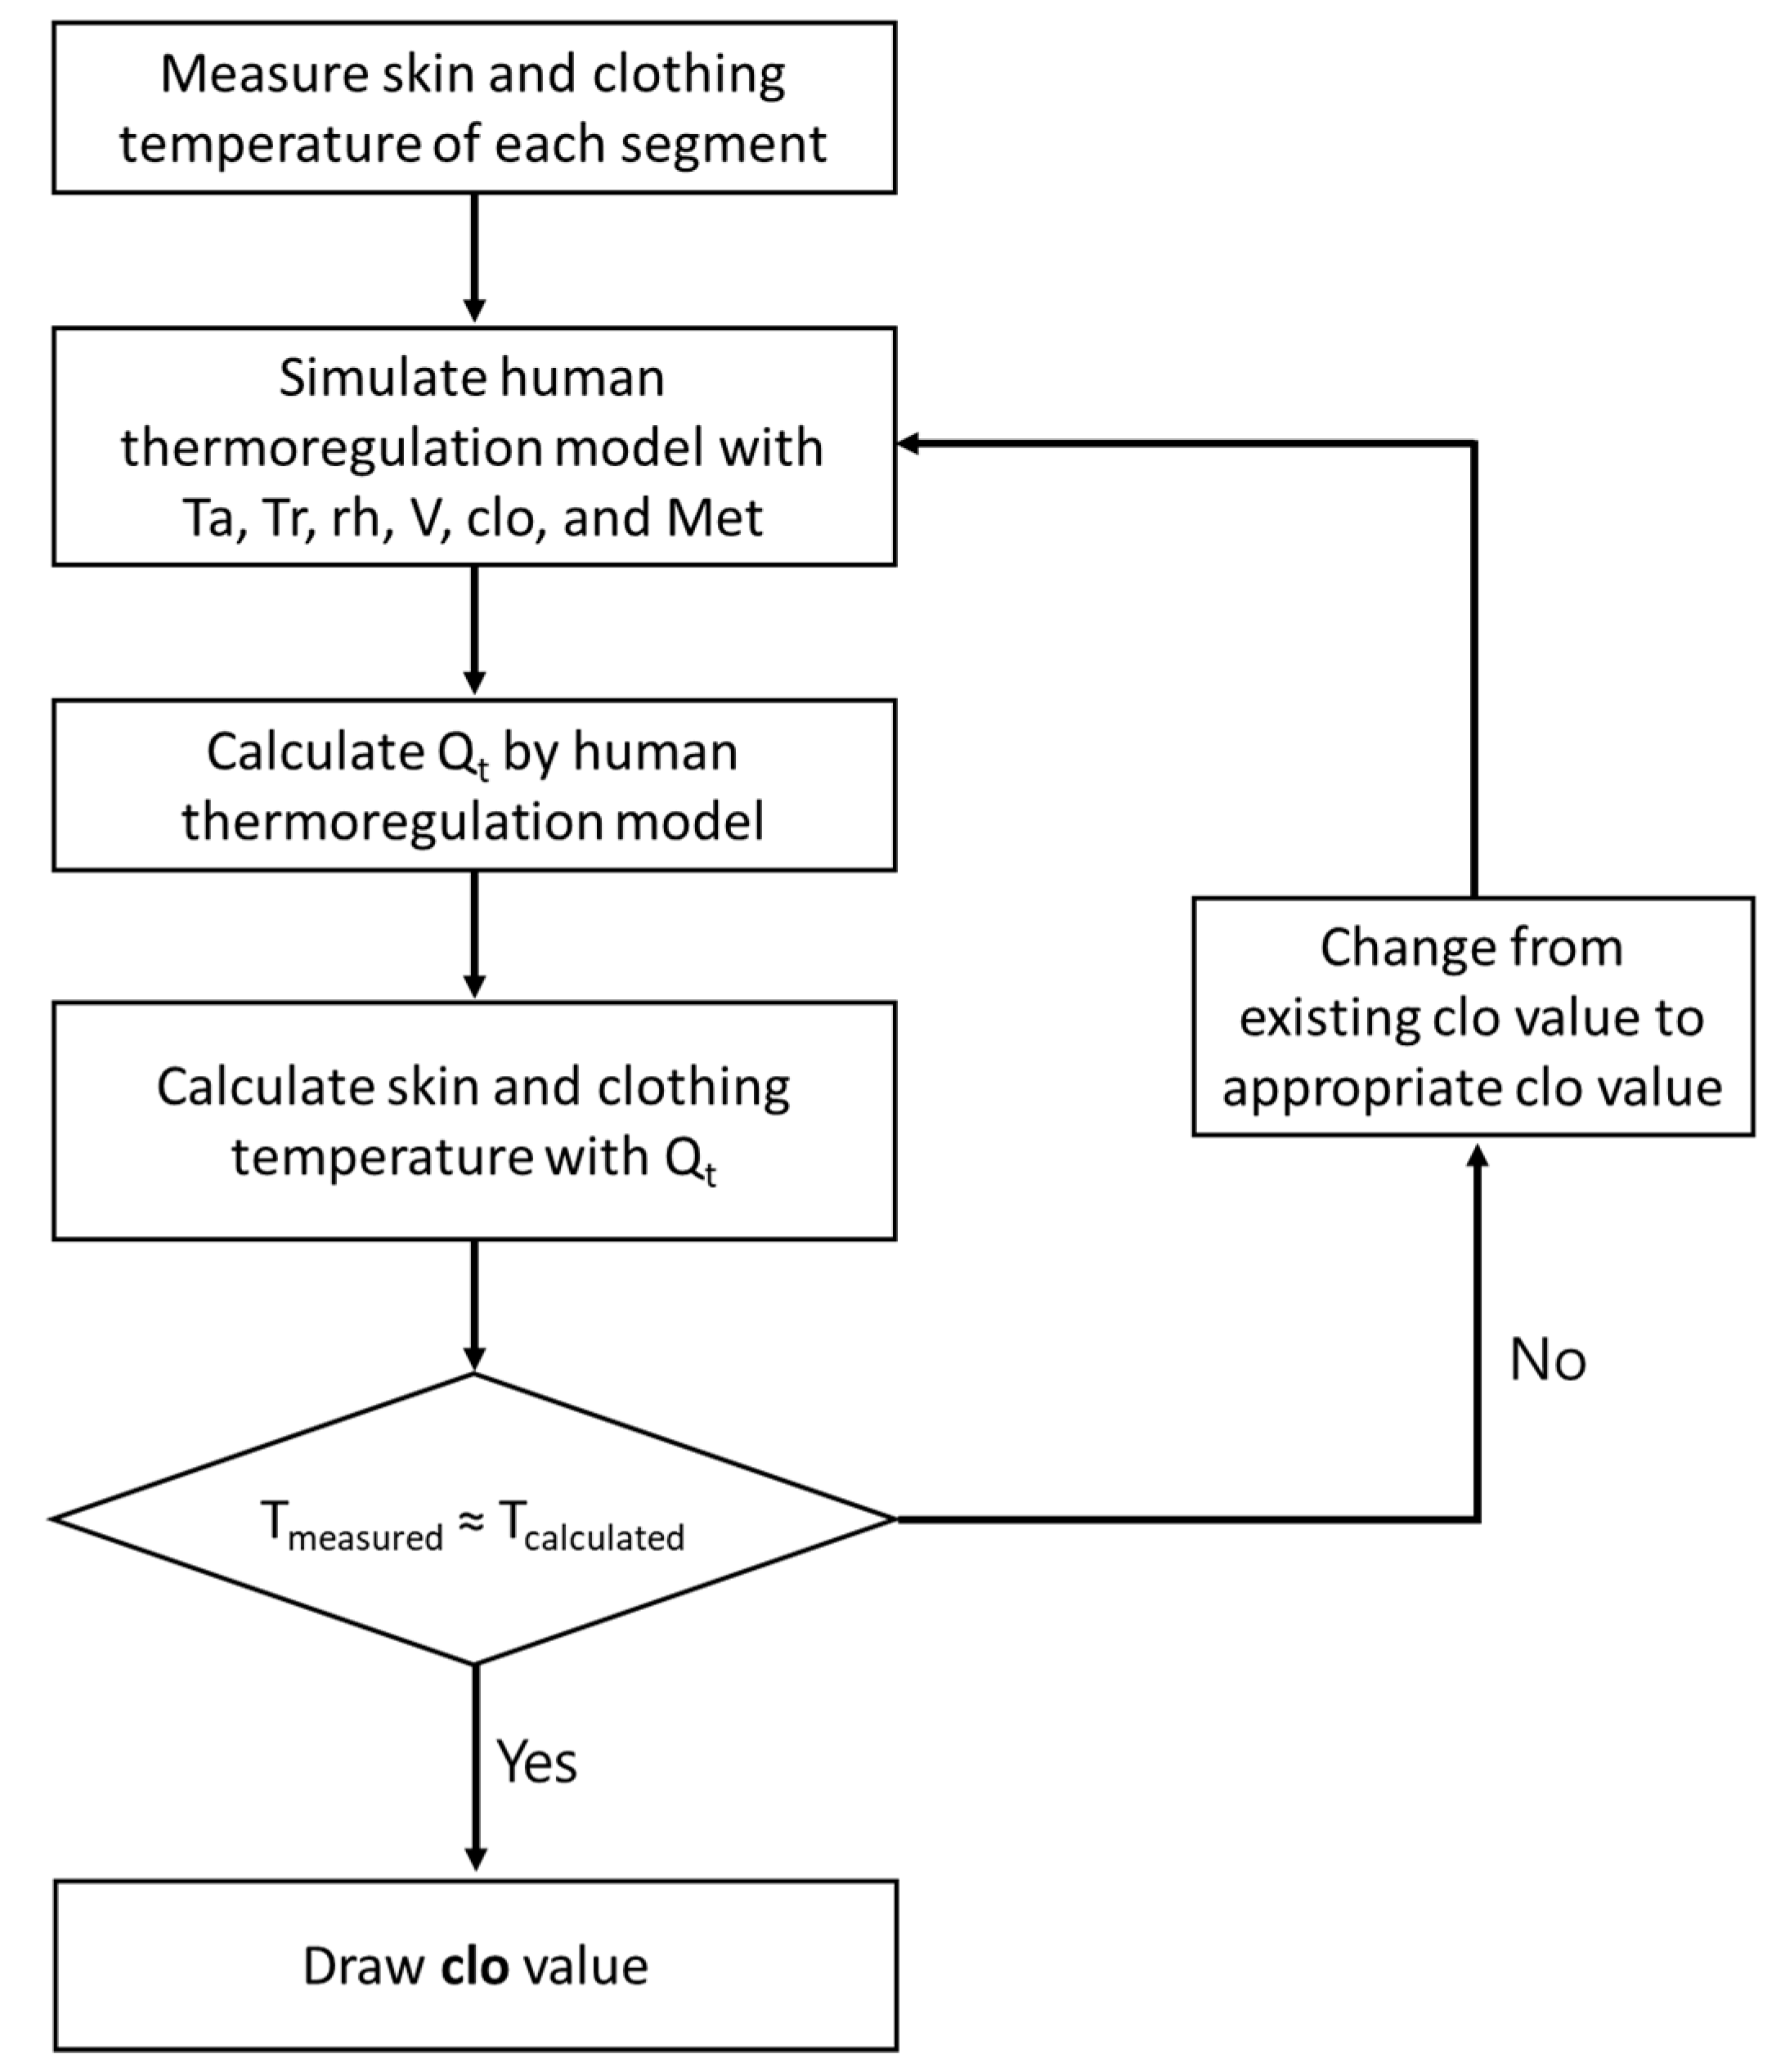
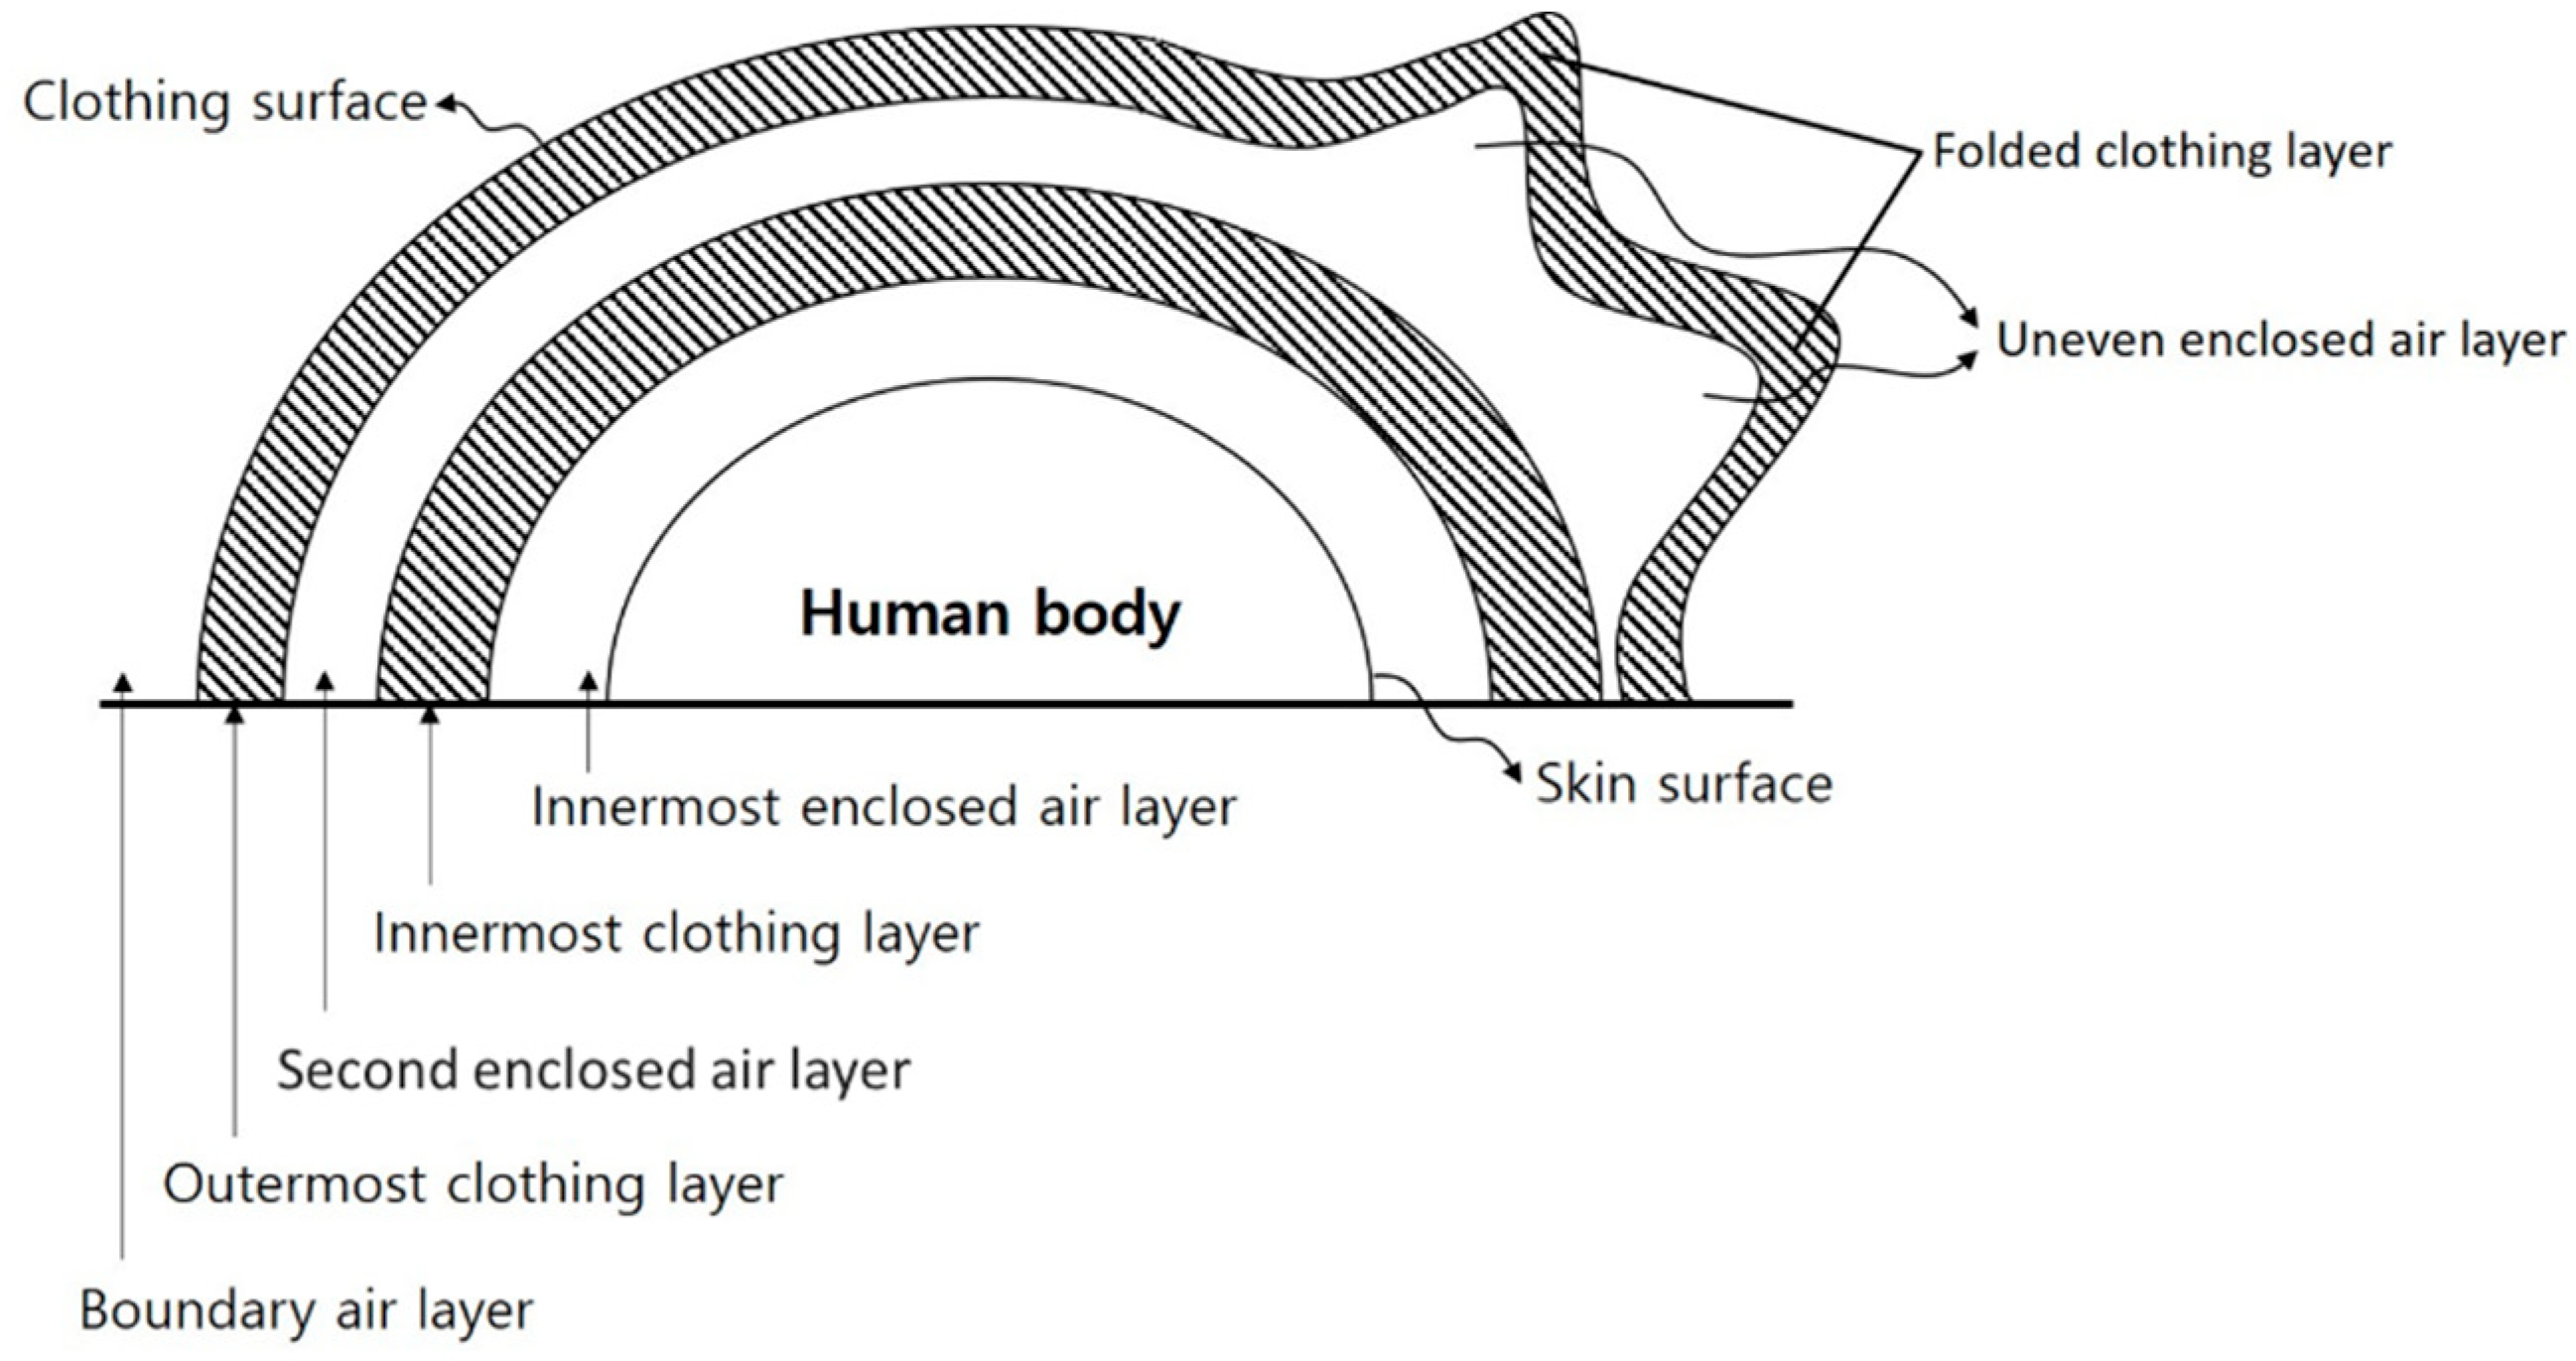
2.4. Calculation of Clothing Insulation Using a Human Thermoregulation Model and an IR Camera

Recently, many studies [31,32,33,34] have been conducted to measure the skin temperatures of occupants using non-contact sensors. Using a non-contact sensor such as an IR camera, the skin temperature can be measured in real space without harming the occupants. Additionally, the thermal sensation vote of an occupant can be predicted directly.
Figure 2 shows the process of clo-level calculation using the human thermoregulation model and an IR camera. In this study, the Fanger model was used as the one-node model, and the Tanabe model was used as the multi-node model. The calculation of the clo level using the human thermoregulation model is outlined as follows:
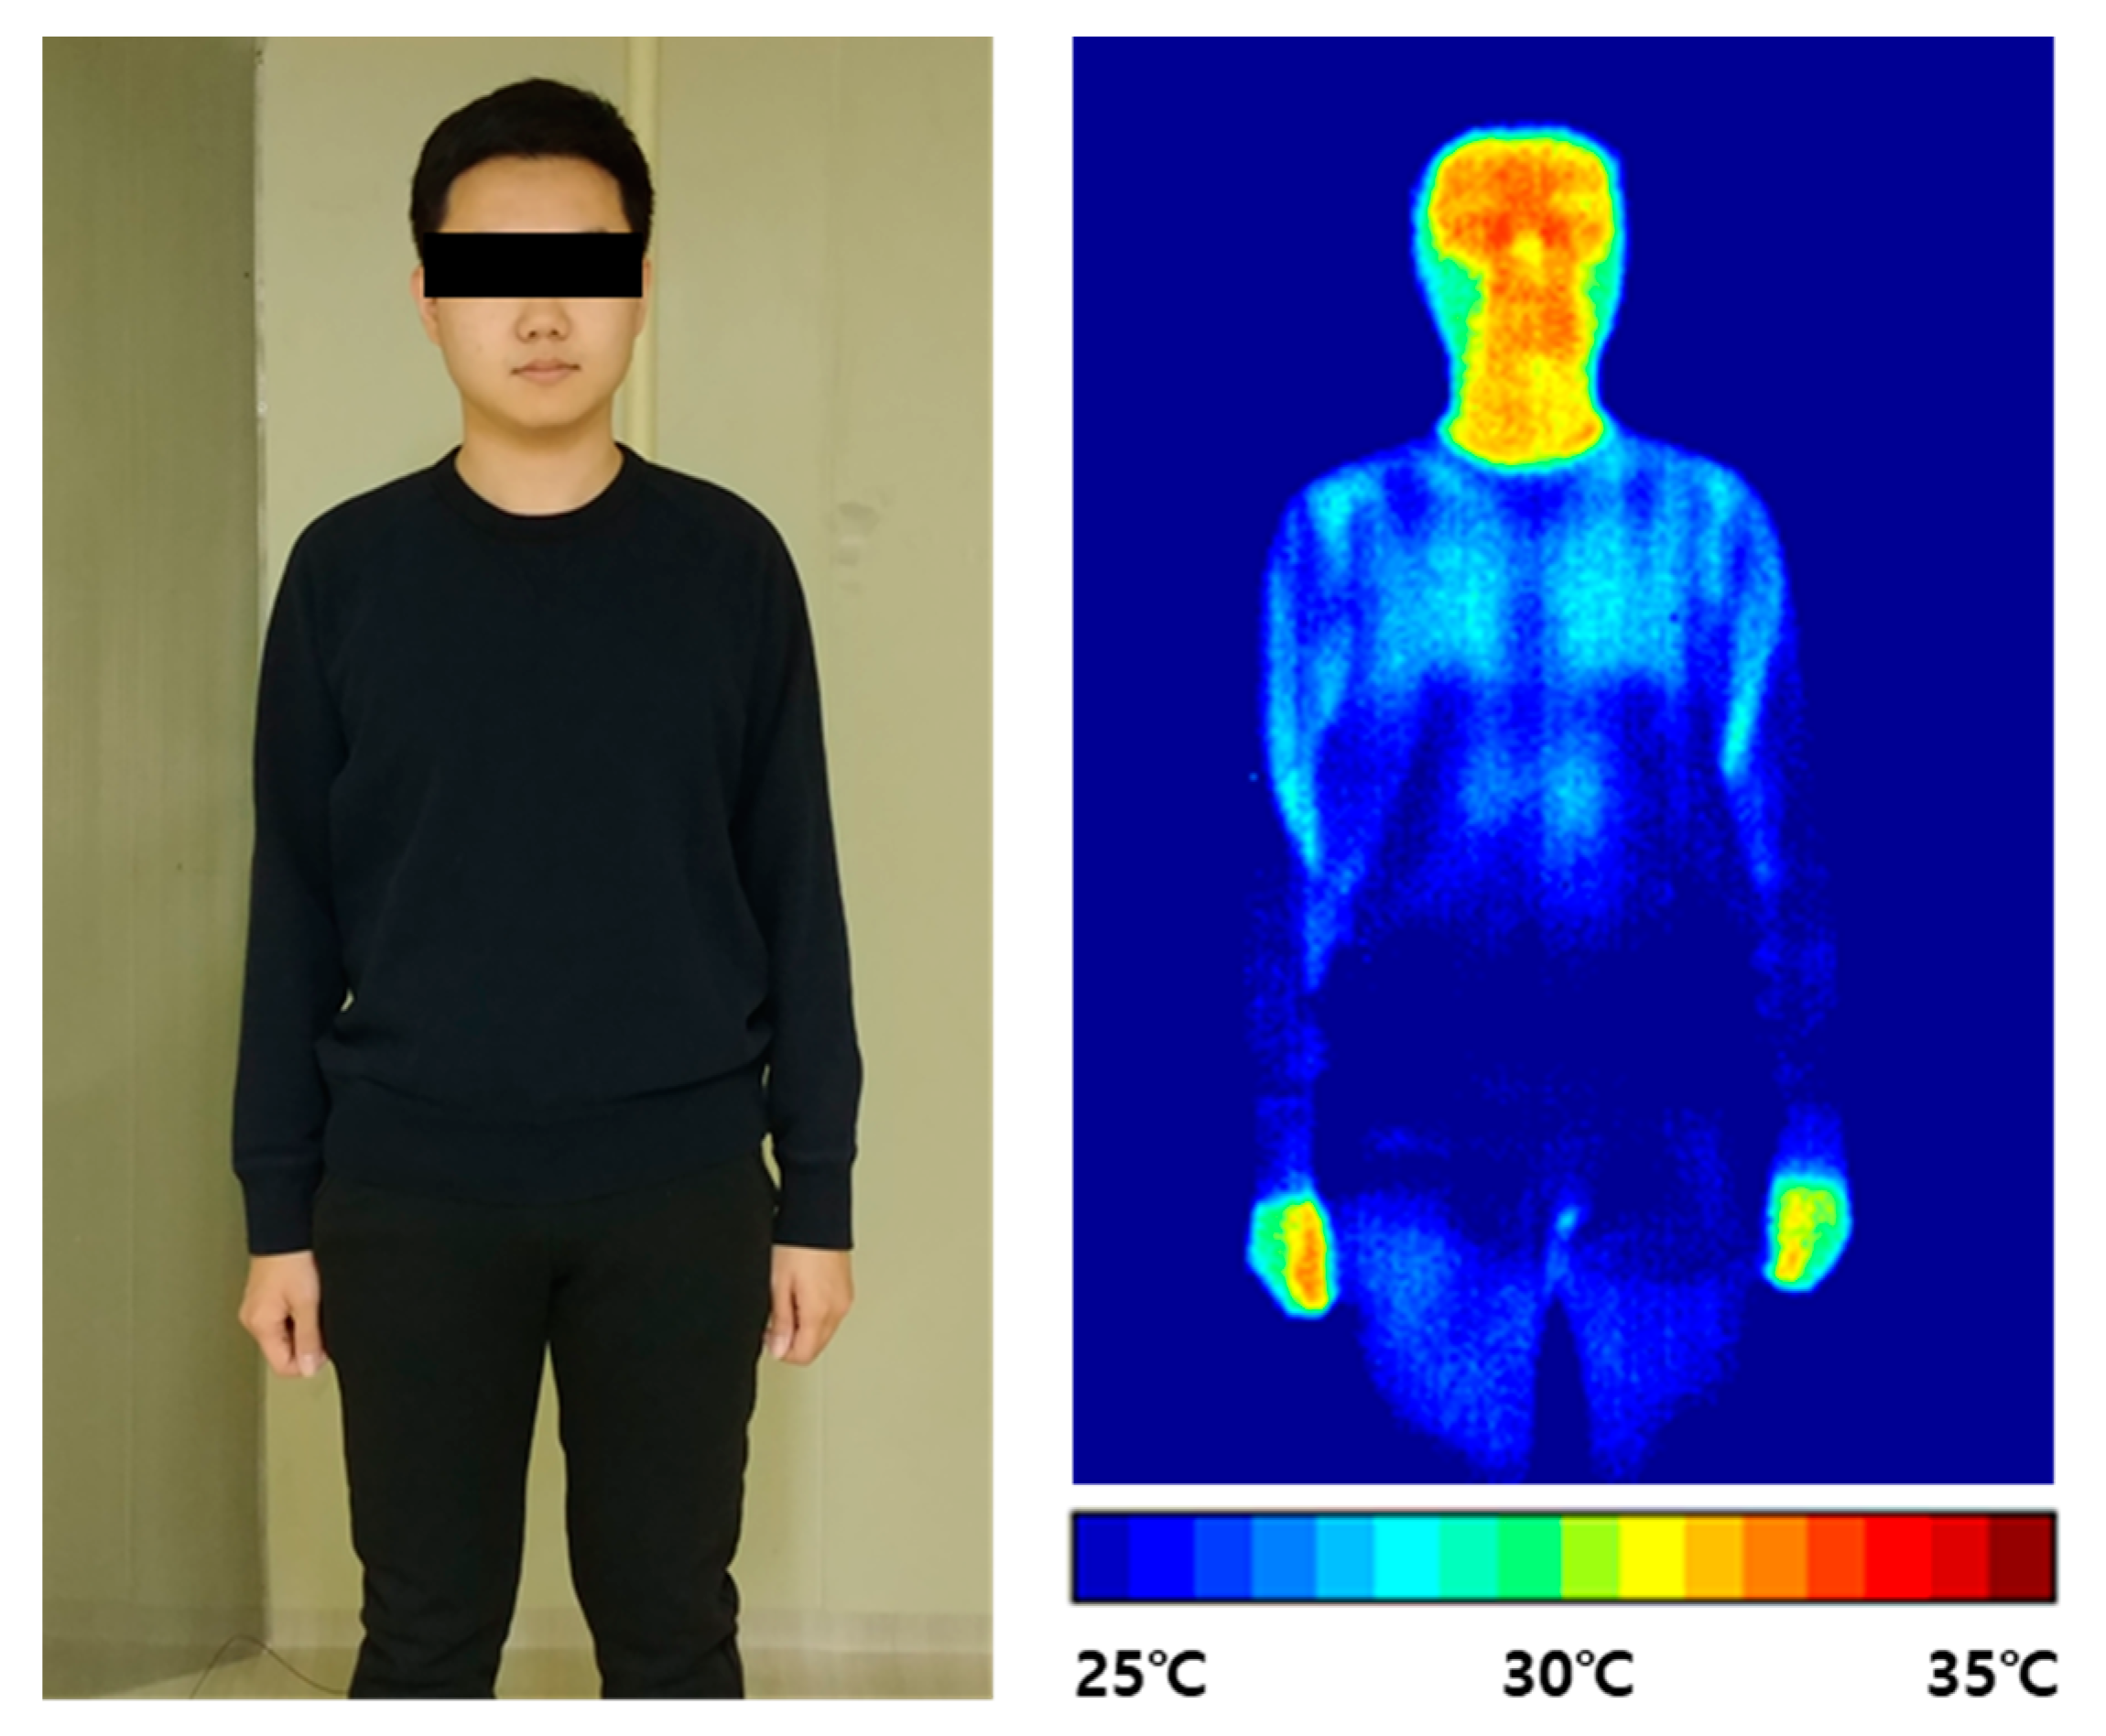
  • To determine the temperatures of the skin and clothing surface, the temperature of the human body was measured using an IR camera. Theoretically, to calculate the thermoregulation model, we only need to know the temperatures of several parts of the human body. Therefore, we measured the skin temperature at the forehead, the top clothing temperature at the chest, and the bottom clothing temperature at the thigh. These measurements were easily performed using the IR camera, and it was easy to extract stable values from the experiment. The skin temperature inside the clothing was predicted using the human thermoregulation model.
  • The human thermoregulation model was simulated using Ta, MRT, RH, V, the assumed clo, and Met.
  • The human thermoregulation model was used to calculate the sensible heat loss from the skin. In the Fanger model, the sensible heat loss from the skin ( C + R in Equation (4)) was calculated using the method specified in Annex D of ISO 7730. In the Tanabe model, the sensible heat loss from the skin ( Q t in Equation (5)) of each body part was calculated.
  • In each prediction model, the skin and clothing temperatures of each part were calculated using the sensible heat loss from the skin.
  • The calculated skin and clothing temperatures of each part were compared with the measured temperature from step a. If a difference was found between the two temperatures, the clo level from step b was modified, and the calculation was performed again.
  • The calculations of steps b–e were repeated to determine the clo level at which the predicted skin temperature and measured temperature of each part were equal. The identified clo levels were those evaluated using the Fanger and Tanabe models.
Because this study focused on the method for evaluating the clo level using thermoregulation models, differences in the characteristics of the human thermoregulation models were not considered.

3. Experiments for Evaluating Clothing Insulation

3.1. Outline

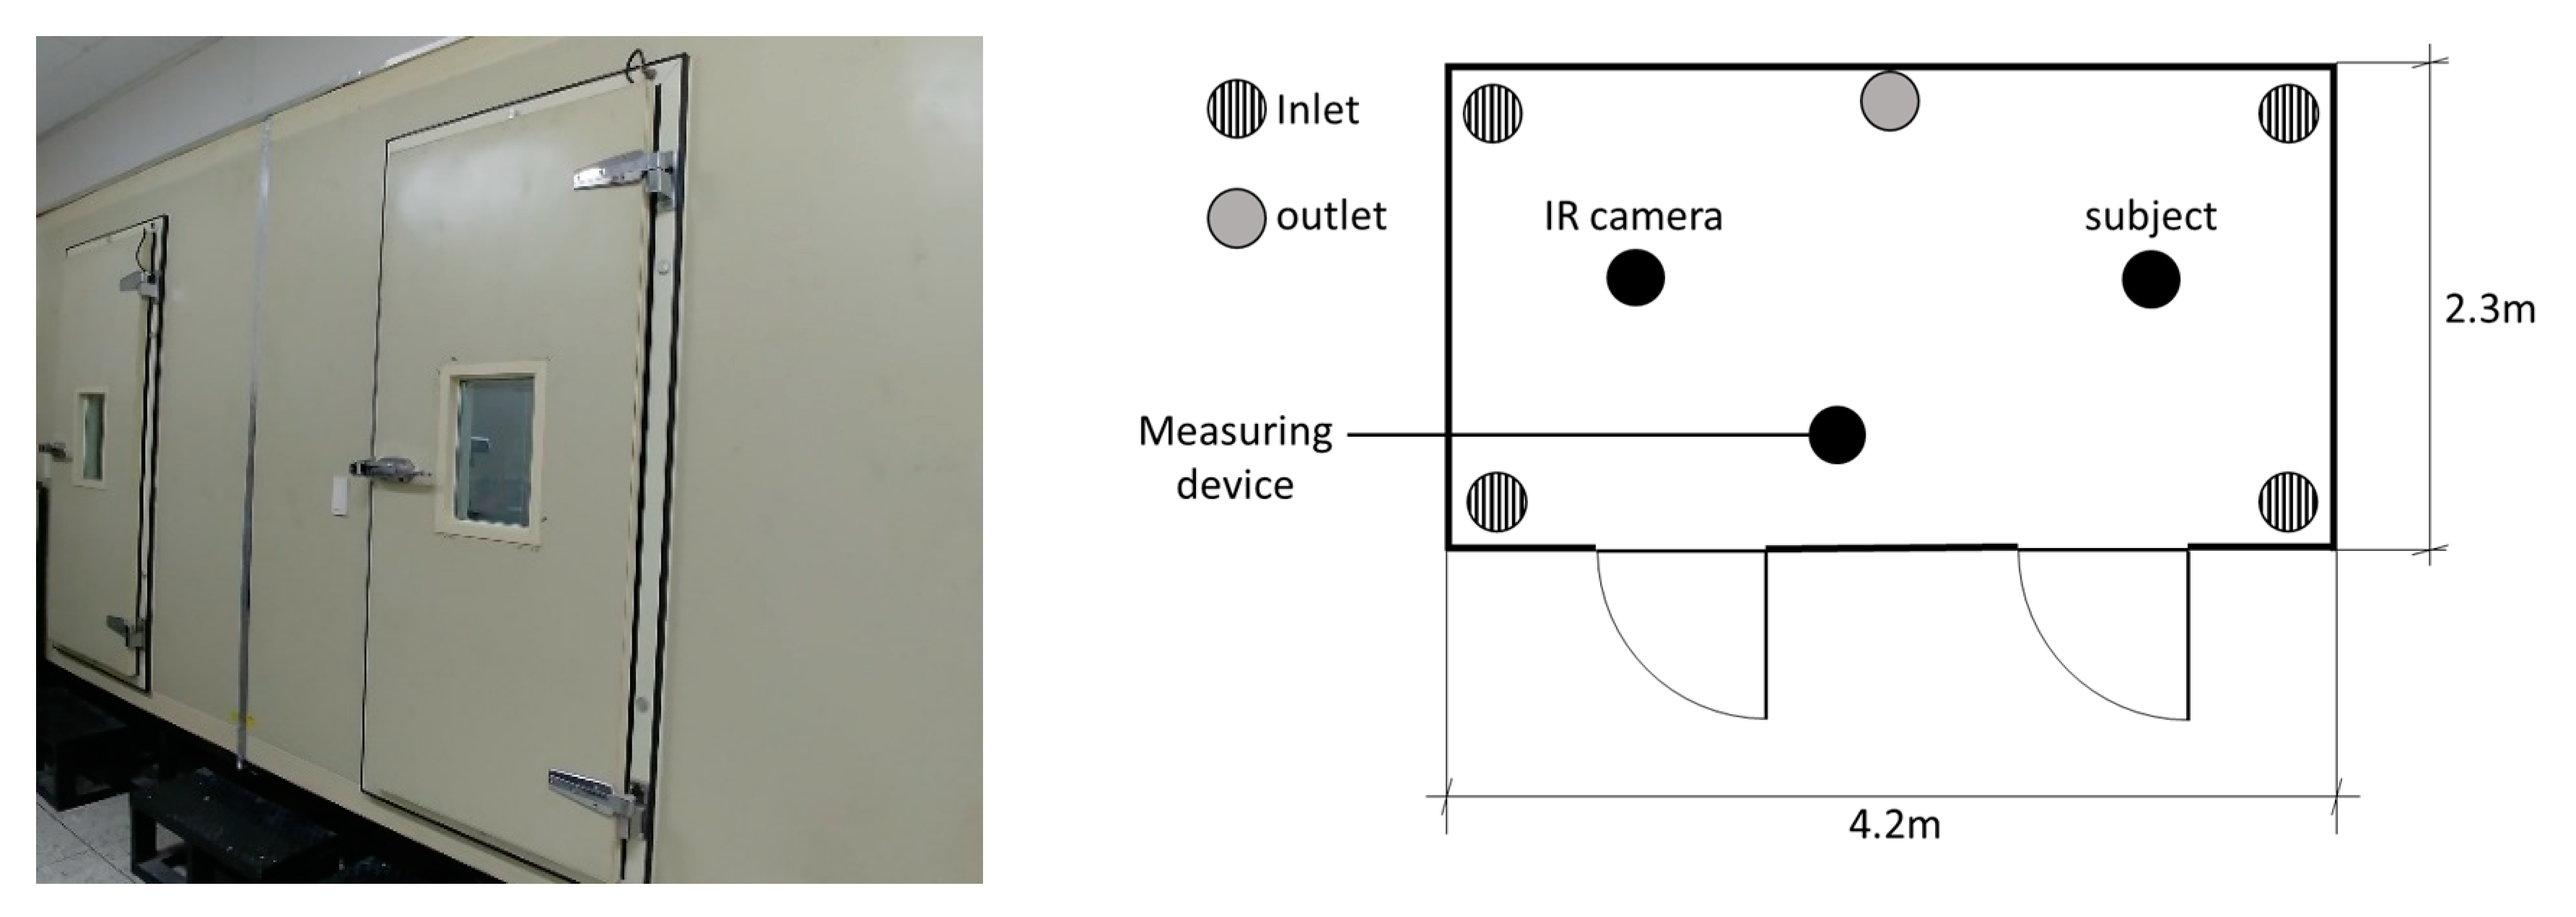
3.1.1. Climate Chamber

Experiments were performed in a climate chamber located at Yonsei University, Seoul, Korea to evaluate the prediction models. As shown in Figure 3, the dimensions of the climate chamber were 4.2 (length) × 2.3 (width) × 2.1 m (height). The temperature could be controlled from 0 to 60 (±1 ), and the RH could be controlled from 1% to 99% (±10%). The wind speed inside the chamber was maintained below 0.1 m/s, and the difference in the air temperature between the heights of the head (1.7 m) and feet (0.1 m) of the subject did not exceed 3 . The location of the subject and the measuring device inside the climate chamber are shown in Figure 3.

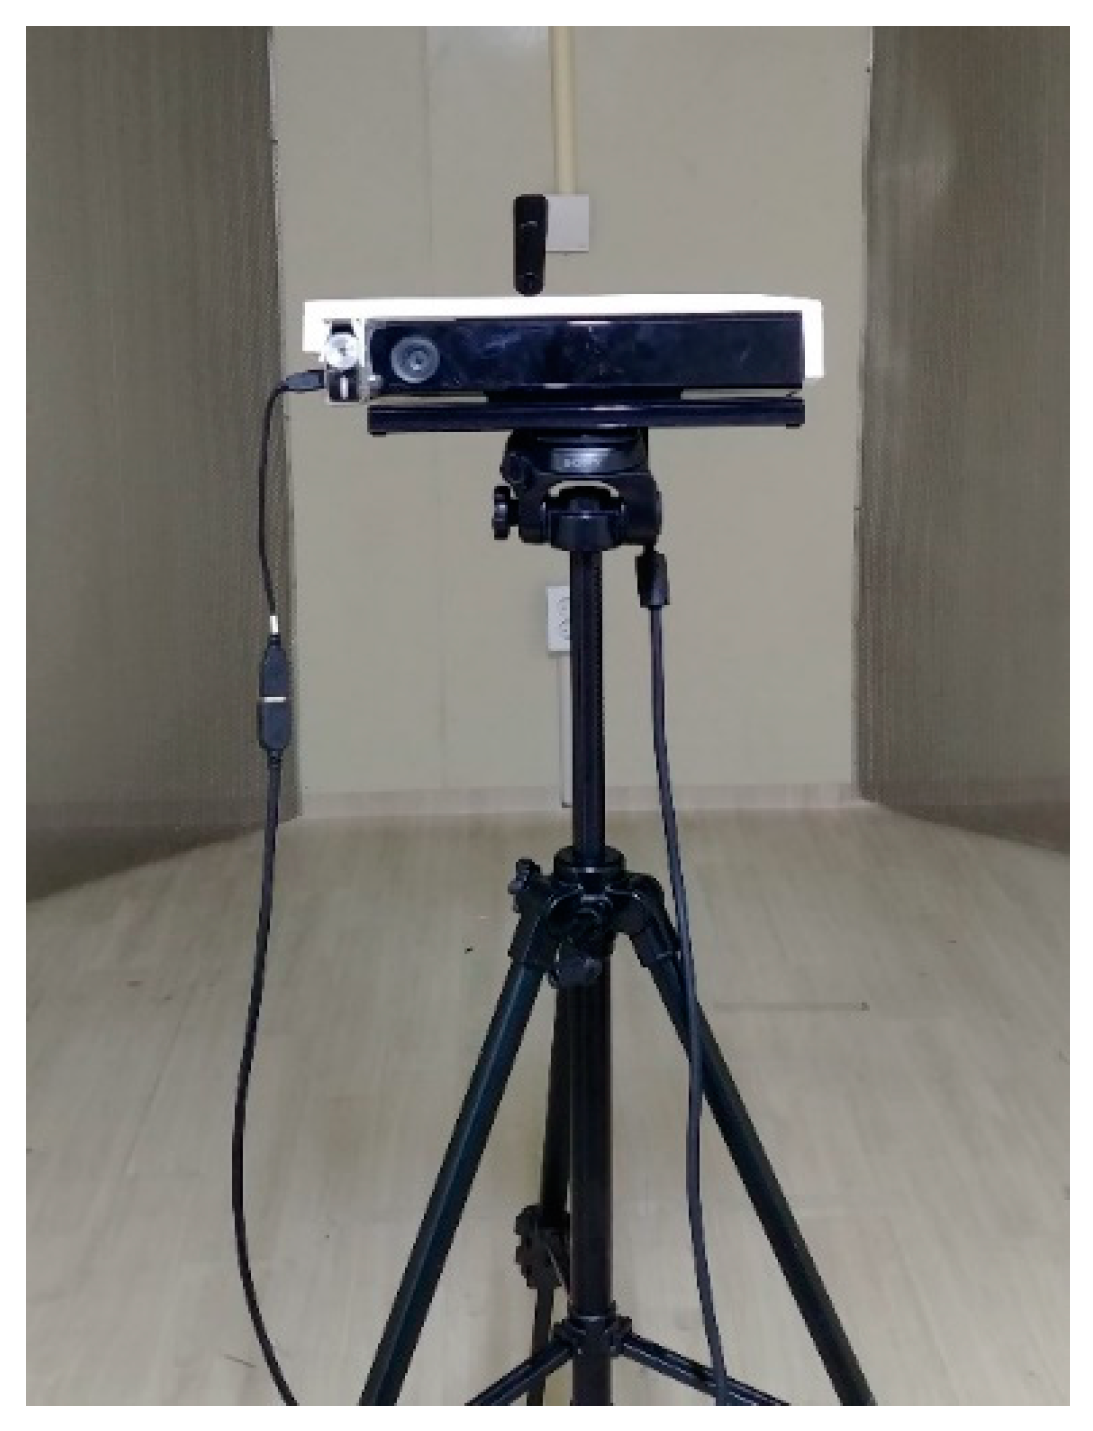
3.1.2. Experimental Equipment

The environmental conditions of the climate chamber (air temperature, MRT, RH, and air velocity) were measured using a Testo 480 (TESTO, Inc., West Chester, PA, USA). The temperatures of the skin (forehead) and the top and bottom clothing surfaces (chest and thigh, respectively) were measured using an IR camera (Thermal Expert TE-Q1, i3system, Inc., Daejeon, Korea). The IR camera used in the experiments is shown in Figure 4. Table 1 presents details regarding the equipment used in the experiments.

3.1.3. Evaluation of Clo Level for Clothes Used in Experiment According to ASTM F1291

The clo level used in the experiments was precisely determined for verifying the accuracy of the evaluation method using the IR camera and the human thermoregulation model. The clothing used in the experiments was evaluated according to the procedure prescribed in ASTM F1291. In this study, a 20-zone movable sweating thermal manikin (MTNW, Seattle, WA, USA) was used. In addition, the clothing used in the experiments were suitable for winter (briefs, undershirts, thick sweatshirts, and thick sweatpants, 22 and 50% RH).
As shown in Figure 5, the clo levels of the experimental clothing ensembles were assessed four times using the thermal manikin. The total clo value was 0.94 clo in winter. The standard deviations of the results of the thermal-manikin experiments for clothing ensembles were very small: 0.003 clo. In previous studies [35,36], occupants wore clothing of <1.0 clo during the winter. Therefore, in the present study, experiments were performed with a clothing ensemble having a relatively low clo level (<1.0 clo).

3.1.4. Experimental Procedure

The IR camera and the human thermoregulation model were used to evaluate the clo levels of the subjects. All the subjects in the experiment were healthy people in the age range of 20–29 years and participated in the experiment voluntarily. Information regarding the subjects is presented in Table 2. The experiments involving the subjects were approved by the Institutional Review Board of Yonsei University. The procedures related to the experiment are presented below:
  • The subject wore winter clothing in the climate chamber and was given 10 min to adapt to the winter conditions.
  • After the 10 min of adaptation, the subject assumed a standing posture and relaxed for 20 min while looking at the front of the IR camera.
  • The temperatures of the skin (forehead) and clothing surface (chest and thigh) were measured using the IR camera.
During the experiments, the PMV in the chamber was controlled within ±0.5, so that the surface temperatures of the skin and clothing were not affected by the unpleasant hot or cold environments.
The skin temperatures are affected by the ambient thermal condition with a certain level of time lag, which seems naturally occurred based on the physiological thermoregulation principle. Therefore, it is important to keep a sufficient time length per designed thermal condition. Choi and Yeom [37,38] and Lee et al. [39] recently determined 10–20 min as the time required to adapt subjects to thermal conditions in thermal comfort experiments. In addition, to measure the stable skin temperature of a person at rest using thermographic images, 10 min of acclimatization is needed [40]. Bach et al. [41] and Buono et al. [42] performed acclimation for 10–20 min prior to measuring the skin temperatures using IR cameras. In the present study, 10 min of acclimatization was employed to measure the stable skin temperature at rest using the thermographic images.
The IR camera measured the skin and clothing surface temperatures of a subject every 10 s at an angle of 90° and a distance of 1.8 m from the front of the subject. The temperature and RH of the chamber were measured at heights of 0.1, 1.1, and 1.7 m every 10 s. Figure 6 shows the images of a subject obtained using the IR camera.

3.2. Prediction Models for Evaluating Clothing Insulation

Figure 7 shows the measured skin and clothing surface temperatures used in the prediction models. The clothing surface temperature showed a maximum difference of >1 at the measurement points. Therefore, the top and bottom clothing temperatures at nine adjacent points were measured. The median of the nine measured temperatures was applied to the prediction model to reduce the errors at the measurement points.
Among the various human thermoregulation models, four prediction models were developed. Models 1 and 2 were based on the Fanger model, and Models 3 were 4 are based on the Tanabe model. Models 1 and 3 used only the skin and top clothing temperatures; the bottom clothing temperatures were not measured owing to situations where the occupants were seated or an obstacle, such as a table, was located between the occupant and the IR camera. Models 2 and 4 considered the bottom clothing temperatures. In Model 2, the area-weighted average temperature of the top and bottom clothing was used. In Model 3, the clo levels were evaluated using the skin and top clothing temperatures.

4. Results and Discussion

4.1. Results of Experiments

Table 3 and Table 4 show the environmental conditions and results of the experiments. In all the experiments, the RH inside the climate chamber was maintained at 50%, and the air velocity was also kept lower than 0.1 m/s. As shown in the results, the temperatures of the skin (forehead), top clothing (chest), and bottom clothing (thigh) were similar in the winter. In addition, the top clothing temperatures were higher than the bottom clothing temperatures.

4.2. Four Clo Prediction Models

The clo level in the winter was calculated by applying the measured data to each prediction model. As shown in Figure 8, the result was 0.89 clo for Model 1 and this was similar to the thermal-manikin measurement (0.94 clo). For Model 2, 1.20 clo was achieved. Even though the same Fanger model was applied, the result of Model 2 exhibited a larger difference from the manikin measurements than those of Model 1. This may be caused by the temperature of the bottom clothing. Because the temperature difference of each body part is not considered in the Fanger model, the area-weighted average temperature of the top and bottom clothing measured using the IR camera was used. The experimental results indicate that the bottom clothing temperature was slightly lower than the top clothing temperature. Therefore, the average temperature was lower than the top clothing temperature. This lower estimated temperature led to a higher clo level, in accordance with Equation (4). According to the calculation result of Model 3, the predicted clo value was similar to the measurement. Similar results were observed for Model 4. Therefore, the predicted values from the models based on the Tanabe model showed a good agreement with the manikin measurements.

5. Discussion

The prediction models presented in the study exhibited accurate clo levels for the winter. In addition, the predicted results tended to be higher than the results of the manikin experiment. Similar results were obtained in previous studies. In the study of Konarska et al. [6], the clo level obtained from an experiment with a human body was higher than that obtained via a thermal-manikin measurement. The measurement with a human body conducted by Lee et al. [12] yielded similar results. The clo levels obtained through measurements with a human body in previous studies and the present study are shown in Figure 9. The similar trends of the present study and the previous studies indicate that the air layers between clothes significantly affect the clo level. Lee et al. [12] performed an experiment with air layers of three different thicknesses. Moreover, Mert et al. [43] demonstrated that the clo level can be affected by the presence and shape of the air layer between clothes. The air layer between the clothing layers depends on the characteristics of the clothing [44], the physical characteristics of the human body, and the posture of the individual [45]. In addition, demographic differences, gender, and ethnicity can also lead to clo level differences.
While the thickness and shape of the air layer between clothes is assumed to be distributed uniformly (left part of Figure 10), the air layer is formed irregularly in reality (right part of Figure 10). The results of the present study indicate that the shape and thickness of the air layer depended on the body shape and clothing conditions. Considering the obtained results, the thermal insulation from the enclosed air layer should be considered in evaluating the thermal insulation of the clothing level.
In addition, the emissivity factor of the IR camera was 0.98 in this study. This value is the emissivity factor for human skin [46], slightly different from 0.90 to 0.98 for typical fabrics [47,48]. Furthermore, the emissivity for clothing may vary depending on the color. However, it is difficult to apply different emissivity factors in real time to skin and clothing in one IR camera, therefore we fixed the emissivity as stated above. To improve the prediction accuracy of the method in the future, it is necessary to distinguish between skin and clothing and clothing color and apply different emissivity factors.

6. Conclusions

This study performed clo level measurements using an IR camera and the measured data were applied to two thermoregulation models to compare the accuracy of these models. The skin and clothing temperatures using an IR camera under specific conditions from eight subjects were measured. With the measurement data, the clo level was predicted using four models (Models 1 and 2 were based on the Fanger model, and Models 3 and 4 were based on the Tanabe model) and the results were compared. On the basis of our findings, the following conclusions are drawn:
(1)
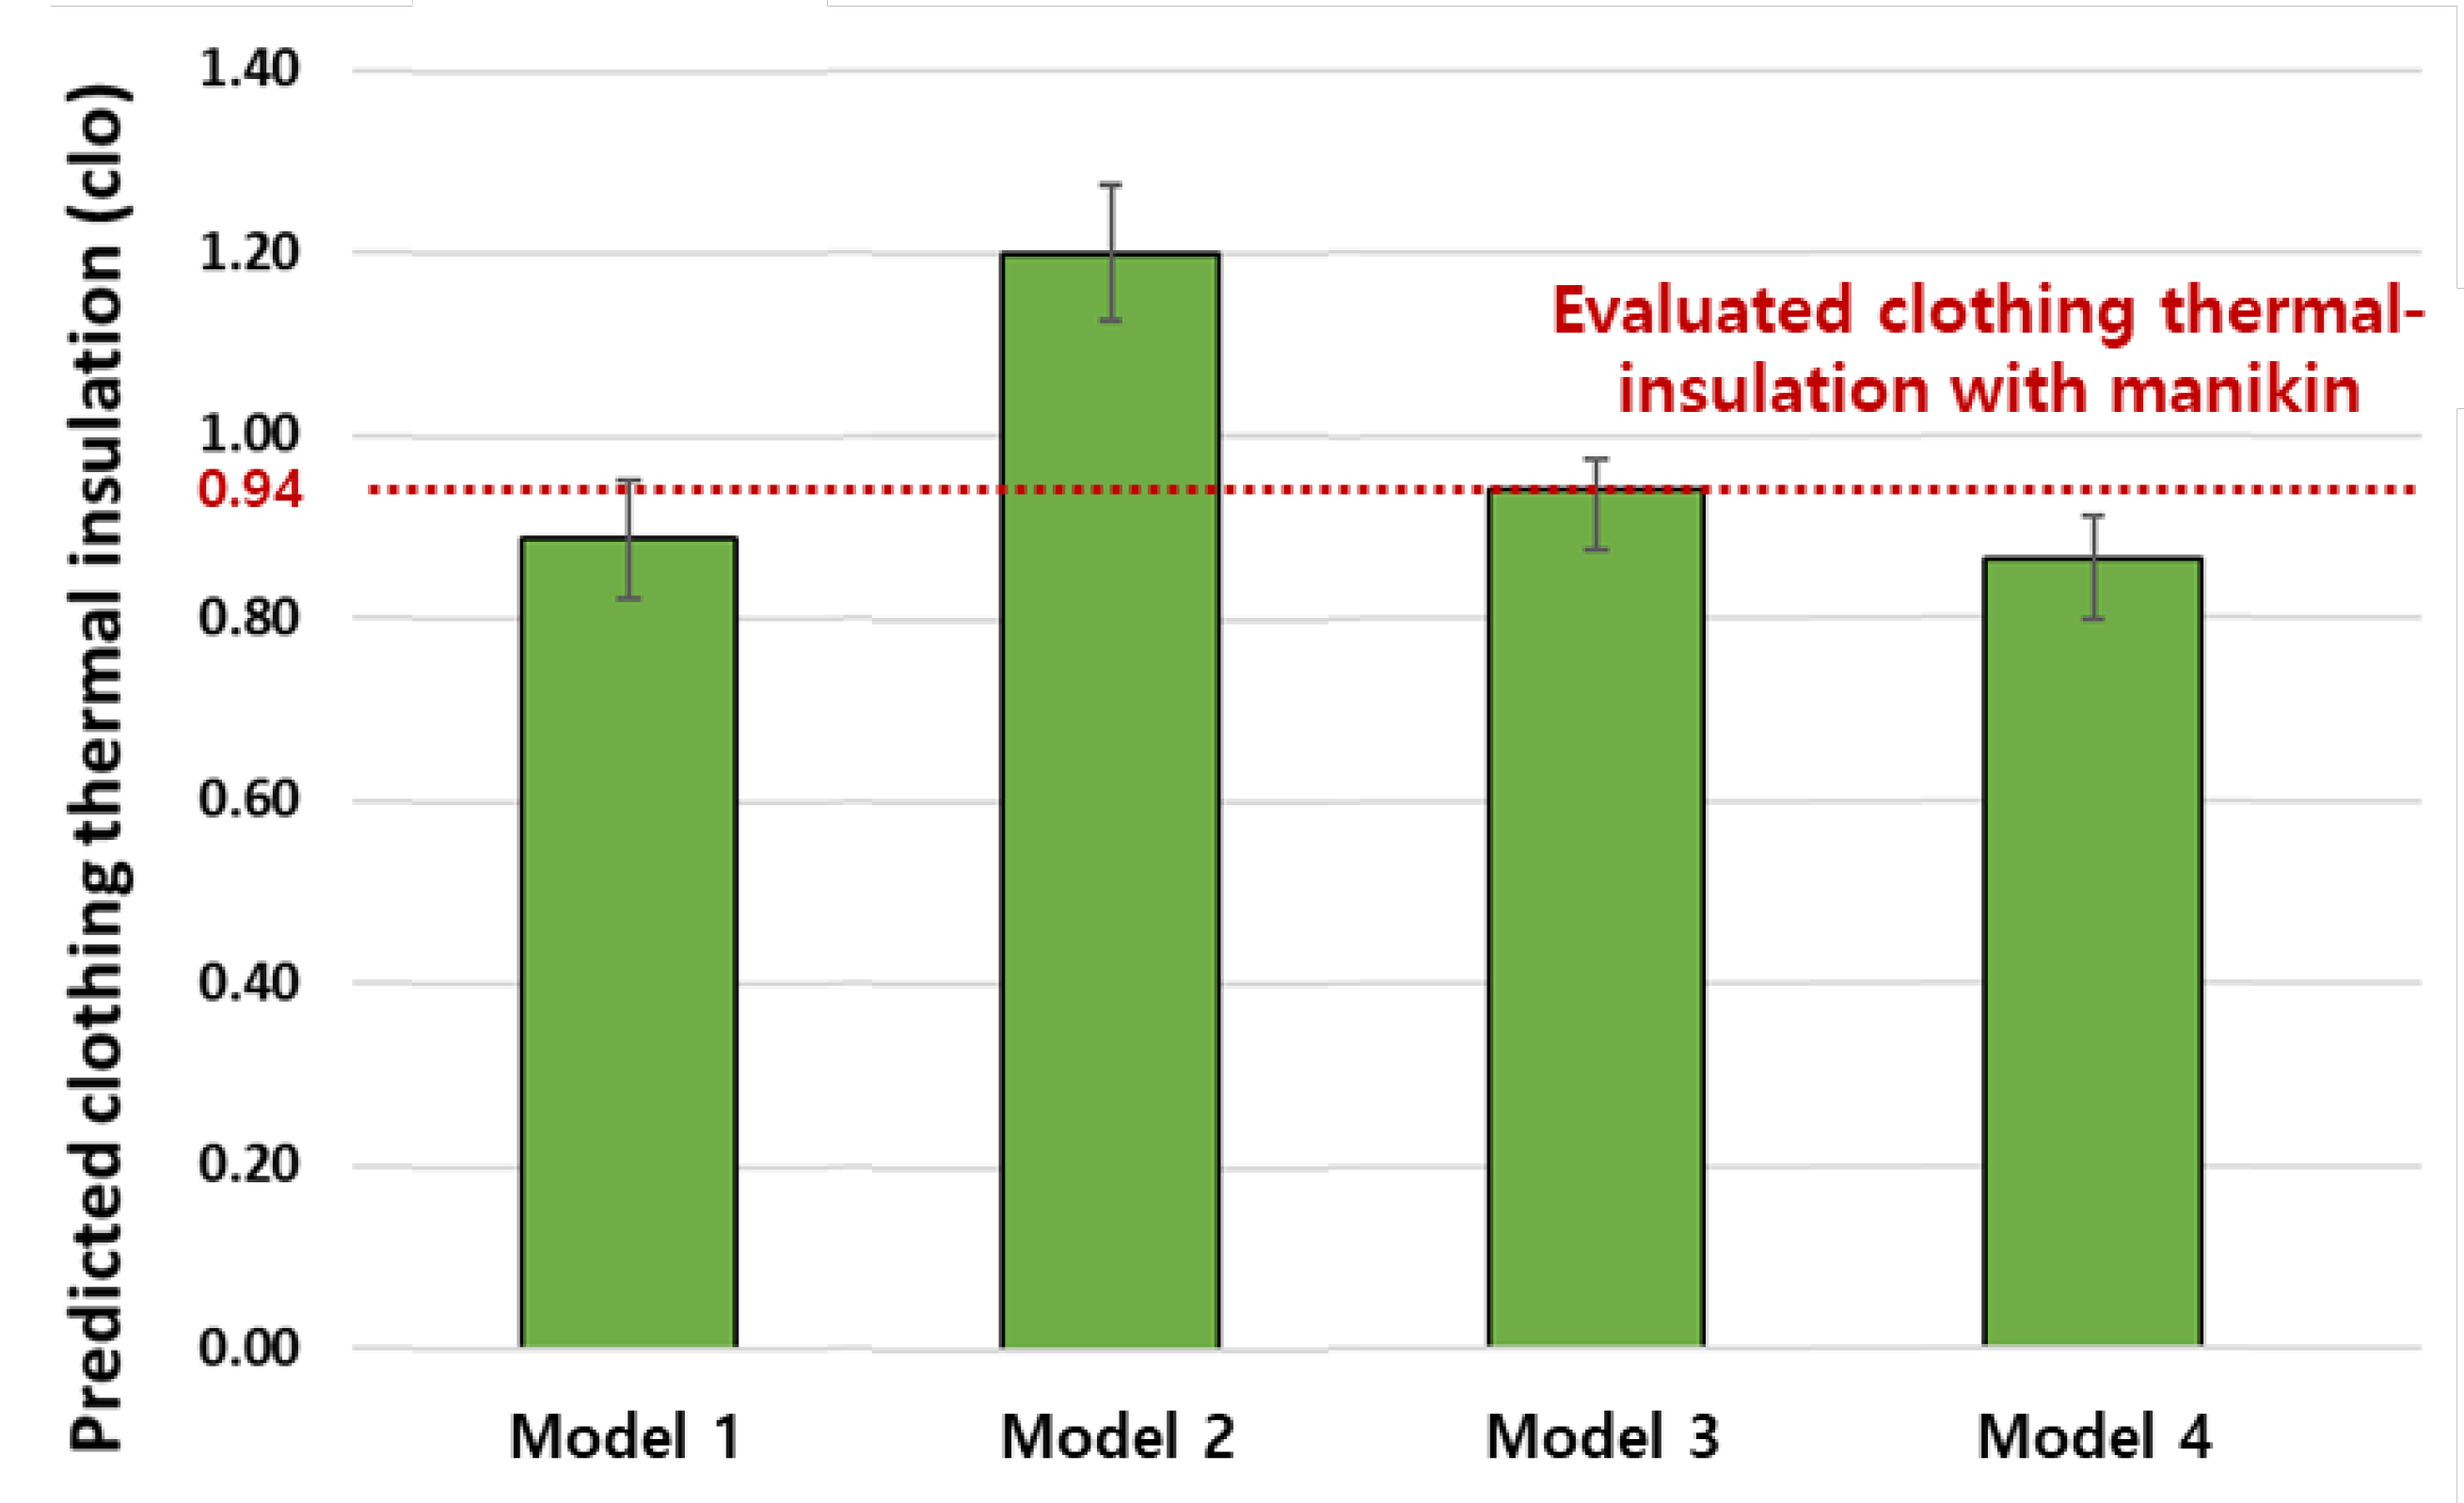
When skin temperature and top clothing temperature were used as input data, Model 3 predicted clo level better than Model 1. Model 4 also predicted clo level better than Model 2 when skin temperature and top and bottom clothing temperatures were used. As shown in the comparison results of two models, the clo levels predicted by the Tanabe model were closer to the manikin measurements than the Fanger models. Thus, the Tanabe model exhibited better prediction results than the Fanger model. The multi-node thermoregulation model (Tanabe model) was superior for predicting the sensible heat loss from the skin of each body part.
(2)
Regardless of the thermoregulation model used, the high clo level for winter clothing was well predicted. In particular, the predicted values of Model 3 using the Tanabe model were similar to measurement values obtained using a mannequin. In addition, prediction models yielded somewhat higher clo levels than traditional methods.
By measuring the clo level of occupants in a non-contact manner, the predicted clo level may be less accurate than the existing clo-level evaluation method using the mannequin. However, it is meaningful in that it enables real-time prediction, which is impossible with the conventional method. Moreover, the outcome of the present study can be adopted for maintaining thermal comfort using an HVAC automatic control.
Further research will examine the clo levels by varying the thickness and surface colors of clothing with respect to the enclosed air layer in thin clothing and the emissivity effect, respectively. In addition, the experiment will be carried out with male and female participants. In this preliminary study, women were excluded from the experiment to eliminate the complexity and uncertainty caused by bras. In the future, it will be necessary to conduct the experiment with women.

Author Contributions

Conceptualization, H.K. and T.K.; methodology, K.L.; writing—original draft preparation, K.L.; writing—review and editing, H.C. and D.D.K.; supervision, T.K. All authors have read and agreed to the published version of the manuscript.

Funding

This research was supported by the Basic Science Research Program through the National Research Foundation of Korea (NRF) funded by the Ministry of Science and ICT (NRF-2017R1A2B3012914). It was also supported by the Korea Institute of Energy Technology Evaluation and Planning (KETEP) and the Ministry of Trade, Industry & Energy (MOTIE) of the Republic of Korea (No. 20174010201320).

Conflicts of Interest

The authors declare no conflict of interest.

References

  1. Dounis, A.I.; Caraiscos, C. Advanced control systems engineering for energy and comfort management in a building environment—A review. Renew. Sustain. Energy Rev. 2009, 13, 1246–1261. [Google Scholar] [CrossRef]
  2. Ashrae Standard. Standard 55-2017—Thermal Environmental Conditions for Human Occupancy; ASHRAE Inc.: Tullie Circle, NE, USA, 2017; pp. 9–11. [Google Scholar]
  3. Iso, E. Ergonomics of the thermal Environment-Analytical determination and interpretation of thermal comfort using calculation of the PMV and PPD indices and local thermal comfort criteria. Management 2005, 3, e615. [Google Scholar]
  4. Newsham, G.R. Clothing as a thermal comfort moderator and the effect on energy consumption. Energy Build. 1997, 26, 283–291. [Google Scholar] [CrossRef]
  5. Lee, K.; Schiavon, S. Influence of three dynamic predictive clothing insulation models on building energy use, HVAC sizing and thermal comfort. Energies 2014, 7, 1917–1934. [Google Scholar] [CrossRef]
  6. Konarska, M.; Sołtynski, K.; Sudoł-Szopińska, I.; Chojnacka, A. Comparative evaluation of clothing thermal insulation measured in a thermal manikin and on volunteers. Fibres Text. East. Eur. 2007, 15, 73–79. [Google Scholar]
  7. Olesen, B.; Nielsen, R. Thermal insulation of clothing measured on a movable thermal manikin and on human subjects. ECSC Programme Res. 1983, 7206, 914. [Google Scholar]
  8. McCullough, E.A.; Jones, B.W.; Huck, J. A comprehensive data base for estimating clothing insulation. ASHRAE Trans. 1985, 91, 29–47. [Google Scholar]
  9. De Carli, M.; Olesen, B.W.; Zarrella, A.; Zecchin, R. People’s clothing behaviour according to external weather and indoor environment. Build. Environ. 2007, 42, 3965–3973. [Google Scholar] [CrossRef]
  10. Schiavon, S.; Lee, K.H. Dynamic predictive clothing insulation models based on outdoor air and indoor operative temperatures. Build. Environ. 2013, 59, 250–260. [Google Scholar] [CrossRef] [Green Version]
  11. Matsumoto, H.; Iwai, Y.; Ishiguro, H. Estimation of Thermal Comfort by Measuring Clo Value without Contact. In Proceedings of the MVA2011 IAPR Conference on Machine Vision Applications, Nara, Japan, 13–15 June 2011; pp. 491–494. [Google Scholar]
  12. Lee, J.H.; Kim, Y.K.; Kim, K.S.; Kim, S. Estimating clothing thermal insulation using an infrared camera. Sensors 2016, 16, 341. [Google Scholar] [CrossRef] [Green Version]
  13. Fanger, P.O. Thermal Comfort: Analysis and Applications in Environmental Engineering; Danish Technical Press: Copenhagen, Denmark, 1970; p. 244. [Google Scholar]
  14. Tanabe, S.I.; Kobayashi, K.; Nakano, J.; Ozeki, Y.; Konishi, M. Evaluation of thermal comfort using combined multi-node thermoregulation (65MN) and radiation models and computational fluid dynamics (CFD). Energy Build. 2002, 34, 637–646. [Google Scholar] [CrossRef] [Green Version]
  15. International Organization for Standardization. ISO15831:2004 Clothing—Physiological Effects—Measurement of Thermal Insulation by Means of a Thermal Manikin; ISO. Vernier: Geneva, Switzerland, 2004. [Google Scholar]
  16. American Society of Testing and Materials International (ASTM). Standard Test Method for Measuring the Thermal Insulation of Clothing Using a Heated Manikin; Standard, F1291-10; ASTM International: West Conshohocken, PA, USA, 2010. [Google Scholar]
  17. Havenith, G.; Holmér, I.; Parsons, K. Personal factors in thermal comfort assessment: Clothing properties and metabolic heat production. Energy Build. 2002, 34, 581–591. [Google Scholar] [CrossRef]
  18. Fanger, P. Calculation of thermal comfort, Introduction of a basic comfort equation. ASHRAE Trans. 1967, 73, III4.1–III4.20. [Google Scholar]
  19. ASHRAE. Chapter 9 Thermal Comfort. ASHRAE Handbook-Fundamentals; ASHRAE Inc.: Atlanta, GA, USA, 2017. [Google Scholar]
  20. Givoni, B.; Goldman, R.F. Predicting metabolic energy cost. J. Appl. Physiol. 1971, 30, 429–433. [Google Scholar] [CrossRef]
  21. Gagge, A.P.; Stolwijk, J.A.J.; Nishi, Y. Effective temperature scale based on a simple model of human physiological regulatory response. ASHRAE Trans. 2017, 77, 247–263. [Google Scholar]
  22. Gagge, A.P. A two node model of human temperature regulation in FORTRAN. In Bioastronautics Data, 2nd ed.; Parker, J.F., Jr., West, V.R., Eds.; NASA Special Publication: Washington, DC, USA, 1973; pp. 142–148. [Google Scholar]
  23. Jones, B. Transient interaction between the human and the thermal environment. ASHRAE Trans. 1992, 98, 189–195. [Google Scholar]
  24. Takada, S.; Kobayashi, H.; Matsushita, T. Thermal model of human body fitted with individual characteristics of body temperature regulation. Build. Environ. 2009, 44, 463–470. [Google Scholar] [CrossRef] [Green Version]
  25. Cheng, Y.; Niu, J.; Gao, N. Thermal comfort models: A review and numerical investigation. Build. Environ. 2012, 47, 13–22. [Google Scholar] [CrossRef]
  26. Huizenga, C.; Hui, Z.; Arens, E. A model of human physiology and comfort for assessing complex thermal environments. Build. Environ. 2001, 36, 691–699. [Google Scholar] [CrossRef] [Green Version]
  27. Fiala, D.; Lomas, K.J.; Stohrer, M. A computer model of human thermoregulation for a wide range of environmental conditions: The passive system. J. Appl. Physiol. 1999, 87, 1957–1972. [Google Scholar] [CrossRef]
  28. Fiala, D.; Lomas, K.J.; Stohrer, M. Computer prediction of human thermoregulatory and temperature responses to a wide range of environmental conditions. Int. J. Biometeorol. 2001, 45, 143–159. [Google Scholar] [CrossRef] [PubMed]
  29. Stolwijk, J.A. A Mathematical Model of Physiological Temperature Regulation in Man; NASA: Washington, DC, USA, 1971. [Google Scholar]
  30. Salloum, M.; Ghaddar, N.; Ghali, K. A new transient bioheat model of the human body and its integration to clothing models. Int. J. Therm. Sci. 2007, 46, 371–384. [Google Scholar] [CrossRef]
  31. Li, D.; Menassa, C.C.; Kamat, V.R. Non-intrusive interpretation of human thermal comfort through analysis of facial infrared thermography. Energy Build. 2018, 176, 246–261. [Google Scholar] [CrossRef]
  32. Cosma, A.C.; Simha, R. Thermal comfort modeling in transient conditions using real-time local body temperature extraction with a thermographic camera. Build. Environ. 2018, 143, 36–47. [Google Scholar] [CrossRef]
  33. Metzmacher, H.; Wölki, D.; Schmidt, C.; Frisch, J.; van Treeck, C. Real-time human skin temperature analysis using thermal image recognition for thermal comfort assessment. Energy Build. 2018, 158, 1063–1078. [Google Scholar] [CrossRef]
  34. Cosma, A.C.; Simha, R. Machine learning method for real-time non-invasive prediction of individual thermal preference in transient conditions. Build. Environ. 2019, 148, 372–383. [Google Scholar] [CrossRef]
  35. Ning, H.; Wang, Z.; Ji, Y. Thermal history and adaptation: Does a long-term indoor thermal exposure impact human thermal adaptability? Appl. Energy 2016, 183, 22–30. [Google Scholar] [CrossRef]
  36. Bae, C.; Chun, C. Research on seasonal indoor thermal environment and residents’ control behavior of cooling and heating systems in Korea. Build. Environ. 2009, 44, 2300–2307. [Google Scholar] [CrossRef]
  37. Choi, J.H.; Yeom, D. Development of the data-driven thermal satisfaction prediction model as a function of human physiological responses in a built environment. Build. Environ. 2019, 150, 206–218. [Google Scholar] [CrossRef]
  38. Choi, J.H.; Yeom, D. Investigation of the relationships between thermal sensations of local body areas and the whole body in an indoor built environment. Energy Build. 2017, 149, 204–215. [Google Scholar] [CrossRef]
  39. Lee, K.; Choi, H.; Choi, J.H.; Kim, T. Development of a Data-Driven Predictive Model of Clothing Thermal Insulation Estimation by Using Advanced Computational Approaches. Sustainability 2019, 11, 5702. [Google Scholar] [CrossRef] [Green Version]
  40. Marins, J.C.B.; Moreira, D.G.; Cano, S.P.; Quintana, M.S.; Soares, D.D.; de Andrade Fernandes, A.; da Silva, F.S.; Costa, C.M.A.; dos Santos Amorim, P.R. Time required to stabilize thermographic images at rest. Infrared Phys. Technol. 2014, 65, 30–35. [Google Scholar] [CrossRef] [Green Version]
  41. Bach, A.J.E.; Stewart, I.B.; Disher, A.E.; Costello, J.T. A comparison between conductive and infrared devices for measuring mean skin temperature at rest, during exercise in the heat, and recovery. PLoS ONE 2015, 10, e0117907. [Google Scholar] [CrossRef] [Green Version]
  42. Buono, M.J.; Jechort, A.; Marques, R.; Smith, C.; Welch, J. Comparison of infrared versus contact thermometry for measuring skin temperature during exercise in the heat. Physiol. Meas. 2007, 28, 855–859. [Google Scholar] [CrossRef] [PubMed]
  43. Mert, E.; Psikuta, A.; Bueno, M.-A.; Rossi, R.M. Effect of heterogenous and homogenous air gaps on dry heat loss through the garment. Int. J. Biometeorol. 2015, 59, 1701–1710. [Google Scholar] [CrossRef] [PubMed]
  44. Frackiewicz-Kaczmarek, J. Determination of the Air Gap Thickness and the Contact Area Under Wearing Conditions. Ph.D. Thesis, Université de Haute Alsace-Mulhouse, Mulhouse, France, 2013. [Google Scholar]
  45. Li, X.; Wang, Y.; Lu, Y. Effects of body postures on clothing air gap in protective clothing. J. Fiber Bioeng. Informat. 2011, 4, 277–283. [Google Scholar]
  46. Steketee, J. Spectral emissivity of skin and pericardium. Phys. Med. Biol. 1973, 18, 686. [Google Scholar] [CrossRef]
  47. Anand, S.; Horrocks, A.R. Handbook of Technical Textiles; CRC Press/Woodhead Pub: Boca Raton, FL, USA, 2000. [Google Scholar]
  48. Schleimann-Jensen, A.; Forsberg, K. New test method for determination of emissivity and reflection properties of protective materials exposed to radiant heat. In Performance of Protective Clothing; ASTM International: West Conshohocken, PA, USA, 1986; pp. 376–386. [Google Scholar]
Figure 1. Heat balance between the human body and the surrounding environment, where M is the metabolic rate and W is the external work [19].
Atmosphere 11 00106 g001
Figure 2. Flowchart of the evaluation of the clothing thermal insulation (clo level) using the human thermoregulation model.
Atmosphere 11 00106 g002
Figure 3. Floor plan of the climate chamber.
Atmosphere 11 00106 g003
Figure 4. Infrared (IR) camera used in the experiments.
Atmosphere 11 00106 g004
Figure 5. Evaluation of the clo level using a manikin with winter clothing.
Atmosphere 11 00106 g005
Figure 6. Skin and clothing temperatures measured using the IR camera.
Atmosphere 11 00106 g006
Figure 7. Skin and clothing temperatures used in the prediction models.
Atmosphere 11 00106 g007
Figure 8. Results of the prediction models.
Atmosphere 11 00106 g008
Figure 9. Predicted clothing insulation (four prediction models of the present study, Konarska et al. [6], and Lee et al. [12]).
Atmosphere 11 00106 g009
Figure 10. Clothing and air layers of the human body.
Atmosphere 11 00106 g010
Table 1. Equipment used in the experiments.
ParameterMeasuring DeviceSpecifications
Air temperatureTesto 480 (thermal-flow probe) ± 0.5
MRTTesto 480 (globe probe) ± 1.5
RHTesto 480 (thermal-flow probe) ± (1.8% RH + 0.7% of measured value)
Wind speedTesto 480 (thermal-flow probe) ± (0.03 m/s + 4% of measured value)
Skin and clothing temperaturesTE-Q1 (IR camera)Scene range temperature: –10 to 150
Accuracy: ±3% at ambient temperature
Thermal sensitivity <0.08
Resolution: 384 × 288 (17 µm pitch)
Emissivity factor: 0.98
Table 2. Information regarding subjects (mean ± standard deviation).
SexNumber of SubjectsAgeHeight (cm)Weight (kg)
Male824.3 ± 1.58171.6 ± 4.2764.7 ± 7.94
Table 3. Results of winter season experiments (mean ± standard deviation).
Subject No. Air   Temp .   ( ) MRT   ( ) RH (%)Air Velocity (m/s) Skin   Temp .   ( Forehead )   ( ) Top   Clothing   Temp .   ( Chest )   ( ) Bottom   Clothing   Temp .   ( Thigh )   ( )
122.122.044.40.0833.627.425.8
222.322.744.10.0832.627.326.7
321.922.846.00.0833.426.724.7
422.022.746.30.0834.126.625.7
521.922.947.10.0834.127.425.7
621.922.946.70.0834.127.925.1
721.922.346.30.1033.327.925.1
821.922.645.20.0833.427.725.3
Mean22.022.445.80.0833.627.425.5
SD0.130.191.070.010.540.520.62
Table 4. Errors of the prediction models.
Prediction ModelModel 1Model 2Model 3Model 4
Error0.05 clo0.26 clo0.00 clo0.08 clo

