Article

Seasonal Responses of Precipitation in China to El Niño and Positive Indian Ocean Dipole Modes

CAS Key Laboratory of Regional Climate-Environment for Temperate East Asia, Institute of Atmospheric Physics, Chinese Academy of Sciences, Beijing 10029, China
*
Author to whom correspondence should be addressed.
Atmosphere 2019, 10(7), 372; https://doi.org/10.3390/atmos10070372
Submission received: 28 May 2019 / Revised: 30 June 2019 / Accepted: 1 July 2019 / Published: 3 July 2019
(This article belongs to the Special Issue Meteorological and Hydrological Droughts)

Abstract

:
Using composite, regular, and partial regression analyses in the six consecutive seasons from spring of the El Niño–Southern Oscillation (ENSO)-/Indian Ocean Dipole (IOD)-developing year through summer following the ENSO/IOD mature phase, the individual and combined impacts of El Niño and positive Indian Ocean Dipole (pIOD) on the evolution of precipitation in China are diagnosed for the period 1950–2013. It is shown that the seasonal responses of precipitation in China to El Niño and pIOD events, and their relationship with the large-scale atmospheric circulations, differ from one season to another. For the pure El Niño years, there is a seasonal reversal of precipitation over southeastern and northwestern China, with deficient precipitation occurring in these two regions before the onset of anomalous wet conditions in the developing autumn. Meanwhile, North China tends to be drier than normal in the developing seasons, but wetter than normal in the decaying seasons. For the pure pIOD events, southern China suffers a precipitation deficit (surplus) in the developing spring (summer and autumn). Furthermore, both North China and northwestern China experience excessive precipitation in the developing autumn and decaying summer. In addition, there is reduced precipitation in northeastern China during both the developing and decaying summers, whereas increased precipitation occurs in the developing autumn and decaying winter. For the combined years, southern China experiences enhanced moisture supply and suffers from increased precipitation from the developing summer through the subsequent spring, but reduced precipitation in the developing spring and decaying summer. Similar to the pure El Niño, northwestern (North) China becomes wetter than normal after the developing summer (autumn) in the combined years. In general, the ENSO/IOD-related precipitation variability could be explained by the associated anomaly circulations.

1. Introduction

China, the world’s most populated country [1], is characterized by a distinct continental monsoon climate and complex climate types. Since China is experiencing rapid industrialization, urbanization, growing agricultural demand, and environmental degradation, its society and economy are quite vulnerable to the variability of precipitation [2]. Moreover, uneven spatial and seasonal distributions of water resources give rise to frequent flooding in southern regions of China and a lack of surface water in northern China [3]. According to statistics from the latest Bulletin of Flood and Drought Disaster in China (2017) [4], droughts in China cause an annual loss of grain yield of 16.26 billion kg, accounting for over 60% of the total crop loss caused by natural disasters, with average losses of CNY 88.23 billion every year during the period 1950–2017. Meanwhile, floods seriously threaten social and economic activities and kill more than 4000 people per year. Therefore, information on the spatial and temporal distribution and variations of precipitation is not only crucial for understanding basic climate dynamics, but also for societal applications in agriculture, ecology, human health, and natural disaster prevention/mitigation.
El Niño–Southern Oscillation (ENSO) is the dominant variation in the modern climate system that fluctuates irregularly on inter-annual time scales [5,6,7,8,9,10]. This episodic phenomenon has been linked to precipitation anomalies across China [11,12,13,14,15,16,17,18], especially over low latitudes [19,20,21,22,23]. For instance, Zhou and Wu [9] revealed that warm ENSO mainly leads to lower-level southwesterly winds being deflected from the southeast coast of China and consequently influencing the winter precipitation in southern China. In particular, significant abundant precipitation can be found over southern China and eastern central China, during the autumn of an El Niño-developing year through the following spring, associated with an anomalous anticyclone over the western North Pacific (WNP), while a precipitation deficit occurs over northern China during the developing summer and autumn, accompanied by an anomalous barotropic cyclone displacing southwestwards along the East Asian coast [13,14,24,25].
The Indian Ocean Dipole (IOD), an important mode of interannual variability of the tropical Indian Ocean [26,27], has been proposed as another significant factor influencing the circulation/rainfall over China [28,29,30,31,32]. The monsoon-induced rainfall over China in the summer is remotely influenced by different phases of the IOD via changes in the intensity of the South Asian High and the WNP anticyclone [28,29,33]. Furthermore, Qiu et al. [34] examined the influence of the IOD on China’s rainfall during the boreal summer and autumn seasons and revealed an asymmetry in the impact of positive and negative IOD events in terms of an extratropical response. Additionally, the IOD influences winter precipitation variability in China through a wave train that emanates from the Indo-western Pacific induced by heating anomalies [35].
Weng et al. [33] further conjecture from observations that during the years when the ENSO co-occurred with the IOD, the influences exerted by one phenomenon on the summer climate in different regions of China may be enhanced or weakened by other phenomena. Xu et al. [36] studied the possible cooperative impacts of combined ENSO and IOD events on boreal autumn rainfall anomalies in China. They have pointed out that the positive phase of the combined ENSO and IOD events may result in an increased autumn rainfall over southern China by an anomalous lower-level anticyclone over the western North Pacific (WNP) region. Moreover, the research conducted by Xiao et al. [37] found that the summer and autumn precipitation in the Yangtze River basin has been influenced by the ENSO and IOD, while the winter precipitation has been influenced by the ENSO, IOD, and North Atlantic Oscillation (NAO).
Most studies have investigated the individual effects of ENSO or the IOD on precipitation in China, with few having considered the combined influences of both on regional precipitation in China. Moreover, the majority of previous studies on the relationship between ENSO/the IOD and precipitation were carried out in just one or two seasons, rather than the phases of ENSO/IOD events in their entirety. In the present study, we build upon this earlier research, study the possible influences of the ENSO and IOD phenomena together with their combined influences on the evolution of precipitation in China throughout their phases, and explore the possible mechanisms underpinning these effects, based on their impact on water vapor flux. Other climate factors may also have important influences on precipitation in China. However, we only focus on these two phenomena in the present study. The principal novelty is that we examine the effects of ENSO and the IOD separately as well as together throughout their entire phases.

2. Data and Methods

2.1. Rainfall and Water Vapor Flux Data

The gridded precipitation data used in this study are from the Climate Research Unit Time Series dataset, version 3.22, derived from gauge observations for the period 1950–2013, with a resolution of 0.5° × 0.5° [38]. Additionally, the water vapor fluxes are from ERA-40 for the period 1950–1978 [39] and ERA-Interim from 1979 onwards [40]. Specifically, they were calculated by vertical integration, using the following equations:
Q = 1 g p 0 p s q V dp
where, g is the gravitational acceleration, q is the specific humidity, V is the horizontal wind vector, p s is the pressure at the surface, and p 0 is the pressure at the top of the atmosphere.
Since China is located in the East Asian monsoon region, the precipitation of China is influenced mainly by the East Asian monsoon [41]. To study the seasonal variations of precipitation in China, the seasonal means were computed by averaging the months of January–February–March (JFM), April–May–June (AMJ), July–August–September (JAS), and October–November–December (OND), which refer to boreal winter, spring, summer, and autumn, respectively. According to Ding and Chan [42], the AMJ and JAS periods represent the early and late stages of the East Asian summer monsoon, respectively. The OND and JFM periods represent the early and late stages of the East Asian winter monsoon, respectively [43].

2.2. Climate Indices

The sea surface temperature (SST) data are from the monthly mean Hadley Centre Global Sea Ice and Sea Surface Temperature dataset, with a spatial resolution of 1° × 1° [44]. Based on the SST data, we calculated the Niño3.4 index and Dipole Mode Index (DMI), normalized to 1971–2000, to identify El Niño and pIOD events. The Niño3.4 index was obtained by area-averaging the SST anomalies over the region (5°S–5°N, 170°–120°W) during November–January (NDJ). The DMI, proposed by Saji et al. [26], was derived from the difference in the SST anomalies between the western (10°S–10°N, 50°–70°E) and eastern (10°S–0°N, 90°–110°E) equatorial Indian Ocean during September–November (SON). An El Niño was defined if the seasonal Niño3.4 index exceeded a standardized value of +0.5, while a pIOD was defined if the seasonal DMI exceeded a standardized value of +0.5. A pure El Niño (pIOD) event was identified when it was not accompanied simultaneously by pIOD (El Niño). A combined event was defined when El Niño peaked in boreal autumn–winter and pIOD peaked in boreal autumn at the same time [45,46]. According to these criteria, we were able to identify pure El Niño, pure pIOD, and co-occurring events for the period 1950–2013 (Table 1).

2.3. Impact of Climate Modes on Rainfall Variables

In this study, we first employed singular value decomposition (SVD) analysis to identify the co-variability relationship between the SST anomalies in the tropical Pacific–Indian Ocean and precipitation anomalies over China. The SVD method decomposes the covariance matrix of these two combined data fields into orthogonal pairs of spatial patterns that maximize the squared temporal covariance between the two variables [47,48]. Then, a lead–lag correlation was performed using the Pearson correlation analysis to identify the period of precipitation most relevant to ENSO and IOD events. The lead–lag correlation was calculated for seasonal mean precipitation anomalies with respect to the values of NDJ Niño3.4 and values of SON DMI, respectively.
To specifically examine the ENSO/IOD-driven rainfall characteristics, a composite analysis was conducted. The composited rainfall anomalies were expressed as the percentage change from the corresponding mean values. In addition, regular regression (or equivalent correlation) and partial regression (partial correlation) analysis were also used, to evaluate the impact of the climate modes on the seasonal evolution of precipitation. Partial regression was employed to isolate the impacts of ENSO and the IOD that are independent of each other, as previously applied in separating their signals in precipitation fields [49,50]. The method involved first removing the linear component of a given time series from a time series of interest and a precipitation variable before performing regression between the two. Throughout the analysis, NDJ values of Niño3.4 and SON values of DMI were regressed against seasonal values of the variables presented in this paper.

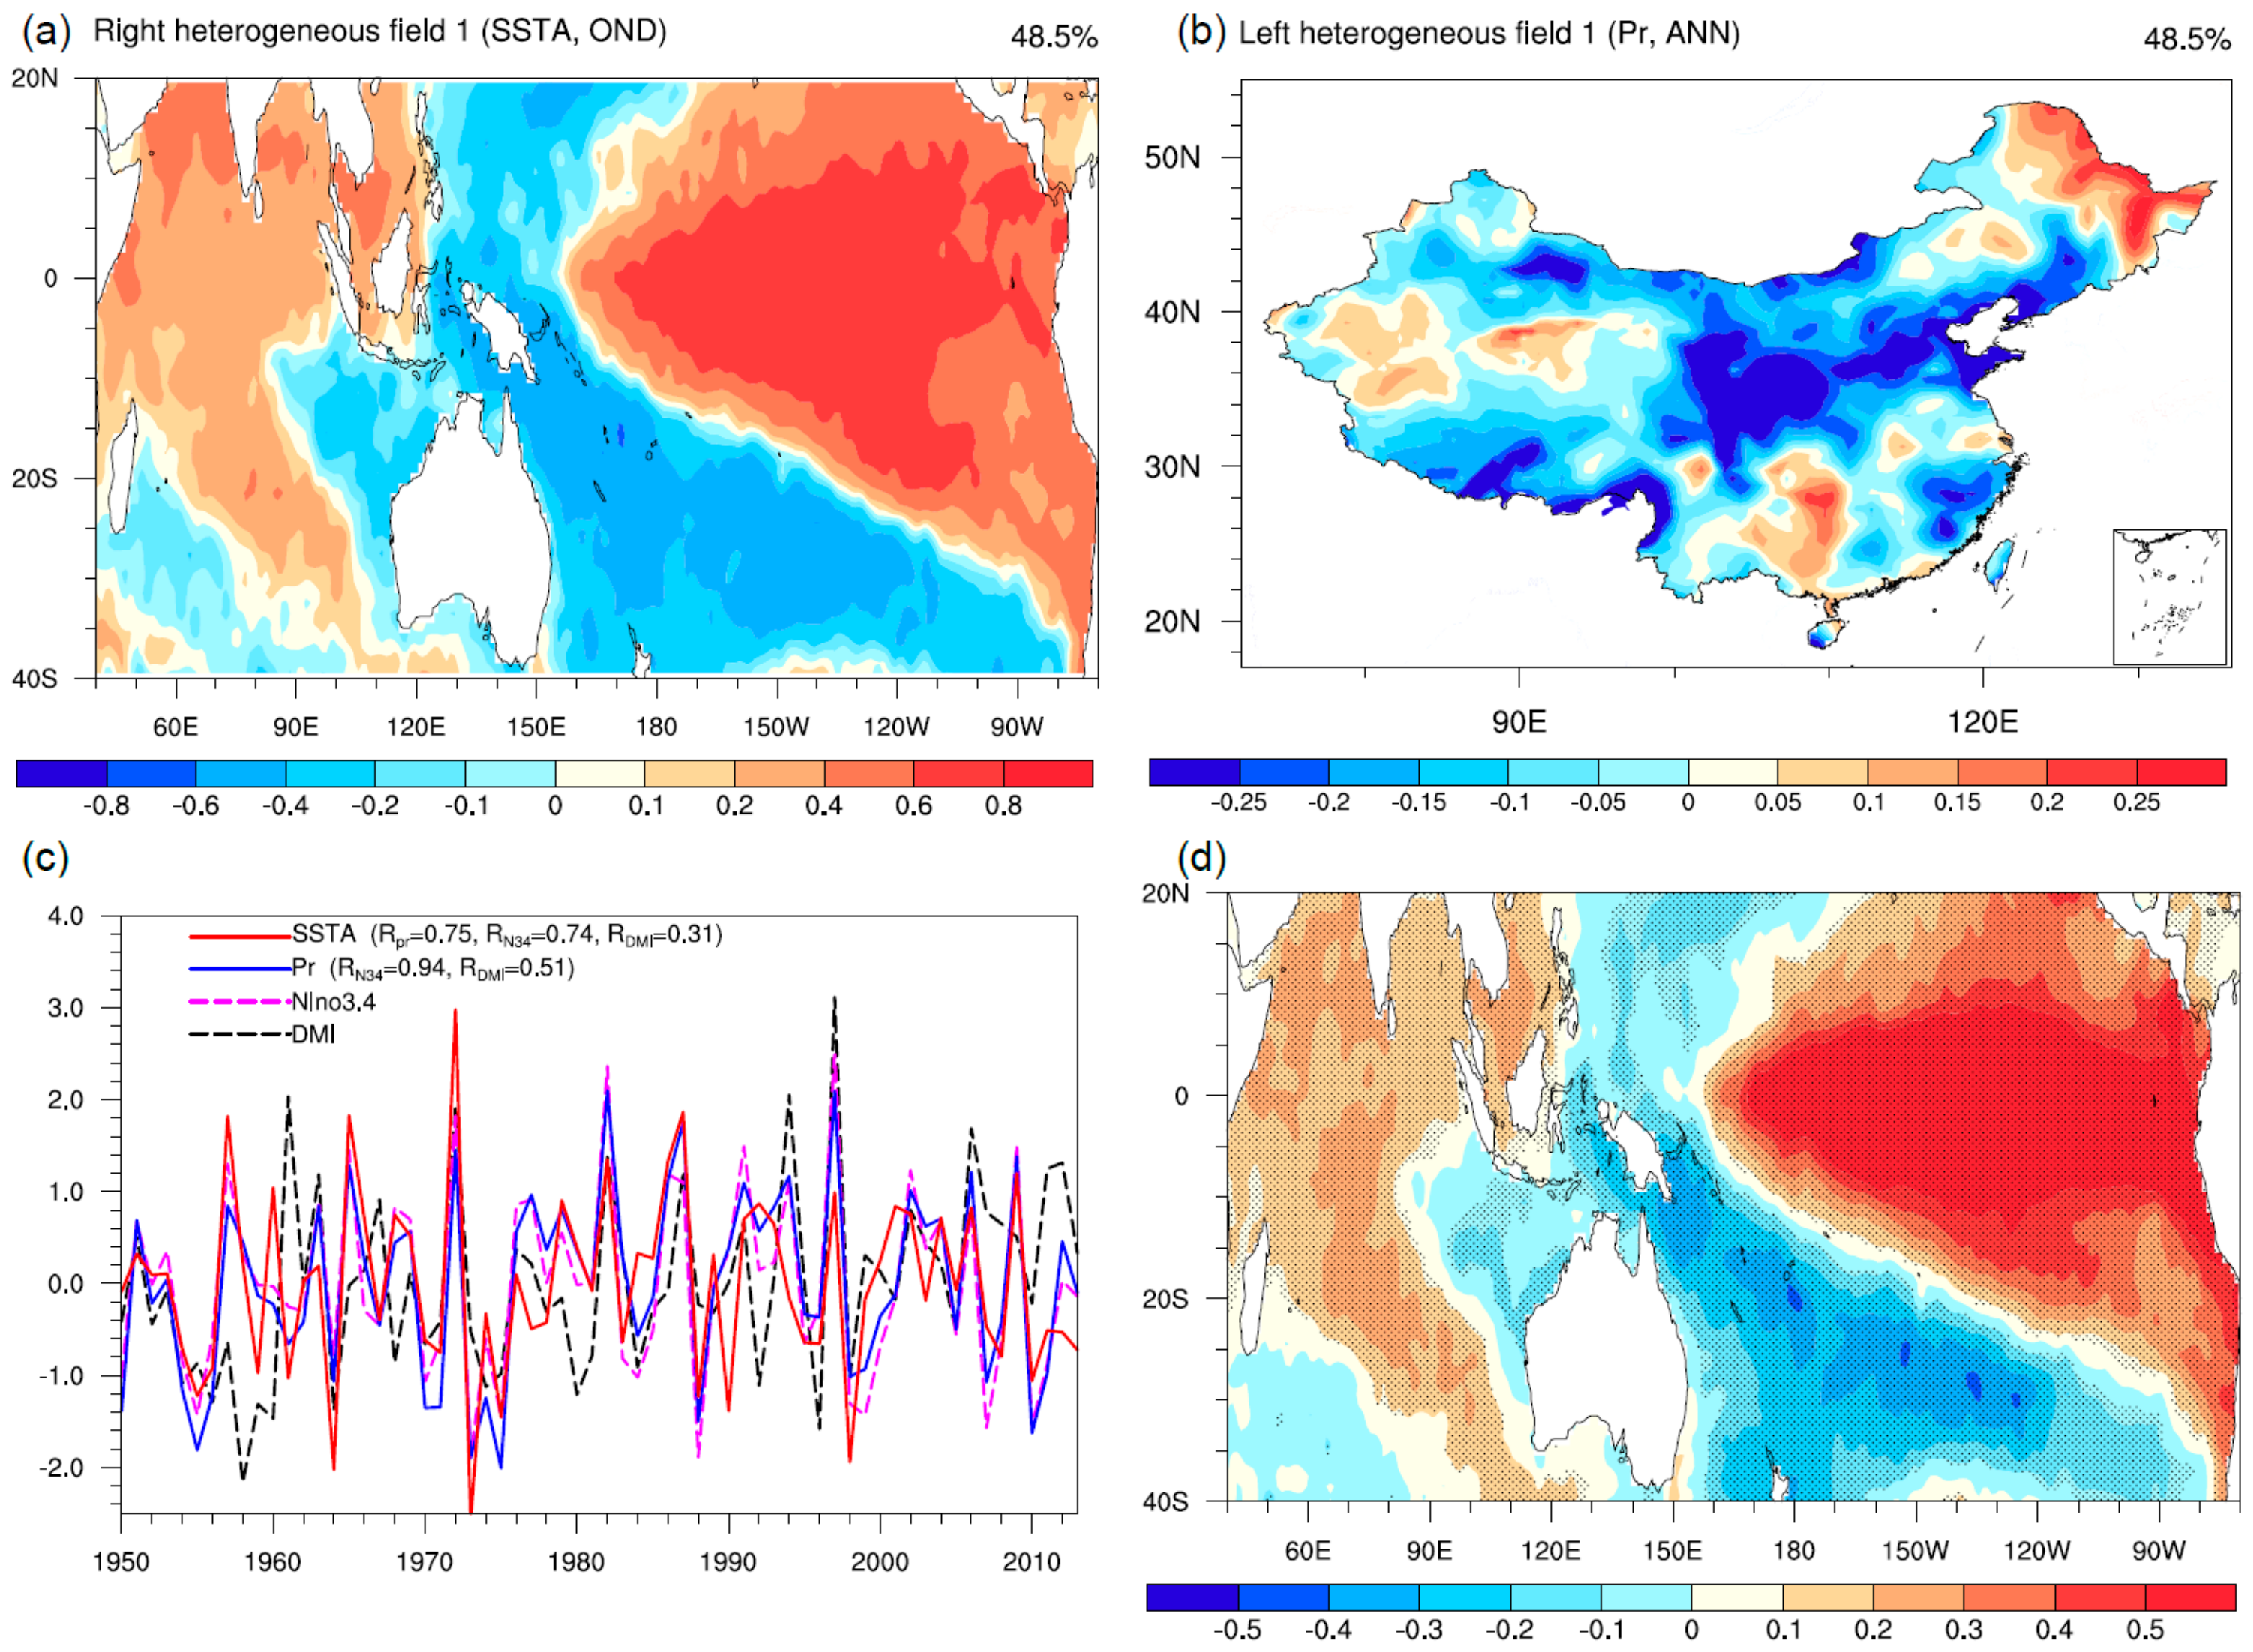
3. Relationship between Precipitation and Indo-Pacific SST

3.1. Covariability of the SST Anomaly and Precipitation

An SVD analysis was applied to calculate the coupled modes for the annual precipitation in China and SSTs in the tropical Indo-Pacific region in OND during the period 1950–2013. The leading SVD mode accounts for 48.5% of the covariance, and its spatial distributions and corresponding time series are shown in Figure 1. The SST mode of variability during OND displays the conventional El Niño and pIOD patterns (Figure 1a). That is, there are warm anomalies across the equator, extending from the central to the eastern Pacific, and cool anomalies in the west Pacific, while warm anomalies emerge in the western tropical Indian Ocean and cold anomalies occupy the southeast. This pattern is followed by negative precipitation anomalies in most parts of China, with the exception of some regions over southwestern, northwestern, and northeastern China (Figure 1b).
The leading mode expansion coefficient (EC) of SST is well correlated with that of precipitation (R = 0.75; correlation coefficients higher than 0.25 are statistically significant at ≥95%) and the Niño3.4 index (R = 0.74), as well as with the DMI (R = 0.31) (Figure 1c). The time series of the precipitation EC also shows a strong correlation with both the Niño3.4 index (R = 0.94) and DMI (R = 0.51). Regression of the leading mode precipitation series from Figure 1c on SST anomalies resembles the link identified in the SVD analysis (Figure 1d). These results suggest that the conventional ENSO and IOD patterns of SST anomalies in the tropical Pacific–Indian Ocean are closely associated with, and may be important to, precipitation variability in China. Additionally, the Niño3.4 is highly correlated with DMI (R = 0.47). In the following sections, composite and regular/partial regression analyses are used to assess the robustness of the SVD analysis and to depict the corresponding physical process by which the ENSO-/IOD-like SST pattern influences the seasonal variation of precipitation over China.

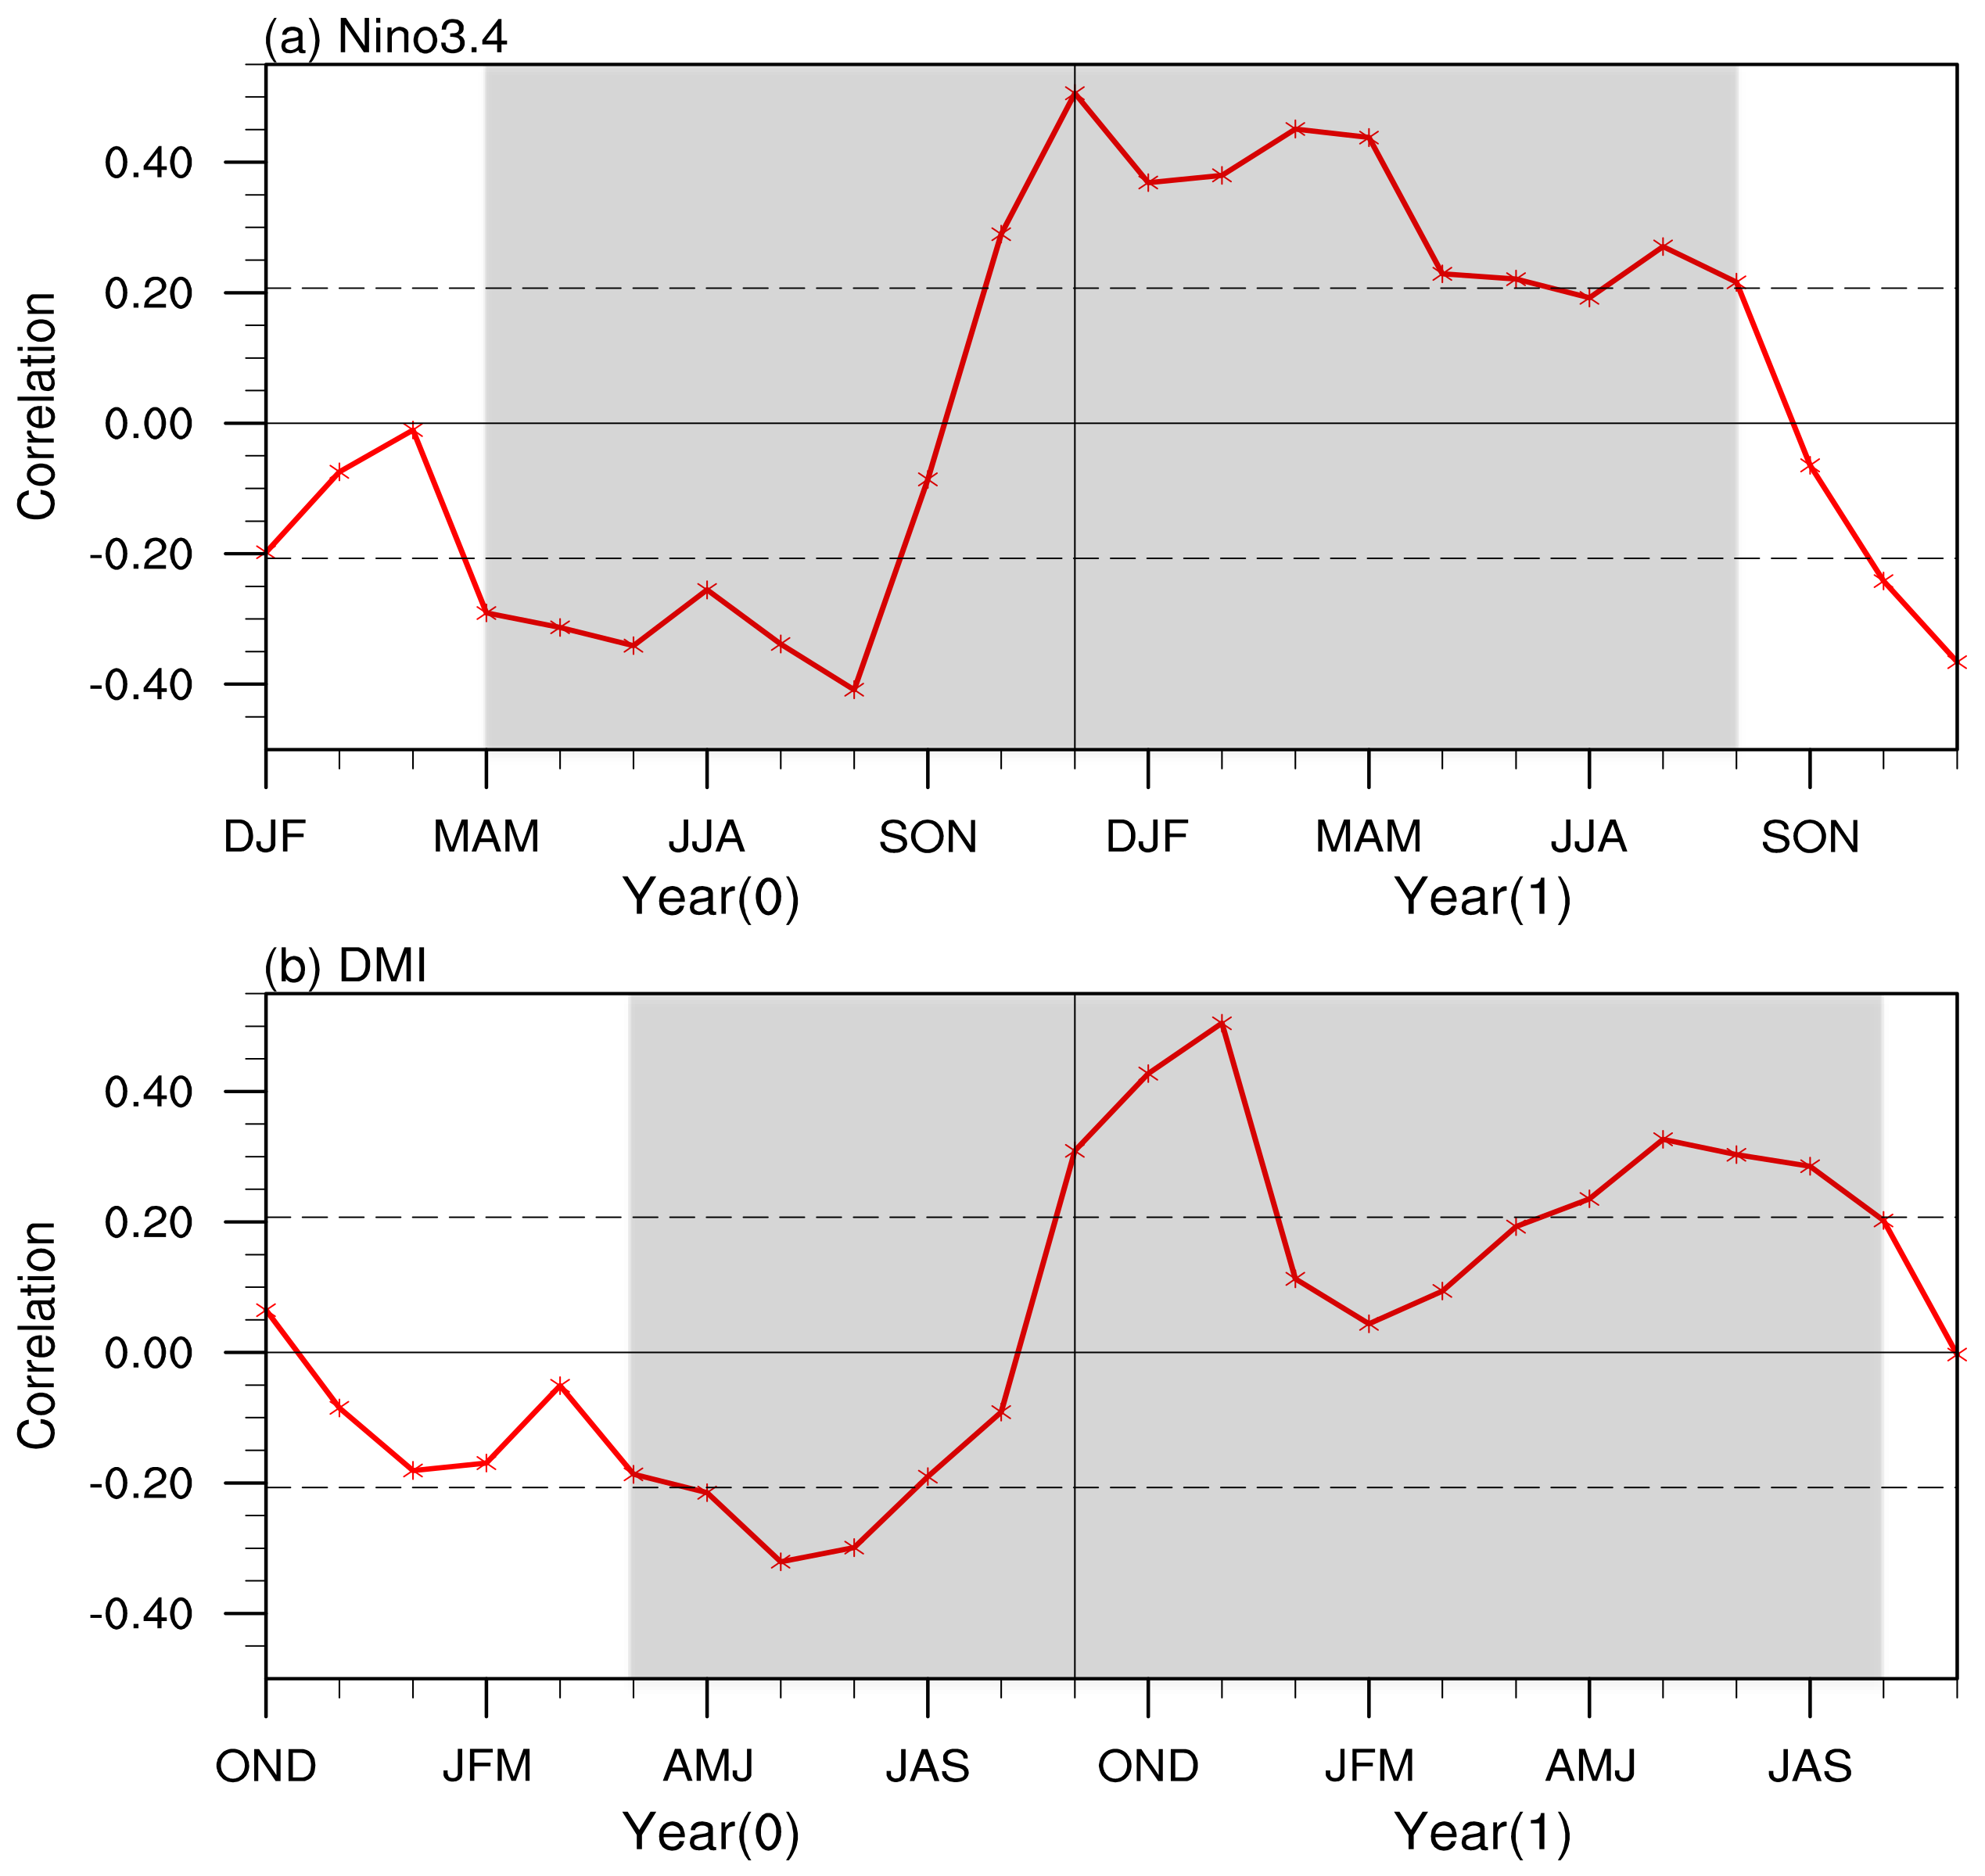
3.2. Identification of Relevant Seasons

Before we discuss the relationship between the precipitation variation and ENSO and IOD events, it is important to determine the period of precipitation that is most relevant to ENSO and IOD events. Therefore, we conducted simple lead–lag analysis: Correlations were calculated for seasonal-mean precipitation anomalies with respect to the NDJ Niño3.4 index and SON DMI, respectively. Since the influence of ENSO and IOD signals can persist from one year to the next, those correlations were calculated before and after one year of the mature phase of El Niño and IOD. Here, year(0) is defined as the year in which an ENSO/IOD develops and matures, and −1 and 1 in parentheses refer to one year before and after year(0), respectively. In addition to the developing year, ENSO/the IOD is also related to precipitation in China during the subsequent year. As shown in Figure 2, the precipitation is significantly anti-correlated with Niño3.4 from April(0) to September(0), followed by a significant positive correlation during November(0)–September(1). Meanwhile, there is significant and negative correlation of the precipitation with the IOD index in the developing phase (MJJ(0)). However, a significant positive lagged correlation is observed in the decaying phase. Overall, the significantly relevant period of precipitation to ENSO/the IOD is concentrated from April(0) to September(1). Therefore, we discuss the seasonal evolution for spring of the ENSO-/IOD-developing year, AMJ(0), through summer following the ENSO/IOD mature phase, JAS(1), in the next section.

4. Results

The results from the composite and regression/partial regression analyses in the six consecutive seasons from AMJ(0) through JAS(1) are used here to highlight the individual and combined influence of El Niño and pIOD on the evolution of precipitation in China. Water vapor content is one major factor that directly affects the precipitation over China [51,52]. To demonstrate how El Niño and pIOD events respectively affect the precipitation, the vertically integrated water vapor flux from 1,000 to 300 hPa was also composited. The two-tailed t-test was used to determine the significance of the spatial anomaly fields. Also, the precipitation anomalies associated with pure El Niño/pIOD were assessed with partial regressions of precipitation onto partial Niño3.4 index/DMI respectively, while those associated with combined events were computed with regular regressions.

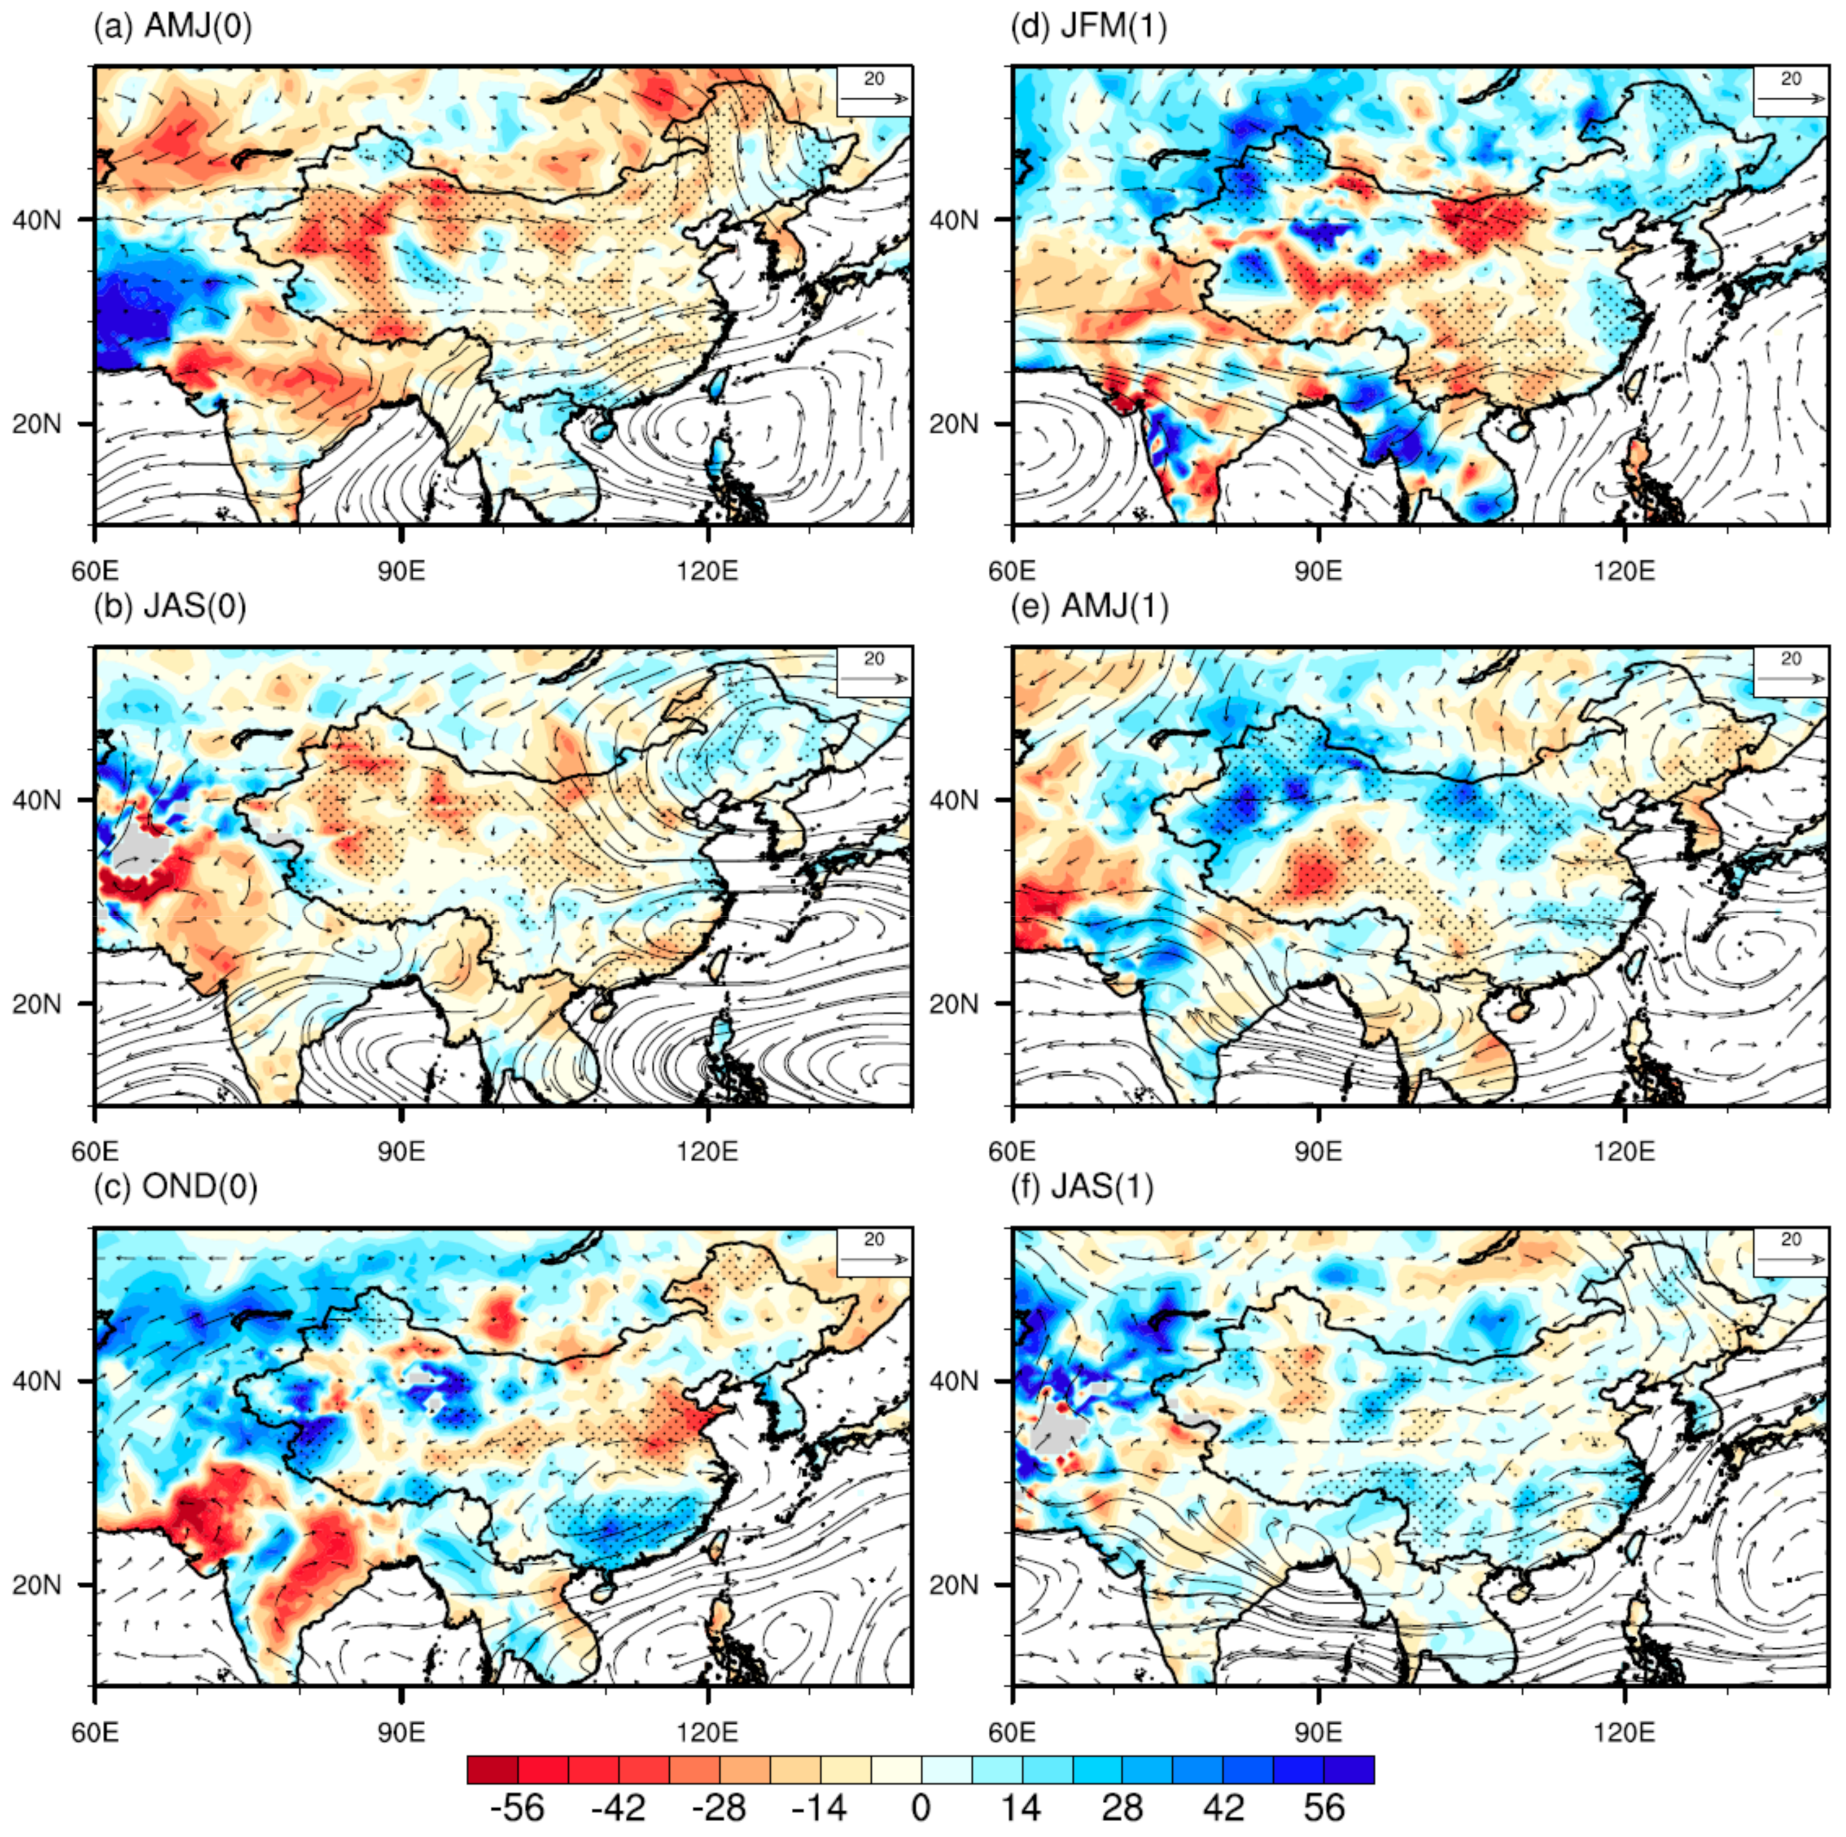
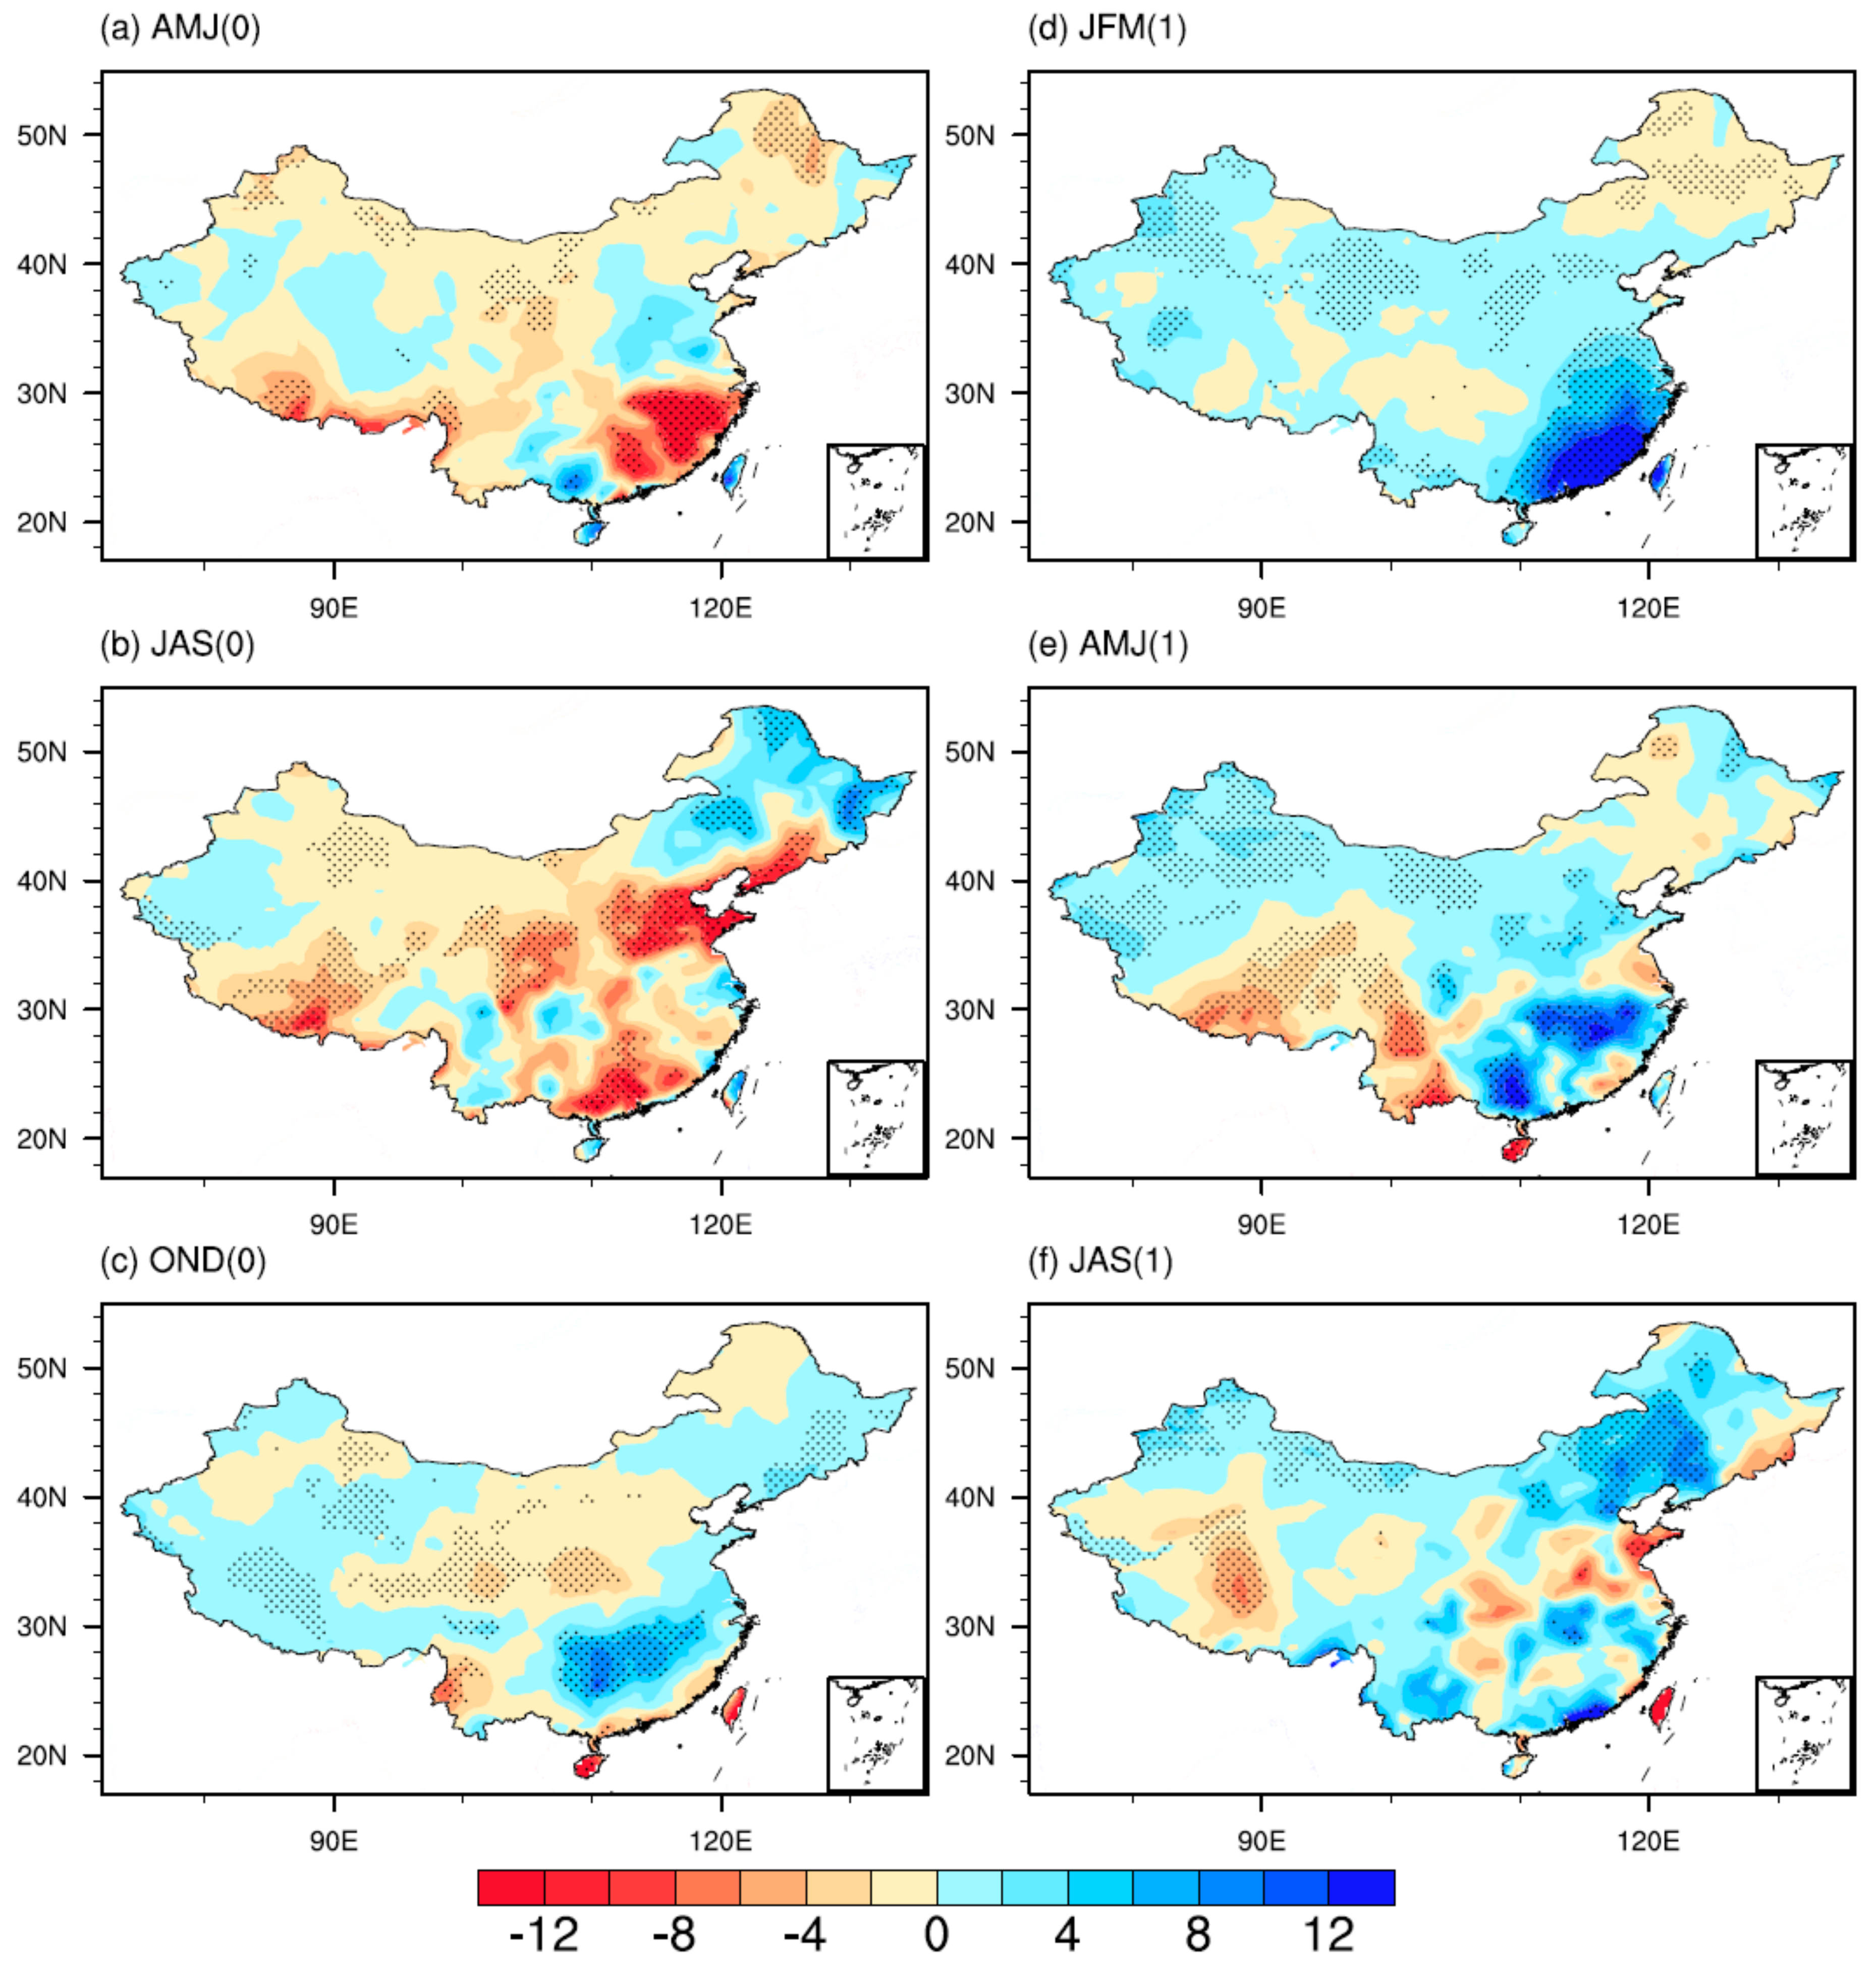
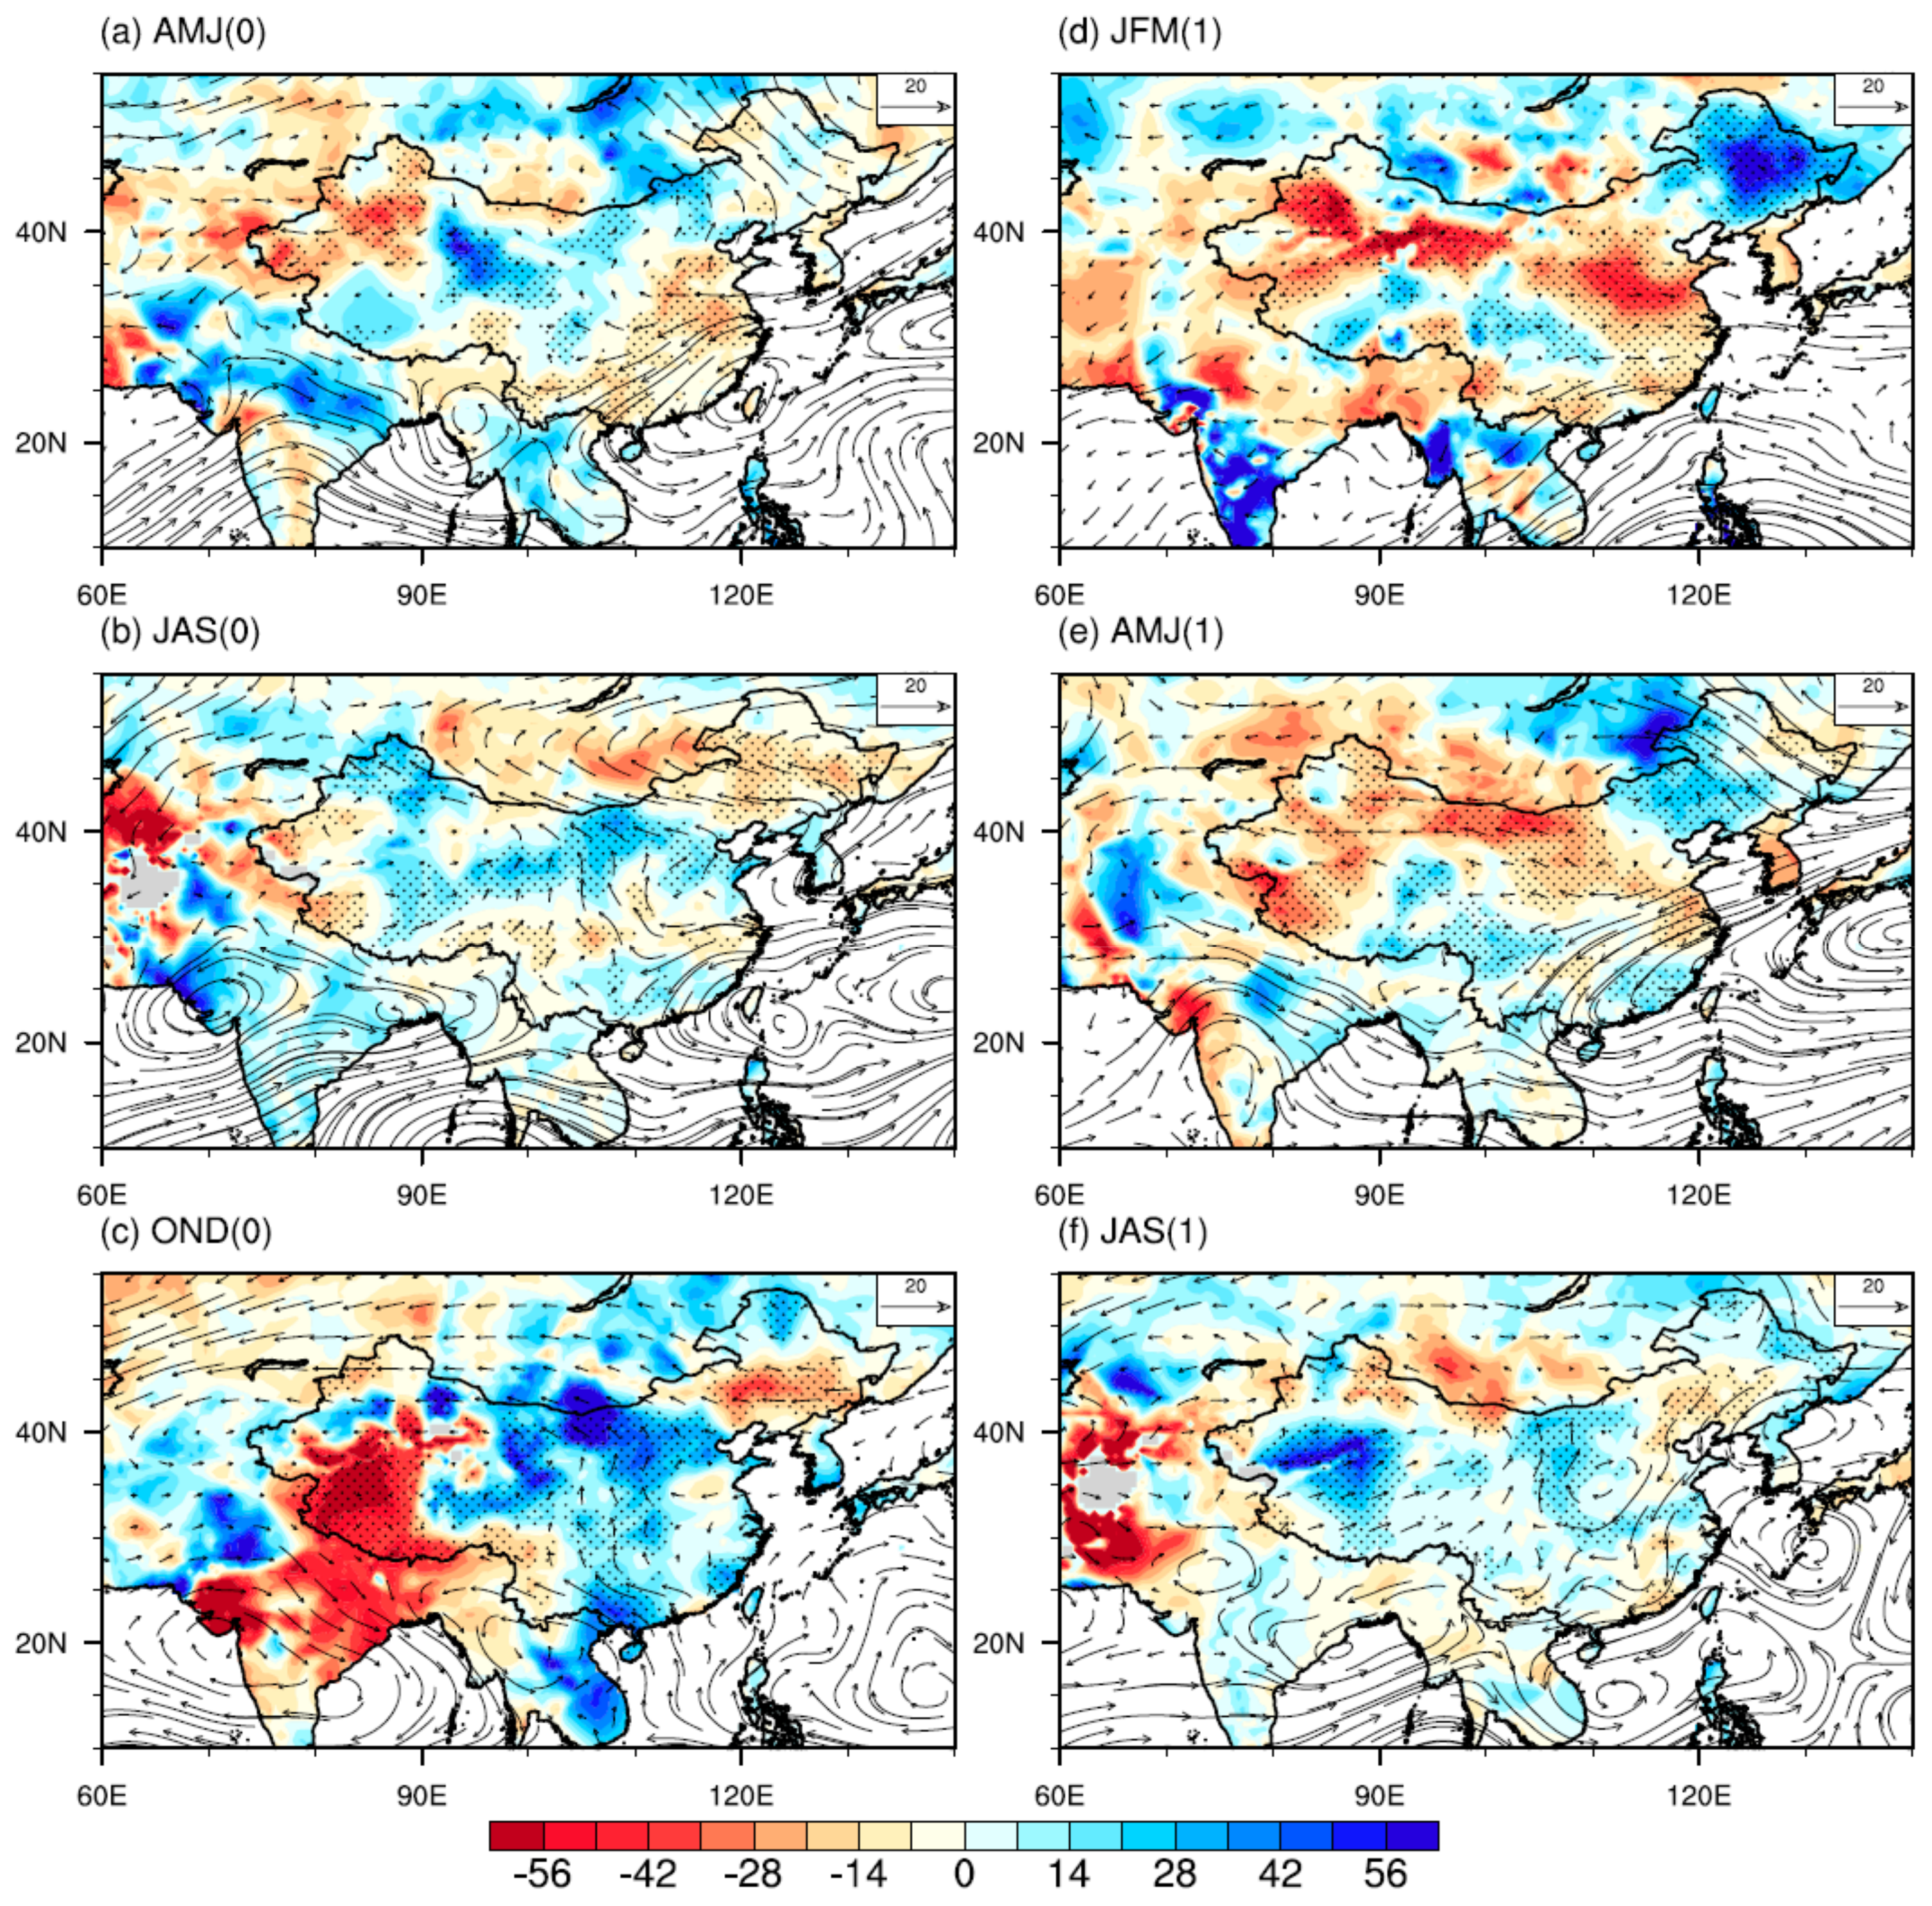
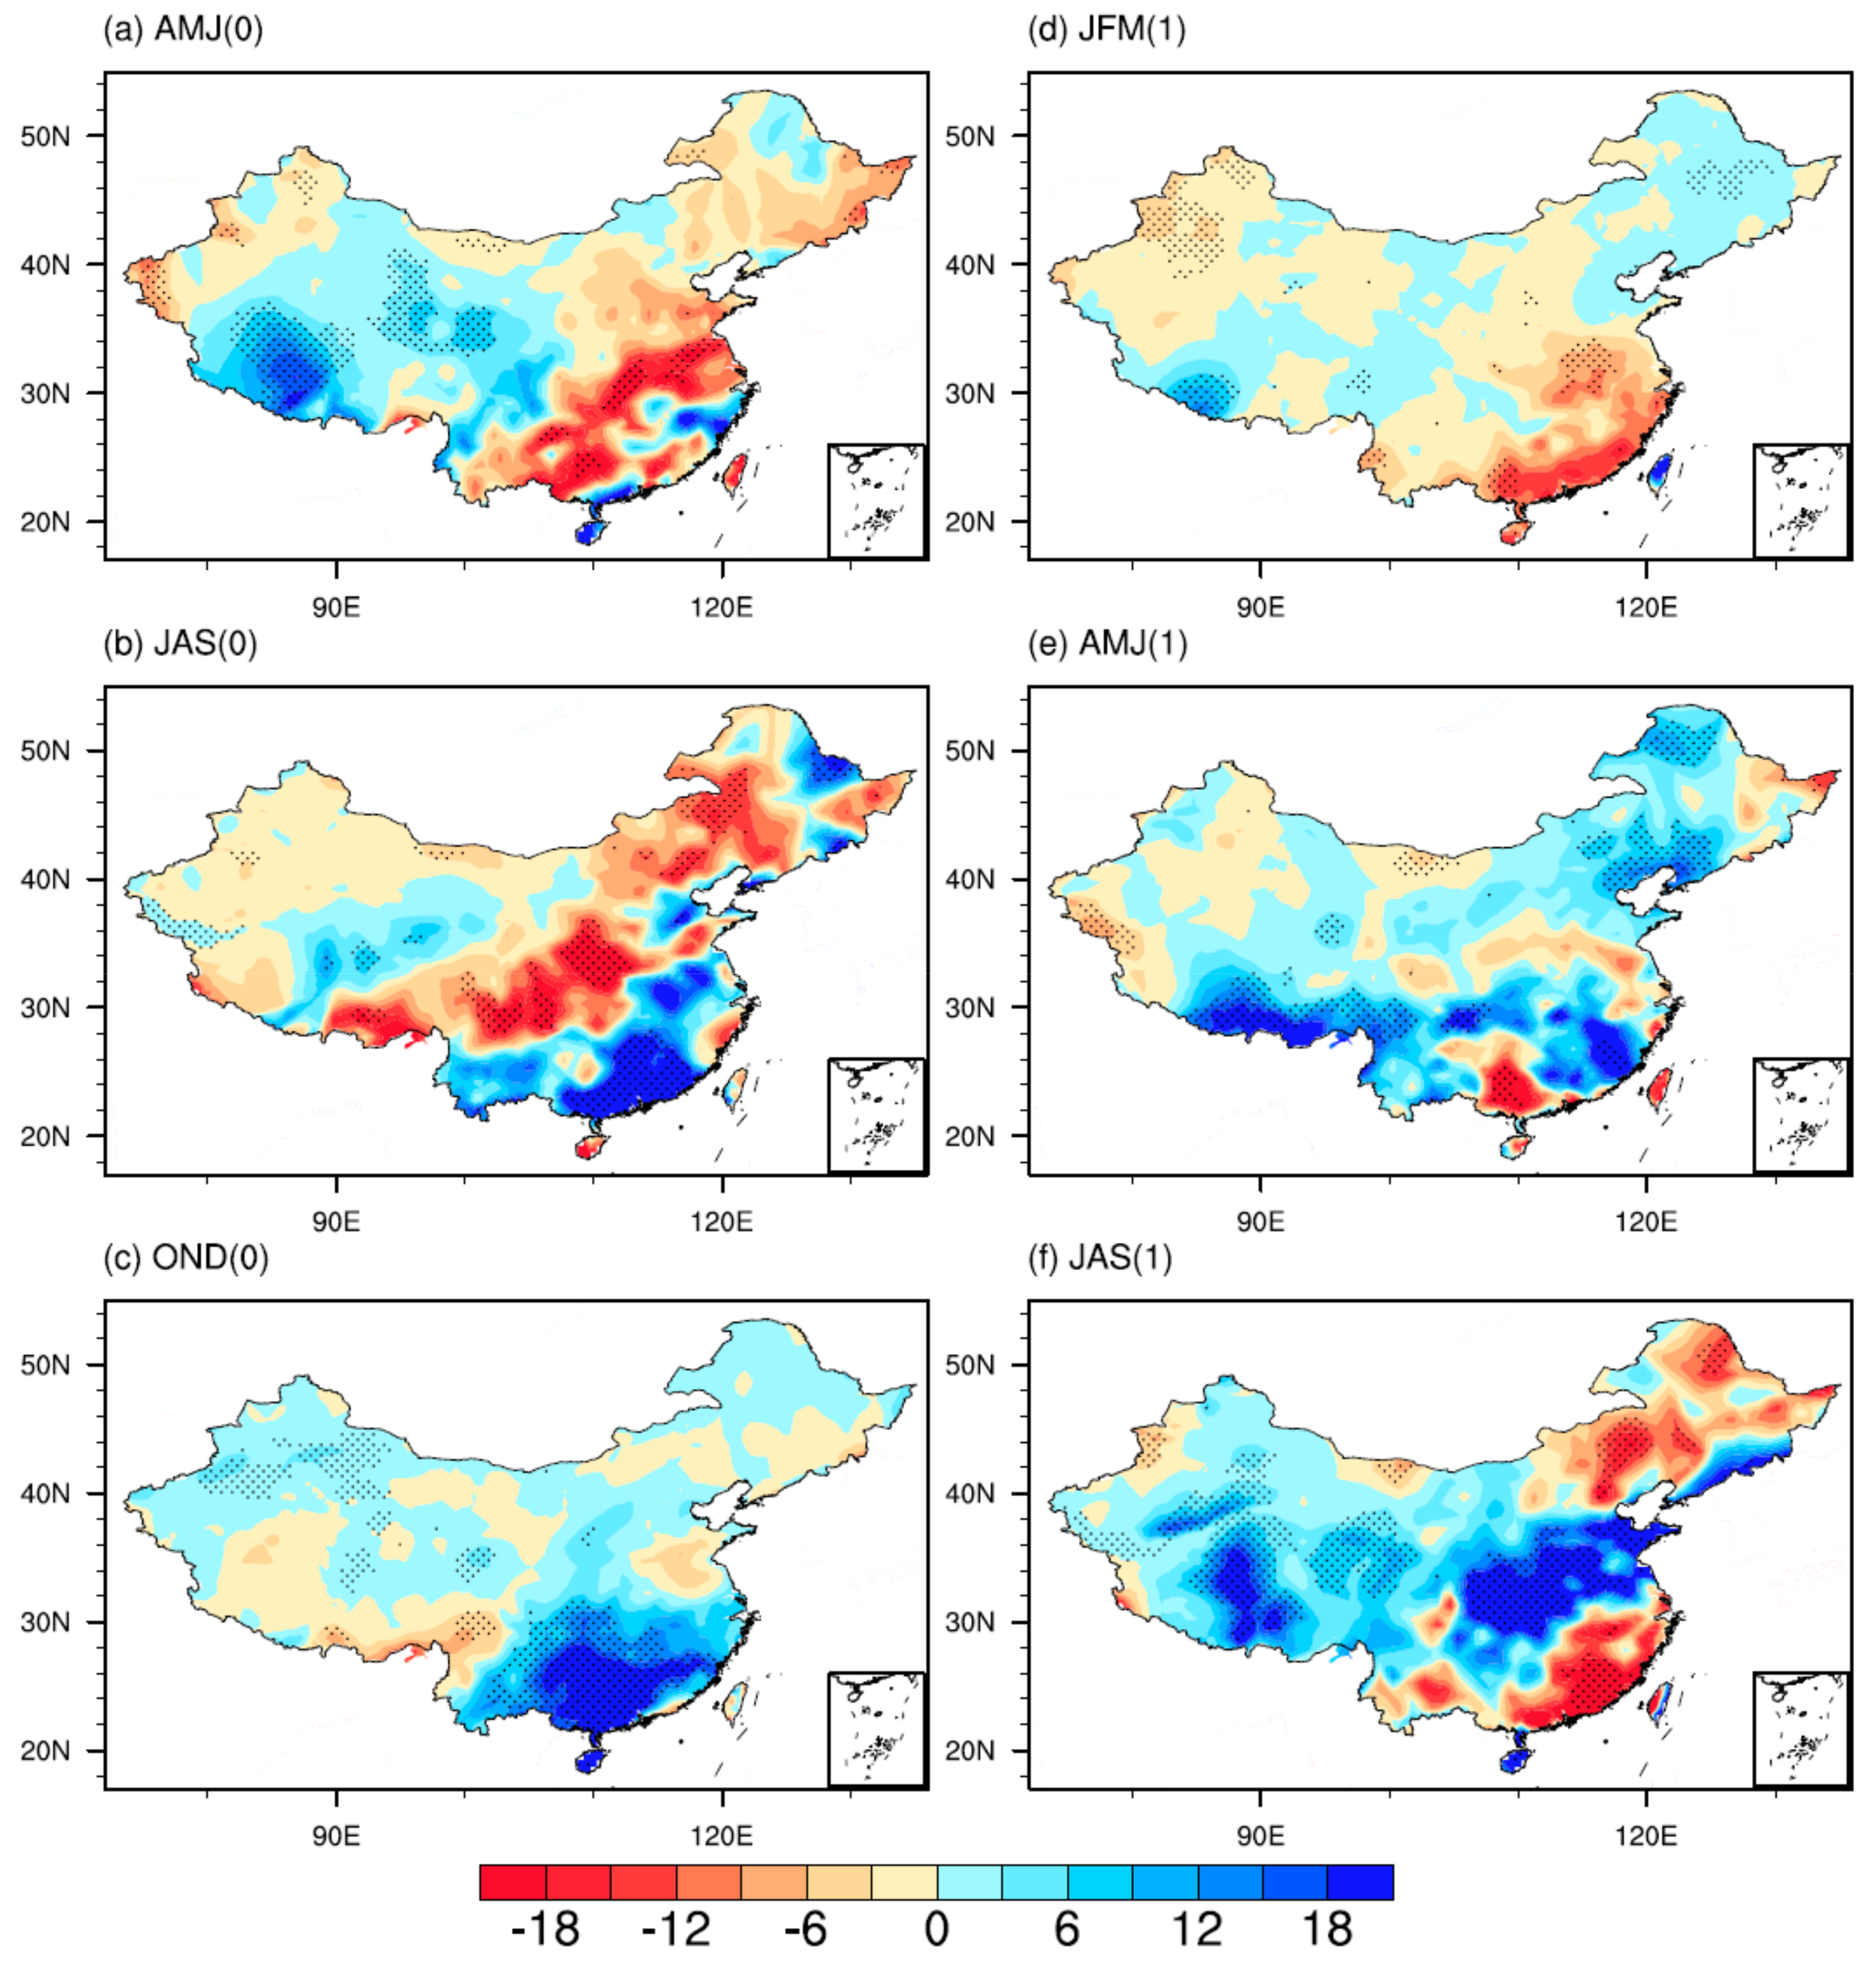
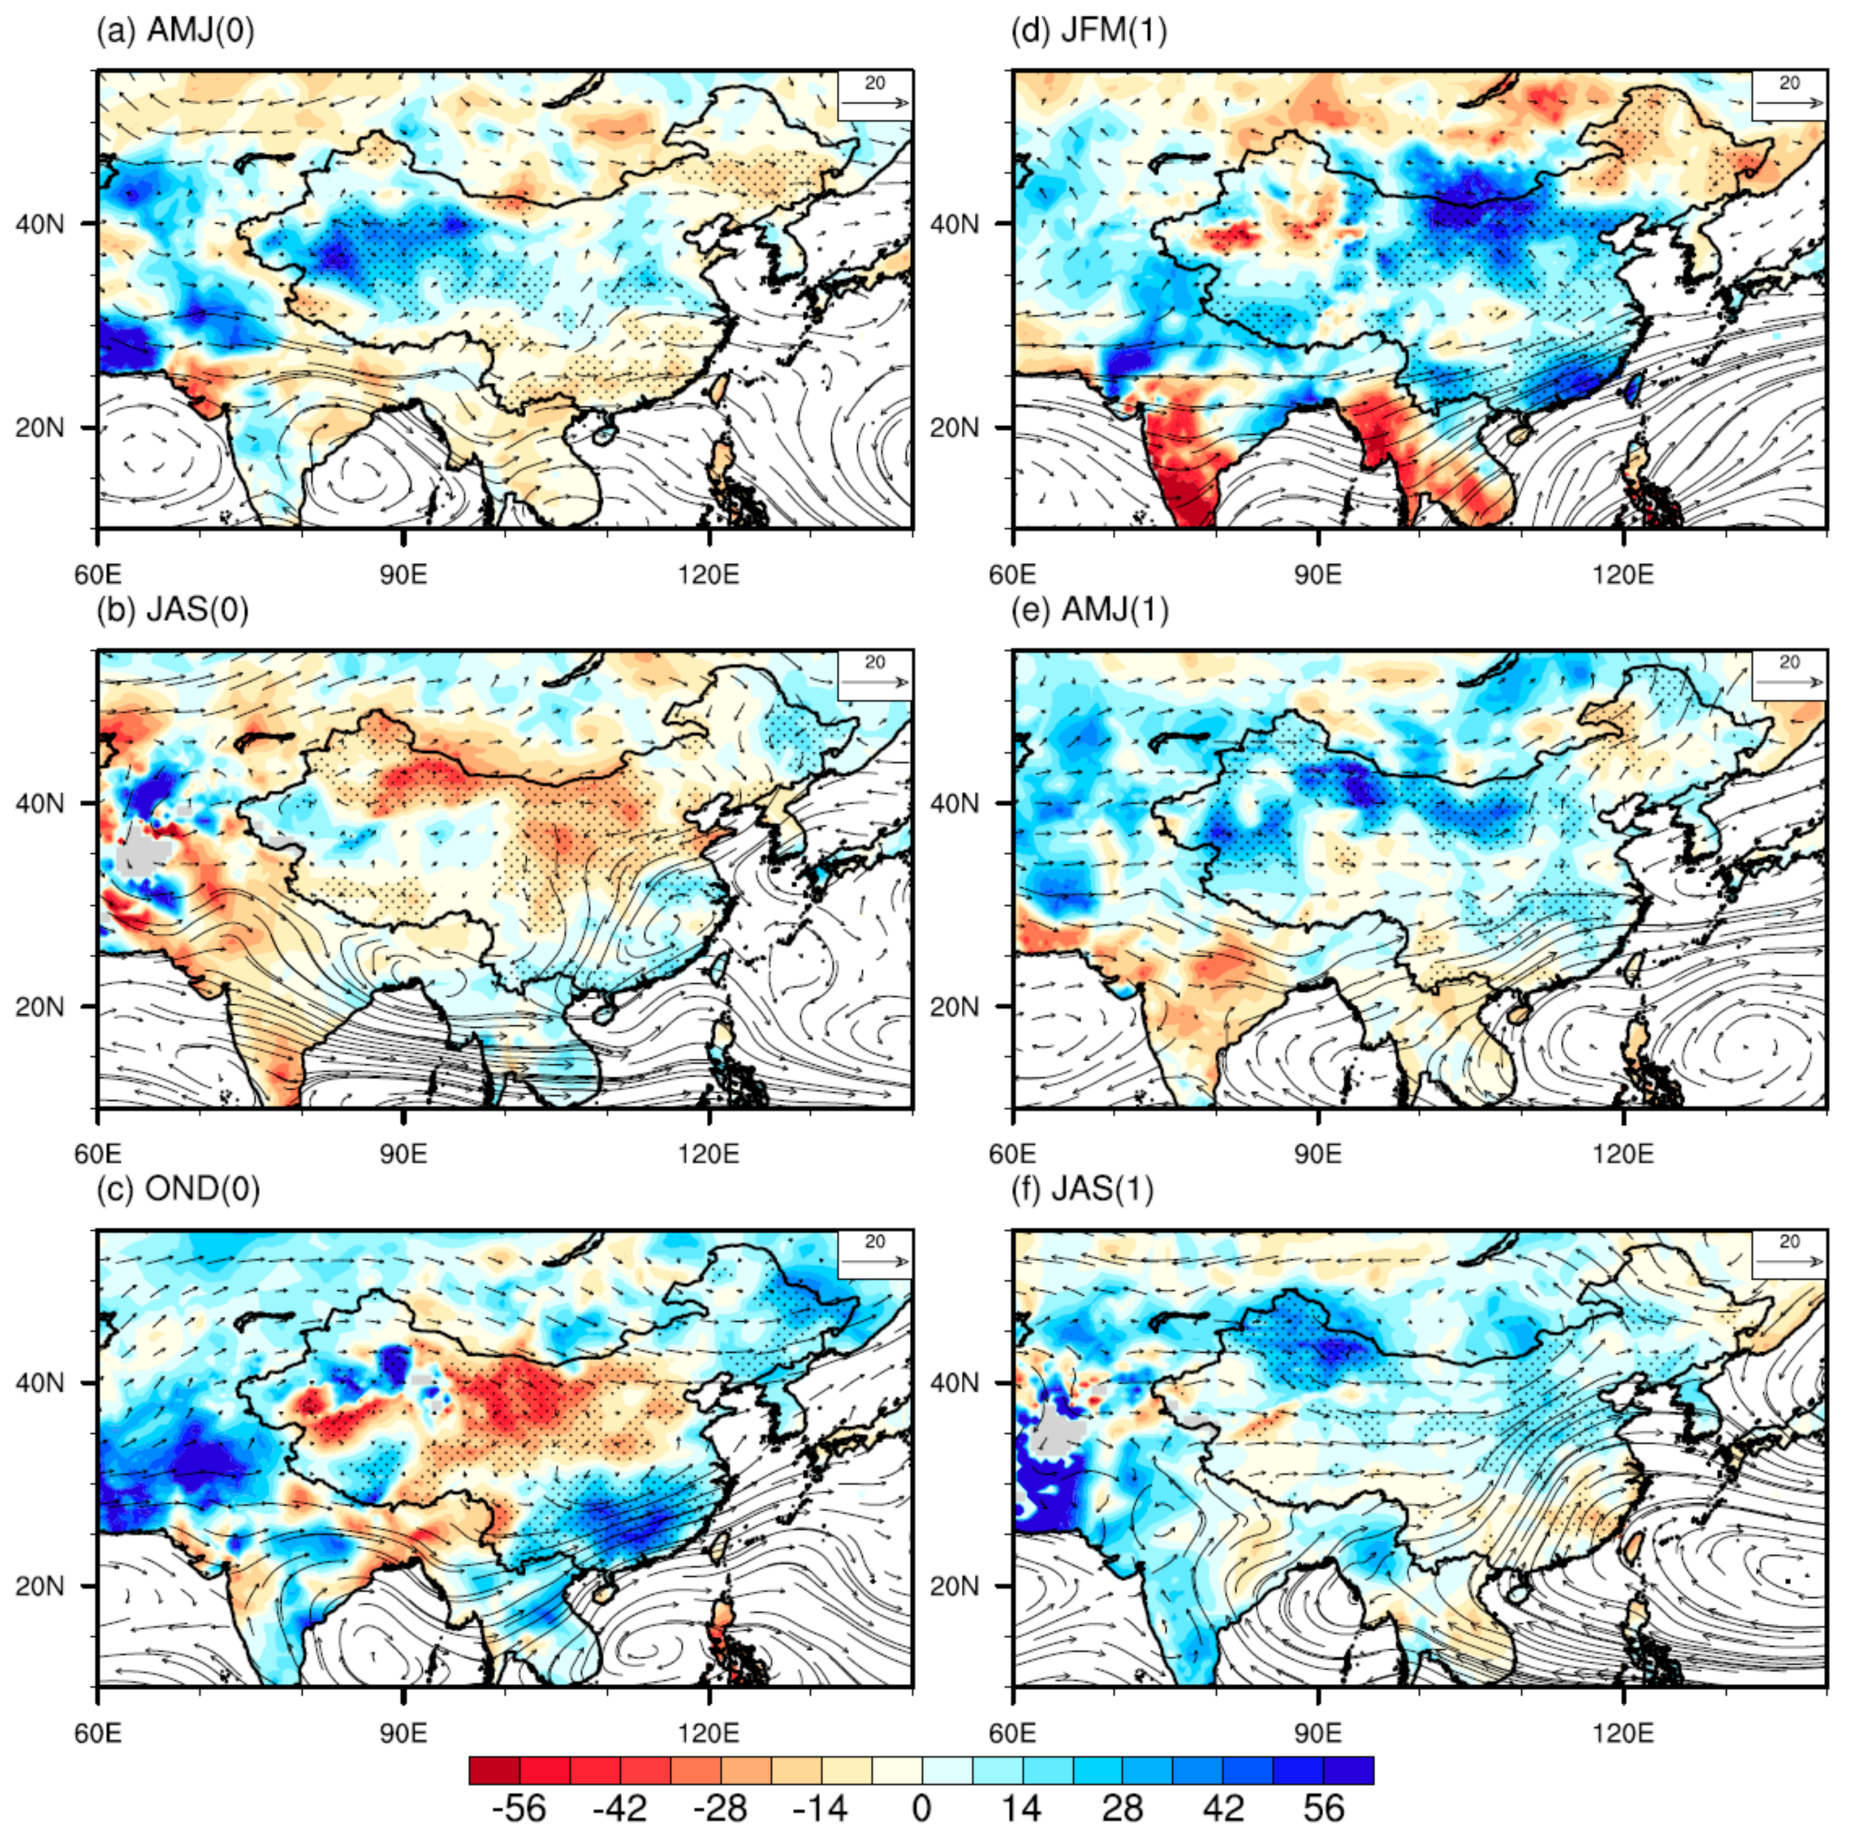
4.1. Response to Pure El Niño Events

In the case of pure El Niño during the developing spring (AMJ(0)), an anomalous cyclonic circulation is situated over the Philippines, preventing water vapor from being transported to eastern China. Meanwhile, Mongolia is characterized by an anticyclonic moisture circulation anomaly, and easterly outflows are found on its southern flank over China. These circulation patterns result in a lower flux of water vapor, thus preventing precipitation over most parts of China (Figure 3a). During JAS(0), the anomalies of water vapor flux exhibit a meridional wavelike pattern: between the north and south cyclonic circulations is the anticyclonic circulation centered to the east of Taiwan, which is similar to that of the negative phase of the Pacific–Japan (PJ) pattern and East Asia–Pacific (EAP) pattern [53,54,55,56]. This leads to a negative–positive–negative–positive mode of precipitation anomalies in China from south to north, with more precipitation over the Yangtze River valley and northeastern China and less precipitation over southern and northern China (Figure 3b). There is an anomalous anticyclone residing over the WNP during autumn (OND(0)) (Figure 3c). Correspondingly, it tends to be wetter than normal in southeastern China, resulting from the southwesterly flow associated with the WNP anticyclone. This is similar to previous studies about the influence of El Niño on autumn rainfall anomalies in China [57].
For the decaying years, associated with the southwesterly anomaly over eastern China, above-normal precipitation is observed there during JFM(1). To its west, an anomalous anticyclonic moisture circulation is located over northwestern China, inducing a deficiency in moisture supply, thus contributing to the below-normal precipitation over northern, southwestern, and northwestern China (Figure 3d). During AMJ(1), there are two abnormal anticyclones of water vapor flux over the Indochina Peninsula and northeastern China (Figure 3e). Associated with the divergence of water vapor, both southwestern and northeastern China tend to be drier than normal. Whereas, the outflows of these two abnormal anticyclones converge south of the Yangtze River, inducing enhancement of precipitation there, consistent with previous studies [19,52]. Meanwhile, both North China and northwestern China tend to be wetter than normal, resulting from the anomalous southerly flow and westerly flow, respectively (Figure 3e). During JAS(1), northeastward water vapor flux anomalies occur over southern China, contributing to enhanced water vapor transport and precipitation there (Figure 3f).
Moreover, a partial correlation analysis was applied between the Niño3.4 index and China precipitation, after removing the effect of the IOD (Figure 4). The partially regressed precipitation shares many features with those in the composite analysis, providing additional confirmation that the seasonal variations of precipitation in China are related to transitions of ENSO phases. For instance, there is a seasonal reversal of precipitation over southern China. That is, during the developing spring and summer, deficient precipitation occurs in southern China (Figure 3a,b and Figure 4a,b) before the onset of anomalous wet conditions in the developing autumn. Meanwhile, North China tends to be drier than normal in the developing seasons (Figure 3a–c and Figure 4a–c), but wetter than normal in the decaying seasons (Figure 3d–f and Figure 4d–f).

4.2. Response to Pure pIOD Events

The composite pattern of precipitation anomalies in the developing spring of pure pIOD events is characterized by a reversed pattern of a wet west and dry east (Figure 5a). That is, significant northeasterly water vapor flux anomalies dominate southern China, suppressing water vapor transport and resulting in less precipitation locally. Conversely, the anomalous moisture convergence over northwestern China tends to bring above-normal precipitation there. Likewise, the partial regression pattern reveals a similar contrasting structure, with the highest negative correlation centering in southern China and the highest positive correlation occurring in most parts of northwestern China (Figure 6a). During the developing summer, there is a positive phase of the PJ/EAP pattern of circulation originating from the Bay of Bengal to the west of Japan, which is almost opposite to the pure El Niño. Correspondingly, the precipitation anomalies over China show opposite signs for the composites of the pure pIOD and pure El Niño events (Figure 5b versus Figure 3b). Specifically, a cyclonic moisture circulation anomaly centered to the east of Taiwan leads to an enhancement of precipitation in southern China. Meanwhile, it weakens the monsoonal northward wind from the oceans, preventing the Yangtze River valley from receiving the normal level of water vapor from the tropical regions. Moreover, enhanced precipitation appears in North China and reduced precipitation is present over northeastern parts of China, in accordance with the enhanced northward water transport and anomalous anticyclonic circulation, respectively (Figure 5b). These results are in agreement with previous studies [29,58,59]. During OND(0), significant northward water vapor flux anomalies, originated from the WNP, enhance the water vapor transport to southern parts of China. Correspondingly, both significant positive anomalies (Figure 5c) and regression coefficients (Figure 6c) are found over southern China.
For the decaying phase of pure pIOD events, precipitation anomalies are generally dry throughout China during winter, with the exception of slightly wetter than normal conditions over some parts of northeastern and southwestern China (Figure 5d and Figure 6d). In AMJ(1), northeasterly water vapor flux anomalies invade southern China, preventing the transport of warm/wet air into eastern and northern China, but converge with the monsoonal southwesterlies (not shown) over southern China. As a result, significant wet conditions are found over southeastern and southwestern China, while dry or near-normal conditions are observed over eastern and northern China. Meanwhile, anomalous southeasterlies appear to dominate over northeastern China, promote water vapor transport, and lead to more precipitation over that region (Figure 5e and Figure 6e). During JAS(1), significant northeasterly water vapor flux anomalies appear in eastern parts of China (Figure 5f), leading to drought conditions over northeastern and southeastern China (Figure 5f and Figure 6f). Conversely, the other parts of China experience excessive precipitation (Figure 5f and Figure 6f), due to an enhanced moisture surplus associated with southerly or southwesterly anomalies of water vapor flux (Figure 5f).

4.3. Response to Combined Events

When El Niño appears concurrently with pIOD, the anomalous cyclonic circulation shifts northwards to Taiwan in the developing spring and summer, whereas it is subsequently replaced by the Philippine Sea anticyclone (PSAC) during the autumn and is maintained until the subsequent summer, which is substantially intensified compared to pure El Niño years [52]. Correspondingly, southeastern China experiences an enhanced moisture supply and suffers from increased precipitation during the summer of a developing year through the following spring (Figure 7c–e), but reduced precipitation in the developing spring and decaying summer because of the divergence of water vapor (Figure 7a,f). Accompanied by the enhanced PASC, there are stronger southwesterly or southerly anomalies originating from the tropical oceans to North China in the decaying phases (Figure 7d–f) compared to those in the pure El Nino/pIOD years (Figure 3d–f or Figure 5d–f). The corresponding precipitation increase in central and northern China is much greater in the decaying seasons of combined years. Moreover, northwestern China tends to be wetter than normal because of the moisture surplus transported by the anomalous westerly flow during AMJ(1) and JAS(1). During the decaying summer (Figure 7f), the PSAC enhances the mei-yu/baiu precipitation by modulating the western Pacific subtropical high [60]. In contrast to the anomalous dry conditions in southwestern China during JAS(0) and AMJ(1) of the pure El Niño, the corresponding anomalies of precipitation in the combined event case are intensified (weakened) in the former (latter) season. We suspect that the effect of the pIOD enhances the relationship between ENSO and the precipitation in southwestern China during the developing summer, whereas it offsets the relationship in the decaying spring.
A regular regression analysis was performed separately with the Niño3.4 index and DMI. In addition, we also calculated the pattern correlation between the composite precipitation anomaly and the index-regressed precipitation anomaly as well as the sum of the regressed patterns to identify which of the two indices is the crucial factor in the spatial variation of the precipitation in China in the combined years (shown in Table 2). We can see that all of the regressed patterns are significantly correlated with the composite maps, suggesting that the precipitation anomalies in China are modulated by both the IOD and ENSO events during combined events. Furthermore, the Niño3.4-regressed pattern shows a smaller correlation to the composite maps than that of the DMI in JAS(0) and JAS(1), but a greater correlation in the remaining four seasons. The correlations between the sum of the index-regressed anomalies and the composite anomalies are close to the larger one of individual correlation. It suggests that their individual impacts in combination may be mainly linear additive. These simple analyses imply that the IOD SST pattern plays a greater role in statistically significant changes of precipitation over China than the El Niño pattern anomalies during the developing summer and decaying summer, but less of a role during the remaining four seasons in combined years.

5. Summary and Discussion

In this study, the individual and combined impacts of El Niño and pIOD on the seasonal evolution of precipitation in China have been examined. The results demonstrate that precipitation change in China is sensitive to varying El Niño and pIOD SST anomalies over the Indo-Pacific Ocean. The major findings are summarized as follows:
For pure El Niño years, there is an anomalous cyclone around the Philippines in the developing spring and summer, which is subsequently replaced by an anomalous anticyclone around the western North Pacific during the autumn. Correspondingly, there is a seasonal reversal of precipitation over southeastern China, with deficient precipitation occurring in this region before the onset of anomalous wet conditions in the developing autumn. Meanwhile, North China tends to be drier than normal in the developing seasons, but wetter than normal in the decaying seasons. During the decaying spring, southwestern China suffers from decreased precipitation associated with the divergence of water vapor.
During the developing summer of pure pIOD, there is a positive phase of the PJ/EAP pattern of circulation originating from the Bay of Bengal to the west of Japan, leading to an opposite sign of the precipitation anomaly to pure El Niño. During the developing stages, southern China experiences an anomalous dry spring but shifts to being anomalously wet in summer and autumn. Both North China and northwestern China tend to be wetter than normal in OND(0) and JAS(1) because of the enhanced moisture transport. Associated with anomalous divergence of water vapor flux, there is a decrease in precipitation in northeastern China during both the developing and decaying summers, whereas increased precipitation occurs in OND(0) and JFM(1).
When El Niño appears concurrently with pIOD, the anomalous cyclonic circulation shifts northwards to Taiwan in the developing spring and summer, whereas it is subsequently replaced by the PSAC during the autumn and is maintained until the subsequent summer, which is substantially intensified compared to pure El Niño years. Correspondingly, southern China experiences increased precipitation from the developing summer through the subsequent spring, but reduced precipitation in the developing spring and decaying summer. Like with pure El Niño, northwestern (North) China becomes wetter than normal after the developing summer (autumn) in the combined years. Generally, the El Niño SST pattern plays a greater role in statistically significant changes of precipitation over China than the IOD pattern anomalies during all the seasons of the combined years, except the developing summer and decaying summer. Our results are also consistent with previous studies of the variations in precipitation and the related circulation [36,37]. For example, Xu et al. [36] showed that, during the positive phase of the ENSO and IOD in autumn, an anomalous lower-level anticyclone occurs over the WNP, transporting more moisture to the region of southern China and enhancing precipitation in this region.
The paper extends previous studies by examining the influences of El Niño and pIOD separately as well as together throughout their entire phases [33,36,37]. The major findings of the current study are that the influences of the El Nino/pIOD on the precipitation in China and their relationship with the large-scale atmospheric circulation vary from one season to another. For example, the anomalous cyclonic circulation over the Philippines in the developing spring and summer is replaced by the WNP anticyclone during the autumn of the pure El Niño years. Correspondingly, there is a seasonal reversal of precipitation over southeastern China, with deficient precipitation occurring in this region before the onset of anomalous wet conditions in the developing autumn of pure El Niño years.
In summary, these findings provide valuable information for improving the long-term forecasting of precipitation in China. In addition, they are helpful for improving decision-making support and drought/flood mitigation and planning and development of agricultural activities under the influences of natural climate variability. However, there are some uncertainties in our results because of the limited length of the observational data records. In addition, our results may also have been influenced by other air–sea oscillations, e.g., the Pacific Decadal Oscillation [61,62,63,64] or Atlantic Multidecadal Oscillation [65,66], with independent and complementary effects. These challenges suggest the need to investigate the robustness of these conclusions in a future study by employing atmospheric general circulation model sensitivity experiments.

Author Contributions

C.L. designed the research, processed the meteorological data, and wrote the manuscript. C.L. and T.Z. contributed scientific discussion. C.L. and T.Z. contributed to reviewing the manuscript.

Funding

This work was supported by the National Key Research and Development Program of China (2016YFA0600402), and the National Natural Science Foundation of China (41790475 and 41605066).

Acknowledgments

All figures were produced using the NCAR Command Language (NCL). The Climate Research Unit Time Series version 3.22 data were downloaded from (http://data.ceda.ac.uk/badc/cru/data/cru_ts/cru_ts_3.22). The monthly water vapor fluxes were directly downloaded from ERA-40 for the period 1950–1978 (apps.ecmwf.int/datasets/data/era40-moda/levtype=sfc/) and ERA-Interim from 1979 onwards (apps.ecmwf.int/datasets/data/interim-full-moda/levtype=sfc/). The Hadley Centre Global Sea Ice and Sea Surface Temperature dataset were obtained from (www.metoffice.gov.uk/hadobs/hadisst/data/download.html).

Conflicts of Interest

The authors declare that there are no conflicts of interest regarding the publication of this paper.

References

  1. Piao, S.; Ciais, P.; Huang, Y.; Shen, Z.; Peng, S.; Li, J.; Friedlingstein, P. The impacts of climate change on water resources and agriculture in China. Nature 2010, 467, 43–51. [Google Scholar] [CrossRef] [PubMed]
  2. Varis, O.; Vakkilainen, P. China’s 8 challenges to water resources management in the first quarter of the 21st century. Geomorphology 2001, 41, 93–104. [Google Scholar] [CrossRef]
  3. Zhai, J.; Su, B.; Krysanova, V.; Vetter, T.; Gao, C.; Jiang, T. Spatial variation and trends in PDSI and SPI indices and their relation to streamflow in 10 large regions of China. J. Climate 2010, 23, 649–663. [Google Scholar] [CrossRef]
  4. Ministry of Water Resources of the People’s Republic of China. Bulletin of Flood and Drought Disaster in China; SinoMaps Press: Beijing, China, 2017.
  5. Bjerknes, J. Atmospheric teleconnections from the equatorial Pacific. Mon. Weather Rev. 1969, 97, 163–172. [Google Scholar] [CrossRef]
  6. Rasmusson, E.M.; Carpenter, T.H. Variations in tropical sea surface temperature and surface wind fields associated with the Southern Oscillation/El Niño. Mon. Weather Rev. 1982, 110, 354–384. [Google Scholar] [CrossRef]
  7. Philander, S.G. El Niño, La Niña, and the Southern Oscillation; Academic Press: London, UK, 1990; p. 289. [Google Scholar]
  8. Neelin, J.D.; Battisti, D.S.; Hirst, A.C.; Jin, F.F.; Wakata, Y.; Yamagata, T.; Zebiak, S.E. ENSO theory. J. Geophys. Res. Oceans 1998, 103, 14262–14290. [Google Scholar]
  9. Zhou, L.T.; Wu, R.G. Respective impacts of the East Asian winter monsoon and ENSO on winter rainfall in China. J. Geophys. Res. 2010, 115, D02107. [Google Scholar] [CrossRef]
  10. Wang, C.; Deser, C.; Yu, J.Y.; DiNezio, P.; Clement, A. El Niño-Southern Oscillation (ENSO): A review. In Coral Reefs of the Eastern Pacific; Glymn, P., Manzello, D., Enochs, I., Eds.; Springer Science Publisher: New York, NY, USA, 2016; pp. 85–106. [Google Scholar]
  11. Li, C.Y. Interaction between anomalous winter monsoon in East Asia and El Nino events. Adv. Atmos. Sci. 1990, 7, 36–46. [Google Scholar]
  12. Liu, Y.Q.; Ding, Y.H. Reappraisal of the influence of ENSO events on seasonal precipitation and temperature in China. Sci. Atmos. Sin. 1995, 19, 200–208. [Google Scholar]
  13. Zhang, R.; Sumi, A.; Kimoto, M. A diagnostic study of the impact of El Nino on the precipitation in China. Adv. Atmos. Sci. 1999, 16, 229–241. [Google Scholar] [CrossRef]
  14. Wu, R.; Hu, Z.Z.; Kirtman, B.P. Evolution of ENSO-related rainfall anomalies in East Asia. J. Clim. 2003, 16, 3742–3758. [Google Scholar] [CrossRef]
  15. Chan, J.C.L.; Zhou, W. PDO, ENSO and early summer monsoon rainfall over south China. Geophys. Res. Lett. 2005, 32, L08810. [Google Scholar] [CrossRef]
  16. Ma, Z.G.; Shao, L.J. Relationship between dry/wet variation and the Pacific Decade Oscillation (PDO) in northern China during the last 100 years. Chin. J. Atmos. Sci. 2006, 30, 464–474. [Google Scholar]
  17. Feng, J.; Chen, W.; Tam, C.Y.; Zhou, W. Different impacts of El Niño and El Niño Modoki on China rainfall in the decaying phases. Int. J. Climatol. 2011, 31, 2091–2101. [Google Scholar] [CrossRef]
  18. Ouyang, R.; Liu, W.; Fu, G.; Liu, C.; Hu, L.; Wang, H. Linkages between ENSO/PDO signals and precipitation, streamflow in China during the last 100 years. Hydrol. Earth Syst. Sci. 2014, 18, 3651–3661. [Google Scholar] [CrossRef] [Green Version]
  19. Feng, J.; Li, J. Influence of El Niño Modoki on spring rainfall over south China. J. Geophys. Res. Atmos. 2011, 116, D13102. [Google Scholar] [CrossRef]
  20. Zhang, Q.; Li, J.; Singh, V.P.; Xu, C.-Y.; Deng, J. Influence of ENSO on precipitation in the East River basin, south China. J. Geophys. Res. Atmos. 2013, 118, 2207–2219. [Google Scholar] [CrossRef]
  21. Zhang, W.; Jin, F.F.; Turner, A. Increasing autumn drought over southern China associated with ENSO regime shift. Geophys. Res. Lett. 2014, 41, 4020–4026. [Google Scholar] [CrossRef] [Green Version]
  22. Islam, M.; Chan, A.; Ashfold, M.; Ooi, C.; Azari, M. Effects of El-Niño, Indian Ocean dipole, and Madden-Julian oscillation on surface air temperature and rainfall anomalies over Southeast Asia in 2015. Atmosphere 2018, 9, 352. [Google Scholar] [CrossRef]
  23. Gao, J.; You He, Y.; Masson-Delmotte, V.; Yao, T. ENSO Effects on annual variations of summer precipitation stable isotopes in Lhasa, southern tibetan plateau. J. Clim. 2018, 31, 1173–1182. [Google Scholar] [CrossRef]
  24. Huang, R.H.; Wu, Y.F. The influence of ENSO on the summer climate change in China and its mechanism. Adv. Atmos. Sci. 1989, 6, 21–32. [Google Scholar] [CrossRef]
  25. Lau, K.M.; Weng, H.Y. Coherent modes of global SST and summer rainfall over China: An assessment of the regional impacts of the 1997–1998 El Nino. J. Clim. 2001, 14, 1294–1308. [Google Scholar] [CrossRef]
  26. Saji, N.H.; Goswami, B.N.; Vinayachandran, P.N.; Yamagata, T. A dipole mode in the tropical Indian Ocean. Nature 1999, 401, 360–363. [Google Scholar] [CrossRef] [PubMed]
  27. Webster, P.J.; Moore, A.M.; Loschnigg, J.P.; Leben, R.R. Coupled ocean—Atmosphere dynamics in the Indian Ocean during 1997–1998. Nature 1999, 401, 356–360. [Google Scholar] [CrossRef] [PubMed]
  28. Li, C.Y.; Mu, M. The influence of the Indian Ocean dipole on atmospheric circulation and climate. Adv. Atmos. Sci. 2001, 18, 831–843. [Google Scholar] [CrossRef]
  29. Guan, Z.; Yamagata, T. The unusual summer of 1994 in East Asia: IOD teleconnections. Geophys. Res. Lett. 2003, 30, 1544. [Google Scholar] [CrossRef]
  30. Yang, J.; Liu, Q.; Xie, S.P.; Liu, Z.; Wu, L. Impact of the Indian ocean SST basin mode on the Asian summer monsoon. Geophys. Res. Lett. 2007, 34, L02708. [Google Scholar] [CrossRef]
  31. Yuan, Y.; Yang, H.; Zhou, W.; Li, C. Influences of the Indian Ocean dipole on the Asian summer monsoon in the following year. Int. J. Climatol. 2008, 28, 1849–1859. [Google Scholar] [CrossRef]
  32. Hong, C.C.; Lu, M.M.; Kanamitsu, M. Temporal and spatial characteristics of positive and negative Indian Ocean dipole with and without ENSO. J. Geophys. Res. 2008, 113, D08107. [Google Scholar] [CrossRef]
  33. Weng, H.; Wu, G.; Liu, Y.; Behera, S.K.; Yamagata, T. Anomalous summer climate in China influenced by the tropical Indo-Pacific Oceans. Clim. Dyn. 2011, 36, 769–782. [Google Scholar] [CrossRef]
  34. Qiu, Y.; Cai, W.; Guo, X.; Ng, B. The asymmetric influence of the positive and negative IOD events on China’s rainfall. Sci. Rep. 2014, 4, 4943. [Google Scholar] [CrossRef] [PubMed]
  35. Zheng, J.; Liu, Q.; Wang, C.; Zheng, X.T. Impact of heating anomalies associated with rainfall variations over the Indo-Western Pacific on Asian atmospheric circulation in winter. Clim. Dyn. 2013, 40, 2023–2033. [Google Scholar] [CrossRef]
  36. Xu, K.; Zhu, C.; Wang, W. The cooperative impacts of the El Niño-Southern Oscillation and the Indian Ocean Dipole on the interannual variability of autumn rainfall in China. Int. J. Climatol. 2016, 36, 1987–1999. [Google Scholar] [CrossRef]
  37. Xiao, M.; Zhang, Q.; Singh, V.P. Influences of ENSO, NAO, IOD and PDO on seasonal precipitation regimes in the Yangtze River basin, China. Int. J. Climatol. 2015, 35, 3556–3567. [Google Scholar] [CrossRef]
  38. Harris, I.; Jones, P.D.; Osborn, T.J.; Lister, D.H. Updated high-resolution grids of monthly climatic observations—The CRU TS3.10 dataset. Int. J. Climatol. 2014, 34, 623–642. [Google Scholar] [CrossRef]
  39. Simmons, A.J.; Gibson, J.K. The ERA-40 Project Plan. ERA-40 Project Report Series No. 1; ECMWF: Reading, UK, 2000; 63p. [Google Scholar]
  40. Dee, D.P.; Uppala, S.M.; Simmons, A.J.; Berrisford, P.; Poli, P.; Kobayashi, S.; Bechtold, P. The ERA-interim reanalysis: Configuration and performance of the data assimilation system. Q. J. R. Meteorol. Soc. 2011, 137, 553–597. [Google Scholar] [CrossRef]
  41. Huang, R.; Chen, J.; Huang, G. Characteristics and variations of the East Asian monsoon system and its impacts on climate disasters in China. Adv. Atmos. Sci. 2007, 24, 993–1023. [Google Scholar] [CrossRef]
  42. Ding, Y.; Chan, J.C.L. The East Asian summer monsoon: An overview. Meteorol. Atmos. Phys. 2005, 89, 117–142. [Google Scholar]
  43. Chen, W.; Graf, H.; Huang, R. The interannual variability of East Asian winter monsoon and its relation to the summer monsoon. Adv. Atmos. Sci. 2000, 17, 48–60. [Google Scholar]
  44. Rayner NA, A.; Parker, D.E.; Horton, E.B.; Folland, C.K.; Alexander, L.V.; Rowell, D.P.; Kaplan, A. Global analyses of sea surface temperature, sea ice, and night marine air temperature since the late nineteenth century. J. Geophys. Res. 2003, 108, 4407. [Google Scholar] [CrossRef]
  45. Ashok, K.; Guan, Z.; Saji, N.H.; Yamagata, T. Individual and combined influences of ENSO and the Indian Ocean dipole on the Indian summer monsoon. J. Clim. 2004, 17, 3141–3155. [Google Scholar] [CrossRef]
  46. Luo, J.J.; Zhang, R.; Behera, S.K.; Masumoto, Y.; Jin, F.F.; Lukas, R.; Yamagata, T. Interaction between El Niño and extreme Indian Ocean dipole. J. Clim. 2010, 23, 726–742. [Google Scholar] [CrossRef]
  47. Bretherton, C.S.; Smith, C.; Wallace, J.M. An intercomparison of methods for finding coupled patterns in climate data. J. Clim. 1992, 5, 541–560. [Google Scholar] [CrossRef]
  48. Wallace, J.M.; Smith, C.; Bretherton, C.S. Singular value decomposition of wintertime sea surface temperature and 500-mb height anomalies. J. Clim. 1992, 5, 561–576. [Google Scholar] [CrossRef]
  49. Cai, W.; van Rensch, P.; Cowan, T.; Hendon, H.H. Teleconnection pathways of ENSO and the IOD and the mechanisms for impacts on Australian rainfall. J. Clim. 2011, 24, 3910–3923. [Google Scholar] [CrossRef]
  50. Weller, E.; Cai, W. Asymmetry in the IOD and ENSO teleconnection in a CMIP5 model ensemble and its relevance to regional rainfall. J. Clim. 2013, 26, 5139–5149. [Google Scholar] [CrossRef]
  51. Heideman, K.F.; Fritsch, J.M. Forcing mechanisms and other characteristics of significant summertime precipitation. Weather Forecast. 1988, 3, 115–130. [Google Scholar] [CrossRef]
  52. Li, X.; Zhou, W.; Chen, D.; Li, C.; Song, J. Water vapor transport and moisture budget over Eastern China: Remote forcing from the two types of El Ninño. J. Clim. 2014, 27, 8778–8792. [Google Scholar] [CrossRef]
  53. Nitta, T. Convective activities in the tropical western Pacific and their impact on the northern hemisphere summer circulation. J. Meteorol. Soc. Jpn. 1987, 65, 373–390. [Google Scholar] [CrossRef]
  54. Huang, R.; Sun, F. Impacts of the tropical western Pacific on the East Asian summer monsoon. J. Meteorol. Soc. Jpn. 1992, 70, 243–256. [Google Scholar] [CrossRef]
  55. Wang, B.; Wu, R.; Fu, X. Pacific—East Asian teleconnection: How does ENSO affect east Asian climate. J. Clim. 2000, 13, 1517–1536. [Google Scholar] [CrossRef]
  56. Kosaka, Y.; Nakamura, H. Structure and dynamics of the summertime Pacific—Japan teleconnection pattern. Q. J. R. Meteorol. Soc. 2006, 132, 2009–2030. [Google Scholar] [CrossRef]
  57. Zhang, W.; Jin, F.F.; Li, J.; Ren, H.L. Contrasting impacts of two-type El Niño over the western North Pacific during boreal autumn. J. Meteorol. Soc. Jpn. 2011, 89, 563–569. [Google Scholar] [CrossRef]
  58. Ashok, K.; Guan, Z.; Yamagata, T. Impact of the Indian Ocean dipole on the relationship between the Indian monsoon rainfall and ENSO. Geophys. Res. Lett. 2001, 28, 4499–4502. [Google Scholar] [CrossRef] [Green Version]
  59. Saji, N.H.; Yamagata, T. Possible impacts of Indian Ocean dipole events on global climate. Clim. Res. 2003, 25, 151–169. [Google Scholar] [CrossRef]
  60. Chang, C.P.; Zhang, Y.; Li, T. Interannual and interdecadal variations of the East Asian summer monsoon and tropical Pacific SSTs. Part I: Roles of the subtropical ridge. J. Clim. 2000, 13, 4310–4325. [Google Scholar] [CrossRef]
  61. Lu, R.; Dong, B.; Ding, H. Impact of the Atlantic multidecadal oscillation on the Asian summer monsoon. Geophys. Res. Lett. 2006, 33, L24701. [Google Scholar] [CrossRef]
  62. Ma, Z. The interdecadal trend and shift of dry/wet over the central part of North China and their relationship to the Pacific decadal oscillation (PDO). Chin. Sci. Bull. 2007, 52, 2130–2139. [Google Scholar] [CrossRef]
  63. Qian, C.; Zhou, T. Multidecadal variability of north China aridity and its relationship to PDO during 1900–2010. J. Clim. 2014, 27, 1210–1222. [Google Scholar] [CrossRef]
  64. Fan, Y.; Fan, K. Pacific decadal oscillation and the decadal change in the intensity of the interannual variability of the South China sea summer monsoon. Atmos. Ocean. Sci. Lett. 2017, 10, 162–167. [Google Scholar] [CrossRef]
  65. Qian, C.; Yu, Y.; Chen, G. Decadal summer drought frequency in China: The increasing influence of the Atlantic Multi-decadal Oscillation. Environ. Res. Lett. 2014, 9, 124004. [Google Scholar] [CrossRef]
  66. Hao, X.; He, S. Combined effect of ENSO-like and atlantic multidecadal oscillation SSTAs on the interannual variability of the East Asian winter monsoon. J. Clim. 2017, 30, 2697–2716. [Google Scholar] [CrossRef]
Figure 1. Heterogeneous regression patterns of the first singular value decomposition (SVD) mode for the de-trended and normalized (a) SST during October–November–December (OND), and (b) annual precipitation. (c) The normalized time series of the SVD expansion coefficients of SST (red solid line) and precipitation (blue solid line), and seasonal indices of Nino3.4 (November–December–January (NDJ); pink dashed line) and Dipole Mode Index (DMI) (September–October–November (SON); black dashed line); Values shown in the parentheses indicate the correlation coefficients among the two expansion coefficient time series and Nino3.4 and DMI, respectively. (d) Regression of expansion coefficient time series for the annual precipitation SVD pattern in (c) with OND SST. The stippling indicates statistically significant at the 90% level.
Atmosphere 10 00372 g001
Figure 2. Lead–lag correlations between precipitation and (a) NDJ Nino3.4, and (b) SON DMI. Shown is the seasonally de-trended precipitation anomaly averaged over in China from 1950 to 2013. The horizontal dashed lines represent the 90% confidence level. The years which are post-fixed with (0) and (1) indicate the El Niño–Southern Oscillation (ENSO)-/Indian Ocean Dipole (IOD)-developing and subsequent years, respectively. Long light gray bars highlight the period from April(0) to September(1).
Atmosphere 10 00372 g002
Figure 3. Composites of precipitation (%) and vertically integrated water vapor flux (kg·m−1·s−1) anomalies during (a) April to June (AMJ(0)), (b) July to September (JAS(0)), and (c) October to December (OND(0)) in the developing phase, and the following (d) January to March (JFM(1)), (e) April to June (AMJ(1)), and (f) July to September (JAS(1)) for the pure El Nino years. Precipitation anomalies are presented as percent differences from the long-term average during 1950–2013. The stippling represents statistically significant at the 90% level for precipitation.
Atmosphere 10 00372 g003
Figure 4. Partial regression coefficients (mm/day per °C) of the precipitation anomalies onto the Nino3.4 index, having removed the influence of IOD during the period of 1950–2013. Shown are during (a) April to June (AMJ(0)), (b) July to September (JAS(0)), and (c) October to December (OND(0)) in the developing phase, and the following (d) January to March (JFM(1)), (e) April to June (AMJ(1)), and (f) July to September (JAS(1)). The stippling indicates statistically significant at the 90% level.
Atmosphere 10 00372 g004
Figure 5. Same as in Figure 3, but for the pure positive IOD years when the Indian Ocean SST dipole occurred in the non-El Nino years. Shown are during (a) April to June (AMJ(0)), (b) July to September (JAS(0)), and (c) October to December (OND(0)) in the developing phase, and the following (d) January to March (JFM(1)), (e) April to June (AMJ(1)), and (f) July to September (JAS(1)).
Atmosphere 10 00372 g005
Figure 6. Partial regression coefficients (mm/day per °C) of the precipitation anomalies onto the DMI index, having removed the influence of ENSO during the period of 1950–2013. Shown are during (a) April to June (AMJ(0)), (b) July to September (JAS(0)), and (c) October to December (OND(0)) in the developing phase, and the following (d) January to March (JFM(1)), (e) April to June (AMJ(1)), and (f) July to September (JAS(1)). The stippling indicates statistically significant at the 90% level.
Atmosphere 10 00372 g006
Figure 7. Same as in Figure 3, but for combined years. In these years, the Indian Ocean Dipole and the El Nino simultaneously occurred. Shown are during (a) April to June (AMJ(0)), (b) July to September (JAS(0)), and (c) October to December (OND(0)) in the developing phase, and the following (d) January to March (JFM(1)), (e) April to June (AMJ(1)), and (f) July to September (JAS(1)).
Atmosphere 10 00372 g007
Table 1. List of pure El Niño, pure positive Indian Ocean Dipole (IOD) (pIOD), and combined events during 1950–2013.
Pure El Niño EventsPure pIOD EventsCombined Events
1951, 1957, 1965, 1969,
1976, 1986, 2009
1961, 1967, 2007,
2008, 2011, 2012
1963, 1972, 1982, 1987,
1991, 1994, 1997, 2002, 2006
Table 2. The pattern correlation between the composite precipitation anomaly in combined years and the Nino3.4- and DIM-regressed precipitation anomaly as well as the sum of the regressed patterns during the six consecutive seasons, respectively.
Season
AMJ(0)JAS(0)OND(0)JFM(1)AMJ(1)JAS(1)
Nino3.40.640.740.910.950.680.49
DMI0.610.810.890.690.620.61
Nino3.4 + DMI0.670.860.930.900.700.66

