1. Introduction
Surface air temperature (SAT) is one of the fundamental indicators for the climate change and variability. Changes in the SAT have significant impacts on the ecosystem, agriculture, fisheries, development of society and economy, as well as people’s daily activities [
1,
2,
3,
4,
5,
6,
7,
8,
9,
10,
11]. For example, studies have demonstrated that the total summer crop yield over north China has a notable relationship with the local summer SAT [
1]. Anomalous cold SAT would lead to substantial loss in the crop yield over north China [
1]. The extremely high SAT and associated heat wave in summer of 2003 and 2010 over Europe result in large-scale forest fire and human death [
3,
12,
13,
14]. The extremely anomalous cold SAT in February 2008 and the record-breaking anomalous warm SAT event happened in April 2016; both resulted in substantial impacts on energy consumption, agriculture and people’s activities over many parts of the southeast Asia [
15,
16,
17]. Furthermore, it has been demonstrated that a change in the Eurasian SAT can alter the temperature difference between the Eurasia and the surrounding ocean, which further modulates activity of the Asian monsoon [
18,
19]. Due to substantial impact of the Eurasian SAT, it is important to improve our understanding of the SAT variations and the related driving factors for the variations.
Several previous studies have investigated the leading patterns of SAT anomalies over Eurasia [
11,
20,
21,
22,
23,
24]. It is found that the leading empirical orthogonal function (EOF) pattern of the SAT variation over Asia and the surrounding oceans exhibits a dipole anomaly pattern, which has a close relation with the Arctic Oscillation (AO) [
20]. AO is the first EOF mode of the interannual atmospheric variability over extratropical Northern Hemisphere (NH) during all the seasons [
25,
26,
27,
28,
29,
30,
31]. Chen et al. [
32] reported that the first EOF mode of the summer SAT interannual variation over northeast Asia is characterized by a consistent warm/cold SAT variation pattern. They demonstrated that this leading EOF mode has a close association with an atmospheric teleconnection pattern over Eurasia [
32]. In addition, studies demonstrated that the EOF1 of the mid-high latitudes of Eurasian SAT during boreal spring has a close relation with the spring AO and spring Scandinavia teleconnection pattern [
21,
23].
Compared to the studies regarding the SAT over the Eurasian mid-high latitudes [
20,
21,
22,
23], relatively fewer studies have been done on the SAT interannual variation over southeast Asia. A recent study showed that the leading EOF mode of the interannual variation of winter southeast Asian SAT displays a same-sign SAT anomaly in the southeast Asia [
22]. Chen and Song [
22] demonstrated that the winter AO and Siberian High (SH) intensity both contribute to the SAT anomalies corresponding to the first EOF mode primarily through the wind-generated horizontal temperature advection. Note that several studies indicated that the AO’s impacts on the global climate systems (such as East Asian winter monsoon, El Niño-Southern Oscillation) are unstable [
33,
34,
35,
36]. For example, Li et al. [
33] found that impact of the winter AO on the East Asian winter monsoon underwent a significant interdecadal change around the early 1980s. Chen et al. [
34] showed that influence of the spring AO on the following winter ENSO was significantly enhanced after the early-1970s. Huang et al. [
37] indicated that the relation between the winter AO and the SH intensity was unstable in the past. At present it is still unclear whether the connection of the winter AO and SH intensity with the southeast Asian SAT variation obtained in Chen and Song [
22] has changed in the past. Understanding these interdecadal changes has important implications for the prediction of the winter SAT anomalies over southeast Asia. The main goal of the present study is to examine the interdecadal change in the relation of the winter AO and SH intensity with the winter southeast Asian SAT variation. The underlying mechanisms responsible for the interdecadal changes are also examined.
The rest of this study is organized as follows.
Section 2 describes the dataset and methods used in this study.
Section 3 presents the main results of this study, including the interdecadal change in the connection of the winter AO and SH intensity with the southeast Asian SAT variations and the underlying physical mechanism for the change.
Section 4 provides a summary and discussion.
3. Results
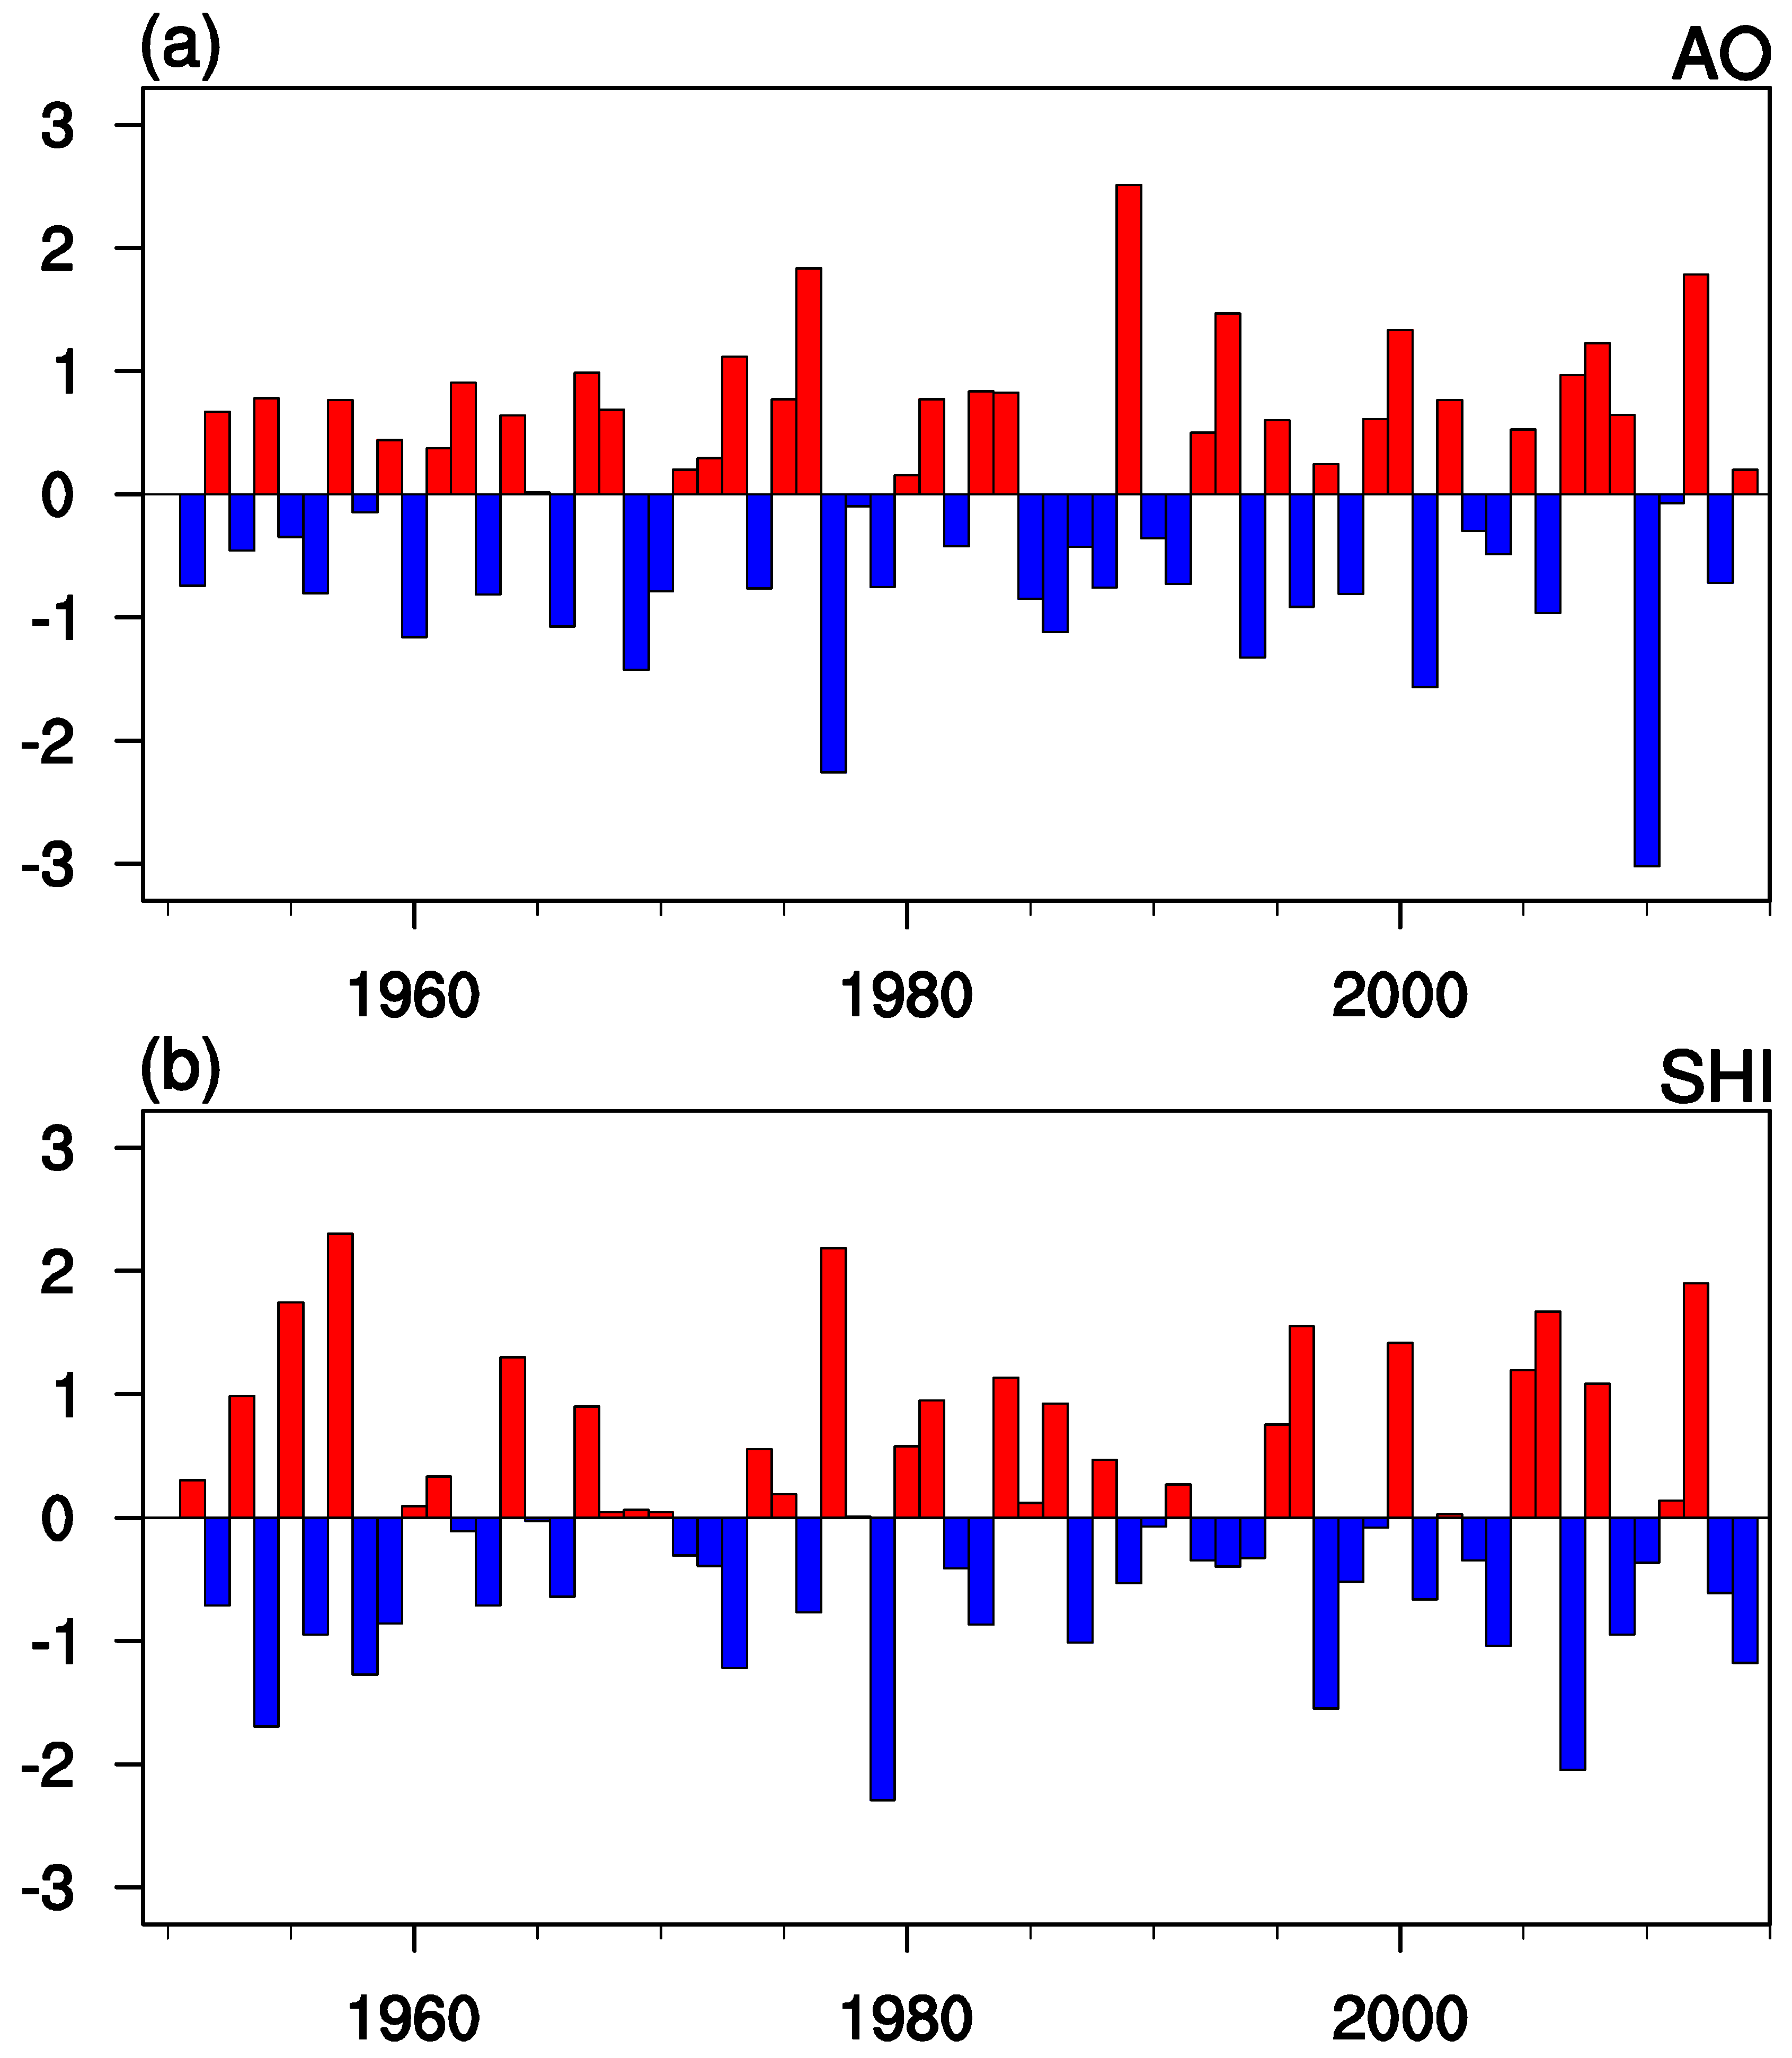
Figure 1a,b display the normalized time series of interannual variations of winter AO and SH intensity index at boreal winter during 1951–2014. The correlation coefficient between the winter AO index and simultaneous SH intensity index is only −0.02, indicating a fairly weak connection of the winter AO with the winter SH intensity index on the interannual timescale during the analysis time period.
Before investigating interdecadal change in the connection of the winter AO and SH intensity with the winter southeast Asian SAT variation, we first investigate the leading EOF mode (EOF1) of SAT over southeast Asia.
Figure 2a exhibits spatial distribution of the EOF1 of SAT anomalies during boreal winter over southeast Asia during 1951–2014. It is noted that SAT anomalies have been weighted by the cosine of the latitude before employing the EOF [
42]. The EOF1 of winter southeast Asian SAT interannual variation explains approximately 58.1% of the total variance. It can be separated from the other EOF modes based on the method proposed by North et al. [
43]. The EOF1 displays consistent SAT variation in the southeast Asia region, with largest loading around the south China and northeast portions of the Indo-China Peninsula and (
Figure 2a). This result is consistent with Chen and Song [
22], who obtained the leading EOF mode of the winter southeast Asian SAT based on the period 1979–2014. The PC time series corresponding to the EOF1 displays clear variation on the interannual timescale (
Figure 2b).
The EOF1 of the original SAT anomalies over southeast Asia bear a resemblance to that shown in
Figure 2. However, the PC time series of EOF1 of the original SAT show significant long-term trends. As the reasons contributing to interannual variation and long-term trend of SAT anomalies may be different, this analysis only examines interannual variation of the SAT. The factor for the long-term trend of the SAT anomalies over southeast Asia needs to be explored in a separate study.
In the following, we further examine the possible interdecadal change in the connection of the winter AO index and SH intensity index with the time series of PC1. The red (blue) curve in
Figure 3 represents the 25-year moving correlation coefficient between the winter AO (SH) index and the time series of PC1. It is noticed that the year labeled in
Figure 3 corresponds to the central year of the 25-year moving window. For example, year 1990 represents period of 1978–2002. It is found that the winter SH intensity index has a significant positive correlation with the time series of PC1 for the winter SAT variation over southeast Asia during the entire analysis period (blue curve). This indicates that change in the SH intensity can stably contribute to the winter southeast Asian SAT interannual variation. By contrast, there exist significant interdecadal change in the connection between the winter AO and the winter southeast Asian SAT anomalies (red curve). The correlation coefficients between the winter AO index and time series of PC1 are fairly weak before approximately the late-1980s, and show an increasing trend since the early-1990s. After the late-1990s, the winter AO becomes significantly correlated with the time series of PC1 for the winter SAT over southeast Asia, with the correlation coefficient significant at the 95% confidence level. Above evidence suggests that the significant correlation between the winter AO and the leading EOF mode of winter SAT over southeast Asia during the period 1979–2014 obtained in Chen and Song [
22] was mainly contributed by their significant correlation period after the late-1990s. We also examine interdecadal change in the relation between the winter SH intensity index and winter AO index in
Figure 3 as denoted by the green curve. It is interesting to note that the interannual variation of the winter AO index has a weak correlation with the interannual variation of the winter SH intensity index during the whole analysis period. Several previous studies indicated that winter AO can exert influences on the East Asian winter surface temperature anomalies via modulating the SH [
25,
40], while in this study, it is found that the relation of the winter AO with the SH intensity index was weak on the interannual timescale.
The above analysis shows that connection of the winter AO with the winter southeast Asian SAT variation experienced a significant interdecadal change around the late-1990s. In the following, the factors responsible for this interdecadal change were further examined. Based on the moving correlation results in
Figure 3, two epochs, with strong and weak winter AO-southeast Asian SAT connections, respectively, were selected. In particular, year 1984 is the central year of the 25-year window (1972–1996) when the winter AO-southeast Asian SAT correlation is the lowest (
Figure 3; red curve). By contrast, year 2000 corresponds to the central year of the 25-year window (1988–2012) when the positive correlation between the winter AO and southeast Asian SAT interannual variation is highest (
Figure 3; red curve). Hence, the difference in the correlation of the winter AO with the time series of PC1 for the winter SAT over southeast Asia during the above two periods (i.e., 1972–1996 and 1988–2012) is the largest. In the following, we will compare the two epochs of 1972–1987 and 1997–2012 (note that the overlying years 1988–1996 are not included in these two epochs) to explore the reasons leading to interdecadal change in the impact of the winter AO on SAT anomalies over southeast Asia. The correlation coefficients between the time series of PC1 of southeast Asian SAT anomalies and the winter AO index during epochs of 1972–1987 and 1997–2012 are −0.16 and 0.51, respectively.
Figure 4a,b display winter SAT anomalies over southeast Asia regressed upon the standardized winter AO index during 1972–1987 and 1997–2012, respectively. The winter SAT anomalies in southeast Asia region associated with the winter AO index show substantial differences between the two epochs (
Figure 4). During 1972–1987, a dipole pattern of SAT anomaly was observed over southeast Asian region during positive phase of the winter AO, with positive anomalies over south China and east coast of the Indo-China Peninsula and anomalies with opposite sign over west coast of the Indo-China Peninsula extending northward to around 30° N (
Figure 4a). However, the SAT anomalies are statistically insignificant (
Figure 4a). This demonstrated that winter AO has a weak contribution to the interannual variation of the winter SAT over southeast Asia during 1972–1987 (
Figure 4a). In comparison, during 1997–2012, most parts of the southeast Asia were occupied by obvious negative SAT anomalies during the positive phase of winter AO. In particular, significant and large negative SAT anomalies were found in the Indo-China Peninsula and patches of the southern China (
Figure 4a). In addition, the anomalous SAT fields in
Figure 4a bear a close resemblance to the first EOF mode of the winter southeast Asian variation in
Figure 2a. This verifies that the winter AO has a significant impact on the winter SAT variation over southeast Asia during 1997–2012. In this epoch, along with the winter SH intensity, the winter AO may also be an important factor for the interannual variations of the winter SAT over southeast Asia.
A further issue needs to be addressed is: what is the possible factor responsible for the interdecadal change in the winter AO’s impact on the southeast Asian SAT anomalies? Chen and Song [
22] demonstrated that the winter AO impacts the southeast Asian SAT by modulating the atmospheric circulation. The resultant atmospheric circulation anomalies influence the southeast Asian SAT mainly through horizontal temperature advection [
22]. In particular, southerly (northerly) wind anomalies generated by the winter AO contribute to positive (negative) SAT anomalies by carrying warmer and moister (colder and drier) air from lower (higher) latitude. In the following, the atmospheric circulation anomalies in association with the winter AO during the two epochs are examined.
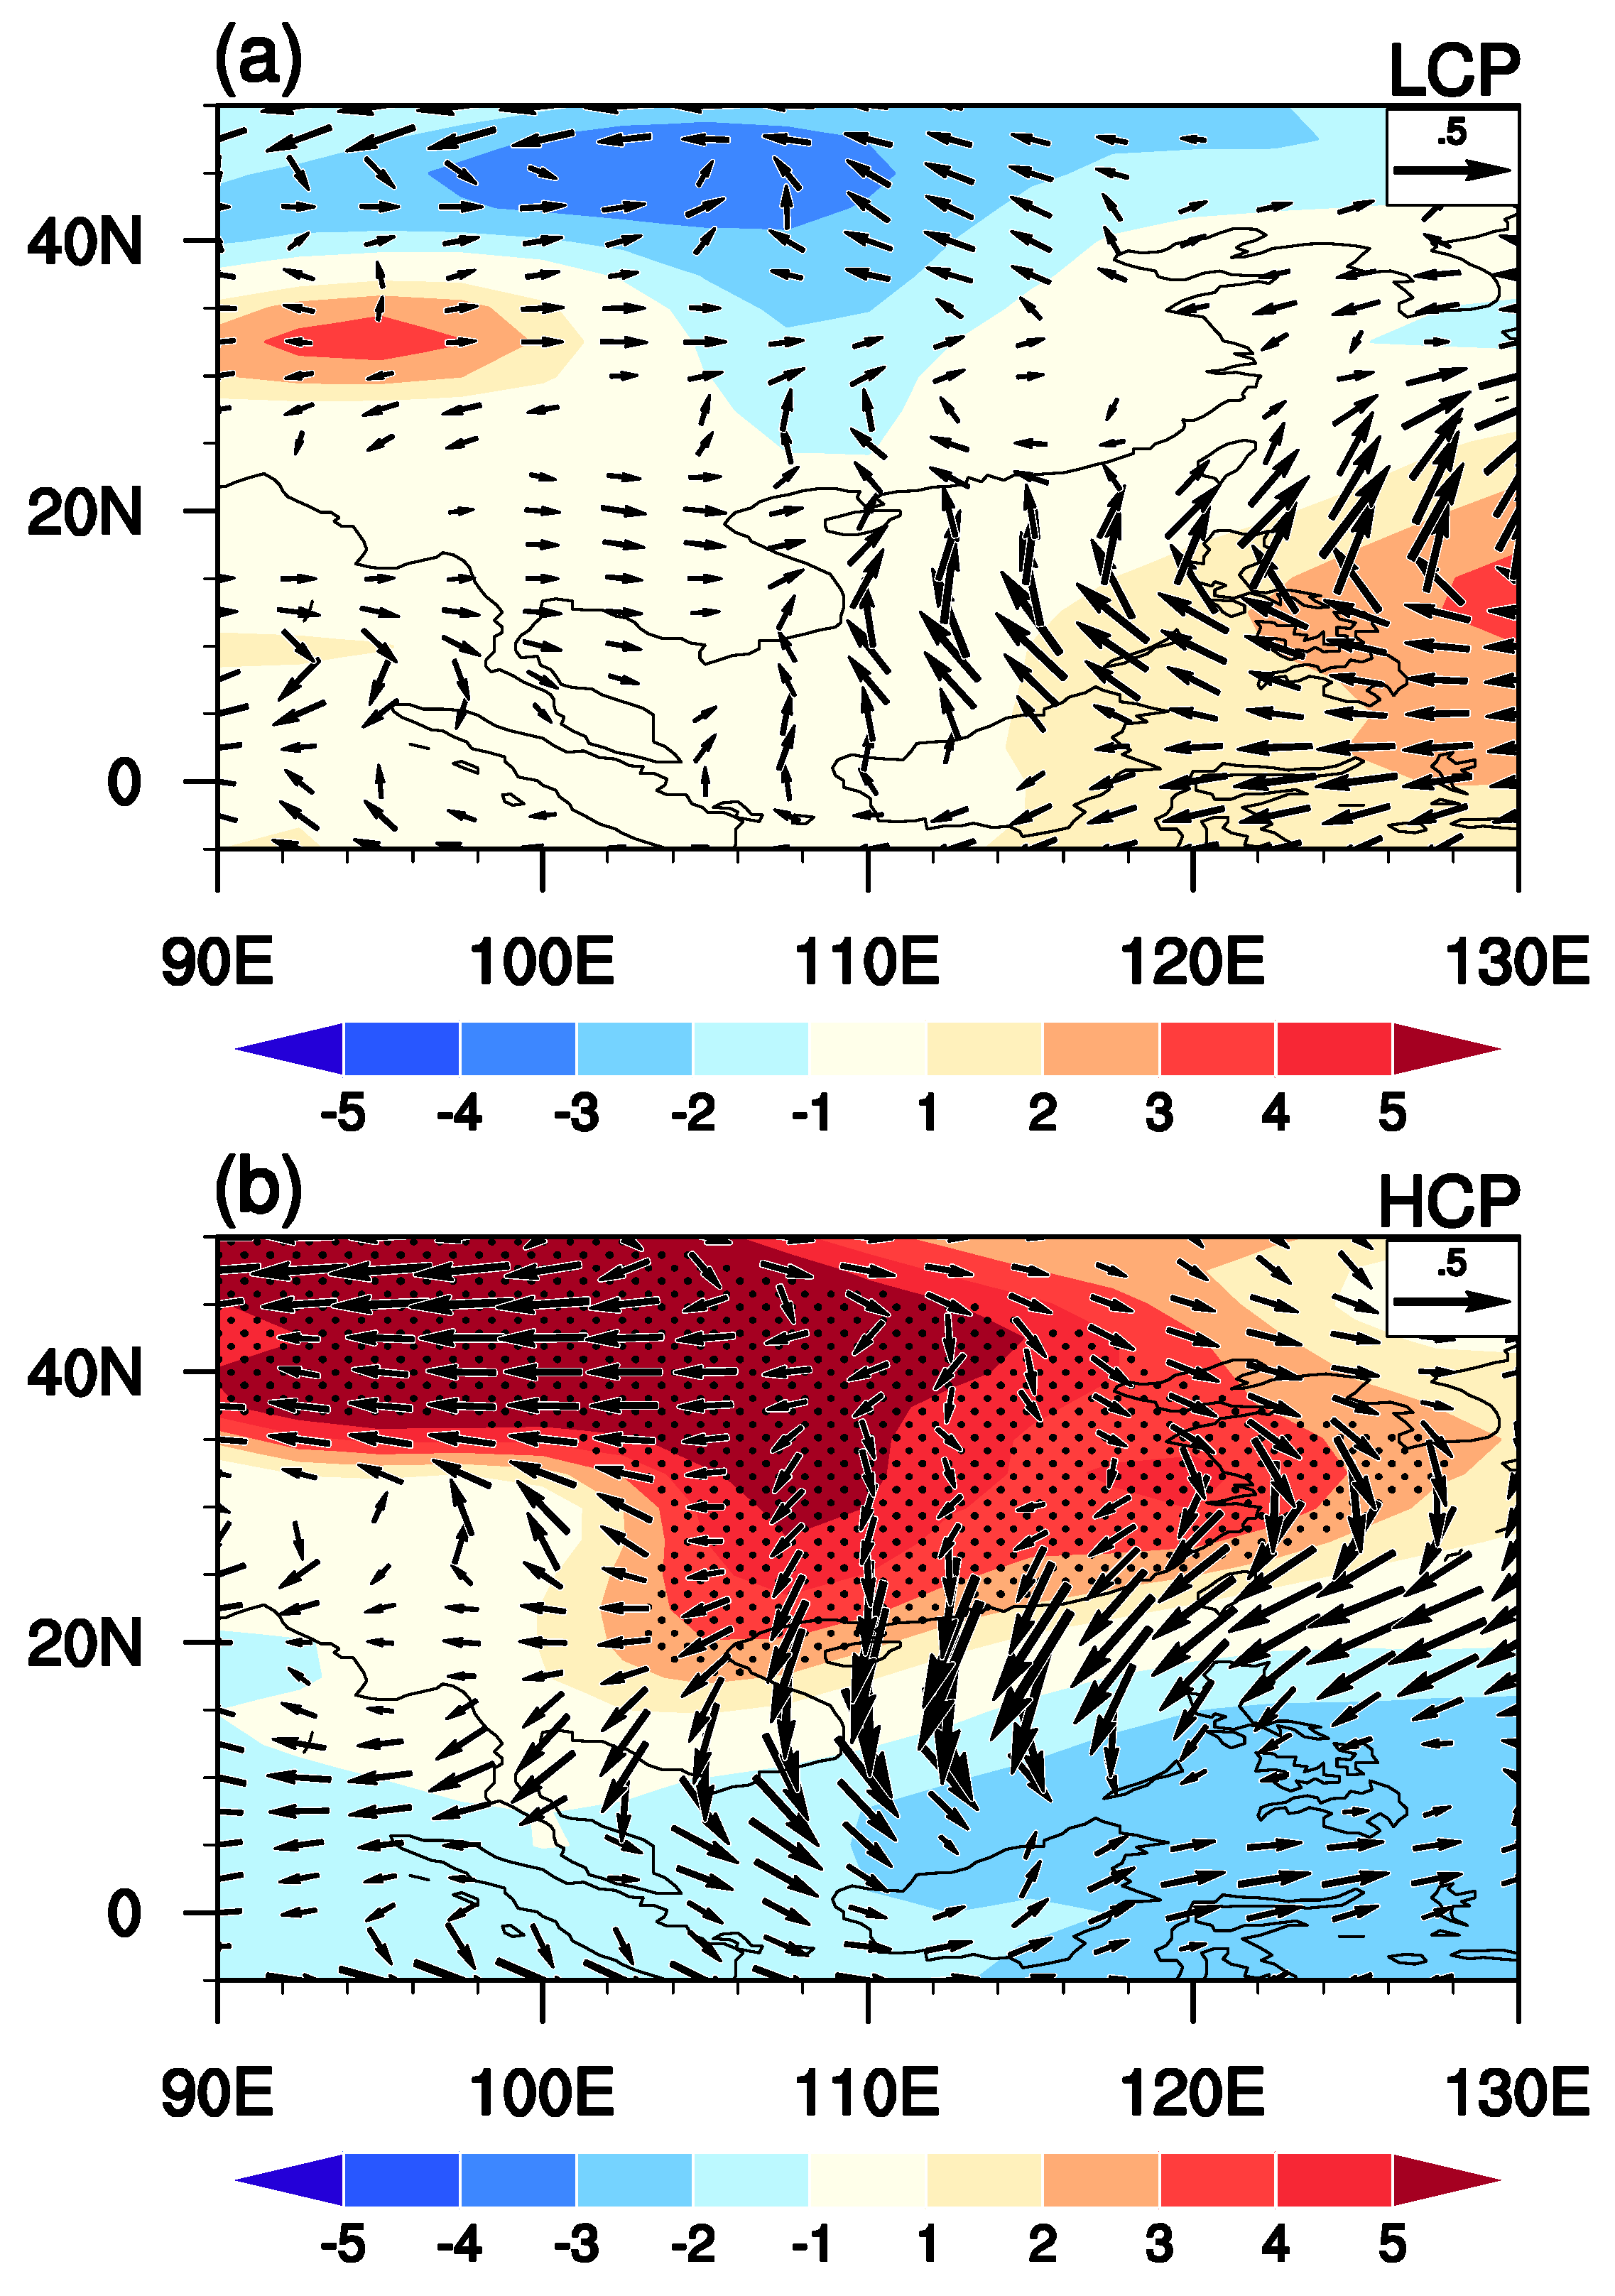
Figure 5a,b exhibit anomalies of winter winds and geopotential height at 1000 hPa obtained by regression on the standardized winter AO index during 1972–1987 and 1997–2012, respectively. During 1972–1987, anomalies of geopotential height at 1000 hPa associated with the winter AO are weak and insignificant over southeast Asia and the surrounding regions (
Figure 5a). The Indo-China Peninsula is occupied by weak westerly wind anomalies (
Figure 5a). In addition, southerly wind anomalies can be seen over the South China sea (
Figure 5a). However, the southerly wind anomalies over south China are very weak (
Figure 5a). Hence, the weak winds anomalies associated with the AO in the southeast Asia region shown in
Figure 5a explain the weak connection between the winter AO and the winter southeast Asian SAT variation during 1972–1987. By contrast, during 1997–2012, large-scale strong and positive geopotential height anomalies are observed over Eurasia between 35°–45° N (
Figure 5b). Significant positive SLP anomalies can also be observed over the regions with significant 1000 hPa geopotential height as will be described later. These strong and significant low-level geopotential heights over mid-latitudes of Eurasia related to the winter AO induce pronounced northerly wind anomalies from the east coast of East Asia to southeast Asia during 1997–2012. The resultant significant northerly wind anomalies explain the formation of significant negative SAT anomalies in most parts of southeast Asia via wind-induced meridional temperature advections (
Figure 4b and
Figure 5b) [
22].
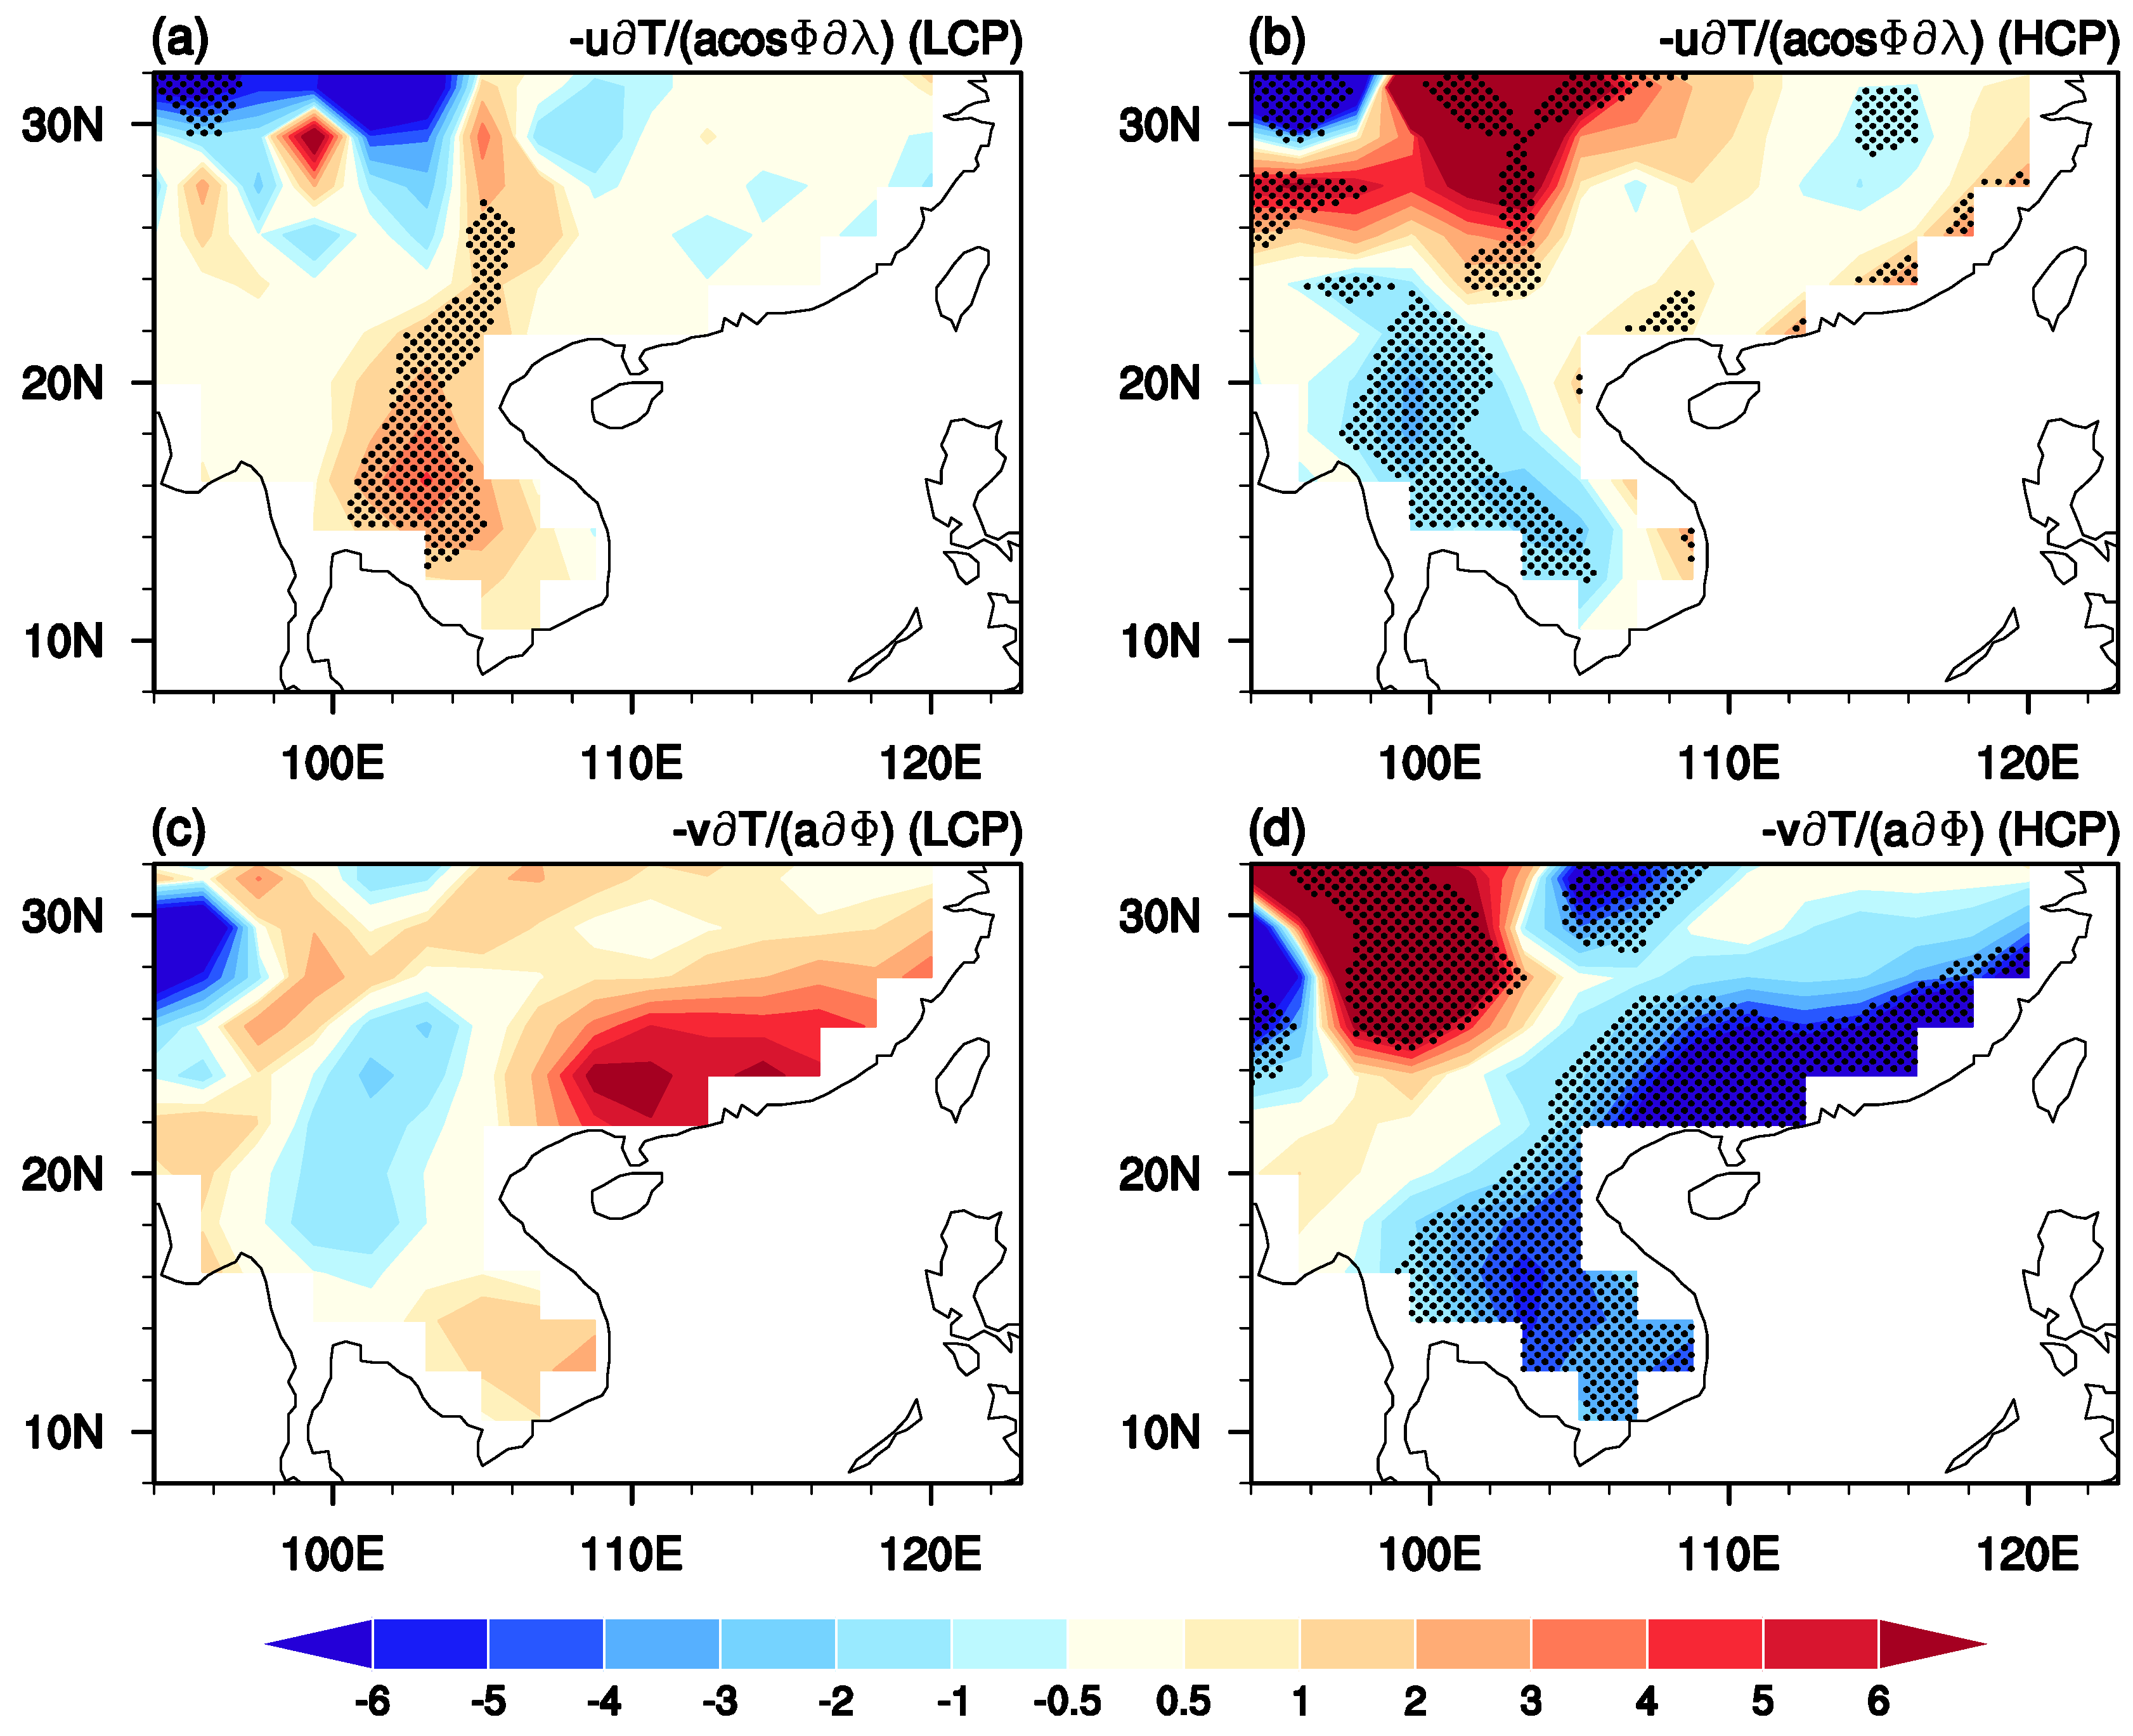
Figure 6 shows anomalies of winter 1000 hPa zonal and meridional surface temperature advections obtained by regression on the standardized winter AO index during 1972–1987 and 1997–2012. It is noted that the horizontal surface temperature advection (
Tadv) is expressed as follows:
Here
,
,
,
,
, and
denote surface zonal and meridional winds, surface temperature, latitude, longitude, and the radius of Earth, respectively. The terms shown in the above equation on the right indicate horizontal zonal temperature advections and meridional surface temperature advections, respectively. During 1972–1987, the warm zonal temperature advection appears in the central Indo-China Peninsula, which is possibly partly due to the westerly wind anomalies that bring warmer and moister air flows from the tropical Indian Ocean (
Figure 5a and
Figure 6a). Anomalies of zonal temperature advection are weak around south China (
Figure 6a). In addition, the meridional temperature advection anomalies are insignificant over the southeast Asian region (
Figure 6c). By contrast, during 1997–2012, strong and significant cold meridional surface temperature anomalies are dominated over the Indo-China Peninsula and south China, largely explaining formation of negative SAT anomalies there during the positive phase of the winter AO (
Figure 6d). Furthermore, it is shown that the anomalies of cold zonal temperature advection also contribute positively to the generation of negative SAT anomalies over western part of the Indo-China Peninsula (
Figure 6b). By contrast, the warm zonal temperature advection around south coast of the south China contributes negatively to the formation of negative SAT anomalies there (
Figure 6b). The cancellation of the warm zonal temperature advection and cold meridional temperature advection may explain relatively weak negative SAT anomalies in association with the winter AO over south China during 1997–2012 (
Figure 4). Overall, differences in the horizontal temperature advection anomalies caused by atmospheric circulation changes between the two epochs explain the difference in the connection between the winter AO and the winter southeast Asian SAT variation during 1972–1987 and 1997–2012.
The above results indicate that the change in the impact of the winter AO on the winter southeast Asian SAT was due to change in the anomalies of atmospheric circulations induced by winter AO.
Figure 7a,b exhibit winter SLP anomalies north of 20° N obtained by regression on the standardized winter AO index during 1972–1987 and 1997–2012, respectively. It is shown that the spatial structure of the winter AO displays notable differences between 1972–1987 and 1997–2012. During 1972–1987, atmospheric signals of the winter AO are confined to the North Atlantic-Europe regions, with significant positive SLP anomalies over mid-latitudes of North Atlantic and negative SLP anomalies over the Arctic region (
Figure 7a). During this period, the structure of the winter AO bears a close resemblance to that related to the winter North Atlantic Oscillation (NAO) [
44]. NAO is the first leading EOF mode of the atmospheric circulation variability over the North Atlantic area [
44]. Several studies indicated that NAO may be the regional manifestation of the AO [
30,
31]. As the significant atmospheric signals of the winter AO are confined to the North Atlantic, the winter AO cannot exert impacts on the southeast Asian SAT variation via associated with atmospheric circulation anomalies (
Figure 4a,
Figure 5a and
Figure 7a).
By contrast, during 1997–2012, the winter AO displays a more zonally symmetric structure, with significant negative SLP anomalies over the Arctic region and positive SLP anomalies over the mid-latitudes (
Figure 7b). In particular, the significant positive SLP anomalies over East China (
Figure 7b), corresponding well to the positive geopotential height there (
Figure 5b), explain the formation of the significant northerly wind anomalies in East Asia and the southeast Asia region (
Figure 6b), which further result in negative anomalies of SAT there (
Figure 4b).
Hence, above evidence suggests that the change in the atmospheric circulation anomalies over Eurasia, particularly over East China, in association with the winter AO, was attributed to the change in the spatial structure of the winter AO, which further explain interdecadal change in the influence of the winter AO on the SAT variation over southeast Asia.
The results above have shown that the winter SH intensity index always has a significant impact on the winter southeast Asian interannual variation during 1951–2014 (
Figure 2). In addition, the significant impact of the winter AO on the southeast Asian SAT variation can only be detected during recent several decades (
Figure 2). This suggests that interannual variation of the southeast Asian SAT in winter was determined by a combination of the winter AO and winter SH intensity during recent decades. In the following, an empirical model was established to hindcast the time series of PC1 for the winter southeast SAT interannual variation based on both the winter SH intensity index and the winter AO index, respectively, during 1988–2014. The period of 1988–2014 was selected as both the winter SH intensity and AO indices have a significant correlation with the leading EOF mode of southeast Asian SAT in winter. It is noted that correlation of the winter SH intensity index and winter AO index is insignificant during 1988–2014 (
Figure 2). The empirical model is presented as follows:
here t represents the year. PC1(t) denote time series of PC1 for winter southeast Asian SAT variation. AO and SHI denote winter AO and SH intensity indices, respectively. The hindcast skill of this empirical model is cross validated though the leave-one-out scheme. The leave-one-out scheme excludes one year from period 1988–2014 and calculates the coefficient of regression by the remaining indices and finally hindcasts the value of the excluded year [
45]. It is found that when both the SHI and AO index are employed to hindcast the time series of PC1 for winter southeast Asian SAT, the cross validated correlation coefficient is about 0.62, which is much larger than that only employing the winter AO (R = 0.34) or SHI (R = 0.4) to hindcast the time series of PC1 (
Figure 8). This result implies that the hindcast skill of southeast SAT interannual variation in winter would be enhanced if the winter SH intensity index and AO index are taken into consideration.
4. Summary and Discussion
This study investigates interdecadal change in the connection of the winter AO and SH intensity with the leading EOF mode of southeast Asian SAT interannual variation based on reanalysis data during 1951–2014. Results show that the SH intensity always has a significant correlation with the southeast Asian SAT interannual variation. Specifically, negative (positive) anomalies of SAT tend to observed in southeast Asia when the winter Siberian High intensity is stronger (weaker). However, the influence of winter AO on the winter SAT anomalies over southeast Asia results in a significant interdecadal change around the late-1990s. Before the late-1990s, the relation between the winter AO and the leading EOF mode of southeast Asian SAT anomalies is fairly weak. Significant negative correlation of the winter AO with the winter southeast Asian SAT anomalies can only be detected during the period after the late-1990s. It is also noted that connection of the winter AO and the SH intensity index on the interannual time scale is weak and statistically insignificant during the whole analysis period.
We further examine the factors responsible for the interdecadal change in the connection between winter AO and southeast Asian SAT variations in winter. Results suggest that interdecadal change in the winter AO-southeast Asian SAT connection was mainly attributed to the change in the spatial structure of the winter AO. In particular, during the period before the late-1990s, atmospheric signals of the winter AO were mainly confined to the North Atlantic region, resembling the NAO. The atmospheric circulation anomalies over mid-latitude of Eurasia and southeast Asia are weak. As such, winter AO cannot exert impacts on the southeast Asian SAT anomalies through wind-induced temperature advection. In comparison, during the period after the late-1990s, the winter AO displays a more zonally symmetric structure, with significant negative SLP anomalies over the Arctic region and significant positive SLP over mid-latitudes of Northern Hemisphere. Specifically, significant positive SLP and 1000 hPa geopotential height anomalies can be found around East China, which induce significant northerly wind anomalies in East Asia and southeast Asia. The resultant pronounced northerly wind anomalies over southeast Asia further contribute to the formation of negative SAT anomalies over most parts of southeast Asia via wind-induced horizontal temperature advection.
Chen and Song [
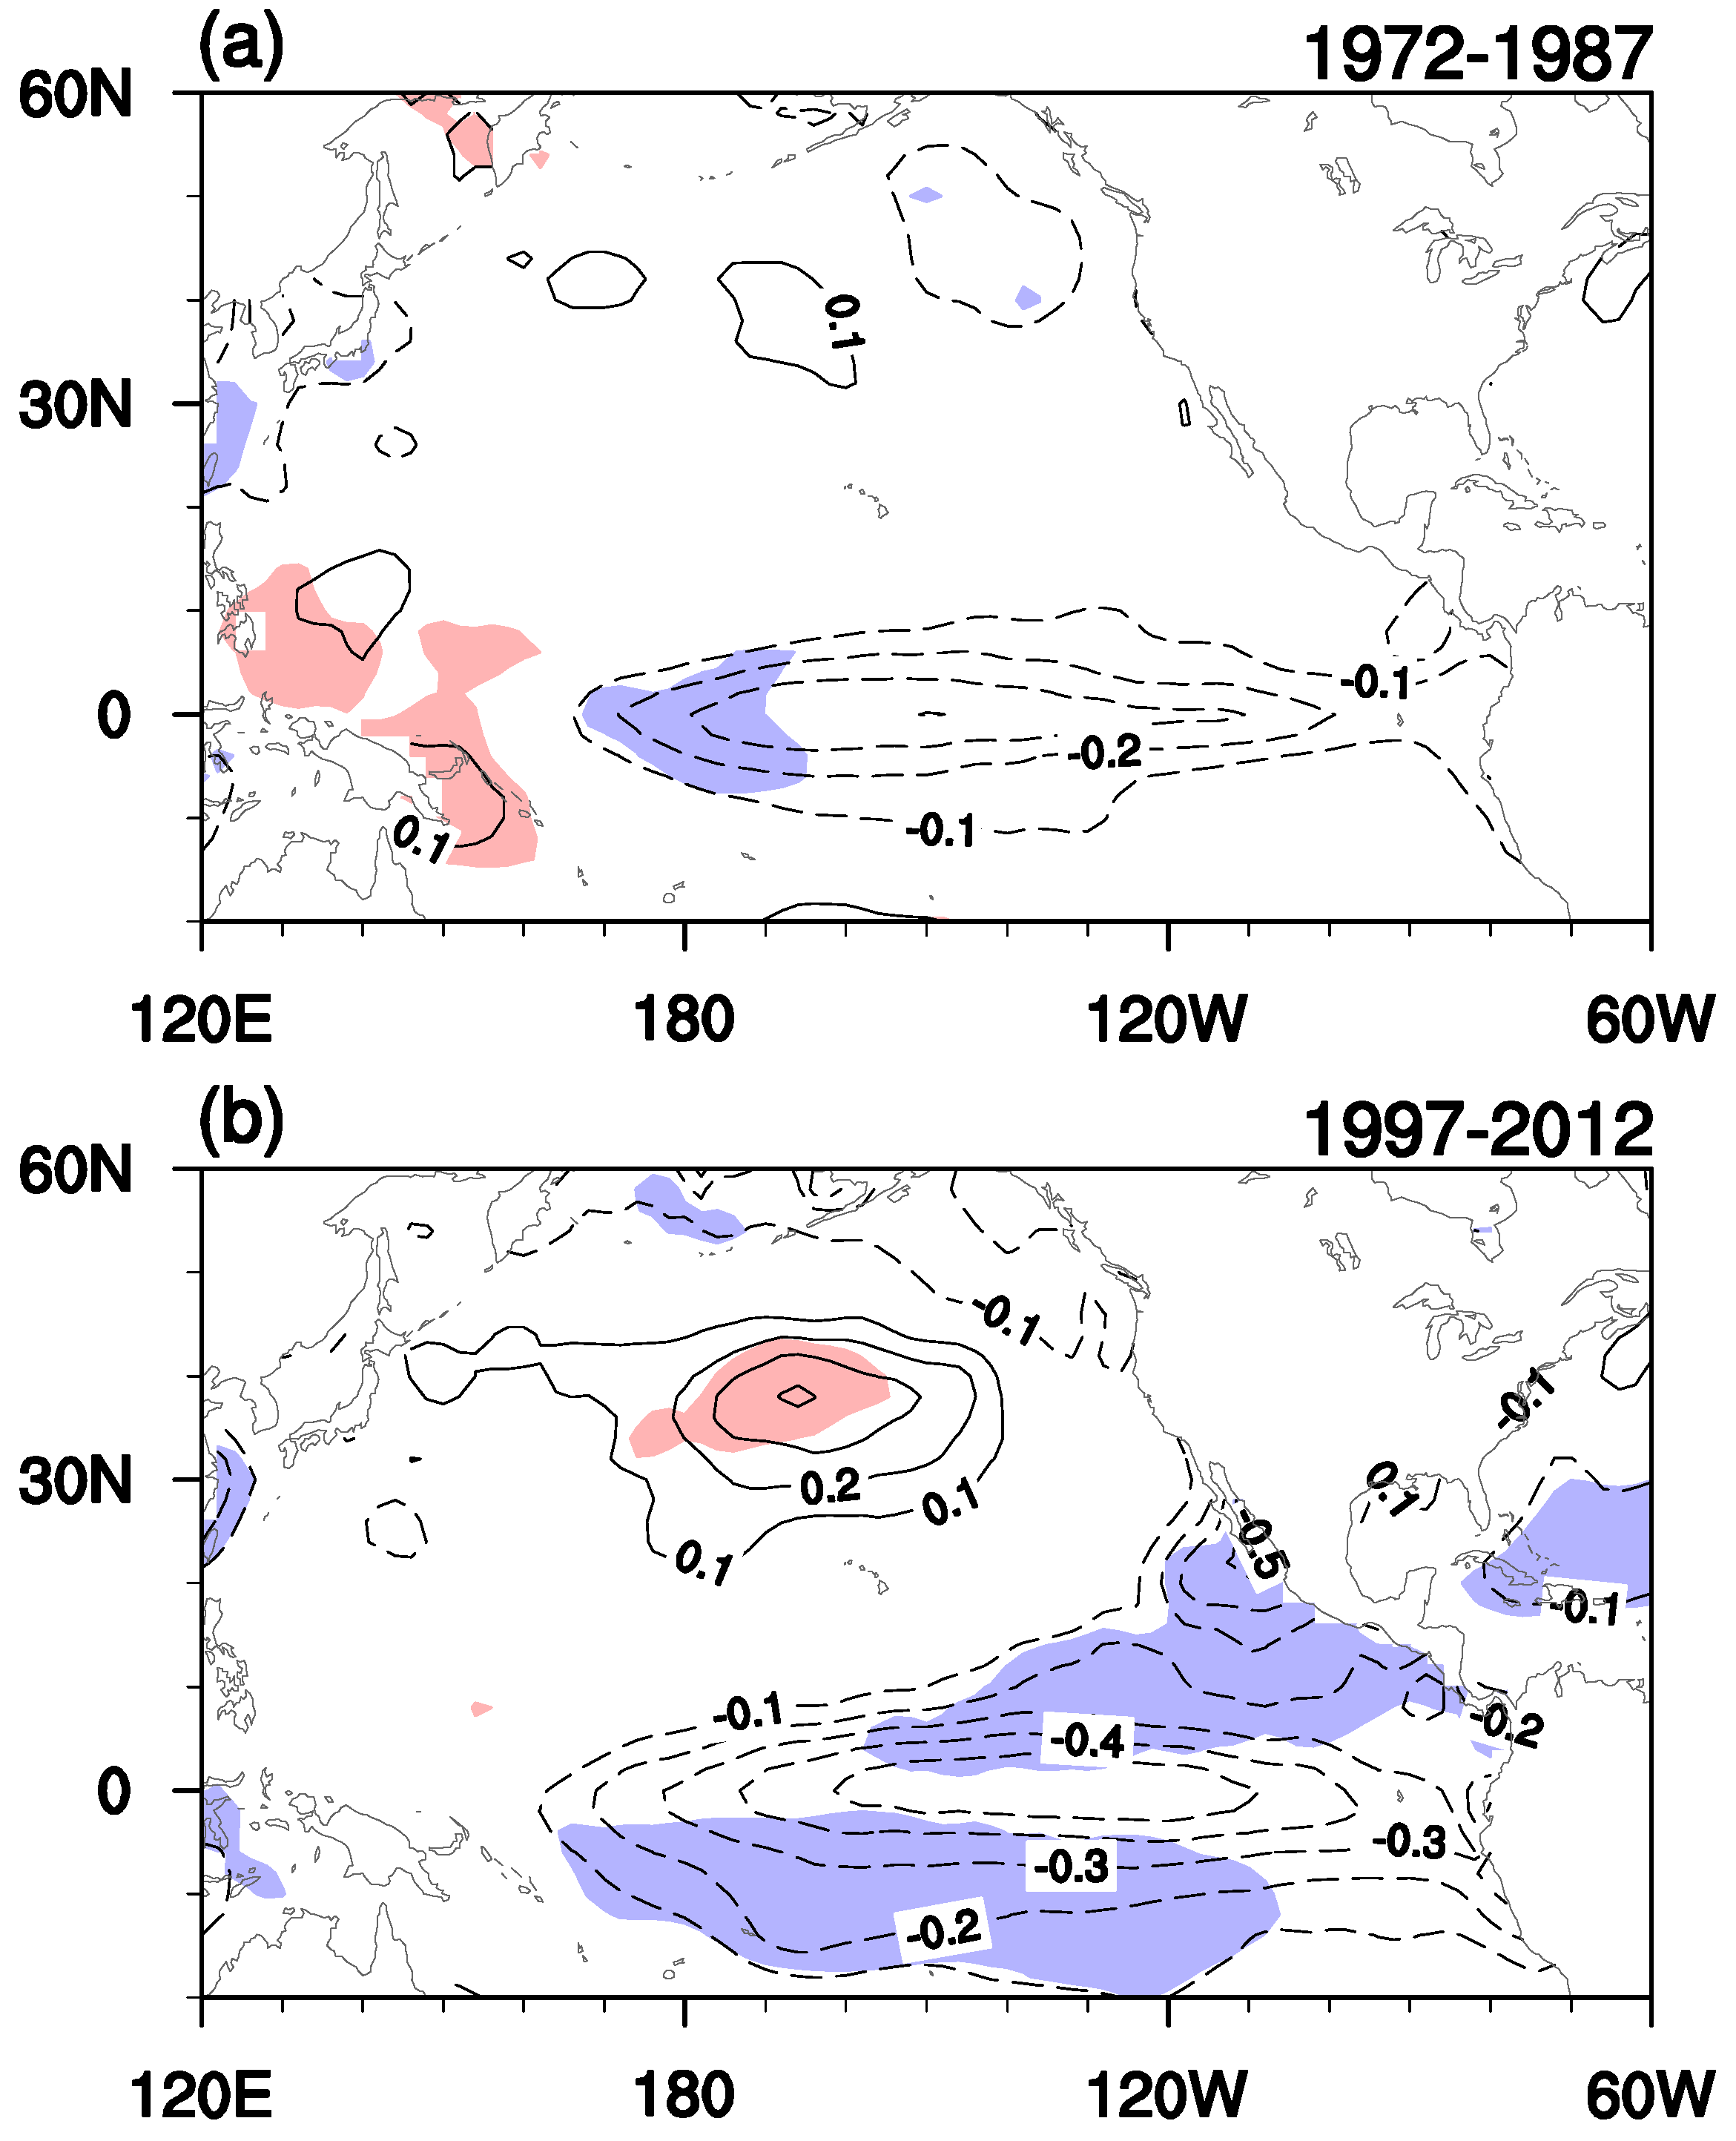
21] showed that the sea surface temperature (SST) anomalies over the tropical central-eastern Pacific also have a significant correlation with the EOF1 of wintertime southeast Asia SAT variation. A question is whether there exists interdecadal change in the relation between the tropical Pacific SST and the winter southeast Asia SAT anomalies around the late-1990s.
Figure 9 displays winter SST anomalies obtained by regression upon the normalized PC time series of EOF1 of winter southeast Asian SAT variation. It is found that SST anomalies in the tropical central-eastern Pacific are stronger and more significant during 1997–2012 compared to those during 1972–1987. This suggests that, similar to winter AO, connection of the tropical Pacific SST with the southeast Asian SAT was also enhanced after the late-1990s.
An issue remains to be further explored in the future is the possible factors for the change in the spatial structure of the winter AO. Studies have demonstrated that structure of the winter AO can be impacted by several factors, such as the solar cycle [
46], polar vortex [
47,
48], the Aleutian Low-Aleutian Low oscillator [
49], and the eastern Pacific atmospheric wave train [
50,
51]. Individual and combined roles of the above factors in modulating the spatial structure of the winter AO need to be investigated in the future.


