NF-kappaB Regulates Redox Status in Breast Cancer Subtypes

 ,
,
Abstract
:1. Introduction
2. Materials and Methods
2.1. Cell Culture and Transfection
2.2. Chemicals
2.3. Expression Chip Array Data Analysis
2.4. Real-Time Reverse Transcription Polymerase Chain Reaction (RT-qPCR)
2.5. Biochemical Analysis
2.6. Statistical Analysis
3. Results
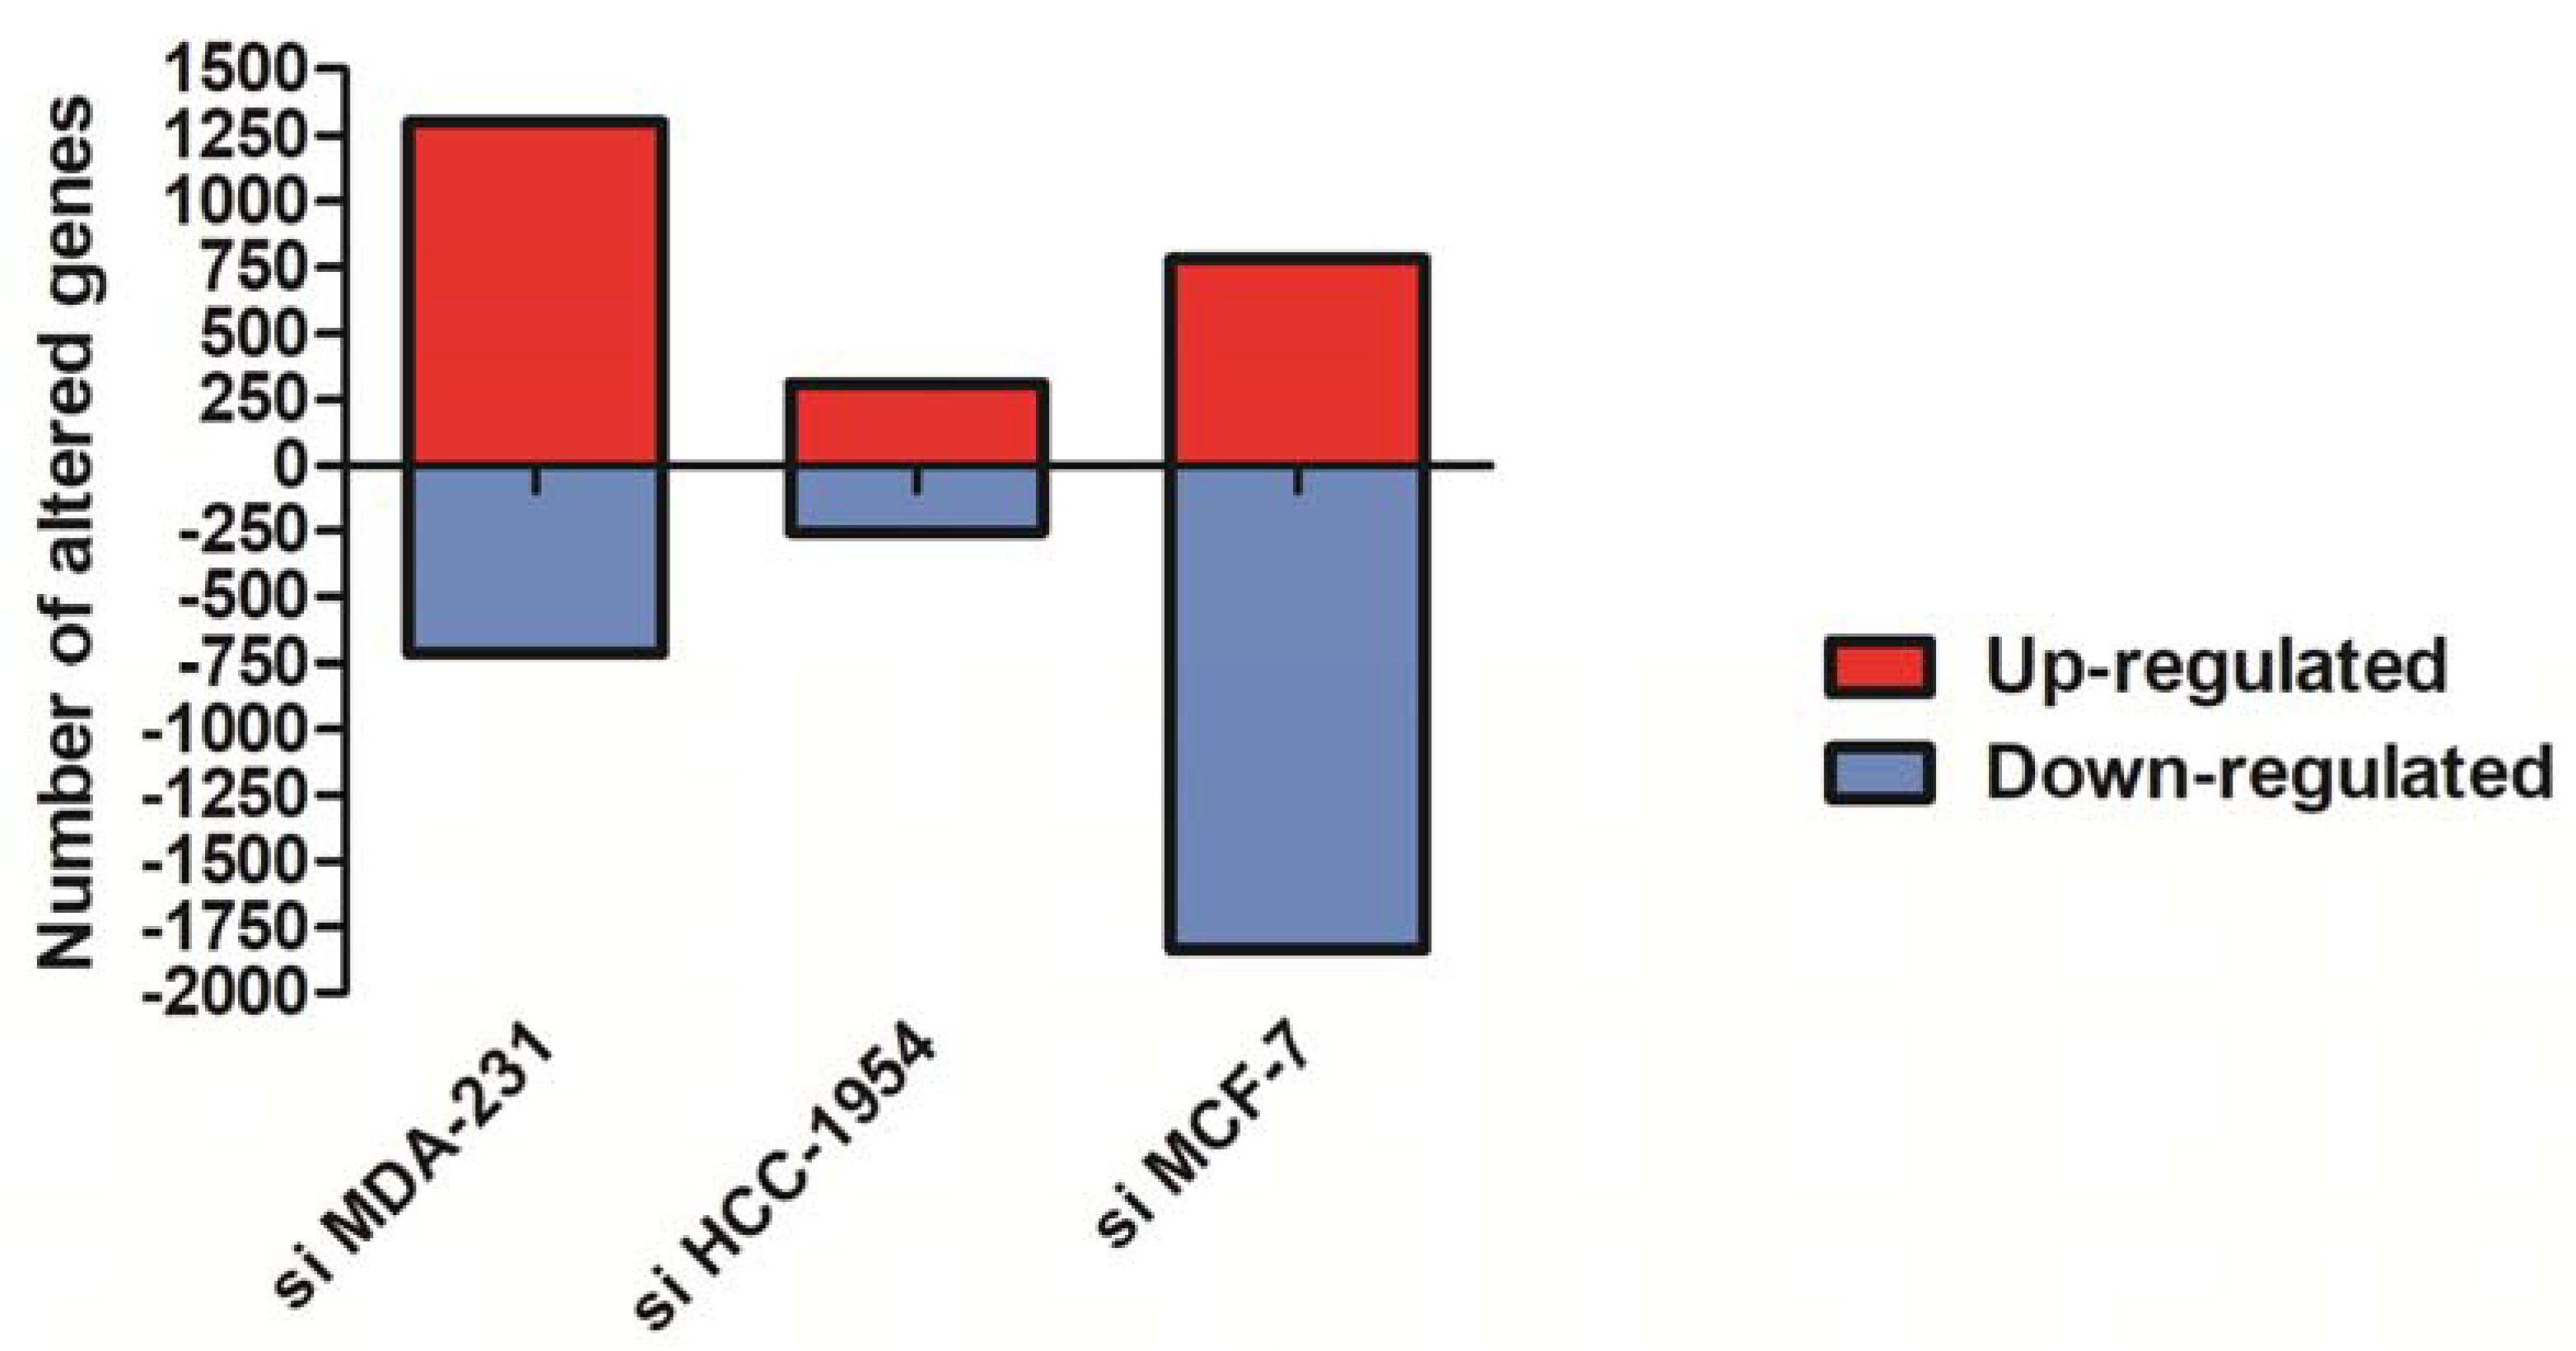
3.1. NF-κB/p65 Inhibition Altered the Gene Expression Profile of Redox Signaling
3.2. Oxidative Stress Analyses
4. Discussion
Supplementary Materials
Author Contributions
Acknowledgments
Conflicts of Interest
References
- Siegel, R.L.; Miller, K.D.; Jemal, A. Cancer statistics, 2018. CA Cancer J. Clin. 2018, 68, 7–30. [Google Scholar] [CrossRef] [PubMed]
- Polyak, K.; Metzger Filho, O. Snapshot: Breast cancer. Cancer Cell 2012, 22, 562. [Google Scholar] [CrossRef] [PubMed]
- Voduc, K.D.; Cheang, M.C.; Tyldesley, S.; Gelmon, K.; Nielsen, T.O.; Kennecke, H. Breast cancer subtypes and the risk of local and regional relapse. J. Clin. Oncol. 2010, 28, 1684–1691. [Google Scholar] [CrossRef] [PubMed]
- Pires, B.R.B.; Silva, R.; Ferreira, G.M.; Abdelhay, E. NF-kappaB: Two sides of the same coin. Genes 2018, 9, 24. [Google Scholar] [CrossRef] [PubMed]
- Gupta, S.C.; Sundaram, C.; Reuter, S.; Aggarwal, B.B. Inhibiting NF-κβ activation by small molecules as a therapeutic strategy. Biochim. Biophys. Acta 2010, 1799, 775–787. [Google Scholar] [CrossRef] [PubMed]
- Vandenabeele, P.; Galluzzi, L.; Vanden Berghe, T.; Kroemer, G. Molecular mechanisms of necroptosis: An ordered cellular explosion. Nat. Rev. Mol. Cell Biol. 2010, 11, 700–714. [Google Scholar] [CrossRef] [PubMed]
- Sun, S.C. Non-canonical NF-κβ signaling pathway. Cell Res. 2011, 21, 71–85. [Google Scholar] [CrossRef] [PubMed]
- Colotta, F.; Allavena, P.; Sica, A.; Garlanda, C.; Mantovani, A. Cancer-related inflammation, the seventh hallmark of cancer: Links to genetic instability. Carcinogenesis 2009, 30, 1073–1081. [Google Scholar] [CrossRef] [PubMed]
- Hanahan, D.; Weinberg, R.A. Hallmarks of cancer: The next generation. Cell 2011, 144, 646–674. [Google Scholar] [CrossRef] [PubMed]
- Biswas, D.K.; Iglehart, J.D. Linkage between EGFR family receptors and nuclear factor kappaB (NF-κβ) signaling in breast cancer. J. Cell. Physiol. 2006, 209, 645–652. [Google Scholar] [CrossRef] [PubMed]
- Hinohara, K.; Kobayashi, S.; Kanauchi, H.; Shimizu, S.; Nishioka, K.; Tsuji, E.; Tada, K.; Umezawa, K.; Mori, M.; Ogawa, T.; et al. ErbB receptor tyrosine kinase/NF-κβ signaling controls mammosphere formation in human breast cancer. Proc. Natl. Acad. Sci. USA 2012, 109, 6584–6589. [Google Scholar] [CrossRef] [PubMed]
- Huber, M.A.; Azoitei, N.; Baumann, B.; Grunert, S.; Sommer, A.; Pehamberger, H.; Kraut, N.; Beug, H.; Wirth, T. NF-κβ is essential for epithelial-mesenchymal transition and metastasis in a model of breast cancer progression. J. Clin. Investig. 2004, 114, 569–581. [Google Scholar] [CrossRef] [PubMed]
- Kendellen, M.F.; Bradford, J.W.; Lawrence, C.L.; Clark, K.S.; Baldwin, A.S. Canonical and non-canonical NF-κβ signaling promotes breast cancer tumor-initiating cells. Oncogene 2014, 33, 1297–1305. [Google Scholar] [CrossRef] [PubMed]
- Liu, M.; Sakamaki, T.; Casimiro, M.C.; Willmarth, N.E.; Quong, A.A.; Ju, X.; Ojeifo, J.; Jiao, X.; Yeow, W.S.; Katiyar, S.; et al. The canonical NF-κβ pathway governs mammary tumorigenesis in transgenic mice and tumor stem cell expansion. Cancer Res. 2010, 70, 10464–10473. [Google Scholar] [CrossRef] [PubMed]
- Merkhofer, E.C.; Cogswell, P.; Baldwin, A.S. HER2 activates NF-κβ and induces invasion through the canonical pathway involving IKKα. Oncogene 2010, 29, 1238–1248. [Google Scholar] [CrossRef] [PubMed]
- Pratt, M.A.; Tibbo, E.; Robertson, S.J.; Jansson, D.; Hurst, K.; Perez-Iratxeta, C.; Lau, R.; Niu, M.Y. The canonical NF-κβ pathway is required for formation of luminal mammary neoplasias and is activated in the mammary progenitor population. Oncogene 2009, 28, 2710–2722. [Google Scholar] [CrossRef] [PubMed]
- Schramek, D.; Leibbrandt, A.; Sigl, V.; Kenner, L.; Pospisilik, J.A.; Lee, H.J.; Hanada, R.; Joshi, P.A.; Aliprantis, A.; Glimcher, L.; et al. Osteoclast differentiation factor RANKL controls development of progestin-driven mammary cancer. Nature 2010, 468, 98–102. [Google Scholar] [CrossRef] [PubMed]
- Pires, B.R.; Mencalha, A.L.; Ferreira, G.M.; de Souza, W.F.; Morgado-Diaz, J.A.; Maia, A.M.; Correa, S.; Abdelhay, E.S. NF-κβ is involved in the regulation of EMT genes in breast cancer cells. PLoS ONE 2017, 12, e0169622. [Google Scholar] [CrossRef] [PubMed]
- Kanehisa Laboratories. Kyoto Encyclopedia of Genes and Genomes. Available online: http://genome.jp/kegg/ (accessed on 1 May 2018).
- Mi, H.; Huang, X.; Muruganujan, A.; Tang, H.; Mills, C.; Kang, D.; Thomas, P.D. PANTHER version 11: expanded annotation data from Gene Ontology and Reactome pathways, and data analysis tool enhancements. Nucl. Acids Res. 2016. [Google Scholar] [CrossRef] [PubMed]
- VIB/Ugent Bioinformatics & Evolutionary Genomics Technologiepark. Available online: http://bioinformatics.psb.ugent.be/software/details/Venn-Diagrams (accessed on 1 May 2018).
- Livak, K.J.; Schmittgen, T.D. Analysis of relative gene expression data using real-time quantitative PCR and the 2−ΔΔCT method. Methods 2001, 25, 402–408. [Google Scholar] [CrossRef] [PubMed]
- Sedlak, J.; Lindsay, R.H. Estimation of total, protein-bound, and nonprotein sulfhydryl groups in tissue with Ellman’s reagent. Anal. Biochem. 1968, 25, 192–205. [Google Scholar] [CrossRef]
- Panis, C.; Victorino, V.J.; Herrera, A.C.; Freitas, L.F.; De Rossi, T.; Campos, F.C.; Simao, A.N.; Barbosa, D.S.; Pinge-Filho, P.; Cecchini, R.; et al. Differential oxidative status and immune characterization of the early and advanced stages of human breast cancer. Breast Cancer Res. Treat. 2012, 133, 881–888. [Google Scholar] [CrossRef] [PubMed]
- Gonzalez Flecha, B.; Llesuy, S.; Boveris, A. Hydroperoxide-initiated chemiluminescence: An assay for oxidative stress in biopsies of heart, liver, and muscle. Free Rad. Biol. Med. 1991, 10, 93–100. [Google Scholar] [CrossRef]
- Bacolla, A.; Cooper, D.N.; Vasquez, K.M. Mechanisms of base substitution mutagenesis in cancer genomes. Genes 2014, 5, 108–146. [Google Scholar] [CrossRef] [PubMed]
- Gao, Y.; Mutter-Rottmayer, E.; Zlatanou, A.; Vaziri, C.; Yang, Y. Mechanisms of post-replication DNA repair. Genes 2017, 8, 64. [Google Scholar] [CrossRef] [PubMed]
- Iyer, D.R.; Rhind, N. The intra-S checkpoint responses to DNA damage. Genes 2017, 8, 74. [Google Scholar] [CrossRef] [PubMed]
- Mertz, T.M.; Harcy, V.; Roberts, S.A. Risks at the DNA replication fork: Effects upon carcinogenesis and tumor heterogeneity. Genes 2017, 8, 46. [Google Scholar] [CrossRef] [PubMed]
- Marinello, P.C.; Machado, K.L.; Cecchini, R.; Cecchini, A.L. The participation of oxidative stress in breast cancer cells progression and treatment resistance. Am. J. Immunol. 2014, 10, 207–214. [Google Scholar] [CrossRef]
- Panis, C.; Victorino, V.; Herrera, A.; Cecchini, A.; Simão, A.; Tomita, L.; Cecchini, R. Can breast tumors affect the oxidative status of the surrounding environment? A comparative analysis among cancerous breast, mammary adjacent tissue, and plasma. Oxid. Med. Cell. Longev. 2016, 2016, 6429812. [Google Scholar] [CrossRef] [PubMed]
- Victorino, V.J.; Aranome, A.M.F.; de Campos, F.C.; do Amaral, A.C.D.S.; Cecchini, R.; Panis, C. Crosstalk between oxidative stress signaling and HER2 pathway in breast cancer. Am. J. Immunol. 2014, 10, 176. [Google Scholar] [CrossRef]
- Arcucci, A.; Ruocco, M.R.; Granato, G.; Sacco, A.M.; Montagnani, S. Cancer: An oxidative crosstalk between solid tumor cells and cancer associated fibroblasts. BioMed Res. Int. 2016, 2016, 4502846. [Google Scholar] [CrossRef] [PubMed]
- Karin, M. Nuclear factor-κβ in cancer development and progression. Nature 2006, 441, 431–436. [Google Scholar] [CrossRef] [PubMed]
- Bartling, B.; Hofmann, H.S.; Boettger, T.; Hansen, G.; Burdach, S.; Silber, R.E.; Simm, A. Comparative application of antibody and gene array for expression profiling in human squamous cell lung carcinoma. Lung Cancer 2005, 49, 145–154. [Google Scholar] [CrossRef] [PubMed]
- Pang, E.Y.; Bai, A.H.; To, K.F.; Sy, S.M.; Wong, N.L.; Lai, P.B.; Squire, J.A.; Wong, N. Identification of PFTAIRE protein kinase 1, a novel cell division cycle-2 related gene, in the motile phenotype of hepatocellular carcinoma cells. Hepatology 2007, 46, 436–445. [Google Scholar] [CrossRef] [PubMed]
- Lee, S.; Bang, S.; Song, K.; Lee, I. Differential expression in normal-adenoma-carcinoma sequence suggests complex molecular carcinogenesis in colon. Oncol. Rep. 2006, 16, 747–754. [Google Scholar] [CrossRef] [PubMed]
- Pham, H.; Eibl, G.; Vincenti, R.; Chong, B.; Tai, H.H.; Slice, L.W. 15-Hydroxyprostaglandin dehydrogenase suppresses K-RasV12-dependent tumor formation in Nu/Nu mice. Mol. Carcinog. 2008, 47, 466–477. [Google Scholar] [CrossRef] [PubMed]
- Thiel, A.; Ganesan, A.; Mrena, J.; Junnila, S.; Nykanen, A.; Hemmes, A.; Tai, H.H.; Monni, O.; Kokkola, A.; Haglund, C.; et al. 15-Hydroxyprostaglandin dehydrogenase is down-regulated in gastric cancer. Clin. Cancer Res. 2009, 15, 4572–4580. [Google Scholar] [CrossRef] [PubMed]
- Uhlén, M.; Fagerberg, L.; Hallström, B.M.; Lindskog, C.; Oksvold, P.; Mardinoglu, A.; Sivertsson, Å.; Kampf, C.; Sjöstedt, E.; Asplund, A.; et al. Tissue-based map of the human proteome. Science 2015, 347, 1260419. [Google Scholar]
- Fuchs, O. Transcription factor NF-κβ inhibitors as single therapeutic agents or in combination with classical chemotherapeutic agents for the treatment of hematologic malignancies. Curr. Mol. Pharmacol. 2010, 3, 98–122. [Google Scholar] [CrossRef] [PubMed]
- Gilmore, T.D.; Garbati, M.R. Inhibition of NF-κβ signaling as a strategy in disease therapy. Curr. Top. Microbiol. Immunol. 2011, 349, 245–263. [Google Scholar] [PubMed]
- Watanabe, M.; Nakashima, M.; Togano, T.; Higashihara, M.; Watanabe, T.; Umezawa, K.; Horie, R. Identification of the RelA domain responsible for action of a new NF-κβ inhibitor DHMEQ. Biochem. Biophys. Res. Commun. 2008, 376, 310–314. [Google Scholar] [CrossRef] [PubMed]
- Matsumoto, G.; Namekawa, J.; Muta, M.; Nakamura, T.; Bando, H.; Tohyama, K.; Toi, M.; Umezawa, K. Targeting of nuclear factor κβ pathways by dehydroxymethylepoxyquinomicin, a novel inhibitor of breast carcinomas: Antitumor and antiangiogenic potential in vivo. Clin. Cancer Res. 2005, 11, 1287–1293. [Google Scholar] [PubMed]
- Victorino, V.J.; Campos, F.C.; Herrera, A.C.; Colado Simao, A.N.; Cecchini, A.L.; Panis, C.; Cecchini, R. Overexpression of HER-2/neu protein attenuates the oxidative systemic profile in women diagnosed with breast cancer. Tumour Biol. 2014, 35, 3025–3034. [Google Scholar] [CrossRef] [PubMed]
- Jordan, N.V.; Bardia, A.; Wittner, B.S.; Benes, C.; Ligorio, M.; Zheng, Y.; Yu, M.; Sundaresan, T.K.; Licausi, J.A.; Desai, R.; et al. HER2 expression identifies dynamic functional states within circulating breast cancer cells. Nature 2016, 537, 102–106. [Google Scholar] [CrossRef] [PubMed] [Green Version]
- Gago-Dominguez, M.; Castelao, J.E.; Pike, M.C.; Sevanian, A.; Haile, R.W. Role of lipid peroxidation in the epidemiology and prevention of breast cancer. Cancer Epidemiol. Biomark. Prev. 2005, 14, 2829–2839. [Google Scholar] [CrossRef] [PubMed]
- Gago-Dominguez, M.; Jiang, X.; Castelao, J.E. Lipid peroxidation, oxidative stress genes and dietary factors in breast cancer protection: A hypothesis. Breast Cancer Res. 2007, 9, 201. [Google Scholar] [CrossRef] [PubMed]
- Mencalha, A.; Victorino, V.J.; Cecchini, R.; Panis, C. Mapping oxidative changes in breast cancer: Understanding the basic to reach the clinics. Anticancer Res. 2014, 34, 1127–1140. [Google Scholar] [PubMed]
- Jakovcevic, D.; Dedic-Plavetic, N.; Vrbanec, D.; Jakovcevic, A.; Jakic-Razumovic, J. Breast cancer molecular subtypes and oxidative DNA damage. Appl. Immunohistochem. Mol. Morphol. 2015, 23, 696–703. [Google Scholar] [CrossRef] [PubMed]
- Karihtala, P.; Kauppila, S.; Soini, Y.; Arja Jukkola, V. Oxidative stress and counteracting mechanisms in hormone receptor positive, triple-negative and basal-like breast carcinomas. BMC Cancer 2011, 11, 262. [Google Scholar] [CrossRef] [PubMed]
- Mann, V.; Huber, C.; Kogianni, G.; Collins, F.; Noble, B. The antioxidant effect of estrogen and selective estrogen receptor modulators in the inhibition of osteocyte apoptosis in vitro. Bone 2007, 40, 674–684. [Google Scholar] [CrossRef] [PubMed]
- Marathe, N.; Rangaswami, H.; Zhuang, S.; Boss, G.R.; Pilz, R.B. Pro-survival effects of 17β-estradiol on osteocytes are mediated by nitric oxide/cGMP via differential actions of cGMP-dependent protein kinases I and II. J. Biol. Chem. 2012, 287, 978–988. [Google Scholar] [CrossRef] [PubMed]
- Gionet, N.; Jansson, D.; Mader, S.; Pratt, M.A. NF-κβ and estrogen receptor α interactions: Differential function in estrogen receptor-negative and -positive hormone-independent breast cancer cells. J. Cell. Biochem. 2009, 107, 448–459. [Google Scholar] [CrossRef] [PubMed]
- Matthews, J.R.; Botting, C.H.; Panico, M.; Morris, H.R.; Hay, R.T. Inhibition of NF-κβ DNA binding by nitric oxide. Nucleic Acids Res. 1996, 24, 2236–2242. [Google Scholar] [CrossRef] [PubMed]
- Hoesel, B.; Schmid, J.A. The complexity of NF-κβ signaling in inflammation and cancer. Mol. Cancer 2013, 12, 86. [Google Scholar] [CrossRef] [PubMed]
- Kim, D.; Koo, J.S.; Lee, S. Overexpression of reactive oxygen species scavenger enzymes is associated with a good prognosis in triple-negative breast cancer. Oncology 2015, 88, 9–17. [Google Scholar] [CrossRef] [PubMed]


| Primer | Sequence |
|---|---|
| ACTB forward | 5′-TTCCTTCCTGGGCATGGAGTC-3′ |
| ACTB reverse | 5′-AGACAGCACTGTGTTGGCGTA-3′ |
| GAPDH forward | 5′-ATTCCACCCATGGCAAATTC-3′ |
| GAPDH reverse | 5′-GGCGTGGATGGGTCTTTCA-3′ |
| BRCA1 forward | 5′-GACAGAGGACAATGGCTTCC-3′ |
| BRCA1 reverse | 5′-AGCTCCTGGCACTGGTAGAG-3′ |
| BRCA2 forward | 5′-GCCGTACACTGCTCAAATCA-3′ |
| BRCA2 reverse | 5′-TTTGAAGTCATCTGGGCTGA-3′ |
| TP63 forward | 5′-GAGGTTGGGCTGTTCATCAT-3′ |
| TP63 reverse | 5′-GAGGAGAATTCGTGGAGCTG-3′ |
| PEX1 forward | 5′-TGACTGCACTTGGTCACACA-3′ |
| PEX1 reverse | 5′-CTGTCCAGGTCGAAACATTG-3′ |
| HPGD forward | 5′-CCATTTGTCCAGGCTTTGTT-3′ |
| HPGD reverse | 5′-AATCAATGGTGGGTCCAAAA-3′ |
| ARG2 forward | 5′-GGCTGAGGTGGTTAGCAGAG-3′ |
| ARG2 reverse | 5′-ACAAAGGTCTGGGCAGTGTC-3′ |
| GPX2 forward | 5′-TTGCAACCAATTTGGACATC-3′ |
| GPX2 reverse | 5′-TTTTTGGACAAGGGTGAAGG-3′ |
| COX8C forward | 5′-GGAAATGGCTGTTGGACTTG-3′ |
| COX8C reverse | 5′-ACTGCTTCAGGTTGCCTAGC-3′ |
| OXR1 forward | 5′-TTGGTGCGTTAGCATCTGAG-3′ |
| OXR1 reverse | 5′-CAAATTCTCCTCCTCCACCA-3′ |
| TMX1 forward | 5′-GCAGATTGCCTTTGTCCTTC-3′ |
| TMX1 reverse | 5′-TTCTTCATCCGCCTCTTGTT-3′ |
| siNFκB MDA-MB-231 | ||||
|---|---|---|---|---|
| Fold Change | Gene Symbol | Description | GO Biological Process | GO Molecular Function |
| 25.9 | ALDH1A3 | aldehyde dehydrogenase 1 family, member A3 | retinoic acid biosynthetic process, metabolic process | aldehyde dehydrogenase (NAD) activity; oxidoreductase activity |
| 21.19 | AKR1B10 | aldo-keto reductase family 1, member B10 (aldose reductase) | retinoid metabolic process; cellular aldehyde metabolic process; steroid metabolic process; oxidation-reduction process | aldo-keto reductase (NADP) activity; oxidoreductase activity |
| 11.78 | TP63 | tumor protein p63 | replicative cell aging | DNA binding transcription factor activity |
| 10.72 | DHRS9 | dehydrogenase/reductase (SDR family) member 9 | androgen metabolic process; progesterone metabolic process; retinol metabolic process | alcohol dehydrogenase (NAD) activity; oxidoreductase activity; oxidoreductase activity |
| 9.4 | PTGES | prostaglandin E synthase | prostaglandin metabolic process; cyclooxygenase pathway; response to lipopolysaccharide; fatty acid metabolic process | glutathione binding; isomerase activity |
| 8.23 | DHRS3 | dehydrogenase/reductase (SDR family) member 3 | retinol metabolic process; oxidation-reduction process; metabolic process | nucleotide binding; dehydrogenase activity; electron carrier activity; oxidoreductase activity |
| 7.02 | RDH10 | retinol dehydrogenase 10 (all-trans) | retinoid metabolic process | oxidoreductase activity |
| 5.01 | GPX2 | glutathione peroxidase 2 (gastrointestinal) | oxidation-reduction process; response to oxidative stress; cellular oxidant detoxification | electron carrier activity; peroxidase activity; oxidoreductase activity |
| 5.01 | PTGS2 | prostaglandin-endoperoxide synthase 2 (prostaglandin G/H synthase and cyclooxygenase) | peroxidase activity; lipid binding; enzyme binding; heme binding; metal ion binding; oxidoreductase activity | |
| 4.57 | PTGFRN | prostaglandin F2 receptor inhibitor | lipid particle organization | protein binding |
| 3.5 | AKR1C2 | aldo-keto reductase family 1, member C2; aldo-keto reductase family 1 member C2-like | lipid metabolic process; prostaglandin metabolic process; steroid metabolic process | oxidoreductase activity; carboxylic acid binding |
| 3.48 | STS | steroid sulfatase (microsomal), isozyme S | steroid metabolic process | steryl-sulfatase activity; sulfuric ester hydrolase activity; metal ion binding; catalytic activity; hydrolase activity |
| 3.42 | GSTT1 | glutathione S-transferase theta 1 | glutathione metabolic process; xenobiotic metabolic process; oxidation-reduction process | glutathione transferase activity; glutathione peroxidase activity; protein binding |
| 3.13 | MAOA | monoamine oxidase A | xenobiotic metabolic process; oxidation-reduction process | primary amine oxidase activity; oxidoreductase activity |
| 3.05 | CYP4B1 | cytochrome P450, family 4, subfamily B, polypeptide 1 | cellular aromatic compound metabolic process; exogenous drug catabolic process; oxidation-reduction process | iron ion binding; oxidoreductase activity |
| 2.92 | PIK3C2B | phosphatidylinositol-4-phosphate 3-kinase, catalytic subunit type 2 beta | phospholipid metabolic process; protein phosphorylation; inflammatory response | lipid kinase activity; ATP binding |
| 278 | CP | ceruloplasmin (ferroxidase) | copper ion transport; oxidation-reduction process; | ferroxidase activity; copper ion binding; chaperone binding; oxidoreductase activity; metal ion binding |
| 2.62 | SQRDL | sulfide quinone reductase-like (yeast) | sulfur amino acid metabolic process; cellular nitrogen compound metabolic process; oxidation-reduction process | sulfide:quinone oxidoreductase activity; oxidoreductase activity |
| 2.52 | CYB5A | cytochrome b5 type A (microsomal) | L-ascorbic acid metabolic process; response to cadmium ion; oxidation-reduction process | aldo-keto reductase (NADP) activity; enzyme binding; heme binding; metal ion binding |
| 2.39 | SEPW1 | selenoprotein W, 1 | cell redox homeostasis | antioxidant activity; selenium binding |
| 2.38 | IDO1 | indoleamine 2,3-dioxygenase 1 | immune system process; chronic inflammatory response | electron carrier activity; heme binding; metal ion binding; oxidoreductase activity |
| 2.36 | NDUFB9 | NADH dehydrogenase (ubiquinone) 1 beta subcomplex, 9, 22 kDa | mitochondrial electron transport, NADH to ubiquinone; respiratory electron transport chain; oxidation-reduction process | protein binding; NADH dehydrogenase activity |
| 2.35 | SRD5A3 | steroid 5 alpha-reductase 3 | androgen biosynthetic process; oxidation-reduction process; protein glycosylation; lipid metabolic process | oxidoreductase activity |
| 2.21 | BLVRB | biliverdin reductase B (flavin reductase (NADPH)) | heme catabolic process; oxidation-reduction process | riboflavin reductase (NADPH) activity; oxidoreductase activity |
| 2.18 | NDUFS6 | NADH dehydrogenase (ubiquinone) Fe-S protein 6, 13 kDa (NADH-coenzyme Q reductase) | mitochondrial electron transport, fatty acid metabolic process; oxidation-reduction process | NADH dehydrogenase activity; electron carrier activity |
| 2.16 | PTGER4 | prostaglandin E receptor 4 (subtype EP4) | immune response; adenylate cyclase-modulating G-protein coupled receptor signaling pathway | prostaglandin E receptor activity; protein binding; signal transducer activity; prostaglandin receptor activity |
| 2.13 | IDH1 | isocitrate dehydrogenase 1 (NADP+), soluble | glyoxylate cycle; tricarboxylic acid cycle; isocitrate metabolic process; 2-oxoglutarate metabolic process | magnesium ion binding; isocitrate dehydrogenase activity; oxidoreductase activity |
| 2.13 | UQCRB | ubiquinol-cytochrome c reductase binding protein | oxidative phosphorylation; mitochondrial electron transport, oxidation-reduction process | protein binding |
| 2.06 | BCKDHA | branched chain keto acid dehydrogenase E1, alpha polypeptide | branched-chain amino acid catabolic process; oxidation-reduction process; | alpha-ketoacid dehydrogenase activity; carboxy-lyase activity; metal ion binding; oxidoreductase activity |
| 2.06 | HPGD | hydroxyprostaglandin dehydrogenase 15-(NAD) | fatty acid metabolic process; prostaglandin metabolic process | NAD binding; oxidoreductase activity; |
| 2.06 | PIP4K2C | phosphatidylinositol-5-phosphate 4-kinase, type II, gamma | phosphatidylinositol phosphorylation | ATP binding; nucleotide binding; kinase activity; transferase activity |
| 2.05 | GCLC | glutamate-cysteine ligase, catalytic subunit | response to oxidative stress; glutamate metabolic process; glutathione metabolic process | coenzyme binding; magnesium ion binding; glutamate-cysteine ligase activity; ATP binding |
| 2.05 | TSTD1 | thiosulfate sulfur transferase (rhodanese)-like domain containing 1; F11 receptor | sulfide oxidation | protein binding; transferase activity |
| 2.04 | XDH | xanthine dehydrogenase | xanthine catabolic process; oxidation-reduction process; regulation of reactive oxygen species | iron ion binding; electron carrier activity; oxidoreductase activity, metal ion binding |
| 2.02 | DHODH | dihydroorotate dehydrogenase (quinone) | nucleotide biosynthetic process; response to organic cyclic compound | dehydrogenase activity; oxidoreductase activity |
| 2.01 | PITPNC1 | phosphatidylinositol transfer protein, cytoplasmic 1 | phospholipid transport | protein binding; lipid binding; phosphatidylinositol transporter activity |
| 1.99 | CYP2S1 | cytochrome P450, family 2, subfamily S, polypeptide 1 | xenobiotic metabolic process; oxidation-reduction process | iron ion binding; oxidoreductase activity; steroid hydroxylase activity |
| 1.98 | RAD51 | RAD51 recombinase | DNA repair; DNA recombinase assembly | DNA binding; recombinase activity |
| 1.75 | GSTK1 | glutathione S-transferase kappa 1 | glutathione metabolic process; xenobiotic metabolic process; oxidation-reduction process | transferase activity; peroxidase activity; receptor binding; oxidoreductase activity |
| 1.72 | HEBP2 | heme binding protein 2 | mitochondrial membrane potential; mitochondrial membrane permeability; response to reactive oxygen species | protein binding |
| 1.64 | POR | P450 (cytochrome) oxidoreductase | xenobiotic metabolic process; response to nutrient | enzyme binding; hydrolase activity; electron transfer activity |
| 1.63 | CYP4Z1 | cytochrome P450, family 4, subfamily Z, polypeptide 1 | oxidation-reduction process | iron ion binding; heme binding; aromatase activity; oxidoreductase activity; metal ion binding |
| 1.52 | PEX11A | peroxisomal biogenesis factor 11 alpha | peroxisome organization; lipid metabolic process | protein binding; protein homodimerization activity |
| 1.51 | COX6C | cytochrome c oxidase subunit VIc | mitochondrial electron transport; hydrogen ion transmembrane transport | oxidase activity |
| −1.52 | NOXA1 | NADPH oxidase activator 1 | superoxide metabolic process; regulation of hydrogen peroxide metabolic process | NADPH oxidase activity; enzyme binding |
| −1.55 | NOS1AP | nitric oxide synthase 1 (neuronal) adaptor protein | nitric oxide biosynthetic process; apoptotic process | nitric-oxide synthase binding |
| −1.6 | CYP2U1 | cytochrome P450, family 2, subfamily U, polypeptide 1 | xenobiotic metabolic process; arachidonic acid metabolic process; oxidation-reduction process | iron ion binding; oxidoreductase activity |
| −1.65 | GPX3 | glutathione peroxidase 3 (plasma) | response to lipid hydroperoxide; oxidation-reduction process; response to oxidative stress | glutathione peroxidase activity; transcription factor binding; selenium binding; oxidoreductase activity |
| −1.67 | GSTP1 | glutathione S-transferase pi 1 | response to reactive oxygen species; glutathione metabolic process; xenobiotic metabolic process | glutathione transferase activity; nitric oxide binding; transferase activity |
| −1.67 | MT1A | metallothionein 1A | cellular response to cadmium ion; cellular response to zinc ion | protein binding; metal ion binding |
| −1.73 | GSTT2 | glutathione S-transferase theta 2; glutathione S-transferase theta 2B (gene/pseudogene) | glutathione metabolic process; xenobiotic metabolic process; | glutathione transferase activity; transferase activity; protein binding |
| −1.74 | MSRB3 | methionine sulfoxide reductase B3 | response to oxidative stress; protein repair; oxidation-reduction process | zinc ion binding; oxidoreductase activity |
| −1.76 | ARG2 | arginase 2 | urea cycle; arginine metabolic process; nitric oxide biosynthetic process | arginase activity; metal ion binding; hydrolase activity |
| −2.56 | GSTM1 | glutathione S-transferase mu 1 | glutathione metabolic process; xenobiotic metabolic process | glutathione transferase activity; enzyme binding |
| siNFκB HCC-1954 | ||||
|---|---|---|---|---|
| Fold Change | Gene Symbol | Description | GO Biological Process | GO Molecular Function |
| 1.78 | HSD17B2 | hydroxysteroid (17-beta) dehydrogenase 2 | steroid biosynthetic process; oxidation-reduction process | estradiol 17-beta-dehydrogenase activity; testosterone dehydrogenase activity |
| 1.7 | COX11P1 | COX11 cytochrome c oxidase assembly homolog (yeast) pseudogene 1 | mitochondrial electron transport, hydrogen ion transmembrane transport | cytochrome-c oxidase activity |
| 1.64 | BRCA1 | breast cancer 1, early onset | DNA repair, double-strand break repair via homologous recombination | DNA binding, ligase activity |
| 1.58 | FAR1 | fatty acyl CoA reductase 1 | glycerophospholipid biosynthetic process; oxidation-reduction process | fatty-acyl-CoA reductase (alcohol-forming) activity; oxidoreductase activity |
| 1.58 | RB1 | retinoblastoma 1 | cell cycle checkpoint, G1/S transition of mitotic cell cycle | DNA binding transcription factor activity, enzyme binding |
| 1.57 | NUDT4 | nudix (nucleoside diphosphate linked moiety X)-type motif 4 | cyclic nucleotide metabolic process, inositol phosphate metabolic process | hydrolase activity, endopolyphosphatase activity, protein binding |
| 1.56 | HPGD | hydroxyprostaglandin dehydrogenase 15-(NAD) | fatty acid metabolic process, prostaglandin metabolic process | NAD binding, prostaglandin E receptor activity, oxidoreductase activity |
| 1.54 | PEX1 | peroxisomal biogenesis factor 1 | peroxisome membrane biogenesis; cellular lipid metabolic process | protein binding; protein homodimerization activity |
| 1.53 | DHRS7C | dehydrogenase/reductase (SDR family) member 7C | oxidation-reduction process | retinol dehydrogenase activity; oxidoreductase activity |
| 1.52 | XRCC4 | X-ray repair complementing defective repair in Chinese hamster cells 4 | DNA repair, double-strand break repair | DNA binding; protein binding; ligase activity |
| 1.51 | COX8C | cytochrome c oxidase subunit VIIIC | mitochondrial electron transport, hydrogen ion transmembrane transport | cytochrome-c oxidase activity |
| 1.51 | PTGDS | prostaglandin D2 synthase 21 kDa (brain) | prostaglandin biosynthetic process, fatty acid metabolic process | transporter activity, retinoid binding, fatty acid binding |
| −1.51 | PDLIM3 | PDZ and LIM domain 3 | actin filament organization | cytoskeletal protein binding; zinc ion binding |
| −1.52 | PDK2 | pyruvate dehydrogenase kinase, isozyme 2 | glucose metabolic process, protein phosphorylation | protein serine/threonine kinase activity, pyruvate dehydrogenase kinase activity |
| −1.66 | TCAP | titin-cap | cardiac muscle contraction, protein complex assembly | titin binding; ion channel binding |
| −1.72 | DHRS12 | dehydrogenase/reductase (SDR family) member 12 | oxidation-reduction process | oxidoreductase activity |
| −1.75 | HSD17B4 | hydroxysteroid (17-beta) dehydrogenase 4 | fatty acid metabolic process, fatty acid beta-oxidation | oxidoreductase activity |
| −1.76 | CYP4Z2P | cytochrome P450, family 4, subfamily Z, polypeptide 2, pseudogene | oxidation-reduction process | iron ion binding; oxidoreductase activity, heme binding |
| −1.82 | LIPK | lipase, family member K | lipid catabolic process; lipid metabolic process | hydrolase activity |
| −1.88 | MT-TM | mitochondrially encoded tRNA methionine | tRNA Aminoacylation | catalytic activity |
| siNFκB MCF-7 | ||||
|---|---|---|---|---|
| Fold Change | Gene Symbol | Description | GO Biological Process | GO Molecular Function |
| 1.84 | NDUFS7 | NADH dehydrogenase (ubiquinone) Fe-S protein 7, 20 kDa (NADH-coenzyme Q reductase) | mitochondrial electron transport; oxidation-reduction process | NADH dehydrogenase activity; oxidoreductase activity |
| 1.75 | PTGS1 | prostaglandin-endoperoxide synthase 1 (prostaglandin G/H synthase and cyclooxygenase) | prostaglandin biosynthetic process; fatty acid metabolic process | peroxidase activity; lipid binding; heme binding; metal ion binding; dioxygenase activity; oxidoreductase activity |
| 1.67 | PLCD1 | phospholipase C, delta 1 | phospholipid metabolic process; inositol phosphate metabolic process | calcium ion binding; phosphoric diester hydrolase activity; phosphatidylserine binding |
| 1.61 | CYB561A3 | cytochrome b561 family, member A3 | oxidation-reduction process | protein binding; oxidoreductase activity; metal ion binding |
| 1.6 | PLA2G1B | phospholipase A2, group IB (pancreas) | activation of MAPK activity; fatty acid biosynthetic process | phospholipase activity; receptor binding; calcium ion binding; hydrolase activity; metal ion binding |
| 1.59 | PDE3B | phosphodiesterase 3B, cGMP-inhibited | cAMP catabolic process; glucose homeostasis | metal ion binding; phosphoric diester hydrolase activity |
| 1.57 | FTHL17 | ferritin, heavy polypeptide-like 17 | iron ion transport | ferric iron binding; metal ion binding |
| 1.57 | LPO | lactoperoxidase | response to oxidative stress; hydrogen peroxide catabolic process; oxidation-reduction process | heme binding; metal ion binding; peroxidase activity; oxidoreductase activity |
| 1.57 | TXNP6 | thioredoxin pseudogene 6 | response to oxidative stress | |
| 1.56 | PLA2G15 | phospholipase A2, group XV | phospholipid metabolic process | phospholipase activity; hydrolase activity |
| 1.54 | PLD6 | phospholipase D family, member 6 | phospholipid metabolic process; nucleic acid phosphodiester bond hydrolysis | endoribonuclease activity; metal ion binding; endonuclease activity; hydrolase activity |
| 1.52 | MSRB1 | methionine sulfoxide reductase B1 | response to oxidative stress; protein repair; oxidation-reduction process | zinc ion binding; oxidoreductase activity; metal ion binding |
| 1.51 | PEX16 | peroxisomal biogenesis factor 16 | protein targeting to peroxisome; peroxisome organization | protein binding |
| 1.5 | PRDX5 | peroxiredoxin 5 | response to oxidative stress; inflammatory response; apoptotic process | thioredoxin peroxidase activity; antioxidant activity; receptor binding; oxidoreductase activity |
| 1.5 | TP53RK | TP53 regulating kinase | tRNA modification; protein phosphorylation; p53 binding | protein serine/threonine kinase activity; ATP binding; hydrolase activity; nucleotide binding |
| −1.51 | CYB5R4 | cytochrome b5 reductase 4 | superoxide metabolic process; glucose homeostasis; oxidation-reduction process; NADP metabolic process | oxidoreductase activity; heme binding; metal ion binding |
| −1.53 | PEX1 | peroxisomal biogenesis factor 1 | protein targeting to peroxisome; peroxisome organization | protein binding; ATP binding; nucleotide binding |
| −1.54 | DECR1 | 2,4-dienoyl CoA reductase 1, mitochondrial | fatty acid metabolic process; oxidation-reduction process | NADPH binding; oxidoreductase activity |
| −1.56 | TXNDC9 | thioredoxin domain containing 9 | cell redox homeostasis; biological process | protein binding |
| −1.61 | SEPP1 | selenoprotein P, plasma, 1 | selenium compound metabolic process; response to oxidative stress | selenium binding |
| −1.62 | OXR1 | oxidation resistance 1 | response to oxidative stress; oxidation-reduction process | protein binding; oxidoreductase activity |
| −1.63 | TMX1 | thioredoxin-related transmembrane protein 1 | protein folding; cell redox homeostasis; oxidation-reduction process | disulfide oxidoreductase activity |
| −1.64 | PLCB4 | phospholipase C, beta 4 | lipid metabolic process | calcium ion binding; phosphoric diester hydrolase activity; phospholipase C activity |
| −1.81 | CYCS | cytochrome c, somatic | mitochondrial electron transport; apoptotic process | iron ion binding; electron transfer activity; heme binding |
| −2.1 | PIK3CA | phosphatidylinositol-4,5-bisphosphate 3-kinase, catalytic subunit alpha | glucose metabolic process; 1-phosphatidylinositol-3-kinase activity | transferase activity; protein serine/threonine kinase activity; ATP binding |
| −2.19 | MDM1 | Mdm1 nuclear protein homolog (mouse) | p53 binding protein; regulation of centriole replication | protein binding |
| −2.76 | ATM | ATM serine/threonine kinase; nuclear protein, ataxia-telangiectasia locus | DNA repair; telomere maintenance | transferase activity; DNA binding; protein serine/threonine kinase activity |
| −2.81 | PIK3C2A | phosphatidylinositol-4-phosphate 3-kinase, catalytic subunit type 2 alpha | phosphatidylinositol biosynthetic process | phosphotransferase activity; ATP binding |
| −2.85 | ATR | ATR serine/threonine kinase | DNA repair; cell cycle; DNA damage checkpoint | transferase activity; DNA binding; protein serine/threonine kinase activity |
| −3.04 | NUDT12 | nudix (nucleoside diphosphate linked moiety X)-type motif 12 | NADP catabolic process | metal ion binding; hydrolase activity |
| −3.18 | CYP4F30P | cytochrome P450, family 4, subfamily F, polypeptide 30 | oxidation-reduction process | oxidoreductase activity |
| −3.57 | PYROXD1 | pyridine nucleotide-disulfide oxidoreductase domain 1 | oxidation-reduction process | protein binding; oxidoreductase activity |
| −3.82 | BRCA2 | breast cancer 2, early onset | double-strand break repair via homologous recombination; DNA synthesis involved in DNA repair | protease binding; histone acetyltransferase activity; protein binding; H3 histone acetyltransferase activity; H4 histone acetyltransferase activity; gamma-tubulin binding; DNA binding |
| −3.88 | ATRX | alpha thalassemia/mental retardation syndrome X-linked | DNA repair; nucleosome assembly | chromatin binding; helicase activity; DNA binding; DNA helicase activity; helicase activity |
© 2018 by the authors. Licensee MDPI, Basel, Switzerland. This article is an open access article distributed under the terms and conditions of the Creative Commons Attribution (CC BY) license (http://creativecommons.org/licenses/by/4.0/).
Share and Cite
Pires, B.R.B.; Binato, R.; Ferreira, G.M.; Cecchini, R.; Panis, C.; Abdelhay, E. NF-kappaB Regulates Redox Status in Breast Cancer Subtypes. Genes 2018, 9, 320. https://doi.org/10.3390/genes9070320
Pires BRB, Binato R, Ferreira GM, Cecchini R, Panis C, Abdelhay E. NF-kappaB Regulates Redox Status in Breast Cancer Subtypes. Genes. 2018; 9(7):320. https://doi.org/10.3390/genes9070320
Chicago/Turabian StylePires, Bruno R. B., Renata Binato, Gerson M. Ferreira, Rubens Cecchini, Carolina Panis, and Eliana Abdelhay. 2018. "NF-kappaB Regulates Redox Status in Breast Cancer Subtypes" Genes 9, no. 7: 320. https://doi.org/10.3390/genes9070320