Article

Multiple Sclerosis Heritability Estimation on Sardinian Ascertained Extended Families Using Bayesian Liability Threshold Model

1
Department of Brain and Behavioral Sciences, University of Pavia, 27100 Pavia, Italy
2
Divisione di Neurologia, Presidio Ospedaliero S. Francesco, ASL Numero 3 Nuoro, 08100 Nuoro, Italy
*
Author to whom correspondence should be addressed.
These authors contributed equally to this work.
Genes 2023, 14(8), 1579; https://doi.org/10.3390/genes14081579
Submission received: 4 July 2023 / Revised: 26 July 2023 / Accepted: 31 July 2023 / Published: 2 August 2023
(This article belongs to the Special Issue Statistical Methods for Genetic Epidemiology)

Abstract

:
Heritability studies represent an important tool to investigate the main sources of variability for complex diseases, whose etiology involves both genetics and environmental factors. In this paper, we aimed to estimate multiple sclerosis (MS) narrow-sense heritability (h2), on a liability scale, using extended families ascertained from affected probands sampled in the Sardinian province of Nuoro, Italy. We also investigated the sources of MS liability variability among shared environment effects, sex, and categorized year of birth (<1946, ≥1946). The latter can be considered a proxy for different early environmental exposures. To this aim, we implemented a Bayesian liability threshold model to obtain posterior distributions for the parameters of interest adjusting for ascertainment bias. Our analysis highlighted categorized year of birth as the main explanatory factor, explaining ~70% of MS liability variability (median value = 0.69, 95% CI: 0.64, 0.73), while h2 resulted near to 0% (median value = 0.03, 95% CI: 0.00, 0.09). By performing a year of birth-stratified analysis, we found a high h2 only in individuals born on/after 1946 (median value = 0.82, 95% CI: 0.68, 0.93), meaning that the genetic variability acquired a high explanatory role only when focusing on this subpopulation. Overall, the results obtained highlighted early environmental exposures, in the Sardinian population, as a meaningful factor involved in MS to be further investigated.

1. Introduction

Heritability measures the proportion of a trait variability that can be explained by genetic variation [1]. According to the additive model [2,3], the phenotypic variance can be considered as the sum of genetic and environmental effects, and narrow-sense heritability (h2) [4] is calculated as the ratio of the additive genetic effects variance on the phenotypic variance. Heritability studies should be considered as the key for discovering potential genetic and environmental causal factors for trait variation characterizing a specific population [1,3,5,6,7]. The results obtained from heritability analyses need to be contextualized relative to the genetic and environmental background of the population under study, highlighting which factor, whether genetic and environmental, has a better explanatory role for the trait variability [1,3,5,7,8].
Quantifying heritability is a major task for complex diseases with uncertain etiology, such as multiple sclerosis (MS) (OMIM 126200), as these are influenced by both genetic and environmental factors [9,10,11]. MS is a chronic autoimmune disease of the central nervous system characterized by inflammation, demyelination, gliosis, and neuronal loss [12,13], and its onset is influenced by both genetic and environmental factors [9,10,11]. Among these, low vitamin D levels, high body mass index, previous Epstein–Barr virus (EBV) infection, and cigarette smoking have been highlighted as strong causal risk factors [14,15,16]. Moreover, several genetic variants were identified as significantly associated with MS susceptibility. Alleles associated with high MS risk were located in the human leukocyte antigen (HLA) complex, while more than 200 non-HLA alleles showed lower MS risk [17,18,19].
MS h2 estimates have mainly relied on monozygotic and dizygotic twin pair design [20]; so far, no attempts have been made to estimate this measure in the Sardinian population due to the limited sample size [20,21]. Using extended family-based studies allows overcoming this problem and has the advantage, compared to twin studies, of producing h2 estimates less inflated by potential shared environmental effects which could influence individuals raised in a common environment [22,23,24,25].
In this context, different methodologies have been developed to produce unbiased h2 estimates for binary traits [26]. However, ascertainment bias arises when using families ascertained from a sampled proband [27,28,29]. To overcome this problem, Kim et al. [29] developed a liability threshold model for binary traits (LTMH) allowing to estimate h2, on a liability scale, adjusted from ascertainment bias. However, their expectation–maximization (EM)-based approach presented some limitations, such as lacking a precision measure for h2 (i.e., standard error) [30,31], consequent difficulty in calculating confidence intervals [32], computational inefficiency when handling extended families, and convergence issues when including additional variance components in the model, e.g., to adjust for shared environment effects, a feature particularly important when dealing with families and complex diseases.
In this paper, by implementing LTMH methodology in a Bayesian framework using Markov chain Monte Carlo (MCMC) methods to overcome the above described LTMH limitations, we estimated MS h2 using 24 Sardinian extended families ascertained from affected probands. Among all, the strength of this sample is represented by the unique characteristics of the founder homogenous Sardinian population and the temporal depth of the available families, which also allows investigating the explanatory role of environmental factors over time, i.e., shared environmental effects, individual environmental effects, sex, and year of birth. The latter can be considered as a proxy for different early environmental exposures due to the post-World War II progressive industrialization and change in socioeconomic factors, dietary habits, lifestyle, and sanitary conditions (“Westernization process”) [33,34,35,36], as well as the malaria eradication program conducted from 1946 to 1950 with the use of insecticide DDT (dichloro-diphenyl-trichloroethane) [37]. These aspects could be linked to the constant MS incidence observed since the 1950s in the Nuoro province [33] and other Sardinian provinces [38]. Different authors have also underlined how a better diagnostic accuracy cannot fully account for this steady increase in MS [33,34,38,39], since the magnitude of this trend has not been observed in any other Italian areas during the same period. Overall, comparing the genetic and environmental impact on MS liability at the population level could have a meaningful impact on the research for MS causal determinants in the population under study [3,6].

2. Materials and Methods

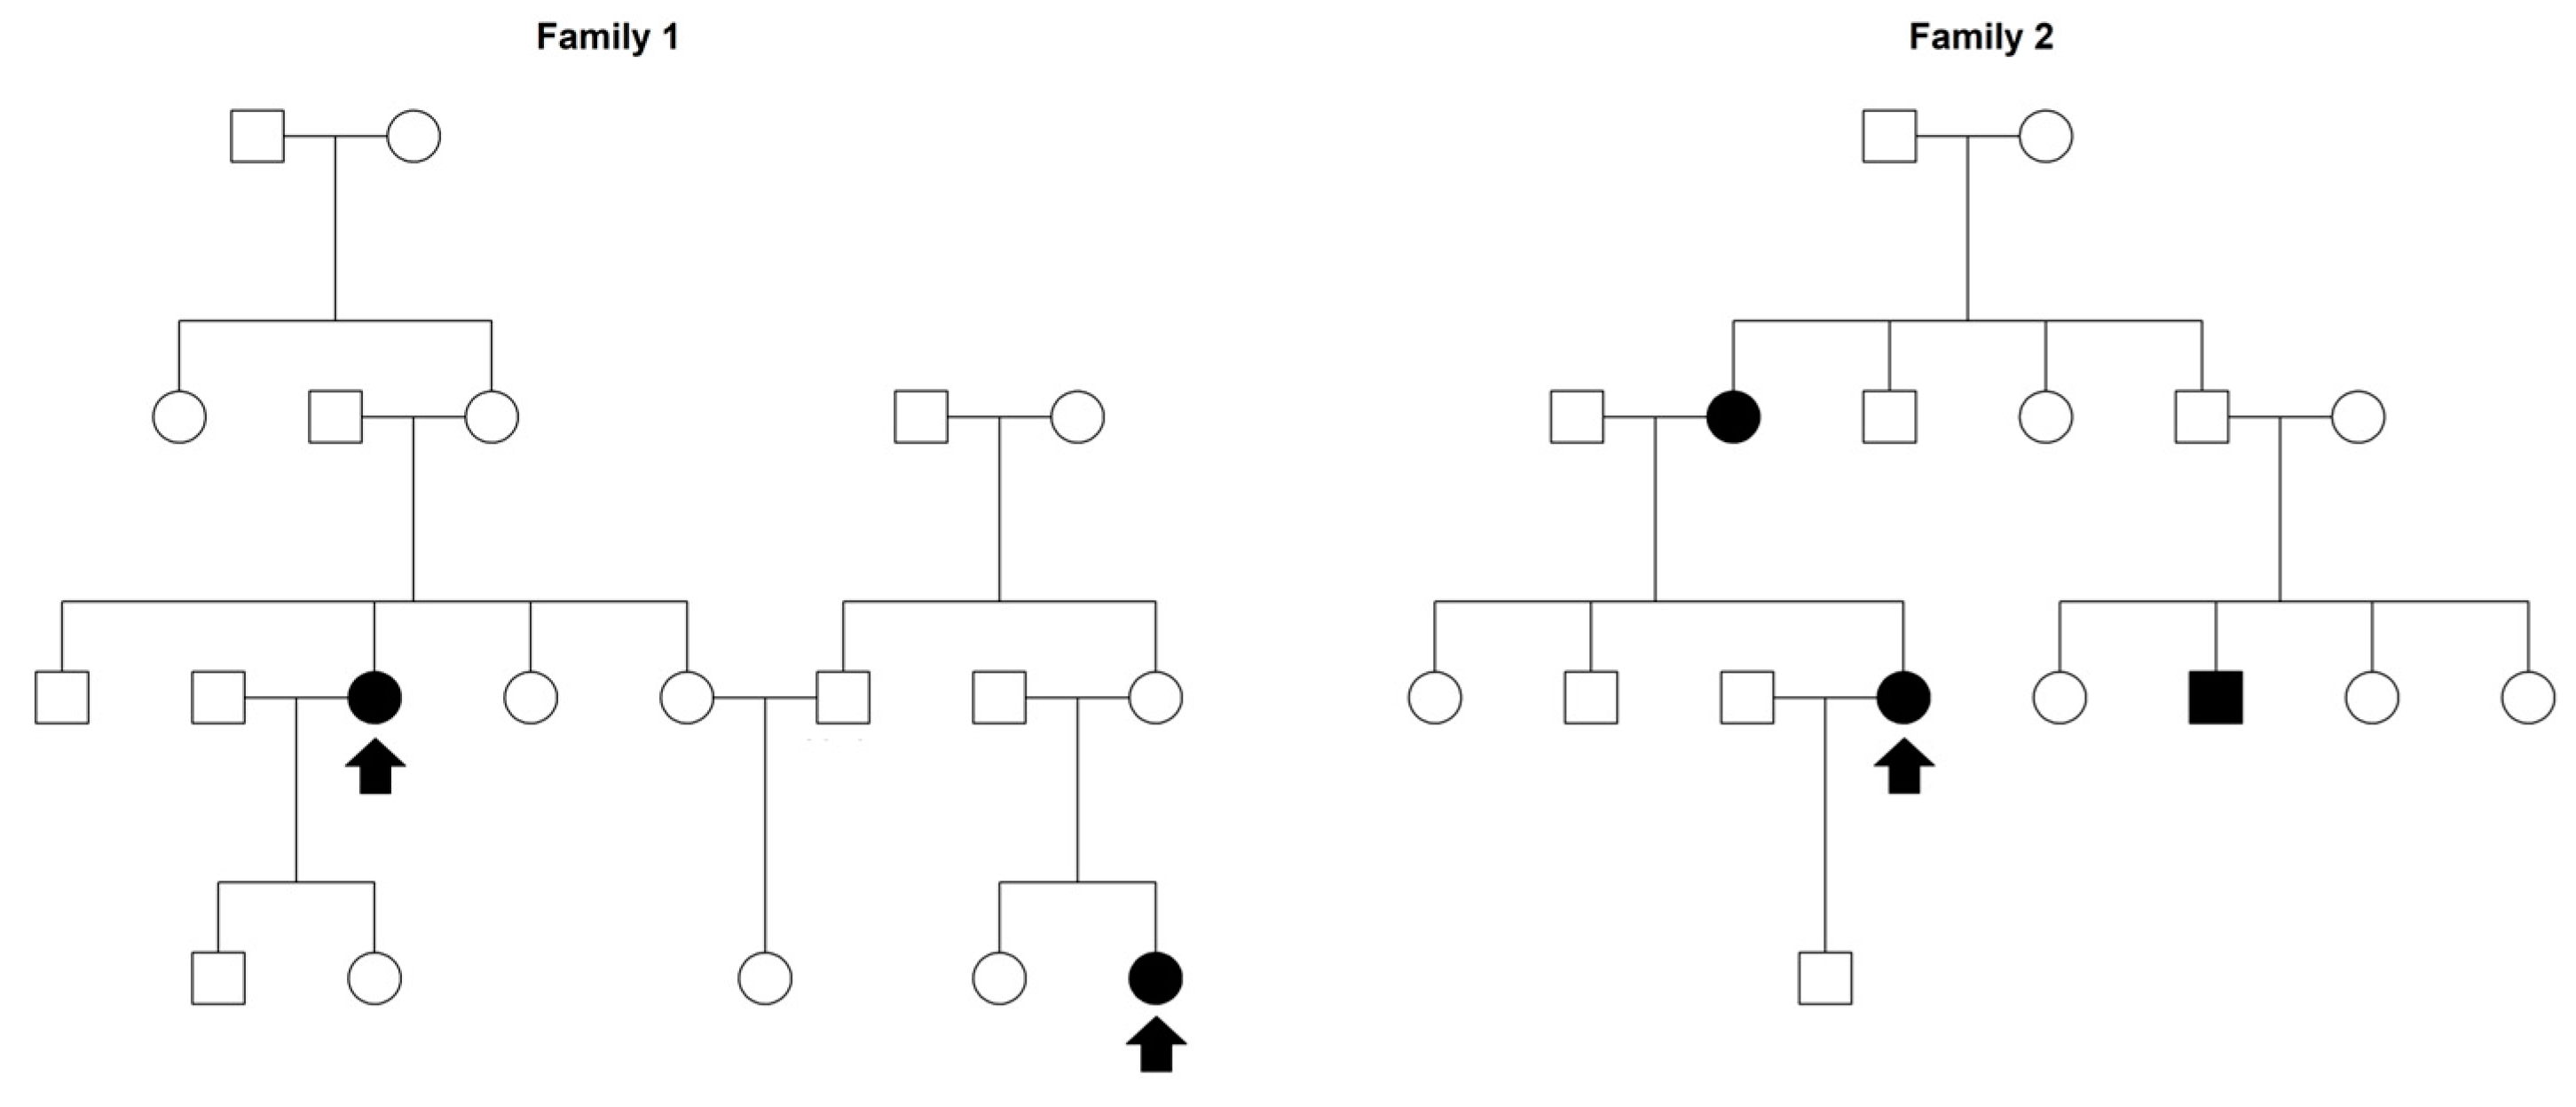
2.1. Sardinian Families Ascertainment

Our sample was retrieved from a register of MS cases, diagnosed according to Poser’s criteria [40], established in Sardinia’s Nuoro province in 1995. Whenever possible, patients were examined by the neurologists at the Neurology Department of the Nuoro Hospital. Otherwise, clinical records were obtained and reviewed by the previous neurologists. During the examination, the neurologists filled the clinical record of the patient, comprising the MS disease course. From this case register, we sampled 89 MS-affected probands, without any selection in favor of MS patients with a possible family history. Using the genealogical questionnaires filled in by the affected proband and the municipal registries, we were able to reconstruct their genealogical tree. In some cases, MS probands resulted distantly related through a common ancestor, leading to a final sample comprising 24 extended families [19]. Examples of extended families are reported in Figure 1. In our analysis, we included probands’ parents, siblings, spouses, uncles/aunts, first-degree cousins, nieces/nephews, and grandparents, while more distant relatives were excluded to avoid MS misclassifications. Nonaffected relatives included in the final analysis were at least 20 years old at the day of the questionnaire compilation. Thus, a total of 790 subjects were analyzed, comprising 118 MS cases and 672 healthy controls. Descriptive statistics were reported for each family.

2.2. Statistical Analysis

2.2.1. Model Specification

To estimate MS h2 making use of our ascertained families from a proband, we relied on the LTMH method [29]. Given N individuals clustered in F families, the N observed binary phenotypes (Y) are determined by unobserved continuous liability scores (L) and a fixed threshold (c), which depends on the trait’s prevalence in the population [41]. In our case, MS prevalence was fixed following the work by Montomoli et al. [42], which estimated MS crude prevalence in Nuoro province as 157 per 100,000 inhabitants. We included the following as covariates in the model, to adjust for potential confounding: (i) sex, as the female-to-male MS prevalence ratio in the Nuoro province was reported to be 2:1 [43]; (ii) categorized year of birth (<1946 or ≥1946) as a proxy for the individuals’ different early environmental exposures. L was assumed to be distributed following a multivariate normal distribution, i.e., L~MVN(Xb, Σ), where X denotes a matrix for standardized covariates, i.e., sex and categorized year of birth (YR), b represents the respective vector of fixed effects parameters, i.e., βSEX and βYR, and Σ denotes a covariance matrix. We followed the standard polygenic additive model [2,44], assuming null epistatic and gene–environment (G × E) effects, defining Σ as follows (ACE model):
Σ = h 2 K + c S i b s 2 H 1 + c M o t h e r O f f s p r i n g 2 H 2 + c F a t h e r O f f s p r i n g 2 H 3 + c S p o u s e s 2 H 4 + e 2 I ,
where parameters are defined as the proportion of MS liability variability explained by (i) h2, additive genetic effects, with K being the kinship matrix multiplied by two, (ii) c2Sibs, effects due the environment shared between siblings (which also allow to adjust for dominant genetic effects), with H1 being the correlation matrix with values equal to 1 between siblings, (iii) c2Mother–Offspring, effects of environment shared between the mother and the offspring, which may include maternal effects as highlighted in [45,46], with H2 being the correlation matrix with values equal to 1 between mother and offspring, (iv) c2Father–Offspring, effects of environment shared by the father and the offspring, with H3 being the correlation matrix with values equal to 1 between father and offspring, (v) c2Spouses, effects of environment shared between spouses, with H4 being the correlation matrix with values equal to 1 between spouses, and (vi) e2, individual environmental effects, with I being the respective identity matrix. To avoid identifiability problems [47], e2 was derived as the complementary to 1 considering the sum of the other parameters. The proportion of MS liability variance explained by total shared environment effects, i.e., c2Total, was then defined as the sum of c2Sibs, c2Mother–Offspring, c2Father–Offspring, and c2Spouses components. Modeling c2Total allows avoiding an inflation in h2 due to common environmental influences [23,24,48]. βSEX and βYR allow quantifying the liability increase/decrease and the proportion of MS liability variability jointly explained by both covariates, i.e., τ2βSEX,YR = var(Xb) [49]. This latter term can be decomposed, following [50], into
τ β S E X , Y R 2 = τ β S E X 2 + τ β Y R 2 + 2 c o v β S E X , Y R ,
from which we derived the proportion of MS variability marginally explained by (i) sex τ2βSEX, (ii) categorized year of birth τ2βYR, and (iii) their covariance component, i.e., 2covβSEX,YR. As described in [49], τ2βSEX,YR was considered as part of the total phenotypic variance.
Using the above-specified model, we conducted two separate analyses. In the first, we focused on the whole sample. The explanatory role of G × E effects, between additive genetics and categorized year of birth, was also assessed in a separate model (see Supplementary Section S1 for mathematical details) [51,52]. In the second, we stratified our sample on the basis of the categorized year of birth; the rationale was to evaluate the explanatory influence of genetic and environmental factors on subgroups of individuals with more similar early environmental exposures linked to the year of birth. To better reflect the MS prevalence in these two groups, we relied on the work of Montomoli et al. [42] to set MS prevalence as 103 per 100,000 inhabitants for the individuals born before 1946, and as 176 per 100,000 inhabitants for the individuals born on/after 1946. Only for the analysis on individuals born on/after 1946 did we include the exact year of birth as a continuous covariate in the model to investigate the temporal change in MS liability.

2.2.2. Implementing Bayesian-LTMH

Given the limitations of the EM algorithm implemented in [29], this approach was inefficient to estimate MS h2 using our sample since we were dealing with extended families with the aim of including other variance components in the model, e.g., shared environment effects. Therefore, we implemented a Bayesian framework using simulated-based methods as MCMC techniques as it represents an alternative and faster process, compared to maximum likelihood estimation, in the case of complicated statistical models with many unobserved variables [53,54,55,56,57].
In LTMH, the likelihood for the observed phenotypes Y given the unobserved liabilities L and the set of parameters θ = (h2, c2Sibs, c2Mother–Offspring, c2Father–Offspring, c2Spouses, e2, βSEX, βYR, τ2βSEX,YR, τ2βSEX, τ2βYR, 2covβSEX,YR) adjusted from ascertainment bias is defined as follows:
p ( Y N P , L N P | Y P , L P , θ ) = p ( Y , L | θ ) p ( Y P , L P | θ ) ,
where P denotes probands, and NP denotes non-probands. The numerator in Equation (3) represents the likelihood function for the complete data, defined by a truncated multivariate normal distribution bounded in the range (a, b) depending on the observed phenotypes Y, i.e., by (−∞, c) if the individual is a control or by (c, +∞) if the individual is a case:
p ( Y , L | θ ) = L ~ M V N ( X b , Σ ) I ( a < L < b ) .
The denominator in Equation (3) represents the likelihood that the proband is randomly picked from the population and it is necessary to correct for the ascertainment bias. According to the “ascertainment assumption-free” approach [58], this likelihood is defined as
p ( Y P , L P | θ ) = i = 1 F ( exp ( Y i P × log ( μ i 1 μ i ) ) × 1 μ i ) ,
where μi represents the probability that the liability score for a proband is higher than the threshold c, i.e., μ = P(YP = 1) = P(LP > c) = 1 − Φ(c − XPb). Since multiple distantly related probands could be present within a single family, we considered a single fictitious proband with covariates values equal to the mean of the actual probands’ sex and categorized year of birth within the family.
The conditional likelihood in Equation (3) then served as our sampling distribution for θ parameters. The posterior distributions p(θ|Y, L) could then be characterized using Bayes’ rule as follows:
p ( θ | Y , L ) p ( Y N P , L N P | Y P , L P , θ ) p ( θ )
where p(θ) represents the prior distribution specified for the parameters in θ. To the best of our knowledge, there were no previous studies on h2 estimation in Sardinian population; therefore, we decided to input noninformative prior distributions for all parameters, i.e., Beta(1,1) for variance components, and N(0,10) for βSEX and βYR parameters. In our analysis, to obtain the sampled parameters’ posterior distributions, we ran four chains with 5000 warmup iterations and 5000 sampling iterations, for a total of 20,000 sampling iterations, and convergence of the four chains to the same posterior distribution was assessed visually using trace plots. Analyses were performed using RStudio, Stan [59,60], and its R interface package CmdStanR [61]. In Supplementary Section S2, we report the results from simulations studies performed across different scenarios to assess the goodness of the Bayesian-LTMH framework.

3. Results and Discussion

3.1. Sample Description

The analyzed 24 Sardinian families each comprised 7–93 subjects (median = 26) and 1–16 MS cases (median = 3), for a total of 790 subjects: 118 MS cases (15%; 76 females (64%) and 42 males (36%)) and 672 healthy controls (85%). A total of 302 individuals (38%) were born on/after 1946. Descriptive statistics are reported in Table 1.
In Table 2, further details regarding MS cases were reported, including MS course, sex, and age/year of MS onset. The relapse–remitting course (RRMS) was the most represented (49%).
In Table 3, kinship relationships between the MS-related cases within the families were reported; among all these 238 kinship relationships, the distant relationships over the fourth degree were the most represented, i.e., 176 times (74%), while the other kinship relationships (from the first to the fourth) were found in similar proportions.

3.2. Bayesian-LTMH Results

We implemented the Bayesian-LTMH, including sex and categorized year of birth as covariates, and no diagnostic problems were encountered. Table 4 reports the results from the first analysis on the whole sample, including the median posterior distributions of the parameters, their standard deviation (SD), and the 95% highest posterior density credibility intervals (HPD CIs).
Categorized year of birth resulted as the strongest explanatory factor for MS liability variability, i.e., τ2βYR = 0.69 [95% CI: 0.64, 0.73], meaning that being born before or on/after 1946 explained ~70% of MS liability variability in our Sardinian population. Moreover, compared to individuals born before 1946, individuals born on/after 1946 resulted in a high MS liability increase, i.e., βYR (reference group ≤ 1946) = 3.17 [95% CI: 2.87, 3.48]. This result highlighted year of birth as the major contributor for MS liability variability at the population level, suggesting a crucial role for early environmental exposures which could be related to the so-called “westernization process”, among which different pollution levels, sanitary conditions, and dietary habits other than the sudden lack of Plasmodium falciparum immune trigger in the environment consequent to the malaria eradication program. Notably, the latter has been hypothesized to be associated with the increasing Sardinian MS incidence and prevalence observed in the last 50 years [62]. According to this hypothesis, cells of the innate immune system, selected over the centuries to contrast Plasmodium falciparum malaria, have kept the tendency to produce abnormal immune responses to new environmental factors even after the disappearance of malaria, consequently leading to an increased autoimmune risk.
Individual and shared environmental factors, not linked to the year of birth, explained ~17% (e2 = 0.17 [95% CI: 0.09, 0.23]) and ~8% (c2Total = 0.08 [95% CI: 0.02, 0.16]) of MS liability variability, respectively. These could depend on MS risk factors shared between individuals in the same household or specific to the individual, such as past viral infections (e.g., EBV), smoking habits, exposures to pollutants, low vitamin D levels, dietary habits, and childhood/adolescence obesity [15,16,63,64,65,66].
Genetic variability resulted as a poor explanatory factor, i.e., h2 = 0.03 [95% CI: 0.00, 0.09]. This result does not imply that genetic variability does not have a causal effect on MS, nor that genetics, in a broader sense, is not involved in determining the disease. Rather, it implies that genetic variability’s contribution in explaining MS liability variability in this specific population is extremely low compared to the other environmental factors. Lastly, sex resulted in a statistically significant increase in MS liability for the “females vs. males” comparison, i.e., βSEX = 0.36 [95% CI: 0.06, 0.68]; however, its explanatory role for MS liability variability was very low compared to the other parameters, i.e., τ2βSEX median value = 0.01 [95% CI: 0.00, 0.03].
In a separate model, we also included G × E effects variance i.e., h2G×E, due to interaction between additive genetics effects and categorized year of birth. The estimated h2G×E resulted equal to 0.03 [95% CI: 0.00, 0.10], while categorized year of birth remained the main explanatory factor, i.e., τ2βYR = 0.69 [95% CI: 0.64, 0.73]. This result does not imply that G × E causal effects were null but indicates that the interaction between early environmental exposures and genetic variants had very little impact on MS variability at a population level, potentially suggesting that these environmental factors may have exerted their effect on MS through other biological mechanisms. The posterior distributions for the parameters are shown in Figure 2, along with median value (in red) and 95% HPD CIs (in blue).
A secondary analysis was conducted stratifying the sample on the basis of the categorized year of birth, thus focusing on individuals with more similar early environmental exposures. The first group, i.e., “<1946”, was composed of 488 subjects: 238 males (49%) and 250 females (51%); 16 MS cases (3%) and 472 healthy controls (97%). The second group, i.e., “≥1946”, was instead composed of 302 subjects: 117 males (39%) and 185 females (61%); 102 MS cases (34%) and 200 healthy controls (66%). Table 5 reports the results from the Bayesian-LTMH model on both groups.
The h2 posterior distribution greatly differed between the two groups, i.e., 0.09 [95% CI: 0.00, 0.31] for the “<1946” group and 0.82 [95% CI: 0.68, 0.93] for the “≥1946” group, indicating that genetic variability acquired a high explanatory role for MS liability variability only considering individuals born on/after 1946. For an MS-affected individual born on/after 1946, the high h2 value provides a strong likelihood that the genetic variability made a greater contribution compared to environmental factors (specific to “≥1946” group) in producing a deviation from the population MS liability mean [8]. Potential hypotheses to explain the higher value of h2 in the second group compared to the first, i.e., (~82% vs. ~9%), could be the following: (i) a decrease in the influence of environmental factors, implying that the genetic variability acquired a higher explanatory role only because the relative explanatory importance was reversed; (ii) an increase in additive genetic effects, implying that the change in environmental factors caused genetic variants to operate differently; (iii) both cases together.
Shared environmental effects and sex resulted as the main explanatory components for the “<1946” group, i.e., c2Total = 0.48 [95% CI: 0.21, 0.75] and τ2βSEX = 0.31 [95% CI: 0.08, 0.51]; sex resulted in a statistically significant increase in MS liability for “females vs. males” comparison, i.e., βSEX = 1.33 [95% CI: 0.61, 2.03]. Therefore, in this group, specific shared environmental factors (as suggested above), as well as being female, were linked to a higher MS expression at the population level compared to the genetic variability.
Lastly, for the “≥1946” group, we were also able to include the exact year of birth as a covariate, finding a significantly increasing trend in MS liability, i.e., 0.19 [95% CI: 0.01, 0.36] for an increase of 10 years; however, year of birth explained only ~3% of MS liability variability, i.e., τ2βYR = 0.03 [95% CI: 0.00, 0.10].
In conclusion, the explanatory sources of MS variability largely differed within the two groups given their different early environmental background. The marginal posterior distributions for the parameters are shown in Figure 3 for both groups, along with median values (in red) and 95% HPD CIs (in blue).
Comparing h2 estimates between populations, in Sardinian individuals born on or after 1946, it resulted higher (~80%) compared to that obtained using twins from mainland Italy (~50%), Canada (~55%), and the United States (~40%), as well as Finland and France (~25%), while it resulted more similar to h2 estimates obtained using twins from the United Kingdom (~75%), as well as Denmark and Sweden (~65%) [20]. These results imply that the genetic variability in the Sardinian population, born on or after 1946, has a better explanatory role for MS liability compared to other populations. This could be due to greater additive genetic effects (e.g., specific genetic variants have a higher risk in the Sardinian environmental background), lower environmental effects (e.g., some of the environmental risk factors present in other population may not be part of the Sardinian environmental background), or both.
It is worth mentioning that our analysis suffered from some limitations. Firstly, available data did not include other potential confounders, even if their effect could have been partially captured in the shared environmental effects. Moreover, the assumed MVN distribution for the underlying liabilities could not be easily checked and, if not respected, could lead to biased estimates [47]. Nevertheless, our Bayesian-LTMH allowed a great advantage to obtain a reasonably precise posterior distribution for MS h2 in the Sardinian population using extended families ascertained from a proband [28].

4. Conclusions

In line with the latest literature [67], our results pinpoint environmental factors linked to having been born before or on/after 1946 as the leading factors in explaining ~70% of MS liability variability across the 20th century in the Sardinian population. Therefore, further investigations would be crucial to identify these specific early environmental factors involved in the increased MS liability in the Sardinian population. These factors could be researched in the so-called “Westernization process” that took place after World War II, such as different pollution levels, lifestyle, healthcare, and socioeconomic conditions, other than malaria eradication [62]. The remaining variability in MS liability (~30%) resulted mainly explained by environmental factors shared among individuals in the same household or specific to the individual (e.g., low vitamin D levels, obesity, past EBV virus infection, diet, and exposure to pollutants).
Despite the almost null h2 obtained analyzing the whole sample, genetic variability remains a highly relevant matter as it acquired the main explanatory role for MS liability variability (~82%) in the individuals born on/after 1946 when performing the stratified analysis based on year of birth. This finding suggests that changes in early environmental factors after 1946 have led to an increased impact of genetic variability on MS at the population level. This could be attributed to either a decline in the impact of environmental effects or a rise in the impact of genetic variant effects on MS risk over time. Therefore, further studies on the Sardinian genetic background could highlight causal biological pathways useful for MS prevention in the current population and for a better understanding of MS etiology.

Supplementary Materials

The following supporting information can be downloaded at https://www.mdpi.com/article/10.3390/genes14081579/s1: File S1. R and STAN codes and guidelines for Bayesian-LTMH implementation depending on the number of covariates included in the model; File S2. Dataset of Sardinian families with R and STAN codes to reproduce our analysis; Supplementary Section S1. Mathematical details for the inclusion of G × E effects variance in the Bayesian-LTMH; Supplementary Section S2. Description of the simulation studies conducted to assess the ability of the proposed Bayesian-LTMH to recover the true parameters, along with results reported in a table and in box plots.

Author Contributions

Conceptualization, A.N.; methodology, A.N. and T.F.; software, A.N.; formal analysis, A.N. and T.F.; investigation, V.S. and M.P.; data curation, A.N.; writing—original draft preparation, A.N. and T.F.; writing—review and editing, all authors; supervision, L.B. All authors read and agreed to the published version of the manuscript.

Funding

This research received no external funding.

Institutional Review Board Statement

The study was approved by the ethics committee of the Azienda Sanitaria of Nuoro and was conducted in conformity with the 1954 Declaration of Helsinki in its currently applicable version and applicable Italian laws.

Informed Consent Statement

Informed consent was obtained from all subjects involved in the study. Written informed consent was obtained from the patients to publish this paper.

Data Availability Statement

Raw data were uploaded as Supplementary File S2.

Acknowledgments

The authors wish to thank the patients, their relatives, and the ascertainment team in Nuoro.

Conflicts of Interest

The authors declare no conflict of interest.

References

  1. Visscher, P.M.; Hill, W.G.; Wray, N.R. Heritability in the genomics era—Concepts and misconceptions. Nat. Rev. Genet. 2008, 9, 255–266. [Google Scholar] [CrossRef] [PubMed]
  2. Kempthorne, O. The correlation between relatives on the supposition of mendelian inheritance. Am. J. Hum. Genet. 1968, 20, 402. [Google Scholar]
  3. Egeland, J. Heritability and Etiology: Heritability estimates can provide causally relevant information. Pers. Individ. Dif. 2023, 200, 111896. [Google Scholar] [CrossRef]
  4. Athanasiadis, G.; Speed, D.; Andersen, M.K.; Appel, E.V.R.; Grarup, N.; Brandslund, I.; Jørgensen, M.E.; Larsen, C.V.L.; Bjerregaard, P.; Hansen, T.; et al. Estimating narrow-sense heritability using family data from admixed populations. Heredity 2020, 124, 751–762. [Google Scholar] [CrossRef] [PubMed]
  5. Uchiyama, R.; Spicer, R.; Muthukrishna, M. Cultural evolution of genetic heritability. Behav. Brain Sci. 2022, 45, e152. [Google Scholar] [CrossRef]
  6. Pearson, C.H. Is heritability explanatorily useful? Stud. Hist. Philos. Sci. Part C Stud. Hist. Philos. Biol. Biomed. Sci. 2007, 38, 270–288. [Google Scholar] [CrossRef]
  7. Bourrat, P. Heritability, causal influence and locality. Synthese 2021, 198, 6689–6715. [Google Scholar] [CrossRef]
  8. Tal, O. From heritability to probability. Biol. Philos. 2009, 24, 81–105. [Google Scholar] [CrossRef]
  9. Milo, R.; Kahana, E. Multiple sclerosis: Geoepidemiology, genetics and the environment. Autoimmun. Rev. 2010, 9, A387–A394. [Google Scholar] [CrossRef]
  10. Compston, A.; Coles, A. Multiple sclerosis. Lancet 2008, 372, 1502–1517. [Google Scholar] [CrossRef]
  11. Schriml, L.M.; Lichenstein, R.; Bisordi, K.; Bearer, C.; Baron, J.A.; Greene, C. Modeling the enigma of complex disease etiology. J. Transl. Med. 2023, 21, 148. [Google Scholar] [CrossRef] [PubMed]
  12. Ghasemi, N.; Razavi, S.; Nikzad, E. Multiple Sclerosis: Pathogenesis, Symptoms, Diagnoses andCell-Based Therapy. Cell J. 2017, 19, 1. [Google Scholar] [CrossRef] [PubMed]
  13. Fazia, T.; Marzanati, D.; Carotenuto, A.L.; Beecham, A.; Hadjixenofontos, A.; McCauley, J.L.; Saddi, V.; Piras, M.; Bernardinelli, L.; Gentilini, D. Homozygosity Haplotype and Whole-Exome Sequencing Analysis to Identify Potentially Functional Rare Variants Involved in Multiple Sclerosis among Sardinian Families. Curr. Issues Mol. Biol. 2021, 43, 1778–1793. [Google Scholar] [CrossRef] [PubMed]
  14. Fazia, T.; Baldrighi, G.N.; Nova, A.; Bernardinelli, L. A systematic review of Mendelian randomization studies on multiple sclerosis. Eur. J. Neurosci. 2023. [Google Scholar] [CrossRef] [PubMed]
  15. Waubant, E.; Lucas, R.; Mowry, E.; Graves, J.; Olsson, T.; Alfredsson, L.; Langer-Gould, A. Environmental and genetic risk factors for MS: An integrated review. Ann. Clin. Transl. Neurol. 2019, 6, 1905–1922. [Google Scholar] [CrossRef]
  16. Amato, M.P.; Derfuss, T.; Hemmer, B.; Liblau, R.; Montalban, X.; Soelberg Sørensen, P.; Miller, D.H.; Alfredsson, L.; Aloisi, F.; Ascherio, A.; et al. Environmental modifiable risk factors for multiple sclerosis: Report from the 2016 ECTRIMS focused workshop. Mult. Scler. 2018, 24, 590–603. [Google Scholar] [CrossRef]
  17. Patsopoulos, N.A.; Baranzini, S.E.; Santaniello, A.; Shoostari, P.; Cotsapas, C.; Wong, G.; Beecham, A.H.; James, T.; Replogle, J.; Vlachos, I.S.; et al. Multiple Sclerosis Genomic Map implicates peripheral immune cells & microglia in susceptibility. Science 2019, 365, eaav7188. [Google Scholar] [CrossRef]
  18. Mitrovič, M.; Patsopoulos, N.A.; Beecham, A.H.; Dankowski, T.; Goris, A.; Dubois, B.; D’hooghe, M.B.; Lemmens, R.; Van Damme, P.; Søndergaard, H.B.; et al. Low-Frequency and Rare-Coding Variation Contributes to Multiple Sclerosis Risk. Cell 2020, 180, 403. [Google Scholar] [CrossRef]
  19. Fazia, T.; Pastorino, R.; Foco, L.; Han, L.; Abney, M.; Beecham, A.; Hadjixenofontos, A.; Guo, H.; Gentilini, D.; Papachristou, C.; et al. Investigating multiple sclerosis genetic susceptibility on the founder population of east-central Sardinia via association and linkage analysis of immune-related loci. Mult. Scler. 2018, 24, 1815–1824. [Google Scholar] [CrossRef]
  20. Fagnani, C.; Neale, M.C.; Nisticò, L.; Stazi, M.A.; Ricigliano, V.A.; Buscarinu, M.C.; Salvetti, M.; Ristori, G. Twin studies in multiple sclerosis: A meta-estimation of heritability and environmentality. Mult. Scler. 2015, 21, 1404–1413. [Google Scholar] [CrossRef]
  21. Ristori, G.; Cannoni, S.; Stazi, M.A.; Vanacore, N.; Cotichini, R.; Alfò, M.; Pugliatti, M.; Sotgiu, S.; Solaro, C.; Bomprezzi, R.; et al. Multiple Sclerosis in Twins from Continental Italy and Sardinia: A Nationwide Study. Ann. Neurol. 2005, 59, 27–34. [Google Scholar] [CrossRef]
  22. Kruuk, L.E.B.; Hadfield, J.D. How to separate genetic and environmental causes of similarity between relatives. J. Evol. Biol. 2007, 20, 1890–1903. [Google Scholar] [CrossRef] [PubMed]
  23. Dick, D.M. Shared Environment. Encycl. Stat. Behav. Sci. 2005, 4, 1828–1830. [Google Scholar] [CrossRef]
  24. Kendler, K.S.; Ohlsson, H.; Lichtenstein, P.; Sundquist, J.; Sundquist, K. The Nature of the Shared Environment. Behav. Genet. 2019, 49, 1–10. [Google Scholar] [CrossRef]
  25. Pittner, K.; Bakermans-Kranenburg, M.J.; Alink, L.R.A.; Buisman, R.S.M.; van den Berg, L.J.M.; van den Block, L.H.C.D.; Voorthuis, A.; Elzinga, B.M.; Lindenberg, J.; Tollenaar, M.S.; et al. Estimating the Heritability of Experiencing Child Maltreatment in an Extended Family Design. Child Maltreat. 2020, 25, 289. [Google Scholar] [CrossRef]
  26. De Villemereuil, P.; Gimenez, O.; Doligez, B. Comparing parent–offspring regression with frequentist and Bayesian animal models to estimate heritability in wild populations: A simulation study for Gaussian and binary traits. Methods Ecol. Evol. 2013, 4, 260–275. [Google Scholar] [CrossRef]
  27. Park, S.; Lee, S.; Lee, Y.; Herold, C.; Hooli, B.; Mullin, K.; Park, T.; Park, C.; Bertram, L.; Lange, C.; et al. Adjusting heterogeneous ascertainment bias for genetic association analysis with extended families. BMC Med. Genet. 2015, 16, 62. [Google Scholar] [CrossRef] [PubMed]
  28. Hawkes, C.H.; Macgregor, A.J. Twin studies and the heritability of MS: A conclusion. Mult. Scler. 2009, 15, 661–667. [Google Scholar] [CrossRef] [PubMed]
  29. Kim, W.; Kwak, S.H.; Won, S. Heritability estimation of dichotomous phenotypes using a liability threshold model on ascertained family-based samples. Genet. Epidemiol. 2019, 43, 761–775. [Google Scholar] [CrossRef]
  30. Louis, T.A. Finding the Observed Information Matrix When Using the EM Algorithm. J. R. Stat. Soc. Ser. B 1982, 44, 226–233. [Google Scholar] [CrossRef]
  31. Xu, C.; Baines, P.D.; Wang, J.L. Standard error estimation using the EM algorithm for the joint modeling of survival and longitudinal data. Biostatistics 2014, 15, 731. [Google Scholar] [CrossRef] [PubMed]
  32. Sofer, T. Confidence intervals for heritability via Haseman-Elston regression. Stat. Appl. Genet. Mol. Biol. 2017, 16, 259. [Google Scholar] [CrossRef] [PubMed]
  33. Granieri, E.; Casetta, I.; Govoni, V.; Tola, M.R.; Marchi, D.; Murgia, S.B.; Ticca, A.; Pugliatti, M.; Murgia, B.; Rosati, G. The increasing incidence and prevalence of MS in a Sardinian province. Neurology 2000, 55, 842–848. [Google Scholar] [CrossRef] [PubMed]
  34. Sotgiu, S.; Pugliatti, M.; Sotgiu, A.; Sanna, A.; Rosati, G. Review: Does the “Hygiene Hypothesis” Provide an Explanation for the High Prevalence of Multiple Sclerosis in Sardinia? Autoimmunity 2009, 36, 257–260. [Google Scholar] [CrossRef]
  35. Sotgiu, S.; Pugliatti, M.; Sanna, A.; Sotgiu, A.; Castigli, P.; Solinas, G.; Dolei, A.; Serra, C.; Bonetti, B.; Rosati, G. Multiple sclerosis complexity in selected populations: The challenge of Sardinia, insular Italy. Eur. J. Neurol. 2002, 9, 329–341. [Google Scholar] [CrossRef]
  36. Matveeva, O.; Bogie, J.F.J.; Hendriks, J.J.A.; Linker, R.A.; Haghikia, A.; Kleinewietfeld, M. Western lifestyle and immunopathology of multiple sclerosis. Ann. N. Y. Acad. Sci. 2018, 1417, 71. [Google Scholar] [CrossRef]
  37. Tognotti, E. Program to Eradicate Malaria in Sardinia, 1946–1950. Emerg. Infect. Dis. 2009, 15, 1460. [Google Scholar] [CrossRef]
  38. Riedl, B.; Beckmann, T.; Neundõrfer, B.; Handwerker, H.O.; Birklein, F. Multiple sclerosis epidemiology in Sardinia: Evidence for a true increasing risk. Acta Neurol. Scand. 2001, 103, 20–26. [Google Scholar] [CrossRef]
  39. Casetta, I.; Granieri, E.; Marchi, D.; Murgia, S.B.; Tola, M.R.; Ticca, A.; Lauria, G.; Govoni, V.; Murgia, B.; Pugliatti, M. An epidemiological study of multiple sclerosis in central Sardinia, Italy. Acta Neurol. Scand. 1998, 98, 391–394. [Google Scholar] [CrossRef]
  40. Poser, C.M.; Paty, D.W.; Scheinberg, L.; McDonald, W.I.; Davis, F.A.; Ebers, G.C.; Johnson, K.P.; Sibley, W.A.; Silberberg, D.H.; Tourtellotte, W.W. New diagnostic criteria for multiple sclerosis: Guidelines for research protocols. Ann. Neurol. 1983, 13, 227–231. [Google Scholar] [CrossRef]
  41. Hujoel, M.L.A.; Gazal, S.; Loh, P.R.; Patterson, N.; Price, A.L. Liability threshold modeling of case–control status and family history of disease increases association power. Nat. Genet. 2020, 52, 541–547. [Google Scholar] [CrossRef] [PubMed]
  42. Montomoli, C.; Allemani, C.; Solinas, G.; Motta, G.; Bernardinelli, L.; Clemente, S.; Murgia, B.S.; Ticca, A.F.; Musu, L.; Piras, M.L.; et al. An ecologic study of geographical variation in multiple sclerosis risk in central Sardinia, Italy. Neuroepidemiology 2002, 21, 187–193. [Google Scholar] [CrossRef]
  43. Urru, S.A.M.; Antonelli, A.; Sechi, G.M. Prevalence of multiple sclerosis in Sardinia: A systematic cross-sectional multi-source survey. Mult. Scler. J. 2020, 26, 372–380. [Google Scholar] [CrossRef] [PubMed]
  44. Visscher, P.M.; Wray, N.R. Concepts and Misconceptions about the Polygenic Additive Model Applied to Disease. Hum. Hered. 2015, 80, 165–170. [Google Scholar] [CrossRef] [PubMed]
  45. Ebers, G.C.; Sadovnick, A.D.; Dyment, D.A.; Yee, I.M.L.; Willer, C.J.; Risch, N. Parent-of-origin effect in multiple sclerosis: Observations in half-siblings. Lancet 2004, 363, 1773–1774. [Google Scholar] [CrossRef]
  46. Hoppenbrouwers, I.A.; Liu, F.; Aulchenko, Y.S.; Ebers, G.C.; Oostra, B.A.; Van Duijn, C.M.; Hintzen, R.Q. Maternal transmission of multiple sclerosis in a dutch population. Arch. Neurol. 2008, 65, 345–348. [Google Scholar] [CrossRef]
  47. Benchek, P.H.; Morris, N.J. How meaningful are heritability estimates of liability? Hum. Genet. 2013, 132, 1351–1360. [Google Scholar] [CrossRef]
  48. Gjessing, H.K.; Lie, R.T. Biometrical modelling in genetics: Are complex traits too complex? Stat. Methods Med. Res. 2008, 17, 75–96. [Google Scholar] [CrossRef]
  49. de Villemereuil, P.; Morrissey, M.B.; Nakagawa, S.; Schielzeth, H. Fixed-effect variance and the estimation of repeatabilities and heritabilities: Issues and solutions. J. Evol. Biol. 2018, 31, 621–632. [Google Scholar] [CrossRef]
  50. Nakagawa, S.; Schielzeth, H. A general and simple method for obtaining R2 from generalized linear mixed-effects models. Methods Ecol. Evol. 2013, 4, 133–142. [Google Scholar] [CrossRef]
  51. Almasy, L.; Towne, B.; Peterson, C.; Blangero, J. Detecting genotype x age interaction. Genet. Epidemiol. 2001, 21 (Suppl. 1), S819–S824. [Google Scholar] [CrossRef]
  52. Poveda, A.; Chen, Y.; Brändström, A.; Engberg, E.; Hallmans, G.; Johansson, I.; Renström, F.; Kurbasic, A.; Franks, P.W. The heritable basis of gene-environment interactions in cardiometabolic traits. Diabetologia 2017, 60, 442–452. [Google Scholar] [CrossRef]
  53. Paap, R. What are the advantages of MCMC based inference in latent variable models? Stat. Neerl. 2002, 56, 2–22. [Google Scholar] [CrossRef]
  54. Dunson, D.B. Commentary: Practical Advantages of Bayesian Analysis of Epidemiologic Data. Am. J. Epidemiol. 2001, 153, 1222–1226. [Google Scholar] [CrossRef]
  55. Luengo, D.; Martino, L.; Bugallo, M.; Elvira, V.; Särkkä, S. A survey of Monte Carlo methods for parameter estimation. EURASIP J. Adv. Signal Process. 2020, 2020, 25. [Google Scholar] [CrossRef]
  56. Tang, Y. Beyond EM: A faster Bayesian linear regression algorithm without matrix inversions. Neurocomputing 2020, 378, 435–440. [Google Scholar] [CrossRef]
  57. Hamra, G.; MacLehose, R.; Richardson, D. Markov Chain Monte Carlo: An introduction for epidemiologists. Int. J. Epidemiol. 2013, 42, 627. [Google Scholar] [CrossRef] [PubMed]
  58. Elston, R.C.; Olson, J.M.; Palmer, L. Biostatistical Genetics and Genetic Epidemiology; John Wiley & Sons: Hoboken, NJ, USA, 2002; p. 831. [Google Scholar]
  59. Carpenter, B.; Gelman, A.; Hoffman, M.D.; Lee, D.; Goodrich, B.; Betancourt, M.; Brubaker, M.A.; Guo, J.; Li, P.; Riddell, A. Stan: A Probabilistic Programming Language. J. Stat. Softw. 2017, 76, 1–32. [Google Scholar] [CrossRef] [PubMed]
  60. Betancourt, M. A Conceptual Introduction to Hamiltonian Monte Carlo. arXiv 2018, arXiv:1701.02434. [Google Scholar]
  61. Jonah Gabry and Rok Cesnovar cmdstanr: R Interface to “CmdStan”. 2021.
  62. Sotgiu, S.; Angius, A.; Embry, A.; Rosati, G.; Musumeci, S. Hygiene hypothesis: Innate immunity, malaria and multiple sclerosis. Med. Hypotheses 2008, 70, 819–825. [Google Scholar] [CrossRef]
  63. Handel, A.E.; Williamson, A.J.; Disanto, G.; Handunnetthi, L.; Giovannoni, G.; Ramagopalan, S.V. An updated meta-analysis of risk of multiple sclerosis following infectious mononucleosis. PLoS ONE 2010, 5, e12496. [Google Scholar] [CrossRef] [PubMed]
  64. Mameli, G.; Cossu, D.; Cocco, E.; Masala, S.; Frau, J.; Marrosu, M.G.; Sechi, L.A. EBNA-1 IgG titers in Sardinian multiple sclerosis patients and controls. J. Neuroimmunol. 2013, 264, 120–122. [Google Scholar] [CrossRef] [PubMed]
  65. Alfredsson, L.; Olsson, T. Lifestyle and Environmental Factors in Multiple Sclerosis. Cold Spring Harb. Perspect. Med. 2019, 9, a028944. [Google Scholar] [CrossRef] [PubMed]
  66. Ascherio, A.; Munger, K.L.; Lünemann, J.D. The initiation and prevention of multiple sclerosis. Nat. Rev. Neurol. 2012, 8, 602–612. [Google Scholar] [CrossRef]
  67. Puthenparampil, M.; Perini, P.; Bergamaschi, R.; Capobianco, M.; Filippi, M.; Gallo, P. Multiple sclerosis epidemiological trends in Italy highlight the environmental risk factors. J. Neurol. 2022, 269, 1817–1824. [Google Scholar] [CrossRef]
Figure 1. Examples of Sardinian extended families. Multiple sclerosis cases are reported in black, while the arrow denotes a proband.
Genes 14 01579 g001
Figure 2. Posterior distributions for parameters included in the Bayesian-LTMH applied to the Sardinian families.
Genes 14 01579 g002
Figure 3. Posterior distributions for parameters included in the Bayesian-LTMH applied to the Sardinian families stratified by year of birth.
Genes 14 01579 g003
Table 1. Descriptive statistics for the 24 Sardinian families.
FamilyIndividuals
N (%) 1
Probands
N
Females
N (%) 2
MS Cases
N (%) 2
165 (8%)637 (57%)6 (9%)
235 (4%)420 (57%)5 (14%)
370 (9%)745 (64%)9 (13%)
466 (8%)837 (56%)10 (15%)
512 (2%)26 (50%)3 (25%)
616 (2%)27 (44%)2 (13%)
743 (5%)524 (56%)5 (12%)
833 (4%)516 (48%)6 (18%)
917 (2%)210 (59%)2 (12%)
1020 (3%)213 (65%)3 (15%)
1115 (2%)18 (53%)3 (20%)
1233 (4%)517 (52%)6 (18%)
1317 (2%)211 (65%)3 (18%)
1451 (6%)624 (47%)12 (24%)
1525 (3%)316 (64%)3 (12%)
1644 (6%)524 (55%)8 (18%)
1719 (2%)212 (63%)2 (11%)
1816 (2%)28 (50%)2 (13%)
1922 (3%)313 (59%)3 (14%)
2027 (3%)216 (59%)2 (7%)
2128 (4%)113 (46%)2 (7%)
2216 (2%)27 (44%)4 (25%)
237 (1%)13 (43%)1 (14%)
2493 (12%)1148 (52%)16 (17%)
Total79089 435 (55%)118 (15%)
1 Percentages refer to the total number of individuals. 2 Percentages refer to the number of individuals within the family.
Table 2. Descriptive statistics for the 118 multiple sclerosis (MS) cases in the Sardinian families.
MS Course °N (%)Females (%)Age MS Onset Mean (SD)Year MS Onset Mean (SD)
RRMS58 (49%)41 (71%)28.45 (9.49)1990 (10.09)
SPMS27 (23%)14 (52%)28.89 (8.87)1983 (9.64)
PPMS1 (1%)1 (100%) 45.001995
Unknown32 (27%)20 (63%)N/AN/A
Total11876 (64%)28.64 (9.06) *1988 (10.88) *
° RRMS = relapse–remitting MS, SPMS = secondary-progressive MS, PPMS = primary-progressive MS, N/A = not available. * A total of 24 subjects had a missing age of MS onset.
Table 3. Kinship relationships between the 118 multiple sclerosis cases.
Kinship RelationshipN (%) *
First degree20 (8%)
Parent–offspring9
Mother6
Father3
Sibling13
Second degree9 (4%)
Uncle/aunt–nephew/niece8
Grandparent–grandchild1
Third degree16 (7%)
Cousins15
Grand-grandparent–grand-grandchild1
Fourth degree17 (7%)
Over the fourth degree176 (74%)
Total238
* Percentages refer to the total number of kinship relationships.
Table 4. Posterior distributions summary statistics for parameters included in the Bayesian-LTMH applied to the Sardinian families.
ParameterMedianSD 1HPD 95% CI 1
h20.0330.0280.000, 0.094
c2Sibs0.0330.0160.007, 0.067
c2Mother–Sibs0.0120.0120.000, 0.039
c2Father–Sibs0.0130.0130.000, 0.040
c2Spouses0.0140.0170.000, 0.051
c2Total0.0800.0370.021, 0.158
e20.1680.0360.094, 0.233
τ2βSEX,YR0.7120.0200.673, 0.749
τ2βSEX0.0090.0080.000, 0.027
τ2βYR0.6860.0240.637, 0.731
2cov°βSEX,YR0.0150.0070.003, 0.028
βSEX(Females vs. Males)0.3550.1570.057, 0.679
βYR(≥1946 vs. <1946)3.1730.1552.869, 3.477
1 SD = standard deviation, HPD 95% CI = highest posterior density 95% credibility interval. Proportion of MS liability variability explained by (i) h2 = additive genetic effects, (ii) c2Sibs = siblings’ shared environment effects, (iii) c2Mother-Sibs = shared environment effects between mother and the offspring, (iv) c2Father-Sibs = shared environment effects between the father and the offspring, (v) c2Spouses = shared environment effects between spouses, (vi) c2Total = total shared environment effects, (vii) e2 = individual environmental effects, (viii) τ2βSEX,YR = sex and year of birth, (ix) τ2βSEX = sex, (x) τ2βYR = year of birth, and (xi) 2cov°βSEX,YR = covariance between sex and year of birth. βSEX = increase in liability for females compared to males; βYR = increase in liability year of birth on/after 1946 compared to before 1946.
Table 5. Posterior distributions summary statistics for parameters included in the Bayesian-LTMH applied to the Sardinian families stratified by year of birth on different environment conditions.
Year of Birth < 1946Year of Birth ≥ 1946
ParameterMedianSD 195% HPD CI 1MedianSD 195% HPD CI 1
h20.0900.1000.000, 0.3120.8180.0680.679, 0.937
c2Sibs0.2230.1000.055, 0.4330.0450.0300.004, 0.109
c2Mother–Sibs0.0610.0580.000, 0.1850.0130.0160.000, 0.050
c2Father–Sibs0.0490.0510.000, 0.1630.0140.0170.000, 0.054
c2Spouses0.0850.0830.000, 0.2970.0190.0260.000, 0.078
c2Total0.4770.1420.199, 0.7500.1050.0560.019, 0.222
e20.0860.0830.000, 0.2650.0210.0250.000, 0.078
τ2βSEX,YRN/A 1N/A 1N/A 10.0420.0320.000, 0.109
τ2βSEX0.3040.1120.079, 0.5060.0050.0130.000, 0.035
τ2βYRN/A 1N/A 1N/A 10.0320.0300.001, 0.095
2cov°βSEX,YRN/A 1N/A 1N/A 10.0000.001−0.001, 0.001
βSEX(Females vs. Males)1.3220.3680.586, 2.0230.1040.177−0.246, 0.448
βYR(10 years increase)N/A 1N/A 1N/A 10.1860.0890.012, 0.362
1 SD = standard deviation, HPD = highest posterior density credibility interval, N/A = not available. Proportion of MS liability variability explained by (i) h2 = additive genetic effects, (ii) c2Sibs = siblings’ shared environment effects, (iii) c2Mother–Sibs = shared environment effects between mother and the offspring, (iv) c2Father–Sibs = shared environment effects between the father and the offspring, (v) c2Spouses = shared environment effects between spouses, (vi) c2Total = total shared environment effects, (vii) e2 = individual environmental effects, (viii) τ2βSEX,YR = sex and year of birth, (ix) τ2βSEX = sex, (x) τ2βYR = year of birth, and (xi) 2cov°βSEX,YR = covariance between sex and year of birth. βSEX = increase in liability for females compared to males; βYR = increase in liability for 10 years increase in year of birth.
Disclaimer/Publisher’s Note: The statements, opinions and data contained in all publications are solely those of the individual author(s) and contributor(s) and not of MDPI and/or the editor(s). MDPI and/or the editor(s) disclaim responsibility for any injury to people or property resulting from any ideas, methods, instructions or products referred to in the content.

