Article

Human Population Density Influences Genetic Diversity of Two Rattus Species Worldwide: A Macrogenetic Approach

by
Chrystian C. Sosa
1,2,
Catalina Arenas
1 and
Víctor Hugo García-Merchán
1,*
1
Evolution, Ecology and Conservation Research Group—EECO, Biology Program, Faculty of Basic Sciences and Technologies, Universidad del Quindío, Armenia 630004, Colombia
2
Department of Natural Sciences and Mathematics, Pontificia Universidad Javeriana, Cali 7 #40-62, Bogotá 110311, Colombia
*
Author to whom correspondence should be addressed.
Genes 2023, 14(7), 1442; https://doi.org/10.3390/genes14071442
Submission received: 19 May 2023 / Revised: 18 June 2023 / Accepted: 21 June 2023 / Published: 14 July 2023

Abstract

:
On a planet experiencing constant human population growth, it is necessary to explore the anthropogenic effects on the genetic diversity of species, and specifically invasive species. Using an analysis that integrates comparative phylogeography, urban landscape genetics, macrogenetics and a systematic review, we explore the worldwide genetic diversity of the human commensal and anthropogenic species Rattus rattus and Rattus norvegicus. Based on metadata obtained considering 35 selected studies related to observed heterozygosity, measured by nuclear molecular markers (microsatellites, Single Nucleotide Polymorphisms—SNPs-, restrictition site-associated DNA sequencing -RAD-Seq-), socioeconomic and mobility anthropogenic factors were used as predictors of genetic diversity of R. rattus and R. norvegicus, using the Gini index, principal component analysis and Random Forest Regression as analysis methodology. Population density was on average the best predictor of genetic diversity in the Rattus species analyzed, indicating that the species respond in a particular way to the characteristics present in urban environments because of a combination of life history characteristics and human-mediated migration and colonization processes. To create better management and control strategies for these rodents and their associated diseases, it is necessary to fill the existing information gap in urban landscape genetics studies with more metadata repositories, with emphasis on tropical and subtropical regions of the world.

1. Introduction

Today, some 56% of the world’s population—4.4 billion inhabitants—live in cities. This trend is expected to continue, with the urban population more than doubling its current size by 2050, at which point nearly 7 of 10 people will live in cities [1]. This growth, especially concentrated in urban and suburban areas of developing countries around the world, subject to anthropic processes such as migration, waste management, pollution and unplanned housing construction, results in landscape modification [2].
The ecological and evolutionary dynamics that occur in the species that inhabit these modified environments can be explored from a genetic perspective to quantify the degree of impact that urbanization and anthropic effects have on the behavior of genetic diversity and population structure [3]. In the case of invasive species, the issue becomes urgent, given the proven consequences of their negative impact on the vertiginous decline of native biodiversity [4]. Given that urban environments are conducive habitats for commensal rodents, compared to more natural ones [5], it is important to assess the genetic diversity of species in environments with some degree of anthropogenic intervention.
The black rat (Rattus rattus), native to the India subcontinent, and the brown rat (Rattus norvegicus), native to Siberia and China, are two rodent species that have adapted to urban life, spreading to and invading many cities around the world [6]. Among their negative impacts on humanity, the most relevant are the extinction, decrease or displacement of native species [7,8]; transmission of zoonotic diseases [9,10]; and economic losses [11,12].
However, with these negative impacts identified, it is surprising that there are not as many studies exploring the genetic diversity and structure of species with cosmopolitan distribution such as those of the genus Rattus mentioned here. It would be expected, according to [6], that both R. rattus and R. norvegicus would be highly studied species at the genetic level, supported by aspects such as distribution in cities and urban centers around the world, accessible sampling and in large numbers, relatively short generation times, strong ecological associations with the urban habitat and well-developed genomic resources. However, there are very few studies on the subject, particularly in urban environments. For example, in a review by [3], of 470 studies in landscape genetics, only 32 were identified between 2015 and 2020 related to urban landscape genetics, and only 1 was on rodents other than the genus Rattus.
The distribution of genetic diversity of cosmopolitan species mediated by human migrations, such as R. rattus and R. norvegicus, has a historical component that needs to be considered. Comparative phylogeography offers a framework for understanding such historical factors that have shaped the genetic diversity of species and in turn the connection with contemporary processes explored by landscape genetics [13]. The integration of both approaches may help to unravel the complex interplay between historical events and ongoing landscape processes in shaping the genetic variation of Rattus species, and thereby complement the focus of the present study on the distribution of genetic diversity of these two rodent species. In turn, there are two areas that can currently serve as a bridge to identify information to support phylogeographic studies at a landscape scale: namely macrogenetics and systematic reviews.
Macrogenetics is an emerging discipline that explores the genetic patterns and phenomena associated with large-scale populations by aggregating and reanalyzing thousands of previously published genetic datasets [14]. For systematic reviews, the goal of the field is to provide a valid summary of primary research findings through an explicit, pre-planned procedure [15]. With a growing body of scientific literature in ecology, evolution, genetics, conservation biology and related fields, there is an increasing need to summarize trends, identify emerging questions, clarify controversies and explain conflicting results [16,17].
To assess the impact that anthropogenic processes may have on the distribution of the genetic diversity of R. rattus and R. norvegicus in urban areas, we tested the hypothesis that economic indicators and socioeconomic disparities may lead to an uneven distribution of genetic diversity between species in different urban areas of the world. If this is confirmed, from the use of metadata, we could establish new predictors that explain the behavior of genetic variability of both species differentially in urban environments. This would in turn have implications for species management and control strategies in cities.

2. Materials and Methods

This systematic review was conducted rigorously following the Preferred Reporting Items for Systematic reviews and Meta-Analyses (PRISMA) guidelines [18]. We collected relevant data that conformed to the eligibility criteria of our study. From the systematic review, we carried out a macrogenetic approach, defining predictors of genetic diversity.

2.1. Study Design

Based on the absence of a worldwide exploration of the genetic diversity status of two invasive species with cosmopolitan distribution, such as R. rattus and R. norvegicus, we conducted a systematic review to evaluate at least one metric of genetic diversity of these species according to a series of socio-economic and human mobility predictors.

2.2. Eligibility Criteria

2.2.1. Inclusion Criteria

Studies were selected based on the following inclusion criteria: (1) articles considering R. rattus, R. norvegicus or both species as study species; (2) articles focused on phylogeographic studies; (3) articles with supplementary material or tables with genetic diversity metrics; (4) articles considering nuclear or mitochondrial molecular markers; (5) studies carried out in urban or semi-urban landscapes; (6) articles with geographic coordinates for each data reported; (7) articles published in English.

2.2.2. Exclusion Criteria

The exclusion criteria were as follows: (1) posters, conference papers, abstracts and review papers; and (2) pathogenicity studies associated with viruses and bacteria.

2.3. Literature Search and Selection of Articles

We searched the Scopus database for information using the following Boolean combinations: “Rattus AND genetic* AND geographic”; “Rattus AND genetic* AND phylogeograph*”; “Rattus AND phylogenetic”. In the first step, we eliminated duplicate items. In the second step, we reviewed the titles and abstracts based on the inclusion and exclusion criteria. In the third step, we selected studies carried out on R. rattus and R. norvegicus in urban or semi-urban areas (urban–natural transition). In the fourth step, all selected articles were reviewed for their respective citations using the statistics generated by Google Scholar. As a fifth step and as a final inclusion criterion, we selected articles that had supplementary material or tables with at least one genetic diversity metric that was the same for all studies in both species.

2.4. Data Extraction

From reading the full text of all selected articles that met the inclusion criteria, we identified that the only metric of genetic diversity that met the requirement of being present in all studies was observed heterozygosity (Ho). Furthermore, given that we found deviations from the Hardy–Weinberg Equilibrium (HWE) in several selected studies [6,19,20,21], Ho was precisely the most appropriate metric to use in our study, considering that the expected heterozygosity (He) assumes HWE. In addition, only nuclear markers were considered for the analyses to reduce the bias of Ho values due to mitochondrial markers’ nature and avoid standardization by marker type as well.

2.5. Risk of Bias across Studies

In the second phase of the screening, each of the 139 selected studies were read in full to identify the genetic diversity metrics for further analysis at the macrogenetic level. From this process, the following aspects were identified: (1) there was much heterogeneity in the use of the diversity metrics used; (2) several studies presented global values of genetic diversity, omitting locality-specific values; (3) several studies did not include geographic coordinates in the data analyzed; (4) several studies were focused on the analysis of population genetic structure, presenting genetic variability values at the interpopulation level but not at the intrapopulation level; (5) several studies used data from other studies, which, when reviewed, could not be used due to lack of information (e.g., the data were not available in the literature); and (6) several studies did not use data from other studies, which, when reviewed, could not be used due to lack of information (e.g., the data were not available in the literature). Therefore, to carry out meta-analyses and macrogenetic analyses from a systematic review, we decided to homogenize the data collection in the studies, increase the number of variables to be considered and provide free access to the information through repositories, tables within the text of the articles and the presence of ample and sufficient supplementary material.
Since only observed heterozygosity (Ho) was found across most of the studies recovered by PRISMA methodology, we chose to use anthropic factors under the hypothesis of anthropic factors affecting the genetic diversity of both Rattus analyzed. Thus, this study tried to take into consideration only raster data with the available data. This means that no pixel was imputed to reduce the description and predictability to areas where complete data were found for all the predictors described below. This contributed to reducing the spatial bias and improving the reproducibility of the results, but also allowed a fair comparison by avoiding creating synthetic data or including noisy information. Nevertheless, the spatial distribution of analysis for species was not considered here, since there is a lack of genetic diversity studies of both species worldwide that did not allow the use of spatial sampling to avoid spatial autocorrelation.

2.6. Definition of Predictors

To identify the anthropic factors (economic and human population indicators) affecting the genetic diversity of R. norvegicus and R. rattus species, a set of five gridded predictors were downloaded: Gross Domestic Product per capita (GDP) for the year 2015 [22]; Population Density, v4.11 for the year 2020 [23]; Global Gridded Relative Deprivation Index (GRDI), v1 for the year 2020 [24]; travel time in minutes to the nearest urban area between 5000 and 110 million people; and travel time in minutes to any port [25]. These predictors were chosen to test whether they were related to perturbations in the genetic diversity of the rat species (Ho) from a holistic perspective, according to the following criteria: (1) GDP was chosen to observe if economic growth affects the Ho values of the two species; (2) human population density was chosen to observe if the human population density is related to higher Ho values; (3) the relative levels of multidimensional deprivation and poverty affecting rats genetic diversity were chosen to observe how the closeness to main cities or port affects the Ho value of both rat species. All datasets were resampled to 5 km (2.5 arcmins) using the nearest-neighbor method to reduce the computation time and standardize data to the same resolution for the description and prediction of observed heterozygosity via random forest regression.
Predictor values were extracted for each of the localities extracted from the systematic search using the Raster v3.6-20 R package. Localities were omitted from the analysis if they did not possess values for all the predictors for each species (localities with no values were discarded from further analyses). A principal component analysis (PCA) was performed using FactoMineR v.7 to inspect visual similarities between R. norvegicus and R. rattus localities sampled according to observed heterozygosity and the five predictors described above.
PCAs were performed for each species to detect predictors of multicollinearity and perform a hierarchical principal component clustering (HCPC) with the FactoMineR v.7 R package to detect groups of localities per species. On the other hand, random forest regressions were performed to detect the impact of the predictors on the observed heterozygosity. A Jackknife validation strategy (without sample replacement), given the small number of samples per species (<100), was used. Likewise, as a criterion of importance to predict the effect on observed heterozygosity, we used the Gini index. In addition to the Jackknife validation strategy, Wilcoxon tests were performed for Ho to identify the influence of mainland and island effect over the presence of both rat species. No regression predictions were performed for island and mainland records separately, since the number of island and mainland records were low for both species: Rattus norvergicus (island = 24 records, mainland = 59 records), and R. rattus (island = 24 records, mainlaind = 35 records).
A gridded search to find the random forest number of trees from a range from 10 to 10,000 trees was performed. The optimal random forest regression configuration per species was defined as the regression with the minimum value of out-of-bagging value (OOB) root mean square error (RMSE), and it was used for all the subsequent analyses. These analyses were performed in the ranger R package v0.14.1.
A worldwide prediction of observed heterozygosity was obtained for each Rattus species using the random forest regression and the spatial predictors. To obtain an evaluation of possible extrapolation and uncertainty for the predictors used to project the predicted observed heterozygosity spatially, a Multivariate Environmental Similarity Surface (MESS) was calculated with the spatial predictors GDP, Population Density, GRDI, travel time in minutes to the nearest urban area between 5000 and 110 million people and travel time in minutes to any port, extracted from the localities obtained to train the random forest regressions for each species. This approach was preferred, given that the MESS index highlights areas where environmental conditions are outside conditions found in the presence records [26]. Negative MESS values indicate areas where a projection of a model based on the predictors described above would be due more to extrapolation than a proper prediction. In consequence, to avoid uncertainty in the projected Ho values, only observed heterozygosity grids greater than the median of the MESS positive values were considered valid predicted grids to reduce the bias of extreme predicted values in maps. MESS maps are available in Figure S1.

3. Results

3.1. Systematic Review

A total of 1032 articles were identified using our search strategy, as shown in Figure 1. Ultimately, 35 studies (17 for R. rattus and 18 for R. norvegicus) were systematically reviewed (Table S1).
In terms of geographic distribution, 8 studies considered data from Africa, 9 from the Americas, 12 from Asia and 10 from Europe (Figure 2). Twenty studies used microsatellite molecular markers, ten used SNPs and seven used genomic approaches. At the level of studies comparing molecular vs. mitochondrial markers, eight were identified. Three studies carried out a comparative phylogeography approach, two considering R. rattus and R. norvegicus and one a different species of the genus. Only one study combined a comparative phylogeography approach considering both nuclear and mitochondrial molecular markers. As for the fine spatial scale, 8 studies evaluated anthropogenic processes affecting genetic diversity in cities and 10 explored it in archipelagos. We found 12 studies where the focus was associated with migration routes and historical colonization processes of R. rattus and R. norvegicus.

3.2. Metrics of Genetic Diversity

In the 35 studies considered, genetic diversity measured as observed heterozygosity was higher for R. rattus (0.623 ± 0.126) than for R. norvegicus (0.453 ± 0.181). For R. rattus, the highest values were recorded in Southern India and the lowest in Bowditches, United States (Figure S2). For R. norvegicus, the highest value was found in West Baltimore, United States, and the lowest in Helsinki, Finland (Figure S2).
A low correlation was observed between population density and observed heterozygosity for R. norvegicus. In contrast, three predictors, gridded poverty (deprivation value), travel time to cities (min) and travel time to ports (min), showed light to medium correlations for R. rattus, but a slight effect could be observed with the travel time to ports for the last species. Thus, none of the predictors for both species had multicollinearity with the Ho values (Table 1)
The predicted values of Ho using MESS did not allow prediction values for Northern America due to the presence of negative values, which indicates a possible extrapolation that was omitted to ensure the reproducibility of our approach. Nevertheless, the highest predicted Ho values were found in Western Europe, Japan, the mountain region of Latin-America and southwestern India for R. rattus (Figure 3). In contrast, for R. norvegicus, the highest values of predicted Ho were in Northern Africa, South India, Indochina, Eastern Europe and South America. Finally, Western countries showed individuals with lower predicted Ho values (Figure 4).

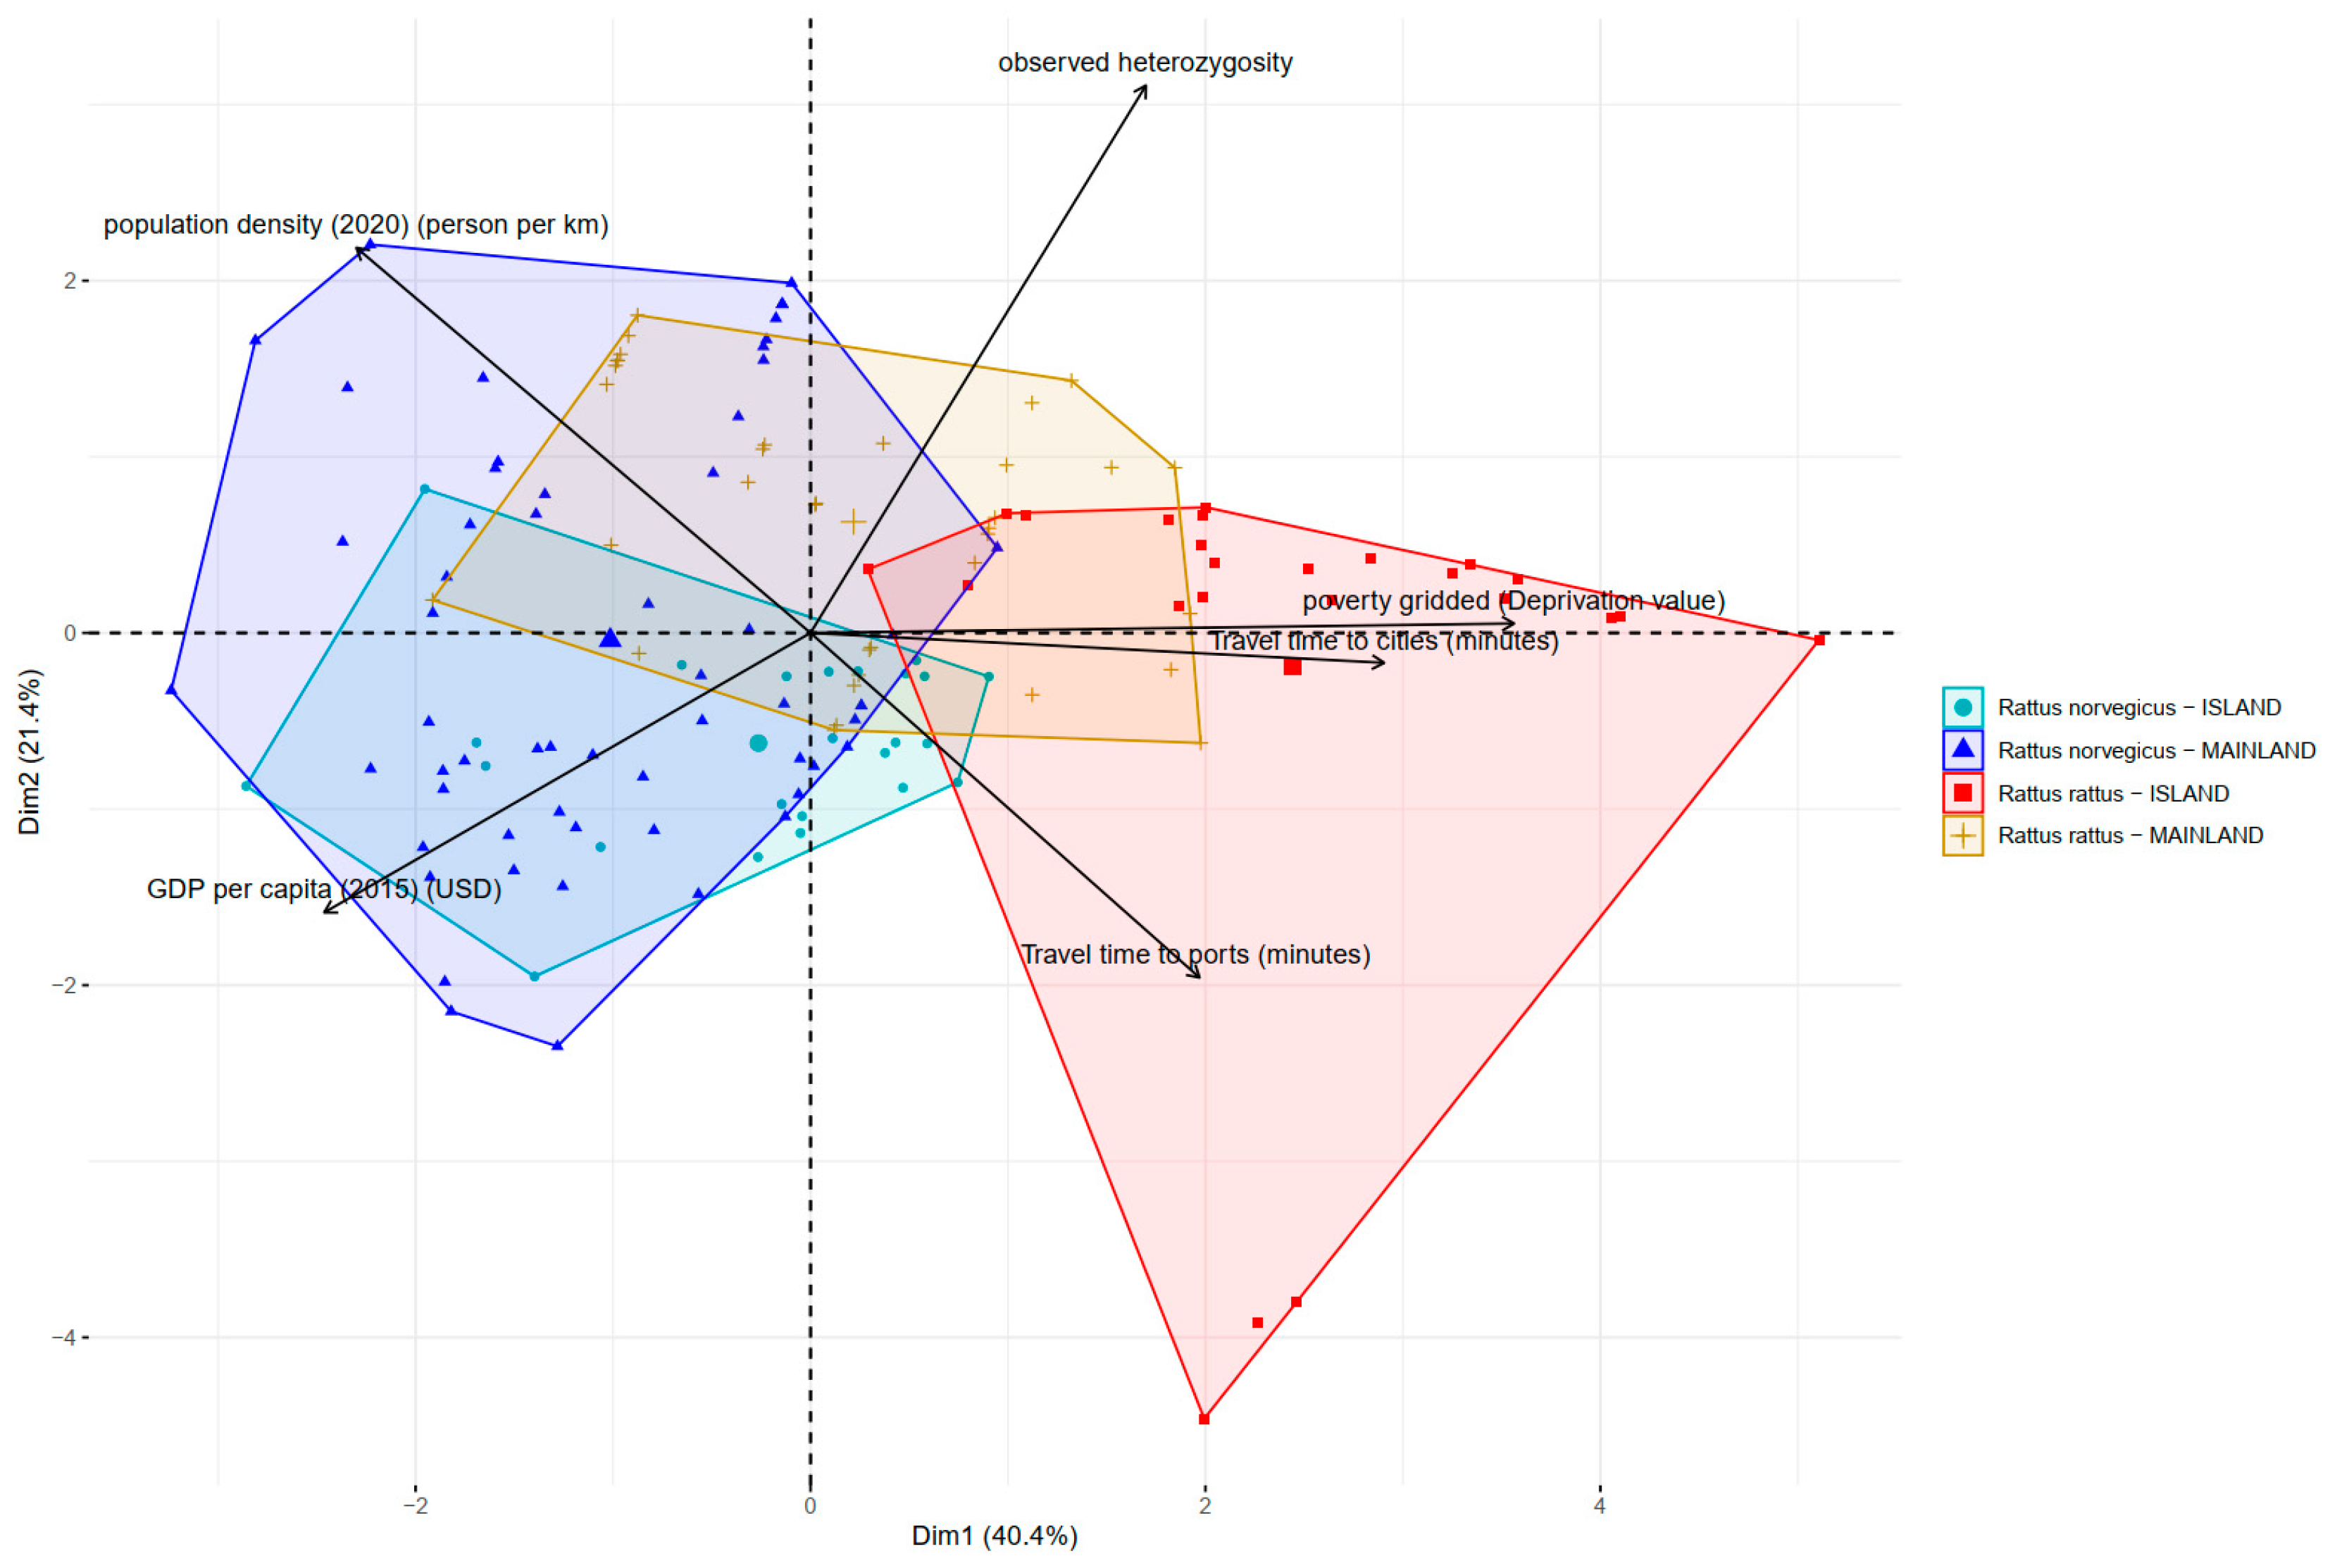
3.3. Predictors of Genetic Diversity

Random forest regression performance metrics were highly similar between observed and predicted Ho values, as is suggested by the root mean square error (RMSE) of the out-of-bag evaluation, RMSE = 0.0229 and RMSE = 0.005 for R. norvergicus and R. rattus, respectively. A similar behavior was observed for the RMSE of observed vs. predicted Ho values, RMSE = 0.095 and RMSE = 0.0422 for R. norvergicus and R. rattus, respectively. This indicates that both regressions accurately predicted the training and validation dataset values used in the Jackknife strategy (Figure 5)
The Gini index values using random forest regression methodology (Table 2) and principal component analysis (Figure 6) supported our working hypothesis, indicating that on average, human population density is the best predictor of genetic diversity (measured as observed heterozygosity) for both R. rattus and R. norvegicus. Nevertheless, it is important to highlight that R. rattus island records had more variability than the mainland records (Wilcoxon tests, p-value 0.0038), but this does not affect our original working hypothesis.
Other predictors identified by the analyses in the characterization of genetic diversity were travel time to ports and Gross Domestic Product (GDP) per capita for R. rattus and the global Gridded Relative Deprivation Index (GRDI) and GDP per capita for R. norvegicus.

4. Discussion

This study is the first, to our knowledge, using metadata obtained from a systematic review combined with a comparative phylogeographic and landscape genetic analysis, to evaluate urban anthropogenic effects from a genetic perspective in two rat species widely distributed around the world. According to [14,27], our exploration may be an application of the new area known as macrogenetics. From Gini’s index using random forest regression and the results of principal component analysis, we found that, on average, population density is the main predictor determining genetic diversity (measured by observed heterozygosity in nuclear markers) in R. rattus and R. norvegicus (Table 2 and Figure 6). Considering all metadata used for both species, the observed heterozygosity was higher in R. rattus than in R. norvegicus, which is consistent with the distribution of both species in the United States [28]. We confirm the hypothesis that anthropogenic factors, such as population density and GDP per capita, are predictors of differential behavior of genetic diversity in R. rattus and R. norvegicus through metadata obtained from 35 studies analyzed worldwide.
The effects of anthropogenic factors on the genetic diversity of invasive species in urban habitats can be complex and depend on many aspects associated with human activities. In our study, we focused on socioeconomic and mobility indicators as predictors of genetic diversity. The effects of anthropogenic factors on the genetic diversity of invasive species in urban habitats can be complex and depend on many aspects associated with human activities. The signal predictors used here can be interpreted in the light of five interrelated points: (1) species dispersal; (2) heterogeneity and scale of urban environments; (3) migration and colonization processes of invasive species; (4) species behavior defined by life history traits; and (5) availability of metadata-type information.
Several studies evaluating the genetic variability of species of the genus Rattus indicate that dispersal is low or very local, at the scale of cities and even neighborhoods within the same city, indicating the effect that the urban environment may have on the distribution of genetic diversity [3,6,19,20,21]. For example, in the systematic review conducted herein, we found several studies [19,20,21] where an absence of correlation between genetic and geographic distances was presented, which can be expected when passive (e.g., human-mediated) dispersal or heterogeneity occurs on a fine scale in the urban habitat. However, in our case, by exploring other types of correlations (e.g., population density vs. Ho; gridded poverty/deprivation value vs. Ho; travel time to cities/ports vs. Ho), we were able to identify some form of relationship (Table 1). This indicates the potential for exploring variables that directly include genetic diversity (measured by heterozygosity) and predictors that transcend the classical model of isolation by distance.
Likewise, the genetic patterns of R. rattus and R. norvegicus will depend on the interactions between demographic and behavioral processes, on the one hand, and the spatial scale at which each site has been sampled on the other. Thus, the genetic diversity of these invasive species is defined by the interactions between their dispersal capacity, the heterogeneity and quality of habitats (in terms of food availability) and the social behavioral characteristics per se of the species, such as philopatry and their level of territoriality and aggressiveness [21,29,30,31].
High population density can also create barriers to gene flow and dispersal, which can reduce the genetic diversity of invasive species populations. For example, urban areas can be surrounded by barriers such as highways, rivers or mountains, which can restrict the movement of invasive species and lead to genetic isolation. In our study, population density was the main predictor identified for R. norvegicus (Gini index = 1) and the second for R. rattus (Gini index = 0.74). In this regard, there is no study that has systematically addressed this predictor in the distribution of genetic variability in invasive rodents. The only study that tangentially approached it was [32], which explored globally the effect of population density and land use on genetic diversity in more than 150,000 data points of birds, insects, fish and mammals, finding no effect of the two predictors. However, with respect to our study, the inference found in [32] should be analyzed with caution for three reasons: (1) it is based on mitochondrial DNA; (2) it considers only 40 R. rattus data points; and (3) most of the points correspond to the same localities (same georeferenced points).
R. rattus and R. norvegicus are arguably the most successful invasive species on the planet, and human migrations have had a major influence on the spread and dispersal of invasive species populations within and between urban areas through processes such as genetic drift and gene flow [33,34]. Human movements and transportation networks can facilitate the dispersal of rats across urban environments, which can increase gene flow between populations and impact the genetic diversity of populations at different scales [31,35,36,37]. For example, while [19], using SNPs, found divergent genomic signals in R. norvegicus in New York City at a scale of less than 600 m between colonies, Ref. [38] found convergence in genetic diversity signal with the same type of molecular marker among R. norvegicus individuals from eastern North America, South America, Africa, Australasia and western Europe.
Moreover, due to the genetic variability detected between different inheritance types of molecular markers in the same study, such as [28,38,39] in our systematic review, it is necessary to define the same type of molecular marker (nuclear, in the meta-analysis of the present study) in order not to confound possible signals about the association between genetic diversity, anthropogenic traits and differentiation of spatial scales of sampling (e.g., islands vs. continental areas). In another study by [31], the importance of river transport and subsequent connectivity between ports is highlighted, which is consistent with travel time to port, one of the predictors of genetic diversity identified by us in R. rattus. The history of Rattus colonization in the world is the history of human migrations; consequently, the origin of commensalism in these rodents inevitably reflects the history of human settlement and associated anthropogenic factors. Although further studies are needed, the more recent dispersal of R. norvegicus from its center of origin in Siberia to Europe in the 16th century [40] may be one of the reasons for the lower average value of genetic diversity found in our metadata, compared to the dispersal of R. rattus, which is linked to the beginning of Indian civilization (approximately 5000 years BC) and subsequent dispersal dynamics, mainly by maritime routes [35]. Other evidence supporting this behavior of a higher average value of genetic diversity in R. rattus than in R. norvegicus was found in two studies with a comparative phylogeography approach to that reported in our study. The first corresponds to a regional scale across the United States [37], and the second to a local scale on a Canadian Pacific Island [41].

5. Conclusions and Recommendations

While high human population density can create conditions that favor the establishment and spread of invasive species, it can also create barriers to gene flow and dispersal and increase selective pressures that reduce genetic diversity. Understanding these factors is crucial to managing and mitigating the impact of invasive species in urban areas. In the case of R. rattus and R. norvegicus, human commensal and anthrodependent species, it is vital to explore the spatiotemporal dynamics of genetic diversity in current and emerging urban areas around the world (with special emphasis on tropical countries) to design management and control strategies for these pests and their associated diseases. For instance, it would be interesting to observe if the changes in Ho values are related to changes in the human population to provide tracking systems of which strategies can influence and lead to the mitigation of the dispersal of these invasive species worldwide.
Although we identified several studies in regions other than developed countries and with tropical or subtropical distribution, e.g., Nigeria [31], Benin [42], Senegal [36], Gabon [30]; Brazil [6,21], India [35,43], Madagascar [29] and Ecuador [44], further sampling and genetic diversity analysis efforts are needed in the regions of Asia, Africa and Central and South America, given the specific projections of population expansion expected in the near future in these areas and to the socioeconomic, political, climatic and urban development characteristics, which may be very different from those of temperate zones, where the largest number of studies on landscape genetics of invasive rodent species to date have been carried out.
Our analyses reveal critical data and theory gaps and call for increased efforts to monitor global genetic diversity. To increase the data matrices of invasive species in the world, and thus strengthen management strategies based on empirical evidence, it is necessary to expand the focus on urban landscape genetics in species of the genus Rattus, both those covered in this study and others not considered. Following the study by Fusco et al. 2021 mentioned in the introduction, we conducted a search between 2021 and 2023 with the keywords “urban landscape genetics”, considering its appearance anywhere in the body of a paper, finding only 20 studies, of which none were conducted in rodents. This shows that the information gap persists today and needs to be filled.
Human activities can also affect intraspecific genetic diversity at the natural level (e.g., via habitat fragmentation, [45,46]), hence the need for further studies comparing disturbance processes and temporal and spatial modification of evolutionary mechanisms such as selection (e.g., adaptive processes), genetic drift and gene flow (e.g., levels of connectivity) in invasive species distributed in both urban and natural habitats.
To compare the genetic diversity of invasive species at different spatial and temporal scales, it is necessary to strengthen the metadata related to nuclear molecular markers (e.g., [47]) to design macrogenetic studies that assess variability at different temporal scales and spatial data, and thus add to the studies based on larger existing repositories at the mitochondrial DNA level. Likewise, based on its genome distribution, genotyping facilities, and lower homoplasy compared to microsatellites, it is necessary to consider more studies in urban landscape genetics in invasive species with nuclear markers, such as SNPs and genome-wide studies, to improve possible tracking systems of genetic diversity caused by human activities. This integrative work shows the importance of increasing the sampling effort between continental and insular areas, in order to define the criteria for management and control of invasive species with a wide distribution in the world.
R. rattus and R. norvegicus are considered among the most important invasive species in the world for reasons such as their cosmopolitan distribution, high reproductive capacity, adaptive capacity, negative impact on ecosystems, disease vectors and economic impacts. In this scenario, control strategies are a challenge. Macrogenetic-scale studies such as the one presented here can provide the following recommendations to mitigate the negative effects of these species on the invaded ecosystems:
(1) By analyzing the genetic composition of rat populations in different areas using metadata, scientists can determine the origin of introductions, colonization patterns and the degree of genetic mixing between populations more precisely. This information could help understand how these species spread and establish new populations.
(2) Macrogenetic studies can help identify the routes and pathways by which rats are introduced into new regions. Through analysis of the genetic signatures of rat populations, the origins and possible sources of invasion can be traced. This knowledge is crucial for implementing targeted prevention measures and biosecurity protocols at points of entry to reduce the risk of new introductions.
(3) Examination of large-scale genetic variation can identify patterns in genetic traits or markers associated with traits such as reproductive capacity, survival, behavior and resistance to control measures. This information can guide the development of more effective control strategies that target specific traits or exploit vulnerabilities in invasive populations.
(4) Different rat populations throughout the world may vary in their behavior, their response to particular control methods or their susceptibility to specific toxins. By accounting for genetic diversity on a global scale, control strategies can be tailored to the unique characteristics of specific populations, increasing the chances of success and minimizing unintended consequences.
(5) Large-scale genetic diversity studies can provide a more robust basis for monitoring the effectiveness of control strategies over time. By comparing the genetic composition of rat populations before and after control efforts, it is feasible to assess the impact of interventions, detect any changes in population structure or genetic diversity and make necessary adjustments to control strategies.

Supplementary Materials

The following supporting information can be downloaded at: https://www.mdpi.com/article/10.3390/genes14071442/s1, Table S1: Systematic review—final studies included [6,19,20,21,28,29,30,31,35,36,37,38,39,41,42,43,44,48,49,50,51,52,53,54,55,56,57,58,59,60,61,62,63,64,65]. Figure S1: MESS raster obtained for (A) Rattus rattus; (B) Rattus norvegicus. Figure S2: Observed heterozygosity predicted with points used for estimation via random forest regression in (A) Rattus rattus; (B) Rattus norvegicus.

Author Contributions

Conceptualization, C.C.S., C.A. and V.H.G.-M.; methodology, C.C.S. and V.H.G.-M.; software, C.C.S.; validation, C.A. and V.H.G.-M.; formal analysis, C.C.S. and V.H.G.-M.; investigation, C.A. and V.H.G.-M.; data curation, C.A.; writing—original draft preparation, C.C.S., C.A. and V.H.G.-M.; writing—review and editing, C.C.S., C.A. and V.H.G.-M.; supervision, V.H.G.-M.; project administration, V.H.G.-M. All authors have read and agreed to the published version of the manuscript.

Funding

This research received no external funding.

Institutional Review Board Statement

Not applicable.

Informed Consent Statement

Not applicable.

Data Availability Statement

Data, R scripts and results are publicly available in the GitHub repository https://github.com/ccsosa/Rattus_urban_macrogenetics.

Acknowledgments

The authors would like to acknowledge Harold Achicanoy for his help in the Random Forest Regression advice. The first author (C.C.S.) acknowledges the OMICAS program for providing research support 712 (Grant ID: FP44842-212-2018 and OMICAS award ID: 792-61187). The third author (V.H.G.-M.) acknowledges the sabbatical year granted by the Universidad del Quindío (Armenia, Colombia), contract 002 of 2022 and the post-doctoral stay carried out at the Institut Cavanilles de Biodiversitat i Biologia Evolutiva—ICBiBE (Valencia, España) with Ferran Palero Pastor. V.H.G.-M. dedicates this work to his mother, who, despite losing her memory over the years, continues to accompany him with her smile.

Conflicts of Interest

The authors declare no conflict of interest.

References

  1. World Bank. Urban Development. Available online: https://www.worldbank.org/en/topic/urbandevelopment/overview (accessed on 3 May 2023).
  2. Cohen, B. Urbanization in developing countries: Current trends, future projections, and key challenges for sustainability. Technol. Soc. 2006, 28, 63–80. [Google Scholar] [CrossRef]
  3. Fusco, N.; Carlen, E.; Munshi-South, J. Urban landscape genetics: Are biologists keeping up with the pace of urbanization? Curr. Landsc. Ecol. Rep. 2021, 6, 35–45. [Google Scholar] [CrossRef]
  4. Pyšek, P.; Hulme, P.E.; Simberloff, D.; Bacher, S.; Blackburn, T.M.; Carlton, J.T.; Dawson, W.; Essl, F.; Foxcroft, L.C.; Genovesi, P.; et al. Scientists’ warning on invasive alien species. Biol. Rev. 2020, 95, 1511–1534. [Google Scholar] [CrossRef] [PubMed]
  5. Banks, P.B.; Smith, H.M. The ecological impacts of commensal species: Black rats, Rattus rattus, at the urban–bushland interface. Wildl. Res. 2015, 42, 86–97. [Google Scholar] [CrossRef]
  6. Combs, M.; Byers, K.A.; Ghersi, B.M.; Blum, M.J.; Caccone, A.; Costa, F.; Himsworth, C.G.; Richardson, J.L.; Munshi-South, J. Urban rat races: Spatial population genomics of brown rats (Rattus norvegicus) compared across multiple cities. Proc. R. Soc. B Biol. Sci. 2018, 285, 20180245. [Google Scholar] [CrossRef] [Green Version]
  7. Doherty, T.S.; Glen, A.S.; Nimmo, D.G.; Ritchie, E.G.; Dickman, C.R. Invasive predators and global biodiversity loss. Proc. Natl. Acad. Sci. USA 2016, 113, 11261–11265. [Google Scholar] [CrossRef]
  8. Godwin, J.; Serr, M.; Barnhill-Dilling, S.K.; Blondel, D.V.; Brown, P.R.; Campbell, K.; Delborne, J.; Lloyd, A.L.; Oh, K.P.; Prowse, T.A.A.; et al. Rodent gene drives for conservation: Opportunities and data needs. Proc. R. Soc. B Biol. Sci. 2019, 286, 20191606. [Google Scholar] [CrossRef] [Green Version]
  9. Blasdell, K.R.; Morand, S.; Laurance, S.G.W.; Doggett, S.L.; Hahs, A.; Trinh, K.; Perera, D.; Firth, C. Rats and the city: Implications of urbanization on zoonotic disease risk in Southeast Asia. Proc. Natl. Acad. Sci. USA 2022, 119, e2112341119. [Google Scholar] [CrossRef]
  10. Morand, S.; Bordes, F.; Chen, H.W.; Claude, J.; Cosson, J.F.; Galan, M.; Czirjak, G.A.; Greenwood, A.D.; Latinne, A.; Michaux, J.; et al. Global parasite and Rattus rodent invasions: The consequences for rodent-borne diseases. Integr. Zool. 2015, 10, 409–423. [Google Scholar] [CrossRef]
  11. Fantle-Lepczyk, J.E.; Haubrock, P.J.; Kramer, A.M.; Cuthbert, R.N.; Turbelin, A.J.; Crystal-Ornelas, R.; Diagne, C.; Courchamp, F. Economic costs of biological invasions in the United States. Sci. Total Environ. 2022, 806, 151318. [Google Scholar] [CrossRef]
  12. Haubrock, P.J.; Turbelin, A.J.; Cuthbert, R.N.; Novoa, A.; Taylor, N.G.; Angulo, E.; Ballesteros-Mejia, L.; Bodey, T.W.; Capinha, C.; Diagne, C.; et al. Economic costs of invasive alien species across Europe. NeoBiota 2021, 67, 153–190. [Google Scholar] [CrossRef]
  13. Rissler, L.J. Union of phylogeography and landscape genetics. Proc. Natl. Acad. Sci. USA 2016, 113, 8079–8086. [Google Scholar] [CrossRef]
  14. Leigh, D.M.; van Rees, C.B.; Millette, K.L.; Breed, M.F.; Schmidt, C.; Bertola, L.D.; Hand, B.K.; Hunter, M.E.; Jensen, E.L.; Kershaw, F.; et al. Opportunities and challenges of macrogenetic studies. Nat. Rev. Genet. 2021, 22, 791–807. [Google Scholar] [CrossRef] [PubMed]
  15. Moher, D.; Stewart, L.; Shekelle, P. All in the family: Systematic reviews, rapid reviews, scoping reviews, realist reviews, and more. Syst. Rev. 2015, 4, 183. [Google Scholar] [CrossRef] [PubMed] [Green Version]
  16. Haddaway, N.R.; Macura, B.; Whaley, P.; Pullin, A.S. ROSES RepOrting standards for Systematic Evidence Syntheses: Pro forma, flow-diagram and descriptive summary of the plan and conduct of environmental systematic reviews and systematic maps. Environ. Evid. 2018, 7, 7. [Google Scholar] [CrossRef]
  17. Sutherland, W.J.; Wordley, C.F. A fresh approach to evidence synthesis. Nature 2018, 558, 364–366. [Google Scholar] [CrossRef] [Green Version]
  18. Moher, D.; Liberati, A.; Tetzlaff, J.; Altman, D.G.; Group, P. Preferred reporting items for systematic reviews and meta-analyses: The PRISMA statement. PLoS Med. 2009, 6, e1000097. [Google Scholar] [CrossRef] [Green Version]
  19. Combs, M.; Puckett, E.E.; Richardson, J.; Mims, D.; Munshi-South, J. Spatial population genomics of the brown rat (Rattus norvegicus) in New York City. Mol. Ecol. 2018, 27, 83–98. [Google Scholar] [CrossRef]
  20. Gardner-Santana, L.C.; Norris, D.E.; Fornadel, C.M.; Hinson, E.R.; Klein, S.L.; Glass, G.E. Commensal ecology, urban landscapes, and their influence on the genetic characteristics of city-dwelling Norway rats (Rattus norvegicus). Mol. Ecol. 2009, 18, 2766–2778. [Google Scholar] [CrossRef] [Green Version]
  21. Kajdacsi, B.; Costa, F.; Hyseni, C.; Porter, F.; Brown, J.; Rodrigues, G.; Farias, H.; Reis, M.G.; Childs, J.E.; Ko, A.I.; et al. Urban population genetics of slum-dwelling rats (Rattus norvegicus) in Salvador, Brazil. Mol. Ecol. 2013, 22, 5056–5070. [Google Scholar] [CrossRef]
  22. Kummu, M.; Taka, M.; Guillaume, J.H.A. Gridded global datasets for Gross Domestic Product and Human Development Index over 1990–2015. Sci. Data 2018, 5, 180004. [Google Scholar] [CrossRef] [PubMed] [Green Version]
  23. Center for International Earth Science Information Network—CIESIN—Columbia University. Gridded Population of the World, Version 4 (GPWv4): Population Density, Revision 11. 2018. Available online: https://sedac.ciesin.columbia.edu/data/collection/gpw-v4/documentation (accessed on 18 May 2023).
  24. Center for International Earth Science Information Network—CIESIN—Columbia University. Global Gridded Relative Deprivation Index (GRDI), Version 1. 2022. Available online: https://sedac.ciesin.columbia.edu/data/set/povmap-grdi-v1 (accessed on 18 May 2023).
  25. Nelson, A.; Weiss, D.J.; van Etten, J.; Cattaneo, A.; McMenomy, T.S.; Koo, J. A suite of global accessibility indicators. Sci. Data 2019, 6, 266. [Google Scholar] [CrossRef] [PubMed] [Green Version]
  26. Guillaumot, C.; Artois, J.; Saucde, T.; Demoustier, L.; Moreau, C.; Elaume, M.; Agera, A.; Danis, B. Broad-scale species distribution models applied to data-poor areas. Prog. Oceanogr. 2019, 175, 198–207. [Google Scholar] [CrossRef] [Green Version]
  27. Schmidt, C.; Hoban, S.; Jetz, W. Conservation Macrogenetics. 2023. Available online: https://ecoevorxiv.org/repository/view/5317/ (accessed on 2 May 2023).
  28. Lack, J.B.; Hamilton, M.J.; Braun, J.K.; Mares, M.A.; van Den Bussche, R.A. Comparative phylogeography of invasive Rattus rattus and Rattus norvegicus in the U.S. reveals distinct colonization histories and dispersal. Biol. Invasions 2013, 15, 1067. [Google Scholar] [CrossRef]
  29. Brouat, C.; Rahelinirina, S.; Loiseau, A.; Rahalison, L.; Rajerison, M.; Laffly, D.; Handschumacher, P.; Duplantier, J.M. Plague circulation and population genetics of the reservoir Rattus rattus: The influence of topographic relief on the distribution of the disease within the Madagascan focus. PLoS Negl. Trop. Dis. 2013, 7, e2266. [Google Scholar] [CrossRef] [Green Version]
  30. Mangombi, J.B.; Brouat, C.; Loiseau, A.; Banga, O.; Leroy, E.M.; Bourgarel, M.; Duplantier, J.M. Urban population genetics of the invasive black rats in Franceville, Gabon. J. Zool. 2016, 299, 1–8. [Google Scholar] [CrossRef]
  31. Berthier, K.; Garba, M.; Leblois, R.; Navascues, M.; Tatard, C.; Gauthier, P.; Gagare, S.; Piry, S.; Brouat, C.; Dalecky, A.; et al. Black rat invasion of inland Sahel: Insights from interviews and population genetics in south-western Niger. Biol. J. Linn. Soc. 2016, 119, 748–765. [Google Scholar] [CrossRef] [Green Version]
  32. Millette, K.L.; Fugère, V.; Debyser, C.; Greiner, A.; Chain, F.J.J.; Gonzalez, A. No consistent effects of humans on animal genetic diversity worldwide. Ecol. Lett. 2020, 23, 55–67. [Google Scholar] [CrossRef]
  33. Johnson, M.T.; Munshi-South, J. Evolution of life in urban environments. Science 2017, 358, eaam8327. [Google Scholar] [CrossRef] [Green Version]
  34. Tucker, M.A.; Böhning-Gaese, K.; Fagan, W.F.; Fryxell, J.M.; van Moorter, B.; Alberts, S.C.; Ali, A.H.; Allen, A.M.; Attias, N.; Avgar, T.; et al. Moving in the Anthropocene: Global reductions in terrestrial mammalian movements. Science 2018, 359, 466–469. [Google Scholar] [CrossRef] [Green Version]
  35. Baig, M.; Sameera, F.; Atkulwar, A.; Searle, J. Genomic analysis reveals subdivision of black rats (Rattus rattus) in India, origin of the worldwide species spread. Genes 2022, 13, 267. [Google Scholar] [CrossRef] [PubMed]
  36. Konečný, A.; Estoup, A.; Duplantier, J.-M.; Bryja, J.; Bâ, K.; Galan, M.; Tatard, C.; Cosson, J.-F. Invasion genetics of the introduced black rat (Rattus rattus) in Senegal, West Africa. Mol. Ecol. 2013, 22, 286–300. [Google Scholar] [CrossRef] [PubMed]
  37. Puckett, E.E.; Park, J.; Combs, M.; Blum, M.J.; Bryant, J.E.; Caccone, A.; Costa, F.; Deinum, E.E.; Esther, A.; Himsworth, C.G.; et al. Global population divergence and admixture of the brown rat (Rattus norvegicus). Proc. R. Soc. B Biol. Sci. 2016, 283, 20161762. [Google Scholar] [CrossRef]
  38. Haniza, M.Z.H.; Adams, S.; Jones, E.P.; MacNicoll, A.; Mallon, E.B.; Smith, R.H.; Lambert, M.S. Large-scale structure of brown rat (Rattus norvegicus) populations in England: Effects on rodenticide resistance. PeerJ 2015, 3, e1458. [Google Scholar] [CrossRef] [PubMed] [Green Version]
  39. Conroy, C.J.; Rowe, K.C.; Rowe, K.M.C.; Kamath, P.L.; Aplin, K.P.; Hui, L.; James, D.K.; Moritz, C.; Patton, J.L. Cryptic genetic diversity in Rattus of the San Francisco Bay region, California. Biol. Invasions 2013, 15, 741–758. [Google Scholar] [CrossRef]
  40. Cheylan, G. Les mammifères des îles de Provence et de Méditerranée occidentale: Une exemple du peuplement insulaire non équilibré? Rev. D’ecologie 1984, 39, 37–54. [Google Scholar] [CrossRef]
  41. Sjodin, B.M.F.; Irvine, R.L.; Ford, A.T.; Howald, G.R.; Russello, M.A. Rattus population genomics across the Haida Gwaii archipelago provides a framework for guiding invasive species management. Evol. Appl. 2020, 13, 889–904. [Google Scholar] [CrossRef] [Green Version]
  42. Badou, S.; Gauthier, P.; Houéménou, G.; Loiseau, A.; Dossou, J.; Etougbétché, J.; Houéménou, H.; Agbangla, C.; Brouat, C.; Dobigny, G. Population genetic structure of blacks rats in an urban environment: A case study in Cotonou, Benin. Hystrix It. J. Mammal 2021, 32, 1825–5272. [Google Scholar] [CrossRef]
  43. Varudkar, A.; Ramakrishnan, U. Commensalism facilitates gene flow in mountains: A comparison between two Rattus species. Heredity 2015, 115, 253–261. [Google Scholar] [CrossRef] [Green Version]
  44. Willows-Munro, S.; Dowler, R.; Jarcho, M.R.; Phillips, R.B.; Snell, H.L.; Wilbert, T.R.; Edwards, C.W. Cryptic diversity in black rats Rattus rattus of the Galápagos islands, Ecuador. Ecol. Evol. 2016, 6, 3721–3733. [Google Scholar] [CrossRef] [Green Version]
  45. Chacón-Vargas, K.; García-Merchán, V.H.; Sanín, M.J. From keystone species to conservation: Conservation genetics of wax palm Ceroxylon quindiuense in the largest wild populations of Colombia and selected neighboring ex situ plant collections. Biodivers. Conserv. 2020, 29, 283–302. [Google Scholar] [CrossRef]
  46. García-Merchán, V.H.; Arenas-Calle, C.; Sosa-Arango, C.C.; Castaño-Castro, P.; Chacón-Vargas, K. Conservation genetics in the neotropical carnivorous mammals: A systematic review. In Molecular Ecology and Conservation Genetics of Neotropical Mammals; Nardelli, M., Túnez, J.I., Eds.; Springer Nature: Basel, Switzerland, 2021; pp. 277–295. [Google Scholar]
  47. MacroPopGen. MacroPopGen Database: Geo-Referenced Population-Specific Microsatellite Data across the American Continents. Available online: https://figshare.com/articles/dataset/MacroPopGen_Database_Geo-referenced_population-specific_microsatellite_data_across_the_American_continents/7207514/1 (accessed on 14 May 2023).
  48. Abdelkrim, J.; Pascal, M.; Samadi, S. Island colonization and founder effects: The invasion of the Guadeloupe islands by ship rats (Rattus rattus). Mol. Ecol. 2005, 14, 2923–2931. [Google Scholar] [CrossRef] [PubMed]
  49. Abdelkrim, J.; Pascal, M.; Calmet, C.; Samadi, S. Importance of Assessing Population Genetic Structure before Eradication of Invasive Species: Examples from Insular Norway Rat Populations. Conserv. Biol. 2005, 19, 1509–1518. [Google Scholar] [CrossRef]
  50. Abdelkrim, J.; Pascal, M.; Samadi, S. Genetic structure and functioning of alien ship rat populations from a Corsican micro-insular complex. Biol. Invasions 2008, 11, 473–482. [Google Scholar] [CrossRef]
  51. Abdelkrim, J.; Byrom, A.E.; Gemmell, N.J. Fine-scale genetic structure of mainland invasive Rattus rattus populations: Implications for restoration of forested conservation areas in New Zealand. Conserv. Genet. 2010, 11, 1953–1964. [Google Scholar] [CrossRef]
  52. Calmet, C.; Pascal, M.; Samadi, S. Is it worth eradicating the invasive pest Rattus norvegicus from Molène archipelago? Genetic structure as a decision-making tool. Biodivers. Conserv. 2001, 10, 911–928. [Google Scholar] [CrossRef]
  53. Chen, Y.; Zhao, L.; Teng, H.; Shi, C.; Liu, Q.; Zhang, J.; Zhang, Y. Population genomics reveal rapid genetic differentiation in a recently invasive population of Rattus norvegicus. Front. Zool. 2021, 18, 1–10. [Google Scholar] [CrossRef]
  54. Costa, F.; Richardson, J.L.; Dion, K.; Mariani, C.; Pertile, A.C.; Burak, M.K.; Childs, J.E.; Ko, A.I.; Caccone, A. Multiple Paternity in the Norway Rat, Rattus norvegicus, from Urban Slums in Salvador, Brazil. J. Hered. 2016, 107, 181–186. [Google Scholar] [CrossRef]
  55. Cramer, D.V.; Chakravarti, A.; Arenas, O.; Humprieres, J.; Mowery, P.A. Genetic Diversity within and between Natural Populations of Rattus norvegicus. J. Hered. 1988, 79, 319–324. [Google Scholar] [CrossRef]
  56. Desvars-Larrive, A.; Pascal, M.; Gasqui, P.; Cosson, J.-F.; Benoît, E.; Lattard, V.; Crespin, L.; Lorvelec, O.; Pisanu, B.; Teynié, A.; et al. Population genetics, community of parasites, and resistance to rodenticides in an urban brown rat (Rattus norvegicus) population. PLoS ONE 2017, 12, e0184015. [Google Scholar] [CrossRef] [Green Version]
  57. Gilabert, A.; Loiseau, A.; Duplantier, J.-M.; Rahelinirina, S.; Rahalison, L.; Chanteau, S.; Brouat, C. Genetic structure of black rat populations in a rural plague focus in Madagascar. Can. J. Zool. 2007, 85, 965–972. [Google Scholar] [CrossRef]
  58. Villafañe, I.E.G.; Guzmán, N.; Ortiz, N.; Gonzalez-Ittig, R.; León, V.A.; Busch, M. Connectivity among Norway rat subpopulations (Rattus norvegicus) at poultry farms in Exaltación de la Cruz, Buenos Aires, Argentina. Mastozoología Neotrop. 2019, 26, 359–367. [Google Scholar] [CrossRef]
  59. Natali, C.; Ciofi, C.; Sposimo, P.; Fratini, S. Population genetic analysis of invasive black rats: Defining eradication units in the Tuscan Archipelago National Park. Hystrix 2018, 29, 67–73. [Google Scholar] [CrossRef]
  60. Jing, M.; Chen, Y.; Yao, K.; Wang, Y.; Huang, L. Comparative phylogeography of two commensal rat species (Rattus tanezumi and Rattus norvegicus) in China: Insights from mitochondrial DNA, microsatellite, and 2b-RAD data. Ecol. Evol. 2022, 12, e9409. [Google Scholar] [CrossRef]
  61. Piertney, S.B.; Black, A.; Watt, L.; Christie, D.; Poncet, S.; Collins, M.A. Resolving patterns of population genetic and phylogeographic structure to inform control and eradication initiatives for brown rats Rattus norvegicus on South Georgia. J. Appl. Ecol. 2016, 53, 332–339. [Google Scholar] [CrossRef]
  62. Puckett, E.E.; Micci-Smith, O.; Munshi-South, J. Genomic analyses identify multiple Asian origins and deeply diverged mitochondrial clades in inbred brown rats ( Rattus norvegicus ). Evol. Appl. 2017, 11, 718–726. [Google Scholar] [CrossRef]
  63. Puckett, E.E.; Magnussen, E.; Khlyap, L.A.; Strand, T.M.; Lundkvist, Å.; Munshi-South, J. Genomic analyses reveal three independent introductions of the invasive brown rat (Rattus norvegicus) to the Faroe Islands. Heredity 2019, 124, 15–27. [Google Scholar] [CrossRef]
  64. Tabak, M.A.; Poncet, S.; Passfield, K.; Carling, M.D.; del Rio, C.M. The relationship between distance and genetic similarity among invasive rat populations in the Falkland Islands. Conserv. Genet. 2014, 16, 125–135. [Google Scholar] [CrossRef]
  65. Teng, H.; Zhang, Y.; Shi, C.; Mao, F.; Cai, W.; Lu, L.; Zhao, F.; Sun, Z.; Zhang, J. Population Genomics Reveals Speciation and Introgression between Brown Norway Rats and Their Sibling Species. Mol. Biol. Evol. 2017, 34, 2214–2228. [Google Scholar] [CrossRef] [Green Version]
Figure 1. PRISMA flow diagram of literature search and selection for articles included in the systematic review. The asterisk (*) was used to extend the Boolean search to include various word forms and endings (e.g., “phylogeography”, “phylogeographical”). Adapted from [18].
Genes 14 01442 g001
Figure 2. Map with the distribution of sampling points used in the 35 studies considered. Red dots: 141 records of Rattus rattus; blue dots: 234 records of R. norvegicus. Background: the deprivation index displayed as poverty proxy.
Genes 14 01442 g002
Figure 3. Map with the distribution of observed heterozygosity for Rattus rattus, considering the information of 35 studies analyzed. Blue dots: Sampling areas considered.
Genes 14 01442 g003
Figure 4. Map with the distribution of observed heterozygosity for Rattus norvegicus, considering the information of 35 studies analyzed. Blue dots: Sampling areas considered.
Genes 14 01442 g004
Figure 5. Random forest regression between observed vs. predicted heterozygosity values including regression lines, R² and p values per species. R. norvegicus (blue); R. rattus (red).
Genes 14 01442 g005
Figure 6. Principal component analysis of predictors of genetic diversity for R. rattus and R. norvegicus, considering the information of 35 studies analyzed. R. norvegicus island records (light blue). R. norvegicus mainland records (blue). R. rattus island records (red). R. rattus mainland records (light brown). The acronyms of the predictors are as described in Table 1.
Genes 14 01442 g006
Table 1. Pearson correlation values found for the five predictors used in the random forest regression for Rattus norvegicus’ and Rattus rattus’ observed heterozygosity. Values in parentheses are the p-values of the correlation tests.
PredictorR. norvegicusR. rattus
GDP_per_capita_2015−0.064 (0.567)−0.108 (0.417)
gpw_v4_population_density_20200.385 (0)−0.236 (0.072)
povmap.grdi.v10.162 (0.143)0.3 (0.021)
travel_time_to_cities_12_MOD−0.004 (0.97)0.286 (0.028)
travel_time_to_ports_5_MOD−0.058 (0.604)−0.588 (0)
GDP_per_capita_2015 = Gross Domestic Product per capita for the year 2015; gpw_v4_population_density_2020 = Population Density, v4.11 for the year 2020; povmap.grdi.v1 = Global Gridded Relative Deprivation Index (GRDI), v1 for the year 2020; travel_time_to_cities_12_MOD = travel time in minutes to the nearest urban area; travel_time_to_ports_5_MOD = travel time in minutes to ports.
Table 2. Gini index values obtained for R. norvegicus and R. rattus using random forest regression.
PredictorR. norvegicusR. rattus
GDP_per_capita_20150.7430.697
gpw_v4_population_density_202010.741
povmap.grdi.v10.7200.363
travel_time_to_cities_12_MOD0.2050.595
travel_time_to_ports_5_MOD0.5651
The acronyms of the predictors are as described in Table 1.
Disclaimer/Publisher’s Note: The statements, opinions and data contained in all publications are solely those of the individual author(s) and contributor(s) and not of MDPI and/or the editor(s). MDPI and/or the editor(s) disclaim responsibility for any injury to people or property resulting from any ideas, methods, instructions or products referred to in the content.

