Article

Comparative Mitochondrial Genomes between the Genera Amiota and Phortica (Diptera: Drosophilidae) with Evolutionary Insights into D-Loop Sequence Variability

1
Department of Entomology, South China Agricultural University, 483 Wushan-Lu, Guangzhou 510642, China
2
Guangdong Provincial Key Laboratory of Insect Developmental Biology and Applied Technology, Institute of Insect Science and Technology, School of Life Sciences, South China Normal University, Guangzhou 510631, China
*
Author to whom correspondence should be addressed.
Genes 2023, 14(6), 1240; https://doi.org/10.3390/genes14061240
Submission received: 2 May 2023 / Revised: 29 May 2023 / Accepted: 2 June 2023 / Published: 9 June 2023

Abstract

:
To address the limited number of mitochondrial genomes (mitogenomes) in the subfamily Steganinae (Diptera: Drosophilidae), we assembled 12 complete mitogenomes for six representative species in the genus Amiota and six representative species in the genus Phortica. We performed a series of comparative and phylogenetic analyses for these 12 Steganinae mitogenomes, paying special attention to the commonalities and differences in the D-loop sequences. Primarily determined by the lengths of the D-loop regions, the sizes of the Amiota and Phortica mitogenomes ranged from 16,143–16,803 bp and 15,933–16,290 bp, respectively. Our results indicated that the sizes of genes and intergenic nucleotides (IGNs), codon usage and amino acid usage, compositional skewness levels, evolutionary rates of protein-coding genes (PCGs), and D-loop sequence variability all showed unambiguous genus-specific characteristics and provided novel insights into the evolutionary implications between and within Amiota and Phortica. Most of the consensus motifs were found downstream of the D-loop regions, and some of them showed distinct genus-specific patterns. In addition, the D-loop sequences were phylogenetically informative as the data sets of PCGs and/or rRNAs, especially within the genus Phortica.

1. Introduction

As the secondary genome in eukaryotes, the mitochondrial genome (mitogenome) is far from being independent of the nuclear genome and the rest of the cell [1]. The mitogenome encodes key parts of the oxidative phosphorylation complexes and is of vital importance for cellular fitness and organismal health [2,3]. Recently, we have gained an in-depth understanding of the mammalian mitochondrial transcriptional machinery and its relevance in cancer, inherited genetic disorders, inflammation, and neurodegenerative diseases [4,5]. The mitogenome and the nuclear genome adjust with respect to each other and develop corresponding genetic polymorphisms during the course of evolution [1,6]. Metazoan mitogenomes have been widely used for species identification, population genetics, comparative genomics, and phylogenetic studies in the past decade [7,8,9,10] due to their well-known advantages in availability and practicality [11,12].
In general, a typical mitogenome is a circular, double-stranded DNA molecule that is 14–20 kb long and contains 13 protein-coding genes (PCGs), 22 transfer RNA (tRNA) genes, two ribosomal RNA (rRNA) genes, and an A + T-rich, noncoding displacement loop (D-loop) region (also known as the control region) [7,13] relating to the control of mitochondrial DNA (mtDNA) gene transcription and mitochondrial replication [5,14]. As the most variable region in the mitogenome, the D-loop region contains the origin of replication for the majority strand (J-strand), and altered methylation and hydroxymethylation levels in the mammalian D-loop region have been associated with cancer, aging, metabolic disorders, cardiovascular diseases, and neurodegenerative diseases [15,16,17,18,19]. However, the genus-specific characteristics and evolutionary implications of D-loop region sequence variability have not been fully investigated and assessed.
The Drosophilinae and Steganinae subfamilies, which include more than 3500 and 1100 species worldwide, respectively [20], form the family Drosophilidae (pomace flies or small fruit flies). The Steganinae subfamily is diverse in its geographical distribution, morphology, and habit. Amiota Loew, 1862 [21] and Phortica Schiner (1862) [22] are currently the fourth and third largest genera in the Steganinae, respectively. Species in these two genera are mostly distributed in forests and share the common behavior of hovering in front of mammalian eyes or shiny objects. Some species are medically significant due to being the intermediate hosts of the Oriental eye worm, Thelazia callipaeda (Railliet & Henry) (Rhabditida: Thelaziidae), and therefore the epidemiologic factors for thelaziasis. Phortica was regarded as a subgenus of Amiota by Wheeler in 1952 [23] and remained that way for more than half a century until Máca recovered its generic rank in 2003 [24]. The most recent molecular phylogenetic studies confirmed the monophyly of the Amiota and the Phortica [25,26]. However, most of these studies were performed based on only one or three molecular genetic markers, which is not enough for the results to be considered convincing. In addition, the Steganinae is poorly studied in almost every field except taxonomy [27,28]. There is only one complete Steganinae mitogenome of Phortica (Phortica) variegata (Fallén) available in GenBank thus far, which is inadequate based on the extremely large number of taxa within this subfamily.
To address the limited number of Steganinae mitogenomes, we assembled six representative Amiota species and six representative Phortica species based on whole-genome sequencing data. These newly accessible mitogenomes enabled us to perform the first comparative analysis of the Steganinae, with an emphasis on the commonalities and differences between the Amiota and Phortica mitogenomes.

2. Materials and Methods

2.1. Specimen Collection and DNA Extraction

This study is based on thousands of Steganinae adult specimens collected at several sites in China over the last decade. We collected the specimens by net-sweeping around human eyes or along tree trunks in forests. All specimens were immediately preserved in 75% alcohol, transferred to −20 °C, and identified by the authors based on morphological characteristics. We selected the specimens of six representative Amiota species from five species groups (one ungrouped species) and five representative Phorita species belonging to three subgenera (Table 1) for further total DNA extraction, library construction, and whole-genome sequencing. The total DNA of each species was extracted from a complete individual using the TIANamp Genomic DNA Kit (#DP304, Tiangen Biotech., Beijing, China) according to the manufacturer’s protocol.

2.2. Library Construction and Sequencing

Berry Genomics (Beijing, China) carried out the construction of whole-genome sequencing libraries and the subsequent sequencing. Briefly, the total DNA samples were sonicated and split into random fragments by a Bioruptor® Pico (Diagenode, Belgium), and fragments of ~350 bp were selected for library construction using the Illumina® DNA Prep, (M) Tagmentation kit (#20060059, Illumina, CA, USA) for adaptor ligation and PCR amplification with index sequences. The 11 constructed libraries were loaded and sequenced with a 2 × 150 bp paired-end (PE150) run on a NovaSeq 6000 platform (Illumina) after quality control.

2.3. Mitogenome Assembly and Annotation

Including the DNA sequencing data of a Nearctic Phortica species, P. (P.) variegata, available from the Sequence Read Archive (SRA) (accession number: SRR826812) (Table 1), we assembled or reassembled a total of 12 mitogenomes (six Amiota + six Phortica species) based on the reads from the raw sequencing data that contained mitogenome fragments. In our case, approximately 1–2% of reads were mitogenome-derived, which is sufficient to assemble a complete mitogenome in most cases. Based on the overlap-layout-consensus (OLC) approach, we manually assembled each mitogenome using Geneious Prime v2020.0.5 [29], with multiple mapping iterations with suitable mismatch rates to either a reference mitogenome (the first mapping) or the gradually lengthening mitochondrial sequence itself (the other mapping iterations). A complete mitogenome was obtained once the two ends of the sequence highly overlapped with each other and could no longer be lengthened. All mitogenome sequences were subjected to Basic Local Alignment Search Tool (BLAST) [30] comparisons to ensure the correct taxonomic identification results.
We primarily ascertained the rough boundary of each mitochondrial gene using the MITOS2 Web Server [31]. Accurate boundaries of PCGs and rRNAs were determined by aligning with the reference mitogenome of D. melanogaster (NC024511) using MEGA v11.0.13 [32]. Locations of mitochondrial tRNAs were identified using the tRNAscan-SE Search Server v2.0 [33].

2.4. Mitogenome Analyses

We regarded A. femorata and P. (P.) variegata as the representative species of each genus and depicted the graphical maps of these two mitogenomes using the Proksee server [34]. Nucleotide composition and codon usage of the PCGs were calculated in MEGA. Compositional skewness levels were estimated in terms of the following formulas: AT-skew = (A − T)/(A + T) and GC-skew = (G − C)/(G + C) [35]. We performed PCAs based on the gene (Table S1) sizes, the IGN sizes (Table S2), the RSCU values (Table S3), and the CDspT values (Table S4) of the 12 mitogenomes using the built-in R stats package v4.0.3 [36]. The RSCU values were displayed in a heatmap generated by the R package pheatmap v1.0.12 [37]. The rates of Ka and Ks of each PCG within the Amiota or Phortica were calculated by the “Compute Pairwise Distances” module in MEGA and visualized using the R package ggplot2 v3.3.3 [38]. We performed de novo motif discovery on the 12 D-loop sequences using the “MEME” module in MEME Suite v5.4.1 [39] with the main parameters “-dna -mod zoops-nmotifs 20-minw 10-maxw 50-objfun classic-markov_order 0”.

2.5. Phylogenetic Analyses

To rigorously test the monophyly of Steganinae, a total of 14 complete drosophilid mitogenomes were included in subsequent phylogenetic analyses, including the 12 assembled Steganinae mitogenomes and two Drosophilinae mitogenomes [D. melanogaster (NC024511) and Zaprionus indianus Gupta (MK659852)] as outgroup taxa. We performed phylogenetic analyses on the following three data sets of mitogenomes: (1) nucleotides of concatenated 13 PCGs and two rRNAs; (2) amino acids of concatenated 13 PCGs; and (3) nucleotides of the D-loop regions. The three data sets were aligned using MAFFT v7.490 [40] with the L-INS-I algorithm (––localpair ––maxiterate 1000). For the concatenated data sets, we used PartitionFinder v2.1 [41] to search the best-fit partitioning schemes and substitution models based on a “greedy” algorithm and the corrected Akaike information criterion (AIC) scores. Nucleotides of the PCGs were partitioned by codon positions, whereas rRNAs and amino acids of the PCGs were partitioned by genes. We performed the BI using MrBayes v3.2.6 [42], which ran two independent sets of Markov chains, each with one cold and three heated chains for a total of 10 million generations, sampling every 1000 generations. Chain convergence was measured by the standard deviation of split frequencies < 0.01 in MrBayes and the effective sample sizes (ESSs) ≥ 200 in Tracer v1.7.1 [43]. The consensus tree from each BI run was generated after 25% of the trees had been discarded as a burn-in. ML analyses were conducted using IQ-TREE v1.6.12 [44,45]. UBPs for the majority-rule consensus tree in each ML analysis were calculated with 1000 replicates [46]. All resulting trees were visualized using FigTree v1.4.3 [47] with adjustable settings.

3. Results and Discussion

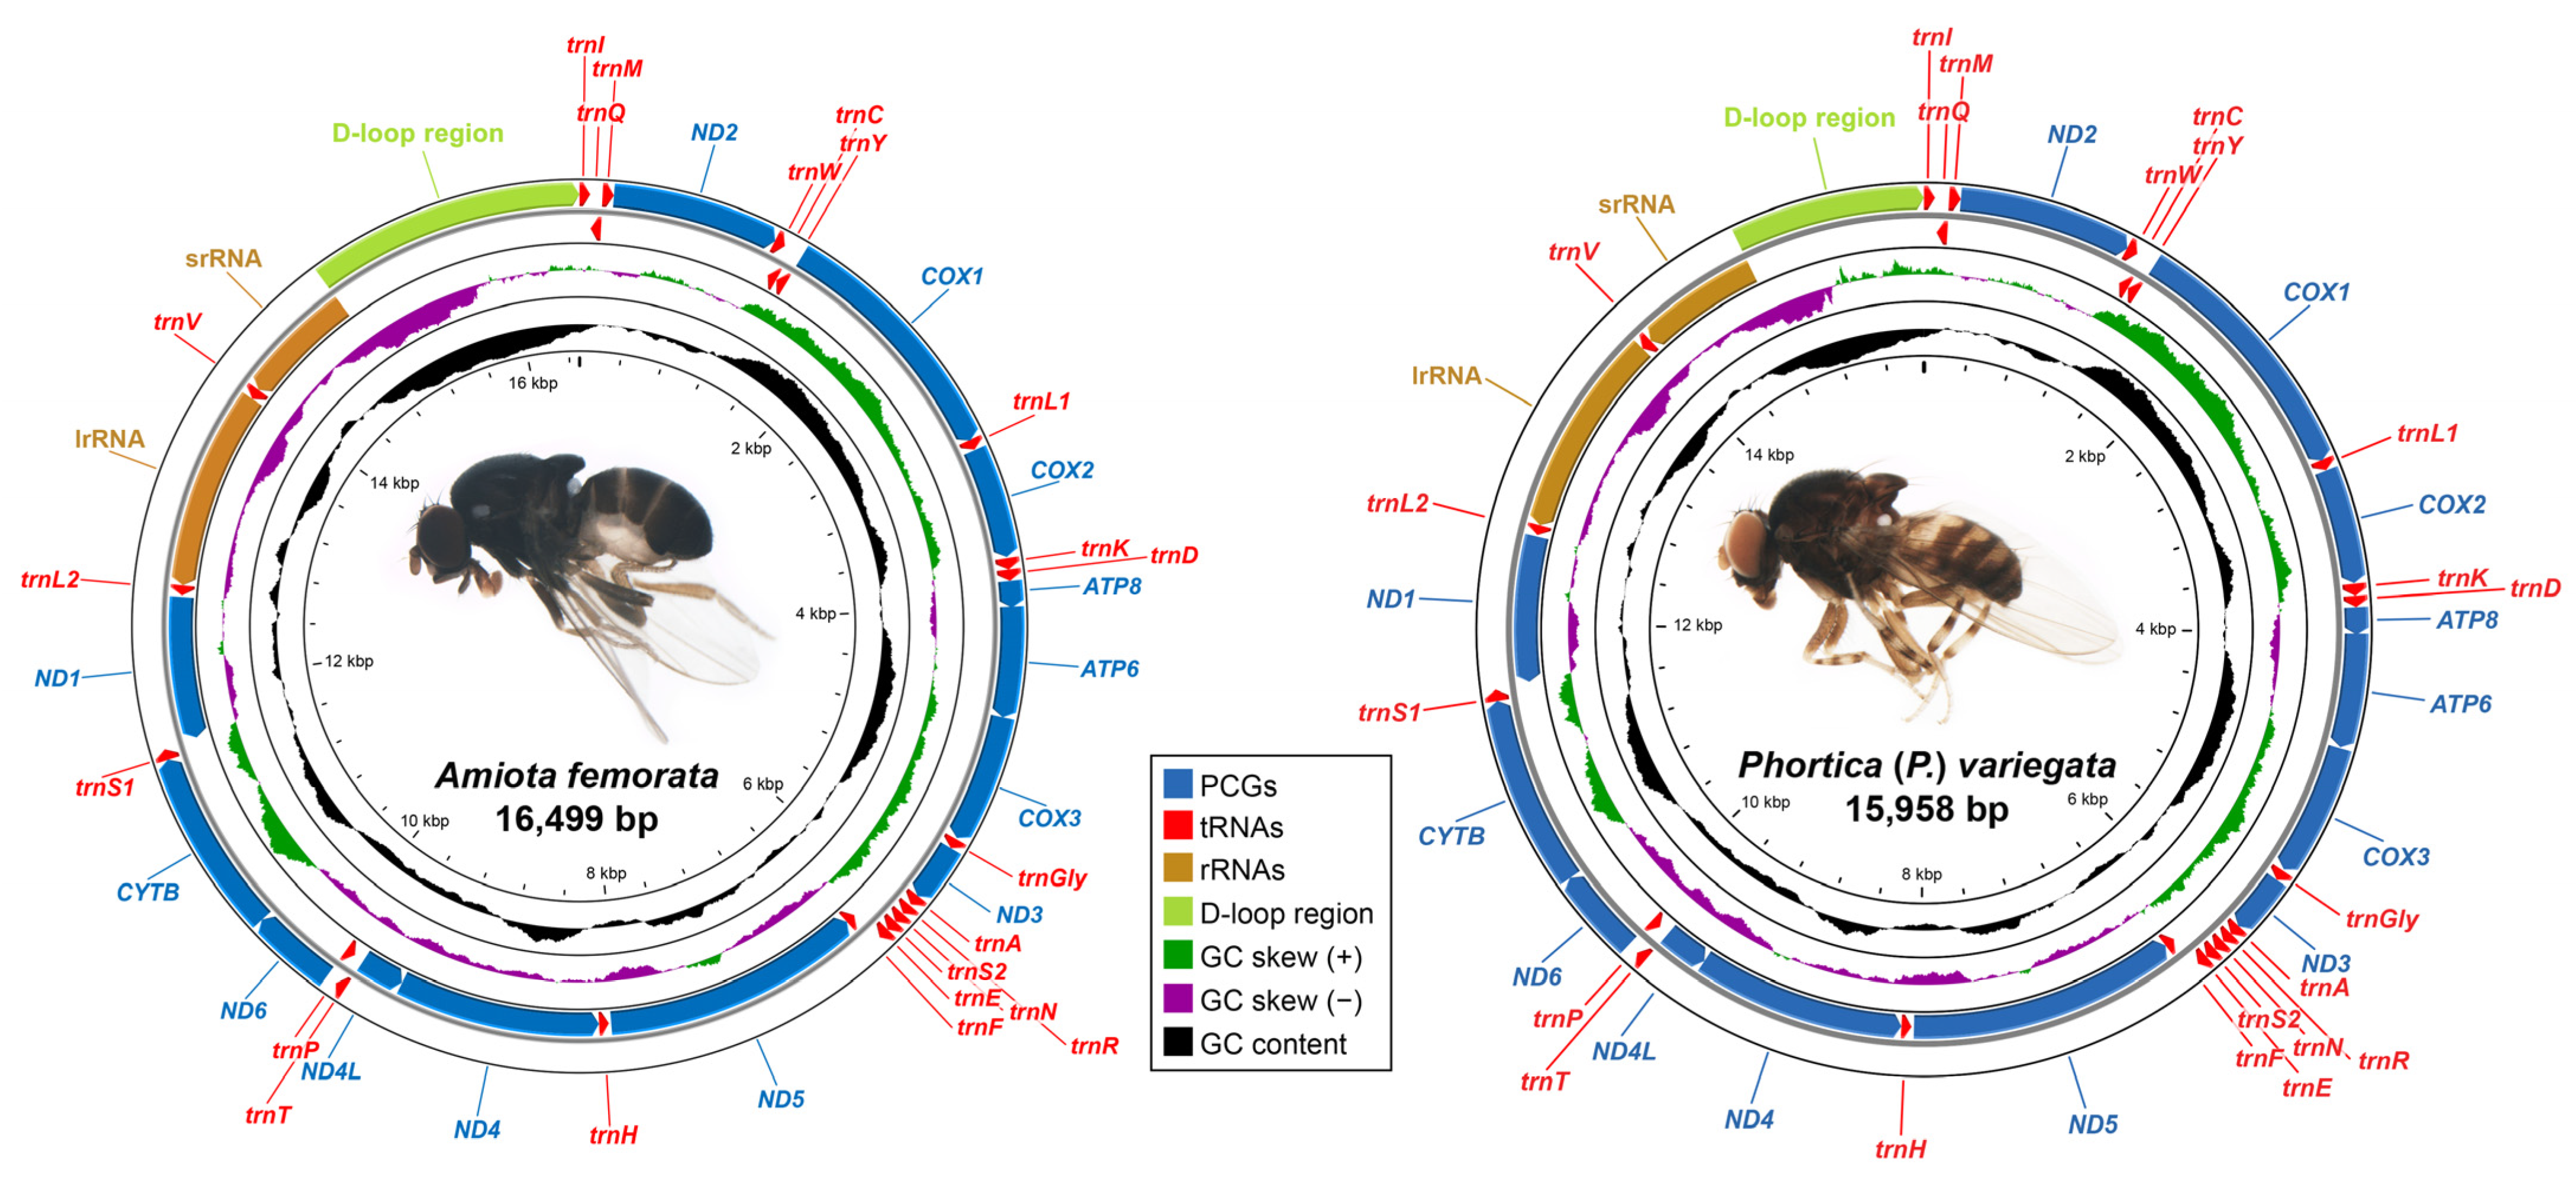
3.1. Mitogenome Organizations and Base Compositions

In this study, we assembled 12 mitogenomes first for the Steganinae, including Amiota dentata Okada, Amiota femorata Chen & Takamori, Amiota nagatai Okada, Amiota setosa Zhang & Chen, Amiota spinifemorata Li & Chen, Amiota yifengi Zhang & Chen, Phortica (Ashima) longipenis Chen & Gao, Phortica (Ashima) tanabei Chen & Toda, Phortica (Phortica) huazhii Cheng & Chen, Phortica (Phortica) pseudogigas Zhang & Gan, P. (P.) variegata, and Phortica (Shangrila) hani Zhang & Shi (Table 1). They were all closed-circular, double-stranded DNA molecules, and therefore complete mitogenomes. Represented by the representative Amiota (A. femorata) and Portica species (P. (P.) variegata), all 12 Steganinae mitogenomes contained the typical set of 37 genes (13 PCGs, 22 tRNAs, and two rRNAs) and had an expected D-loop region located between srRNA and trnI (Figure 1), which was consistent with most metazoan mitogenomes [8,11,12]. Nine of the 13 PCGs and 14 of the 22 tRNAs were encoded by the J-strand, and the remaining 12 genes were encoded by the minority strand (N-strand) (Figure 1 and Table 2). In addition, the gene arrangements of these 12 Steganinae mitogenomes were highly conserved and identical to that of Drosophila (Sophophora) yakuba Burla (Figure 1 and Table 2), which is one of the most common gene arrangement types among arthropod mitogenomes [48].
The lengths of the six Amiota mitogenomes ranged from 16,143 bp in A. spinifemorata to 16,803 bp in A. setosa, whereas the six Phortica mitogenomes ranged from 15,933 bp in P. (A.) tanabei to 16,290 bp in P. (A.) longipenis (Table 1 and Table 2). All of them were within the size range of known complete Drosophilinae mitogenomes from 14,874 bp in Drosophila (Hawaiian Drosophila) grimshawi Oldenberg (BK006341) to 19,951 bp in Drosophila (Sophophora) melanogaster Meigen (CM010568). In the principal component analysis (PCA) based on the sizes of genes, PC1 and PC2 explained 45.94% of the total variance (Figure 2A). The Amiota species could be separated from the Phortica species. Furthermore, the three subgenera of the Phortica also showed distinct patterns at the subgenus level.
The variation of gene intergenic nucleotides (IGNs) is another important characteristic of the mitogenome. For instance, both the A. femorata and P. (P.) variegata mitogenomes contained a total of 121 bp gene overlaps or IGNs ranging from −1 to 18 bp, whereas they were located in 21 and 19 pairs of adjacent genes, respectively (Table 2). The longest IGNs of 18 bp in both the A. femorata and P. (P.) variegata mitogenomes were located between trnE and trnF. However, we found another 18 bp IGNs between trnS1 and ND1 in the latter (Table 2). According to the PCA based on the sizes of IGNs, PC1 and PC2 explained 50.17% of the total variance (Figure 2B). The Amiota species also remained some distance away from the Phortica species. This PCA showed the specific size patterns of IGNs within the Amiota and Phortica mitogenomes. In addition, A. nagatai had four pairs of adjacent tRNAs with 32–49 bp IGNs, and P. (A.) longipenis had 100 bp IGNs between trnI and trnQ. The generation of these long IGNs between tRNAs might be related to the evolutionary divergence of these species.
The base compositions of the 12 Steganinae mitogenomes were A = 39.1–40.7%, T = 38.1–40.3%, G = 8.1–9.5%, and C = 11.2–13.6% (Table S5). Among the whole mitogenome, PCGs (and each codon position), tRNAs, rRNAs, and D-loop regions, the Amiota mitogenomes generally had a higher A + T content, whereas the Phortica mitogenomes generally had a higher G + C content (Table S5). The J-strands and the D-loop regions generally had positive AT-skews and negative GC-skews with the exception of A. nagatai, indicating no reversal of strand asymmetry in these Steganinae mitogenomes. Both the PCGs and the 1st codon positions had negative AT- and GC-skews, but all the 2nd codon positions had negative AT-skews and positive GC-skews (Table S5 and Figure 3). By establishing the linear relationships between AT-skew and GC-skew in the Amiota and Phortica mitogenomes (Table S5 and Figure 3), we found the following: (1) the AT- and GC-skews were relatively correlated only for the J-strands (R2 = 0.519–0.884, p = 0.005–0.106) (Figure 3A); (2) the linear relationships between the Amiota and Phortica were relatively less overlapped in the 2nd (Figure 3D) and 3rd codon positions (Figure 3E), tRNAs (Figure 3G), and D-loop regions (Figure 3H); and (3) the compositional skewness levels in the 1st codon positions (Figure 3C) and rRNAs (Figure 3G) were relatively specific for the Amiota and the Phortica (reflected by less overlap). Altogether, our results showed unambiguous genus-specific characteristics between and within the Amiota and Phortica from mitochondrial base composition to skewness.

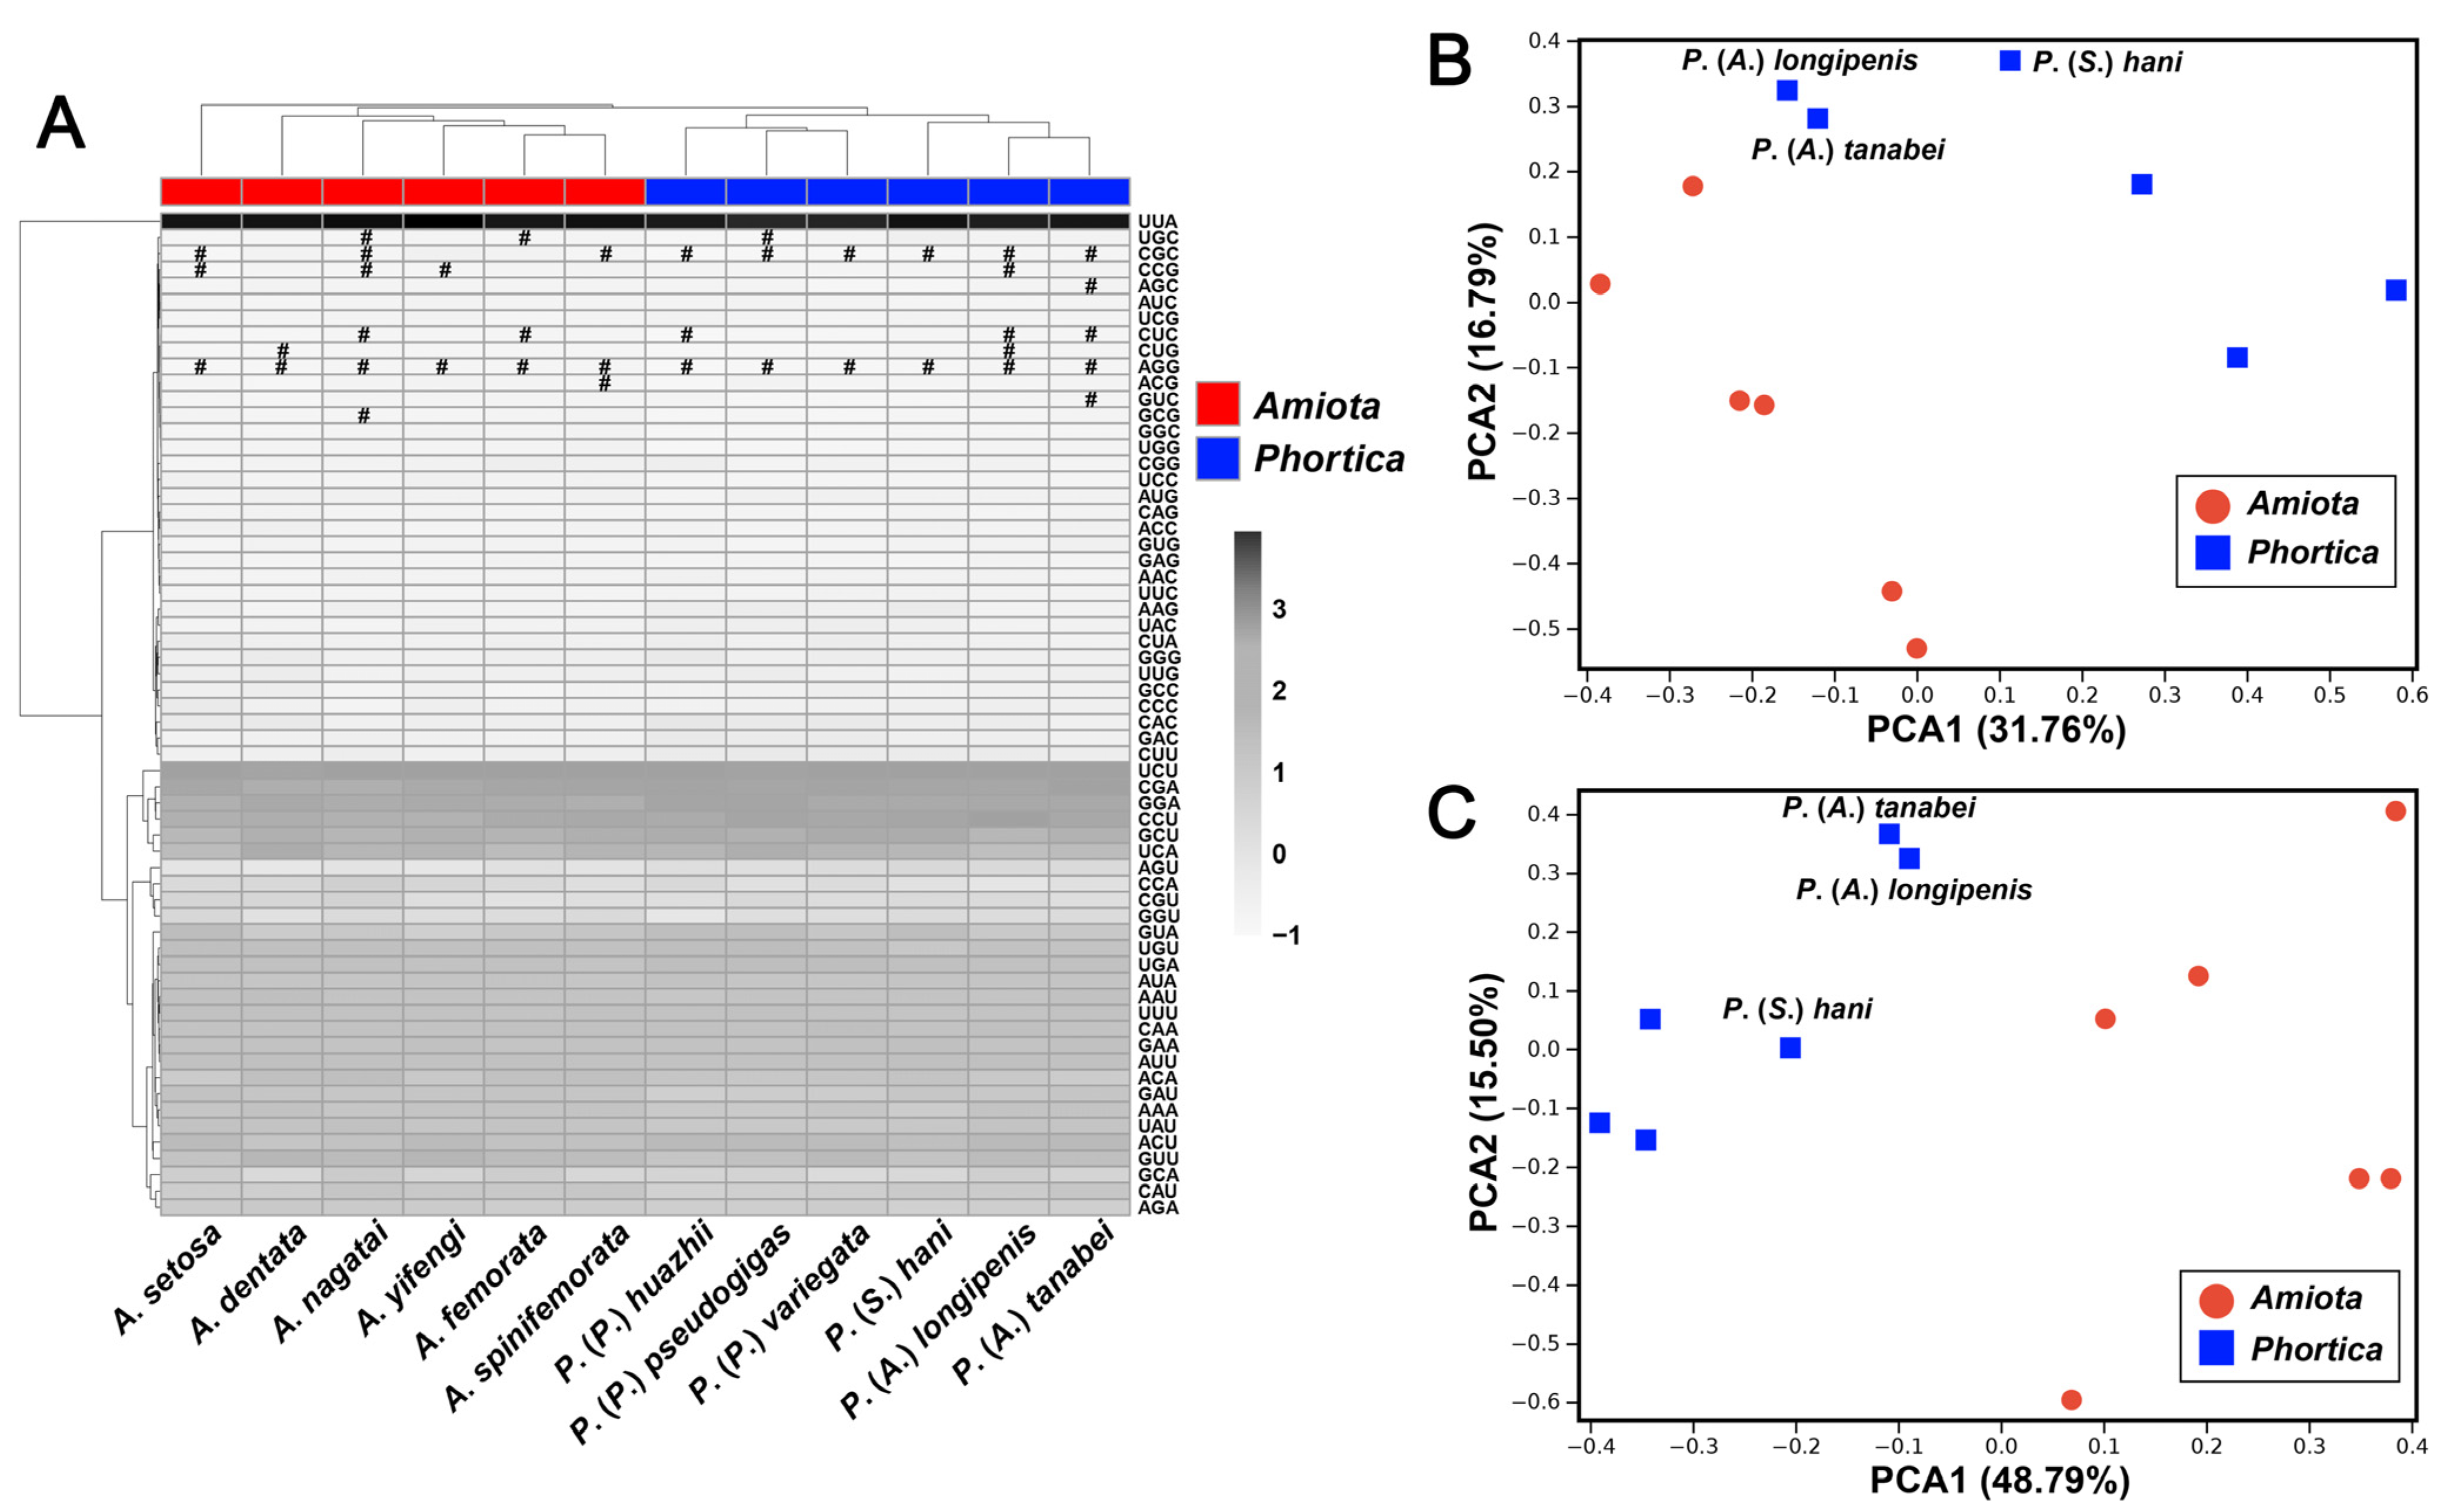
3.2. Protein-Coding Genes

Accounting for 66.4–70.2% of the entire Steganinae mitogenome, the lengths of the 13 PCGs in the Amiota and Phortica ranged from 11,152–11,178 and 11,182–11,184 bp, respectively (Table S5). The initial codons for the 13 PCGs of the A. femorata and P. (P.) variegata mitogenomes were putative start codons ATD, except for COX1, which used TCG (Table 2) as in other dipteran insects [11,14,49,50,51]. ATP8 and ND1 severally started with ATT and ATA in the A. femorata mitogenome, whereas they started with ATC and ATT in the P. (P.) variegata mitogenome (Table 2).
Ten PCGs in the A. femorata mitogenome shared the termination codon TAR, whereas the remaining ND1, ND5, and ND6 terminated with an incomplete stop codon T (Table 2). Similar to the A. femorata mitogenome, the P. (P.) variegata mitogenome shared identical termination codons excluding COX2, which also used an incomplete stop codon T (Table 2). A common interpretation for the incomplete stop codon T is that TAA termini can be produced by posttranscriptional polyadenylation [52].
Apart from the stop codons, a total of 3707–3717 amino acids in the Steganinae mitogenomes were encoded by the mitochondrial PCGs. In the heatmap based on the relative synonymous codon usage (RSCU) values of the PCGs, the Amiota and Phortica species separated from each other in the cluster analysis (Figure 4A). The use of both two- and four-fold degenerate codons revealed a bias toward nucleotides A and T, especially in the 3rd codon positions (90.3–96.5%) (Table S5). Overall, the seven most frequently used codons were UUA (Leu1), UCU (Ser1), CGA (Arg), CCU (Pro), GGA (Gly), GCU (Ala), and UCA (Ser1), which constituted 32.5–34.6% of the total amino acid codons in these mitogenomes (Table S3). Including AGG (Ser2), two to six of the 62 possible degenerate codons were absent (Figure 4A). The loss of degenerate codons probably randomly occurred during evolution [53]. The two Ashima species, P. (A.) longipenis and P. (A.) tanabei, were both missing three degenerate codons. Only the codon family of Leu1 had codons per thousand codons (CDspT) values over 100 in all of the Steganinae mitogenomes (Table S4). As a hydrophobic amino acid, Leu1 might be associated with the encoding of transmembrane proteins [54]. The codon family with the second highest CDspT values, Ile, was more abundant in the Amiota mitogenomes (100.51–106.17) than in the Phortica mitogenomes (93.97–99.89) (Table S4). PC1 and PC2 explained 48.55% and 64.29% of the total variance to the PCAs based on the RSCU (Figure 4B) and CDspT values (Figure 4C), respectively. Similar to the characteristics of gene sizes (Figure 2A), the Phortica species separated from the Amiota species with distinct patterns at the subgenus level (Figure 4B,C). Furthermore, the pattern of the CDspT values was more specific than that of the RSCU values (Figure 4B,C). All these results revealed unambiguous population characteristics and provided novel insights into the evolutionary implications between and within the Amiota and Phortica based on the codon and amino acid usage of the mitochondrial PCGs.
As the indicators of evolutionary relationships and selective pressures of different species, the nonsynonymous substitutions per nonsynonymous site (Ka), synonymous substitutions per synonymous site (Ks), and Ka/Ks (ω) values of the 13 PCGs were computed for the Amiota and Phortica mitogenomes (Table S6). In this study, the Ka values of 12 PCGs in the six Amiota mitogenomes were significantly higher than those in the six Phortica mitogenomes, whereas eight PCGs had significantly higher Ks values in the Phortica mitogenomes than in the Amiota mitogenomes (Figure 5). The generally opposite Ka and Ks values resulted in consistently and significantly higher ω values in all the PCGs of the Amiota mitogenomes compared with the Phortica mitogenomes (Figure 5 and Table S6). In addition, our results showed that the significance of the ω values (0.001 < p < 0.01) of the ATPase subunits (ATP6 and ATP8) was inferior to those of other mitochondrial PCGs (p < 0.001) (Figure 5). All ω values < 1 (Ka < Ks) indicated that the PCGs evolved under purifying selection [55]. Our results suggested that the PCGs with relatively low evolutionary rates, including COX1, CYTB, and NAD1 (Figure 5), are better mitochondrial genetic markers than other PCGs for phylogenetic studies at both the nucleotide and amino acid levels.

3.3. Transfer RNA and Ribosomal RNA Genes

The typical set of 22 tRNA genes was scattered throughout each circular, double-stranded DNA molecule ranging from 62–64 bp (trnC) to 72 bp (trnV) (Table S1). The sizes of the total tRNAs in the Amiota and Phortica mitogenomes ranged from 1440–1449 bp and 1434–1440 bp, respectively (Table S5). All the tRNA genes had typical cloverleaf secondary structures apart from trnSer1, which lost the dihydrouracil (DHU) stem but held the DHU loop. Although trnSer1 in some other dipteran mitogenomes also did not form complete cloverleaf secondary structures, they generally had neither the DHU stem nor the DHU loop [11,14,56].
The two mitochondrial rRNA genes that were encoded by the N-strand were located between trnL2 and trnV (lrRNA) and between trnV and the D-loop region (srRNA), respectively (Figure 1 and Table 2). In the Amiota mitogenomes, lrRNA was 1322–1338 bp in length, whereas the lrRNA sizes in the Phortica mitogenomes ranged from 1317–1323 bp (Table S1). The sizes of srRNA were 784–789 bp in the 12 Steganinae mitogenomes without a significant difference in length between the Amiota and Phortica mitogenomes (Table S1).

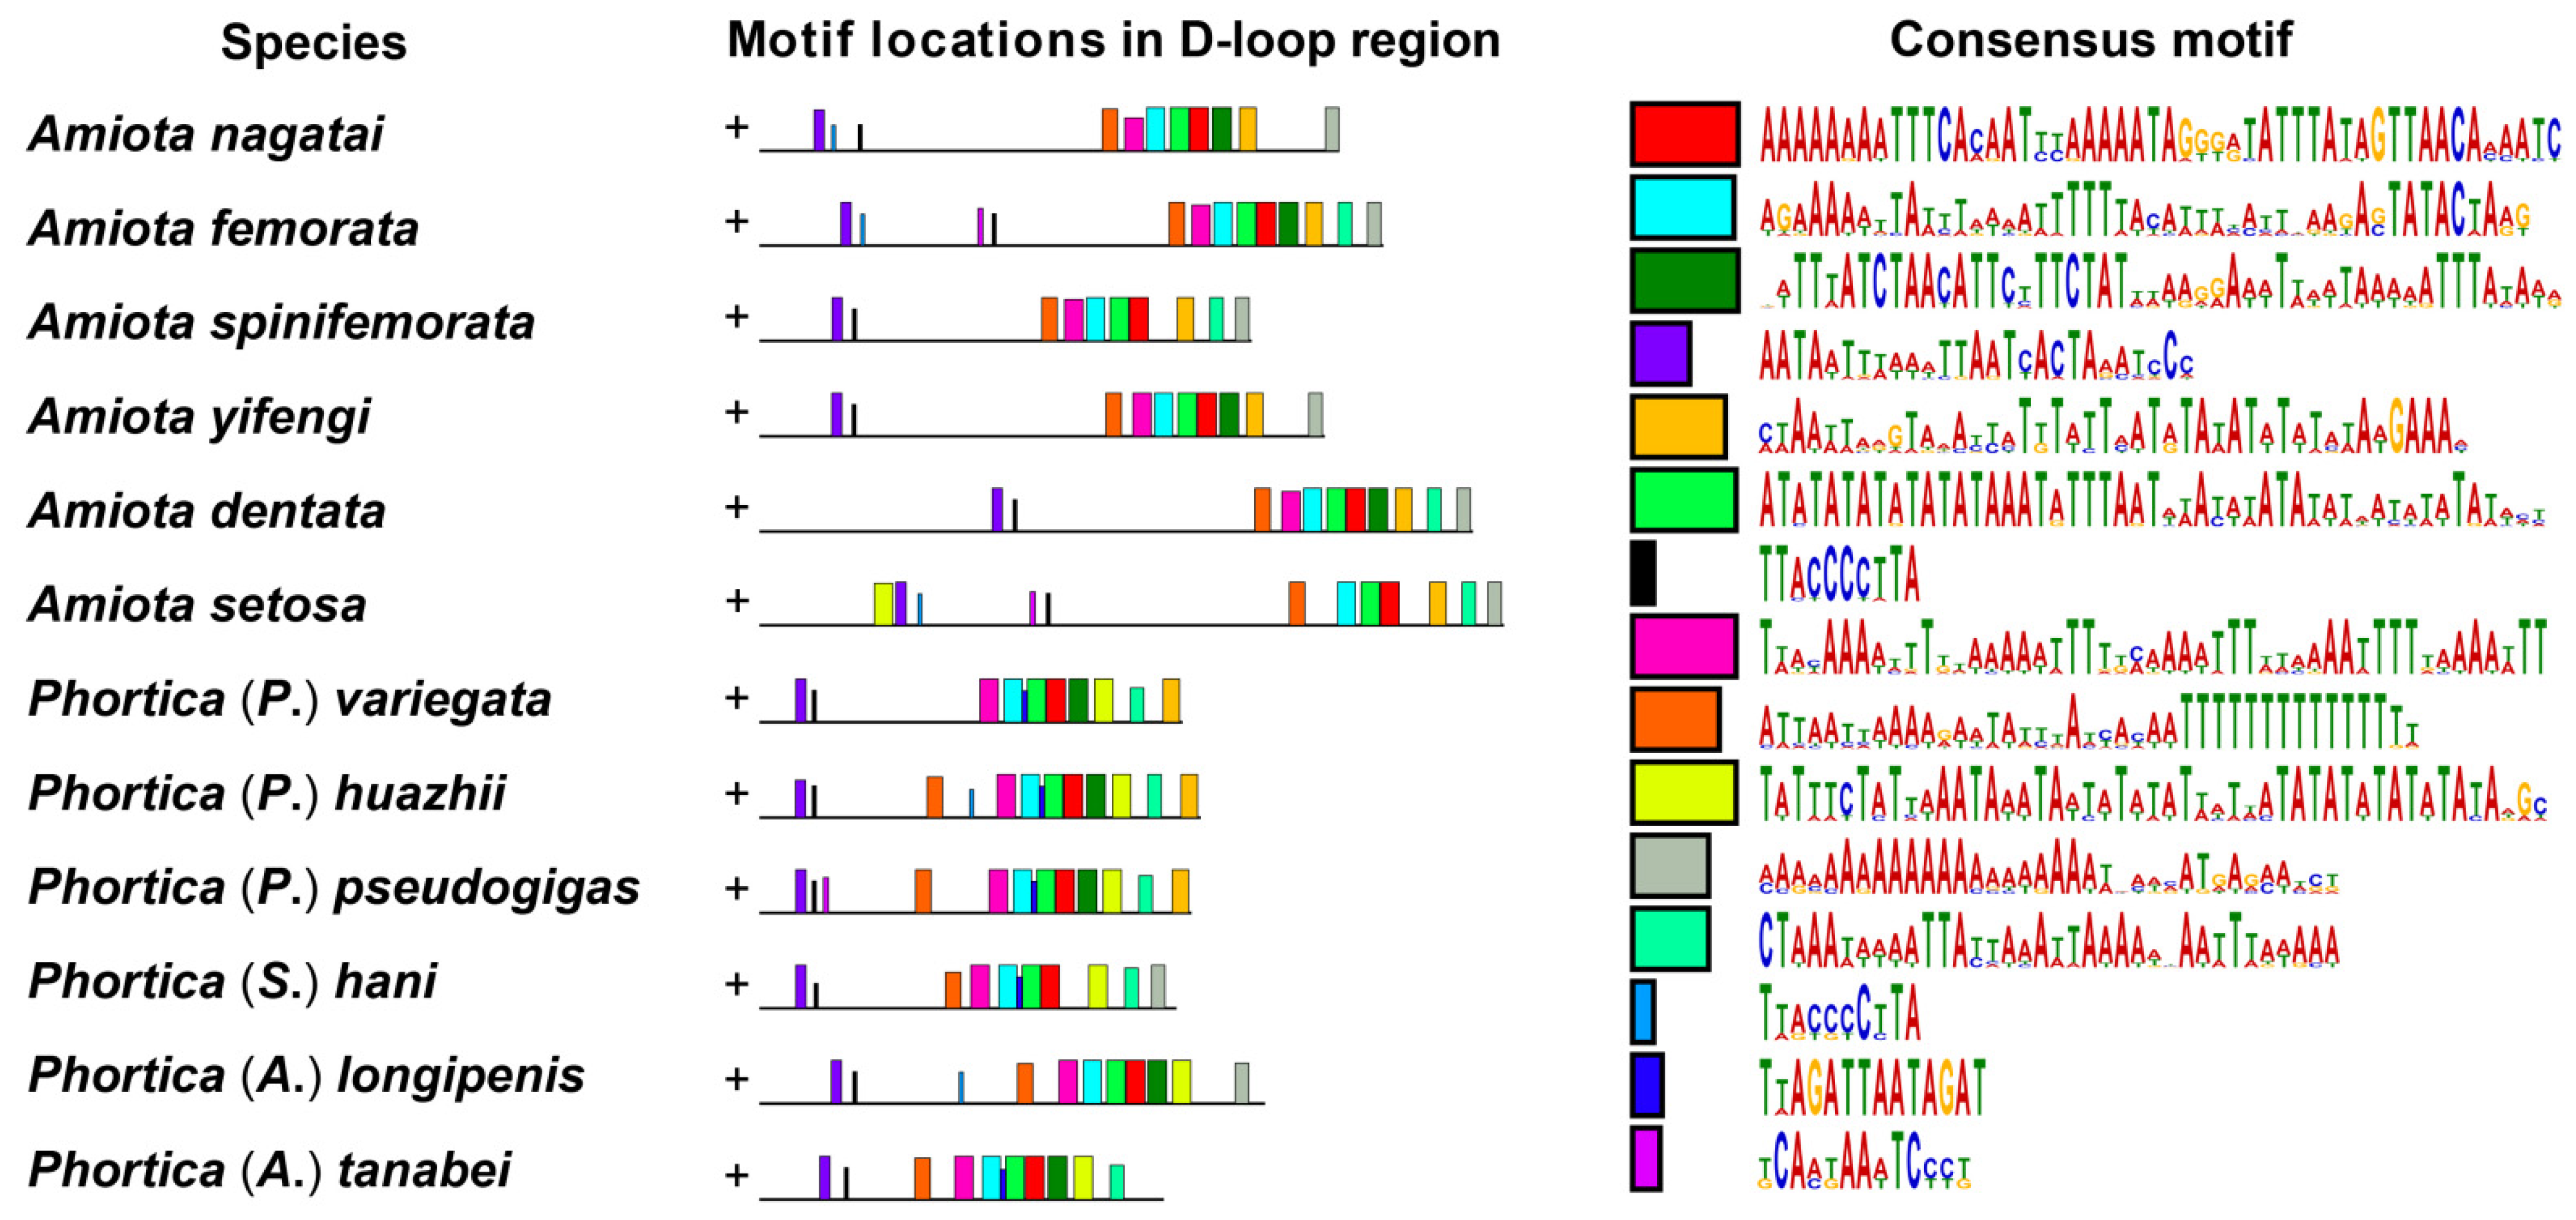
3.4. The D-Loop Regions

The D-loop regions (J-strand) of the 12 Steganinae mitogenomes were all located between srRNA and trnI with variable lengths. The Amiota and Phortica D-loop regions were 1515–1995 bp with 93.0–94.0% A + T contents and 1084–1355 bp with 90.2–92.9% A + T contents, respectively (Tables S1 and S5). Furthermore, the size differences in the D-loop regions were crucial to the size differences in the mitogenomes. Our PCA results revealed that variability in the D-loop region was one of the important distinctions between the Amiota and Phortica mitogenomes, and even within the subgenus Phortica mitogenomes (Figure 2A).
In the de novo motif discovery analysis, we searched a total of 20 consensus motifs ranging from 10–50 bp in the 12 D-loop sequences (Figure 6). It is worth noting that most of the consensus motifs were distributed downstream next to trnI in the D-loop sequences. The upstream regions 200–600 bp away from srRNA had only two or three consensus motifs (Figure 6). The midstream regions between the abovementioned motif-enriched regions were highly variable in length and contained almost no consensus motifs (Figure 6). Given the positive correlation between the sizes and the A + T contents of the D-loop regions, it is clear that the nonconserved regions were mainly composed of tandem repeats with very high A + T contents [57].
Moreover, we identified some consensus motifs that showed distinct genus-specific patterns. For example, a “TWTWWYTMTHWAATAWWTAWYWTWWWTWHWHMTATATWTATWTAYADRH” consensus motif (motif 10, the yellow-green box in Figure 6) located in the downstream region approximately 300 bp away from trnI was found only in the Phortica D-loop sequences. Based on the above results, we are convinced of the importance of the genus-specific characteristics and evolutionary implications provided within the D-loop regions of the Amiota and Phortica mitogenomes. Although the D-loop regions were highly variable, their downstream conserved regions could be partly aligned to reflect the phylogenetic positions that were altered by evolutionary driving forces throughout evolution.

3.5. Phylogenetic Analyses

In this study, the phylogenetic relationships of three mitochondrial data sets of the 12 Steganinae and two Drosophilinae species were recovered (Figure 7). For the data set based on the nucleotides of 13 PCGs and two rRNAs and the data set based on the amino acids of 13 PCGs, the concatenated sequences were divided into 20 and six subsets using the best-fit substitution models, respectively (Table S7). These two large data sets accounted for most of the genetic information in the mitogenomes. Overall, both the final Bayesian inference (BI) and maximum likelihood (ML) trees of these two data sets displayed an entirely identical topology, and most nodes were strongly supported (posterior probabilities, PPs = 1.00, ultrafast bootstrap percentages, UBPs = 100) (Figure 7A). The monophylies of the Steganinae, the Drosophilinae, the Phortica, and the Amiota were all well supported (PPs = 1.00, UBPs = 100). The phylogenetic relationships within the Phortica were also attached with high confidence (PPs = 1.00, UBPs = 100) with the exception between P. (P.) huazhii and P. (P.) variegata in the ML analyses (UBP = 99 for the nucleotides, UBP = 86 for the amino acids) (Figure 7A). The subgenera Phortica and Shangrila showed a closer relationship compared with the Ashima, which is consistent with the latest phylogenetic analysis concerning the Phortica [26]. A. nagatai (the nagatai species group) was primarily separated from the clade of the remaining five Amiota species (PP = 1.00, UBP = 100 for the nucleotides, PP = 0.91, UBP = 90 for the amino acids) (Figure 7A). The topology within this clade was supported in the BI (PPs = 0.60–1.00) but not well supported in the ML analyses (UBPs = 38–50). Nevertheless, all four trees reached a consensus on the close relationships between A. setosa (the alboguttata species group) and A. femorata + A. spinifemorata (the taurusata species group), and between A. yifengi (the basdeni species group) and A. dentata (ungrouped species) (Figure 7A).
The D-loop sequences were used as another data set for phylogenetic analyses. Briefly, apart from the phylogenetic transposition between A. nagatai and A. setosa, the topology of all other nodes was the same as in the above analyses (Figure 7). The nodal support values of the D-loop sequence data set were generally lower than those of the PCG data sets. This is expected since the D-loop sequences were highly variable and difficult to align due to the shortage of pairwise sites that could be used for phylogenetic calculations. However, the D-loop sequences still strongly supported the Steganinae, the Drosophilinae, the genus Phortica, the subgenus Phortica, and the Amiota taurusata species group each forming a monophyletic clade in both the BI and ML analyses (PPs = 0.99–1.00, UBPs = 95–100) (Figure 7B). In addition, the close relationship between P. (P.) huazhii and P. (P.) variegata was highly supported by the D-loop sequences (PP = 1.00, UBP = 100) (Figure 7B). The consistency in the phylogenetic topology of most clades indicated that the D-loop regions generally evolved under similar evolutionary pressures as the mitochondrial PCGs or the mitogenomes, whereas the inconsistency of partial phylogenetic topology implied that the D-loop motifs in the Phortica mitogenomes were more conservative and phylogenetically informative than those in the Amiota mitogenomes (Figure 6).
The D-loop region is inferred to play important roles in mtDNA gene transcription and mitochondrial replication [5,14]. Further efforts should be made to identify consensus motifs using gene-editing techniques such as CRISPR-Cas9 [58] to verify related regulatory mechanisms in the D-loop region. The rapid rate of evolution might make the D-loop region a promising molecular genetic marker to reveal the cause of the divergence of closely related species or subspecies [59,60]. In addition, we found that the genetic divergences within the Amiota were significantly greater than those within the Phortica. Therefore, we suggest further studies to investigate the necessity, possibility, and feasibility of establishing subgenera within the Amiota.

4. Conclusions

A total of 12 novel mitogenomes belonging to two large genera in the Steganinae were sequenced, assembled, annotated, compared, and analyzed in the present study. Our mitogenomic results strongly supported the Steganinae, the Amiota, the genus Phortica, the subgenera Phortica, and the Shangrila as a monophyletic group, respectively. The downstream D-loop sequences were also found to be phylogenetically informative and provided a similar topology to the Steganinae as the non-D-loop mitochondrial regions. Overall, these results not only broaden our knowledge of the mitochondrial characteristics of the Steganinae but also improve our understanding of the phylogenetic relationships within the subfamily. In addition, the D-loop sequence variability within these mitogenomes showed unambiguous genus-specific characteristics and provided novel insights into the evolutionary implications between and within the Amiota and Phortica. These newly available mitogenomes will contribute to further species identification, evolutionary biology, and conservation biology, and help to reveal the phylogenetic relationships and evolutionary history of the Drosophilidae.

Supplementary Materials

The following supporting information can be downloaded at: https://www.mdpi.com/article/10.3390/genes14061240/s1. Table S1: Sizes of the Amiota and Phortica mitogenomes. Table S2: Intergenic nucleotides (IGNs) of the Amiota and Phortica mitogenomes. Table S3: Relative synonymous codon usage (RSCU) values of the protein-coding genes (PCGs) in the Amiota and Phortica mitogenomes. Table S4: Codons per thousand codon (CDspT) values of the PCGs in the Amiota and Phortica mitogenomes. Table S5: Nucleotide compositions and skewness levels of the Amiota and Phortica mitogenomes. Table S6: Nonsynonymous substitutions per nonsynonymous site (Ka), synonymous substitutions per synonymous site (Ks), and Ka/Ks (ω) values (mean ± standard deviation, SD) of the 13 PCGs in the Amiota and Phortica mitogenomes. Table S7: Partitioning schemes and data subsets evaluated for the Bayesian inference (BI) and Maximum likelihood (ML) analysis by PartitionFinder. For the data set based on the nucleotides of the 13 PCGs and two rRNAs, best-fit selected substitution models for the PCGs (by codon positions) and rRNAs (by genes) are shown; for the data set of the amino acids based on the 13 PCGs, best-fit selected substitution models for the PCGs (by genes) are shown.

Author Contributions

Conceptualization, H.C. and J.H.; Methodology, J.H.; Software, Y.W. and J.H.; Validation, H.C. and J.H.; Formal analysis, J.H.; Investigation, Y.W. and H.C.; Resources, Y.W. and H.C.; Data curation, J.H.; Writing—original draft, C.Z.; Writing—review & editing, C.Z. and J.H.; Visualization, J.H.; Supervision, H.C. and J.H.; Project administration, J.H.; Funding acquisition, J.H. All authors have read and agreed to the published version of the manuscript.

Funding

This work was supported by the National Natural Science Foundation of China (32000322 to J.H., 32100348 to Y.W., and 31672321 to H.C.), the China Postdoctoral Science Foundation-funded project (2019M662953 to J.H.), and the Guangdong Basic and Applied Basic Research Foundation (2019A1515111204 to J.H.).

Institutional Review Board Statement

Not applicable.

Informed Consent Statement

Not applicable.

Data Availability Statement

The raw sequencing data generated in this study have been submitted to the NCBI Short Read Archive (SRA, https://www.ncbi.nlm.nih.gov/sra, accessed on 6 September 2022) under accession numbers SRR21438445–55; the mitogenomes assembled in this study have been submitted to the NCBI under accession numbers OP381033–44.

Conflicts of Interest

The authors declare no conflict of interest.

References

  1. Kummer, E.; Ban, N. Mechanisms and regulation of protein synthesis in mitochondria. Nat. Rev. Mol. Cell Biol. 2021, 22, 307–325. [Google Scholar] [CrossRef]
  2. Boore, J.L. Animal mitochondrial genomes. Nucleic Acids Res. 1999, 27, 1767–1780. [Google Scholar] [CrossRef] [Green Version]
  3. Rand, D.M.; Haney, R.A.; Fry, A.J. Cytonuclear coevolution: The genomics of cooperation. Trends Ecol. Evol. 2004, 19, 645–653. [Google Scholar] [CrossRef]
  4. Basu, U.; Bostwick, A.M.; Das, K.; Dittenhafer-Reed, K.E.; Patel, S.S. Structure, mechanism, and regulation of mitochondrial DNA transcription initiation. J. Biol. Chem. 2020, 295, 18406–18425. [Google Scholar] [CrossRef]
  5. Stoccoro, A.; Coppedè, F. Mitochondrial DNA methylation and human diseases. Int. J. Mol. Sci. 2021, 22, 4594. [Google Scholar] [CrossRef]
  6. Latorre-Pellicer, A.; Moreno-Loshuertos, R.; Lechuga-Vieco, A.V.; Sánchez-Cabo, F.; Torroja, C.; Acín-Pérez, R.; Calvo, E.; Aix, E.; González-Guerra, A.; Logan, A.; et al. Mitochondrial and nuclear DNA matching shapes metabolism and healthy ageing. Nature 2016, 535, 561–565. [Google Scholar] [CrossRef]
  7. Cameron, S.L. Insect mitochondrial genomics: Implications for evolution and phylogeny. Annu. Rev. Entomol. 2014, 59, 95–117. [Google Scholar] [CrossRef] [Green Version]
  8. Zhang, Y.; Gong, L.; Lu, X.; Jiang, L.; Liu, B.; Liu, L.; Lu, Z.; Li, P.; Zhang, X. Gene rearrangements in the mitochondrial genome of Chiromantes eulimene (Brachyura: Sesarmidae) and phylogenetic implications for Brachyura. Int. J. Biol. Macromol. 2020, 162, 704–714. [Google Scholar] [CrossRef]
  9. Zhang, Z.; Xing, Y.; Cheng, J.; Pan, D.; Lv, L.; Cumberlidge, N.; Sun, H. Phylogenetic implications of mitogenome rearrangements in East Asian potamiscine freshwater crabs (Brachyura: Potamidae). Mol. Phylogenet. Evol. 2020, 143, 106669. [Google Scholar] [CrossRef]
  10. Lin, Z.J.; Wang, X.; Wang, J.; Tan, Y.; Tang, X.; Werren, J.H.; Zhang, D.; Wang, X. Comparative analysis reveals the expansion of mitochondrial DNA control region containing unusually high G-C tandem repeat arrays in Nasonia vitripennis. Int. J. Biol. Macromol. 2021, 166, 1246–1257. [Google Scholar] [CrossRef]
  11. Wang, K.; Li, X.; Ding, S.; Wang, N.; Mao, M.; Wang, M.; Yang, D. The complete mitochondrial genome of the Atylotus miser (Diptera: Tabanomorpha: Tabanidae), with mitochondrial genome phylogeny of lower Brachycera (Orthorrhapha). Gene 2016, 586, 184–196. [Google Scholar] [CrossRef]
  12. Chen, L.P.; Zheng, F.Y.; Bai, J.; Wang, J.M.; Lv, C.Y.; Li, X.; Zhi, Y.C.; Li, X.J. Comparative analysis of mitogenomes among six species of grasshoppers (Orthoptera: Acridoidea: Catantopidae) and their phylogenetic implications in wing-type evolution. Int. J. Biol. Macromol. 2020, 159, 1062–1072. [Google Scholar] [CrossRef]
  13. Wolstenholme, D.R. Animal mitochondrial DNA: Structure and evolution. Int. Rev. Cytol. 1992, 141, 173–216. [Google Scholar]
  14. Zhang, N.X.; Yu, G.; Li, T.J.; He, Q.Y.; Zhou, Y.; Si, F.L.; Ren, S.; Chen, B. The complete mitochondrial genome of Delia antiqua and its implications in dipteran phylogenetics. PLoS ONE 2015, 10, e139736. [Google Scholar] [CrossRef]
  15. Lee, W.; Johnson, J.; Gough, D.J.; Donoghue, J.; Cagnone, G.L.; Vaghjiani, V.; Brown, K.A.; Johns, T.G.; John, J.C.S. Mitochondrial DNA copy number is regulated by DNA methylation and demethylation of POLGA in stem and cancer cells and their differentiated progeny. Cell Death Dis. 2015, 6, e1664. [Google Scholar] [CrossRef] [Green Version]
  16. Chocron, E.S.; Munkácsy, E.; Pickering, A.M. Cause or casualty: The role of mitochondrial DNA in aging and age-associated disease. Biochim. Biophys. Acta Mol. Basis Dis. 2019, 1865, 285–297. [Google Scholar] [CrossRef]
  17. Ren, J.; Pulakat, L.; Whaley-Connell, A.; Sowers, J.R. Mitochondrial biogenesis in the metabolic syndrome and cardiovascular disease. J. Mol. Med. 2010, 88, 993–1001. [Google Scholar] [CrossRef] [Green Version]
  18. Baccarelli, A.A.; Byun, H.M. Platelet mitochondrial DNA methylation: A potential new marker of cardiovascular disease. Clin. Epigenetics 2015, 7, 44. [Google Scholar] [CrossRef] [Green Version]
  19. Coppedè, F.; Stoccoro, A. Mitoepigenetics and neurodegenerative diseases. Front. Endocrinol. 2019, 10, 86. [Google Scholar] [CrossRef] [Green Version]
  20. GBIF. The Global Biodiversity Information Facility. Available online: https://www.gbif.org (accessed on 10 February 2023).
  21. Loew, H. Diptera Americae septentrionalis indigena. Descripsit, Centuria secunda. Berl. Entomol. Z. 1862, 6, 185–232. [Google Scholar]
  22. Schiner, I.R. Vorläufiger Commentar zum dipterologischen Theile der “Fauna Austriaca”. Wien. Ent. Monatschr. 1862, 6, 428–436. [Google Scholar]
  23. Wheeler, M.R. The Drosophilidae of the Nearctic Region, exclusive of the genus Drosophila. Tex. Univ. Publ. 1952, 5204, 162–218. [Google Scholar]
  24. Máca, J. Taxonomic notes on the genera previously classified in the genus Amiota Loew (Diptera, Drosophilidae, Steganinae). Acta Univ. Carol. Biol. 2003, 47, 247–274. [Google Scholar]
  25. Otranto, D.; Stevens, J.R.; Testini, G.; Cantacessi, C.; Máca, J. Molecular characterization and phylogenesis of Steganinae (Diptera, Drosophilidae) inferred by the mitochondrial cytochrome c oxidase subunit 1. Med. Vet. Entomol. 2008, 22, 37–47. [Google Scholar] [CrossRef]
  26. Cao, H.; Wang, X.; Gao, J.; Prigent, S.R.; Watabe, H.; Zhang, Y.; Chen, H. Phylogeny of the African and Asian Phortica (Drosophilidae) deduced from nuclear and mitochondrial DNA sequences. Mol. Phylogenet. Evol. 2011, 61, 677–685. [Google Scholar] [CrossRef]
  27. Shao, Z.F.; Li, T.; Jiang, J.J.; Lu, J.M.; Chen, H.W. Molecular phylogenetic analysis of the Amiota taurusata species group within the Chinese species, with descriptions of two new species. J. Insect Sci. 2014, 14, 33. [Google Scholar] [CrossRef] [Green Version]
  28. Huang, J.; Gong, L.; Tsaur, S.C.; Zhu, L.; An, K.; Chen, H. Revision of the subgenus Phortica (sensu stricto) (Diptera, Drosophilidae) from East Asia, with assessment of species delimitation using DNA barcodes. Zootaxa 2019, 4678, 1–75. [Google Scholar] [CrossRef]
  29. Geneious Prime. Version 2020.0.5. Available online: https://www.geneious.com (accessed on 14 January 2020).
  30. Boratyn, G.M.; Camacho, C.; Cooper, P.S.; Coulouris, G.; Fong, A.; Ma, N.; Madden, T.L.; Matten, W.T.; McGinnis, S.D.; Merezhuk, Y.; et al. BLAST: A more efficient report with usability improvements. Nucleic Acids Res. 2013, 41, W29–W33. [Google Scholar] [CrossRef] [Green Version]
  31. Donath, A.; Jühling, F.; Al-Arab, M.; Bernhart, S.H.; Reinhardt, F.; Stadler, P.F.; Middendorf, M.; Bernt, M. Improved annotation of protein-coding genes boundaries in metazoan mitochondrial genomes. Nucleic Acids Res. 2019, 47, 10543–10552. [Google Scholar] [CrossRef]
  32. Tamura, K.; Stecher, G.; Kumar, S. MEGA11: Molecular Evolutionary Genetics Analysis version 11. Mol. Biol. Evol. 2021, 38, 3022–3027. [Google Scholar] [CrossRef]
  33. Chan, P.P.; Lin, B.Y.; Mak, A.J.; Lowe, T.M. tRNAscan-SE 2.0: Improved detection and functional classification of transfer RNA genes. Nucleic Acids Res. 2021, 49, 9077–9096. [Google Scholar] [CrossRef]
  34. Stothard, P.; Grant, J.R.; Domselaar, G.V. Visualizing and comparing circular genomes using the CGView family of tools. Brief. Bioinform. 2019, 20, 1576–1582. [Google Scholar] [CrossRef] [Green Version]
  35. Perna, N.T.; Kocher, T.D. Patterns of nucleotide composition at fourfold degenerate sites of animal mitochondrial genomes. J. Mol. Evol. 1995, 41, 353–358. [Google Scholar] [CrossRef]
  36. R Core Team. R: A Language and Environment for Statistical Computing; R Foundation for Statistical Computing: Vienna, Austria, 2022. [Google Scholar]
  37. R Package Pheatmap. Pretty Heatmaps. Available online: https://CRAN.R-project.org/package=pheatmap (accessed on 24 July 2022).
  38. R Package Ggplot2. Create Elegant Data Visualisations Using the Grammar of Graphics. Available online: https://ggplot2.tidyverse.org (accessed on 24 July 2022).
  39. Bailey, T.L.; Elkan, C. Fitting a mixture model by expectation maximization to discover motifs in biopolymers. Proc. Int. Conf. Intell. Syst. Mol. Biol. 1994, 2, 28–36. [Google Scholar]
  40. Katoh, K.; Standley, D.M. MAFFT multiple sequence alignment software version 7: Improvements in performance and usability. Mol. Biol. Evol. 2013, 30, 772–780. [Google Scholar] [CrossRef] [Green Version]
  41. Lanfear, R.; Frandsen, P.B.; Wright, A.M.; Senfeld, T.; Calcott, B. PartitionFinder 2: New methods for selecting partitioned models of evolution for molecular and morphological phylogenetic analyses. Mol. Biol. Evol. 2017, 34, 772–773. [Google Scholar] [CrossRef] [Green Version]
  42. Ronquist, F.; Teslenko, M.; van der Mark, P.; Ayres, D.L.; Darling, A.; Höhna, S.; Larget, B.; Liu, L.; Suchard, M.A.; Huelsenbeck, J.P. MrBayes 3.2: Efficient Bayesian phylogenetic inference and model choice across a large model space. Syst. Biol. 2012, 61, 539–542. [Google Scholar] [CrossRef] [Green Version]
  43. Rambaut, A.; Drummond, A.J.; Xie, D.; Baele, G.; Suchard, M.A. Posterior summarization in Bayesian phylogenetics using Tracer 1.7. Syst. Biol. 2018, 67, 901–904. [Google Scholar] [CrossRef] [Green Version]
  44. Nguyen, L.T.; Schmidt, H.A.; von Haeseler, A.; Minh, B.Q. IQ-TREE: A fast and effective stochastic algorithm for estimating maximum-likelihood phylogenies. Mol. Biol. Evol. 2015, 32, 268–274. [Google Scholar] [CrossRef]
  45. Kalyaanamoorthy, S.; Minh, B.Q.; Wong, T.; von Haeseler, A.; Jermiin, L.S. ModelFinder: Fast model selection for accurate phylogenetic estimates. Nat. Methods 2017, 14, 587–589. [Google Scholar] [CrossRef] [Green Version]
  46. Hoang, D.T.; Chernomor, O.; von Haeseler, A.; Minh, B.Q.; Vinh, L.S. UFBoot2: Improving the ultrafast bootstrap approximation. Mol. Biol. Evol. 2018, 35, 518–522. [Google Scholar] [CrossRef]
  47. FigTree. A Graphical Viewer of Phylogenetic Trees and for Producing Publication-Ready Figures. Available online: http://tree.bio.ed.ac.uk/software/figtree/ (accessed on 30 August 2022).
  48. Chen, Z.T.; Du, Y.Z. The first two mitochondrial genomes from Taeniopterygidae (Insecta: Plecoptera): Structural features and phylogenetic implications. Int. J. Biol. Macromol. 2018, 111, 70–76. [Google Scholar] [CrossRef]
  49. Zhang, D.; Yan, L.; Zhang, M.; Chu, H.; Cao, J.; Li, K.; Hu, D.; Pape, T. Phylogenetic inference of calyptrates, with the first mitogenomes for Gasterophilinae (Diptera: Oestridae) and Paramacronychiinae (Diptera: Sarcophagidae). Int. J. Biol. Sci. 2016, 12, 489–504. [Google Scholar] [CrossRef] [Green Version]
  50. Wang, A.; Du, Z.; Luo, X.; Zhang, F.; Zhang, J.; Li, H. The conserved mitochondrial genomes of Drosophila mercatorum (Diptera: Drosophilidae) with different reproductive modes and phylogenetic implications. Int. J. Biol. Macromol. 2019, 138, 912–918. [Google Scholar] [CrossRef]
  51. Ren, L.; Zhang, X.; Li, Y.; Shang, Y.; Chen, S.; Wang, S.; Qu, Y.; Cai, J.; Guo, Y. Comparative analysis of mitochondrial genomes among the subfamily Sarcophaginae (Diptera: Sarcophagidae) and phylogenetic implications. Int. J. Biol. Macromol. 2020, 161, 214–222. [Google Scholar] [CrossRef]
  52. Ojala, D.; Montoya, J.; Attardi, G. tRNA punctuation model of RNA processing in human mitochondria. Nature 1981, 290, 470–474. [Google Scholar] [CrossRef]
  53. Li, J.; Zhang, Y.; Hu, K.; Zhao, Y.; Lin, R.; Li, Y.; Huang, Z.; Zhang, X.; Geng, X.; Ding, J. Mitochondrial genome characteristics of two Sphingidae insects (Psilogramma increta and Macroglossum stellatarum) and implications for their phylogeny. Int. J. Biol. Macromol. 2018, 113, 592–600. [Google Scholar] [CrossRef]
  54. Lu, H.F.; Su, T.J.; Luo, A.R.; Zhu, C.D.; Wu, C.S. Characterization of the complete mitochondrion genome of diurnal moth Amata emma (Butler) (Lepidoptera: Erebidae) and its phylogenetic implications. PLoS ONE 2013, 8, e72410. [Google Scholar] [CrossRef]
  55. Yuan, M.L.; Zhang, Q.L.; Guo, Z.L.; Wang, J.; Shen, Y.Y. Comparative mitogenomic analysis of the superfamily Pentatomoidea (Insecta: Hemiptera: Heteroptera) and phylogenetic implications. BMC Genom. 2015, 16, 460. [Google Scholar] [CrossRef] [Green Version]
  56. Wang, G.; Huang, M. Characterization of the complete mitochondrial genome of Simulium (Byssodon) maculatum (Diptera: Simuliidae) and its phylogenetic implications. Int. J. Biol. Macromol. 2019, 121, 152–160. [Google Scholar] [CrossRef]
  57. Taanman, J.W. The mitochondrial genome: Structure, transcription, translation and replication. Biochim. Biophys. Acta 1999, 1410, 103–123. [Google Scholar] [CrossRef] [Green Version]
  58. Hussain, S.R.A.; Yalvac, M.E.; Khoo, B.; Eckardt, S.; Mclaughlin, K.J. Adapting CRISPR/Cas9 system for targeting mitochondrial genome. Front. Genet. 2021, 12, 627050. [Google Scholar] [CrossRef]
  59. Yacoub, H.A.; Fathi, M.M. Phylogenetic analysis using d-loop marker of mtDNA of Saudi native chicken strains. Mitochondrial DNA 2013, 24, 538–551. [Google Scholar] [CrossRef] [PubMed]
  60. Ochiai, Y.; Yoshikawa, Y.; Takano, T.; Mori, M.; Hondo, R.; Mochizuki, M.; Ueda, F. Genetic variation of mitochondrial DNA in Phalacrocorax carbo in Japan. J. Vet. Med. Sci. 2020, 82, 735–739. [Google Scholar] [CrossRef] [Green Version]
Figure 1. Graphical maps of the mitochondrial genomes (mitogenomes) of the representative Amiota (Amiota femorata Chen & Takamori) and Phortica species [Phortica (Phortica) variegata (Fallén)], respectively. The genes outside the outermost circle are transcribed clockwise, whereas the genes inside the outermost circle are transcribed counterclockwise. The inside circles show the G + C content and the GC-skews.
Genes 14 01240 g001
Figure 2. Principal component analyses (PCAs) based on (A) the sizes of genes and (B) the sizes of intergenic nucleotides (IGNs) in the Amiota and Phortica mitogenomes.
Genes 14 01240 g002
Figure 3. Linear correlation analyses between the AT-skews and the GC-skews of different regions/genes in the Amiota and Phortica mitogenomes. (A) The majority strands (J-strands) of whole mitogenomes. (B) Thirteen protein-coding genes (PCGs). (C) Thirteen PCGs (1st codon positions). (D) Thirteen PCGs (2nd codon positions). (E) Thirteen PCGs (3rd codon positions). (F) Twenty-two tRNAs. (G) Two rRNAs. (H) The D-loop regions (J-strands).
Genes 14 01240 g003
Figure 4. Genetic characteristics of the codon and the amino acid usage of all the PCGs in the Amiota and Phortica mitogenomes. (A) Heatmap and clustering analysis of the codon usage. Pound (#): absent codon. (B) PCA based on the relative synonymous codon usage (RSCU) values. (C) PCA based on the codons per thousand codons (CDspT) values.
Genes 14 01240 g004
Figure 5. Nonsynonymous substitutions per nonsynonymous site (Ka), synonymous substitutions per synonymous site (Ks), and Ka/Ks (ω) values of all the PCGs in the Amiota and Phortica mitogenomes. In all analyses, (*) p < 0.05, (**) p < 0.01, (***) p < 0.001, (****) p < 0.0001, (NS) not significant.
Genes 14 01240 g005
Figure 6. De novo motif discovery of the D-loop sequences (J-strands) in the Amiota and Phortica mitogenomes.
Genes 14 01240 g006
Figure 7. Phylogenetic trees reconstructed by Bayesian inference (BI) and maximum likelihood (ML) analyses for the data sets of 14 Drosophilidae mitogenomes. (A) Entirely identical topology inferred from the nucleotides of the 13 PCGs and two rRNAs (green in the upper boxes) and the amino acids of the 13 PCGs (pink in the lower boxes). (B) Similar topology to (A) inferred from the D-loop sequences. The dotted lines indicate that the Amiota species and clades are inconsistent with the topology displayed in (A). For both trees, numbers around nodes are posterior probabilities (PPs, left) calculated from the BI and ultrafast bootstrap percentages (UBPs) calculated from the ML analyses. The bar indicates the estimated number of substitutions per site.
Genes 14 01240 g007
Table 1. Details of the Amiota and Phortica species and mitogenomes used in this study.
GenusSubgenus/Species GroupSpeciesCollection SiteMitogenome Accession NumberSRA Accession Number
Amiota/dentata OkadaFengtongzhai, Baoxing, Sichuan, ChinaOP381033SRR21438455
Amiotataurusatafemorata Chen & TakamoriDafengding, Mabian, Sichuan, ChinaOP381034SRR21438454
Amiotanagatainagatai OkadaConghua, Guangzhou, Guangdong, ChinaOP381035SRR21438452
Amiotaalboguttatasetosa Zhang & ChenDafengding, Mabian, Sichuan, ChinaOP381036SRR21438451
Amiotataurusataspinifemorata Li & ChenGexigou, Yajiang, Sichuan, ChinaOP381037SRR21438450
Amiotabasdeniyifengi Zhang & ChenGexigou, Yajiang, Sichuan, ChinaOP381038SRR21438449
PhorticaAshimalongipenis Chen & GaoHesong, Menghai, Yunnan, ChinaOP381039SRR21438448
PhorticaAshimatanabei Chen & TodaMuyiji Park, Ximeng, Yunnan, ChinaOP381040SRR21438447
PhorticaPhorticahuazhii Cheng & ChenRuili Park, Yunnan, ChinaOP381041SRR21438446
PhorticaPhorticapseudogigas Zhang & GanMangshi, Yunnan, ChinaOP381042SRR21438445
PhorticaPhorticavariegata (Fallén)/OP381043a SRR826812
PhorticaShangrilahani Zhang & ShiGexigou, Yajiang, Sichuan, ChinaOP381044SRR21438453
Slash (/): not applicable or unknown. a The Phortica (Phortica) variegata (Fallén) mitogenome was assembled from the DNA sequencing data deposited in the NCBI Short Read Archive (SRA, https://www.ncbi.nlm.nih.gov/sra) (accessed on 6 September 2022).
Table 2. Annotations and gene organizations of the mitogenomes of Amiota femorata Chen & Takamori and Phortica (Phortica) variegata (Fallén).
GeneStrandA. femorataP. (P.) variegata
Position (bp)Size (bp)Anti- or Start/Stop CodonsIGN(s) (bp)Position (bp)Size (bp)Anti- or Start/Stop CodonsIGN(s) (bp)
trnI (Ile)+1–6565GAU71–6565GAU15
trnQ (Gln)73–14169UUG−181–14969UUG−1
trnM (Met)+141–20969CAU0149–21769CAU0
ND2+210–12321023ATT/TAA0218–12431026ATT/TAA0
trnW (Trp)+1231–129868UCA61242–130968UCA6
trnC (Cys)1291–135363GCA21302–136463GCA2
trnY (Tyr)1356–142166GUA01367–143266GUA0
COX1+1420–29581539TCG/TAA31431–29691539TCG/TAA3
trnL1 (Leu) (UUR)+2954–301966UAA32965–303066UAA2
COX2+3023–3703681ATG/TAA73033–3717685ATG/T-3
trnK (Lys)+3711–378171CUU−13721–379171CUU0
trnD (Asp)+3781–385070GUC03792–385867GUC0
ATP8+3851–4012162ATT/TAA53859–4020162ATC/TAA5
ATP6+4006–4683678ATG/TAA−14014–4691678ATG/TAA6
COX3+4683–5471789ATG/TAA84698–5486789ATG/TAA9
trnG (Gly)+5480–554364UCC05496–556065UCC0
ND3+5544–5897354ATT/TAG05561–5914354ATT/TAG0
trnA (Ala)+5896–596267UGC85913–597765UGC−1
trnR (Arg)+5971–603464UCG35977–603963UCG2
trnN (Asn)+6038–610265GUU06042–610665GUU0
trnS2 (Ser) (AGN)+6103–617068GCU06107–617367GCU0
trnE (Glu)+6171–623868UUC186174–623966UUC18
trnF (Phe)6257–632266GAA06258–632467GAA0
ND56323–80421720ATT/T-156325–80441720ATT/T-15
trnH (His)8058–812265GUG08060–812465GUG0
ND48123–94611339ATG/T-28125–94631339ATG/T-0
ND4L9464–9754291ATG/TAA29464–9754291ATG/TAA2
trnT (Thr)+9757–982165UGU09757–982165UGU0
trnP (Pro)9822–988766UGG39822–988766UGG2
ND6+9891–10,415525ATT/TAA−19890–10,414525ATT/TAA−1
CYTB+10,415–11,5511137ATG/TAG010,414–11,5501137ATG/TAG0
trnS1 (Ser) (UCN)+11,550–11,61667UGA1511,549–11,61567UGA18
ND111,632–12,568937ATA/T-1011,634–12,570937ATT/T-10
trnL2 (Leu) (CUN)12,579–12,64466UAG012,581–12,64464UAG0
lrRNA12,645–13,9711327/012,645–13,9641320/0
trnV (Val)13,972–14,04372UAC013,965–14,03672UAC0
srRNA14,044–14,827784/014,037–14,824788/0
D-loop region+14,828–16,4991672/014,825–15,9581134/0
Disclaimer/Publisher’s Note: The statements, opinions and data contained in all publications are solely those of the individual author(s) and contributor(s) and not of MDPI and/or the editor(s). MDPI and/or the editor(s) disclaim responsibility for any injury to people or property resulting from any ideas, methods, instructions or products referred to in the content.

