Article

Genome-Wide Characterization and Sequence Polymorphism Analyses of Glycine max Fibrillin (FBN) Revealed Its Role in Response to Drought Condition

by
Muhammad Zeshan Zafer
1,2,
Muhammad Hammad Nadeem Tahir
2,
Zulqurnain Khan
1,2,
Muhammad Sajjad
3,
Xiangkuo Gao
4,
Muhammad Amir Bakhtavar
2,
Ummara Waheed
2,
Maria Siddique
5,
Zhide Geng
4,* and
Shoaib Ur Rehman
1,2,*
1
SINO-PAK Joint Research Laboratory, Institute of Plant Breeding and Biotechnology, Muhammad Nawaz Shareef, University of Agriculture, Multan 66000, Pakistan
2
Institute of Plant Breeding and Biotechnology, Muhammad Nawaz Shareef, University of Agriculture, Multan 66000, Pakistan
3
Department of Biosciences, COMSATS University, Islamabad (CUI), Park Road, Islamabad 45550, Pakistan
4
Institute of Food Crops, Yunnan Academy of Agricultural Sciences, Kunming 650204, China
5
Department of Environmental Sciences, COMSATS University Islamabad, Abbottabad Campus, Abbottabad 22060, Pakistan
*
Authors to whom correspondence should be addressed.
Genes 2023, 14(6), 1188; https://doi.org/10.3390/genes14061188
Submission received: 15 April 2023 / Revised: 9 May 2023 / Accepted: 12 May 2023 / Published: 29 May 2023
(This article belongs to the Special Issue Genome-Wide Identifications: Recent Trends in Genomic Studies)

Abstract

:
The fibrillin (FBN) gene family is widely distributed in all photosynthetic organisms. Members of this gene family are involved in plant growth and development and their response to various biotic and abiotic stress factors. In this study, 16 members of FBN were identified in Glycine max and characterized by using different bioinformatics tools. Phylogenetic analysis classified FBN genes into seven groups. The presence of stress-related cis-elements in the upstream region of GmFBN highlighted their role in tolerance against abiotic stresses. To further decipher the function, physiochemical properties, conserved motifs, chromosomal localization, subcellular localization, and cis-acting regulatory elements were also analyzed. Gene expression analysis based on FPKM values revealed that GmFBNs greatly enhanced soybean drought tolerance and controlled the expression of several genes involved in drought response, except for GmFBN-4, GmFBN-5, GmFBN-6, GmFBN-7 and GmFBN-9. For high throughput genotyping, an SNP-based CAPS marker was also developed for the GmFBN-15 gene. The CAPS marker differentiated soybean genotypes based on the presence of either the GmFBN-15-G or GmFBN-15-A alleles in the CDS region. Association analysis showed that G. max accessions containing the GmFBN-15-A allele at the respective locus showed higher thousand seed weight compared to accessions containing the GmFBN-15-G allele. This research has provided the basic information to further decipher the function of FBN in soybean.

1. Introduction

Soybean (Glycine max L.) is an important source of edible oil. Like other crops, abiotic stress factors are major limiting factors affecting its yield and quality. Hence, finding and understanding the role of stress tolerance-causing genes in soybean is an important step toward soybean breeding [1,2]. The availability of soybean PAN-genome has also opened up new insights for molecular breeding in soybean [3]. Soybean PAN-genome is also being used to explore sequence polymorphism within genome and to convert these polymorphic sites into breeding tool kits in the shape of SNP-based molecular markers [1,2].
The genome-wide identification and characterization of plant transcription factors (TFs) bears key importance. The TFs play a major role in plant growth and developmental processes, including tolerance against biotic and abiotic stress factors. Lipid-associated proteins, fibrillin (FBN), are mainly present in plastids and are omnipresent in plants. Fibrillin was first found in fibrils in the chromosomes of dog rose (Rosa canina) and bell pepper (Capsicum annuum) [4,5]. Since then, several organelles, such as chloroplast plastoglobulus (PGs) and algal eyespots, have been shown to contain FBN proteins. FBN members are known by a broad variety of names, such as plastoglobuli (PGL), plastid-lipid-associated protein (PAP), and chromoplast-specific carotenoid-associated protein (CaRP) [6,7]. Chlorophyll from cyanobacteria from some higher plants all include FBNs, which are essential for photosynthesis [8]. FBNs are a class of proteins essential for chloroplast development, lipid metabolism, and the evasion of stress in plants. Thylakoid stability and response to various stress stimuli have been linked to FBN genes. FBN proteins play a crucial function in photosynthesis and are involved in photoprotection in response to high-light conditions at low temperatures in cucumber [9]. The FBN protein family is composed of 12 sub-families. These sub-families have been identified in a wide range of organisms, i.e., from algae to higher plants, including wheat, Arabidopsis, tomato, and rice [10,11]. In wheat, besides being expressed in different tissues and developmental stages, TaFBNs are also expressed in response to biotic (stripe rust) and abiotic (drought, cold and heat) stresses [10]. Some CaFBN genes also upregulate in response to dehydration stress [12]. Kim et al. also reported the important role of FBN genes in plant growth and development [4]. FBN genes also contain many light-responsive elements and can promote plant height and flowering under high light levels in tobacco [13]. To date, FBNs have been characterized in a limited number of plant species, although their role in soybean molecular breeding for drought tolerance is yet to be reported.
To facilitate the use of GmFBN in soybean molecular breeding, the current study focused on the characterization of GmFBN for sub-cellular localization, conserved domain database (CDD), motif composition, FBN comparison among the species using sequence logo, comparative phylogenetic, molecular evolutionary analysis, and its potential roles in plant evolution followed by SNP-based marker development. Our findings outline that the GmFBN gene family offers a theoretical and practical foundation for analyzing their function, particularly in the context of soybean molecular breeding.

2. Materials and Methods

2.1. Sequence Identification

AtFBNs were downloaded from the TAIR database (https://www.arabidopsis.org/ accessed on 13 September 2022) and were used as reference. Pfam tools (http://pfam.xfam.org/ accessed on 15 September 2022) were used to identify the specific domain. This domain was BLAST on Phytozome (https://phytozome-next.jgi.doe.gov/ accessed on 21 September 2022) to acquire the putative genomic and protein sequences in targeted species. The soybean genome sequence and the general feature format file (GFF3) were downloaded from the online web server. Chemical properties were predicted by using the online web tool ExPASy ProtParam [14] (http://us.expasy.org/tools/protparam.html accessed on 11 October 2022). CELLO v.2.5 subcellular localization predictor (http://cello.life.nctu.edu.tw/ accessed on 21 October 2022) [15], Softberry (http://www.softberry.com/ accessed on 21 October 2022), and WoLF PSORT [16] (https://wolfpsort.hgc.jp/ accessed on 21 October 2022) were used to predict subcellular localization for GmFBNs. The total numbers of conserved domains in each GmFBN gene were determined using the NCBI CDD tool (https://www.ncbi.nlm.nih.gov/Structure/cdd/wrpsb.cgi accessed on 21 September 2022) and TBtools.

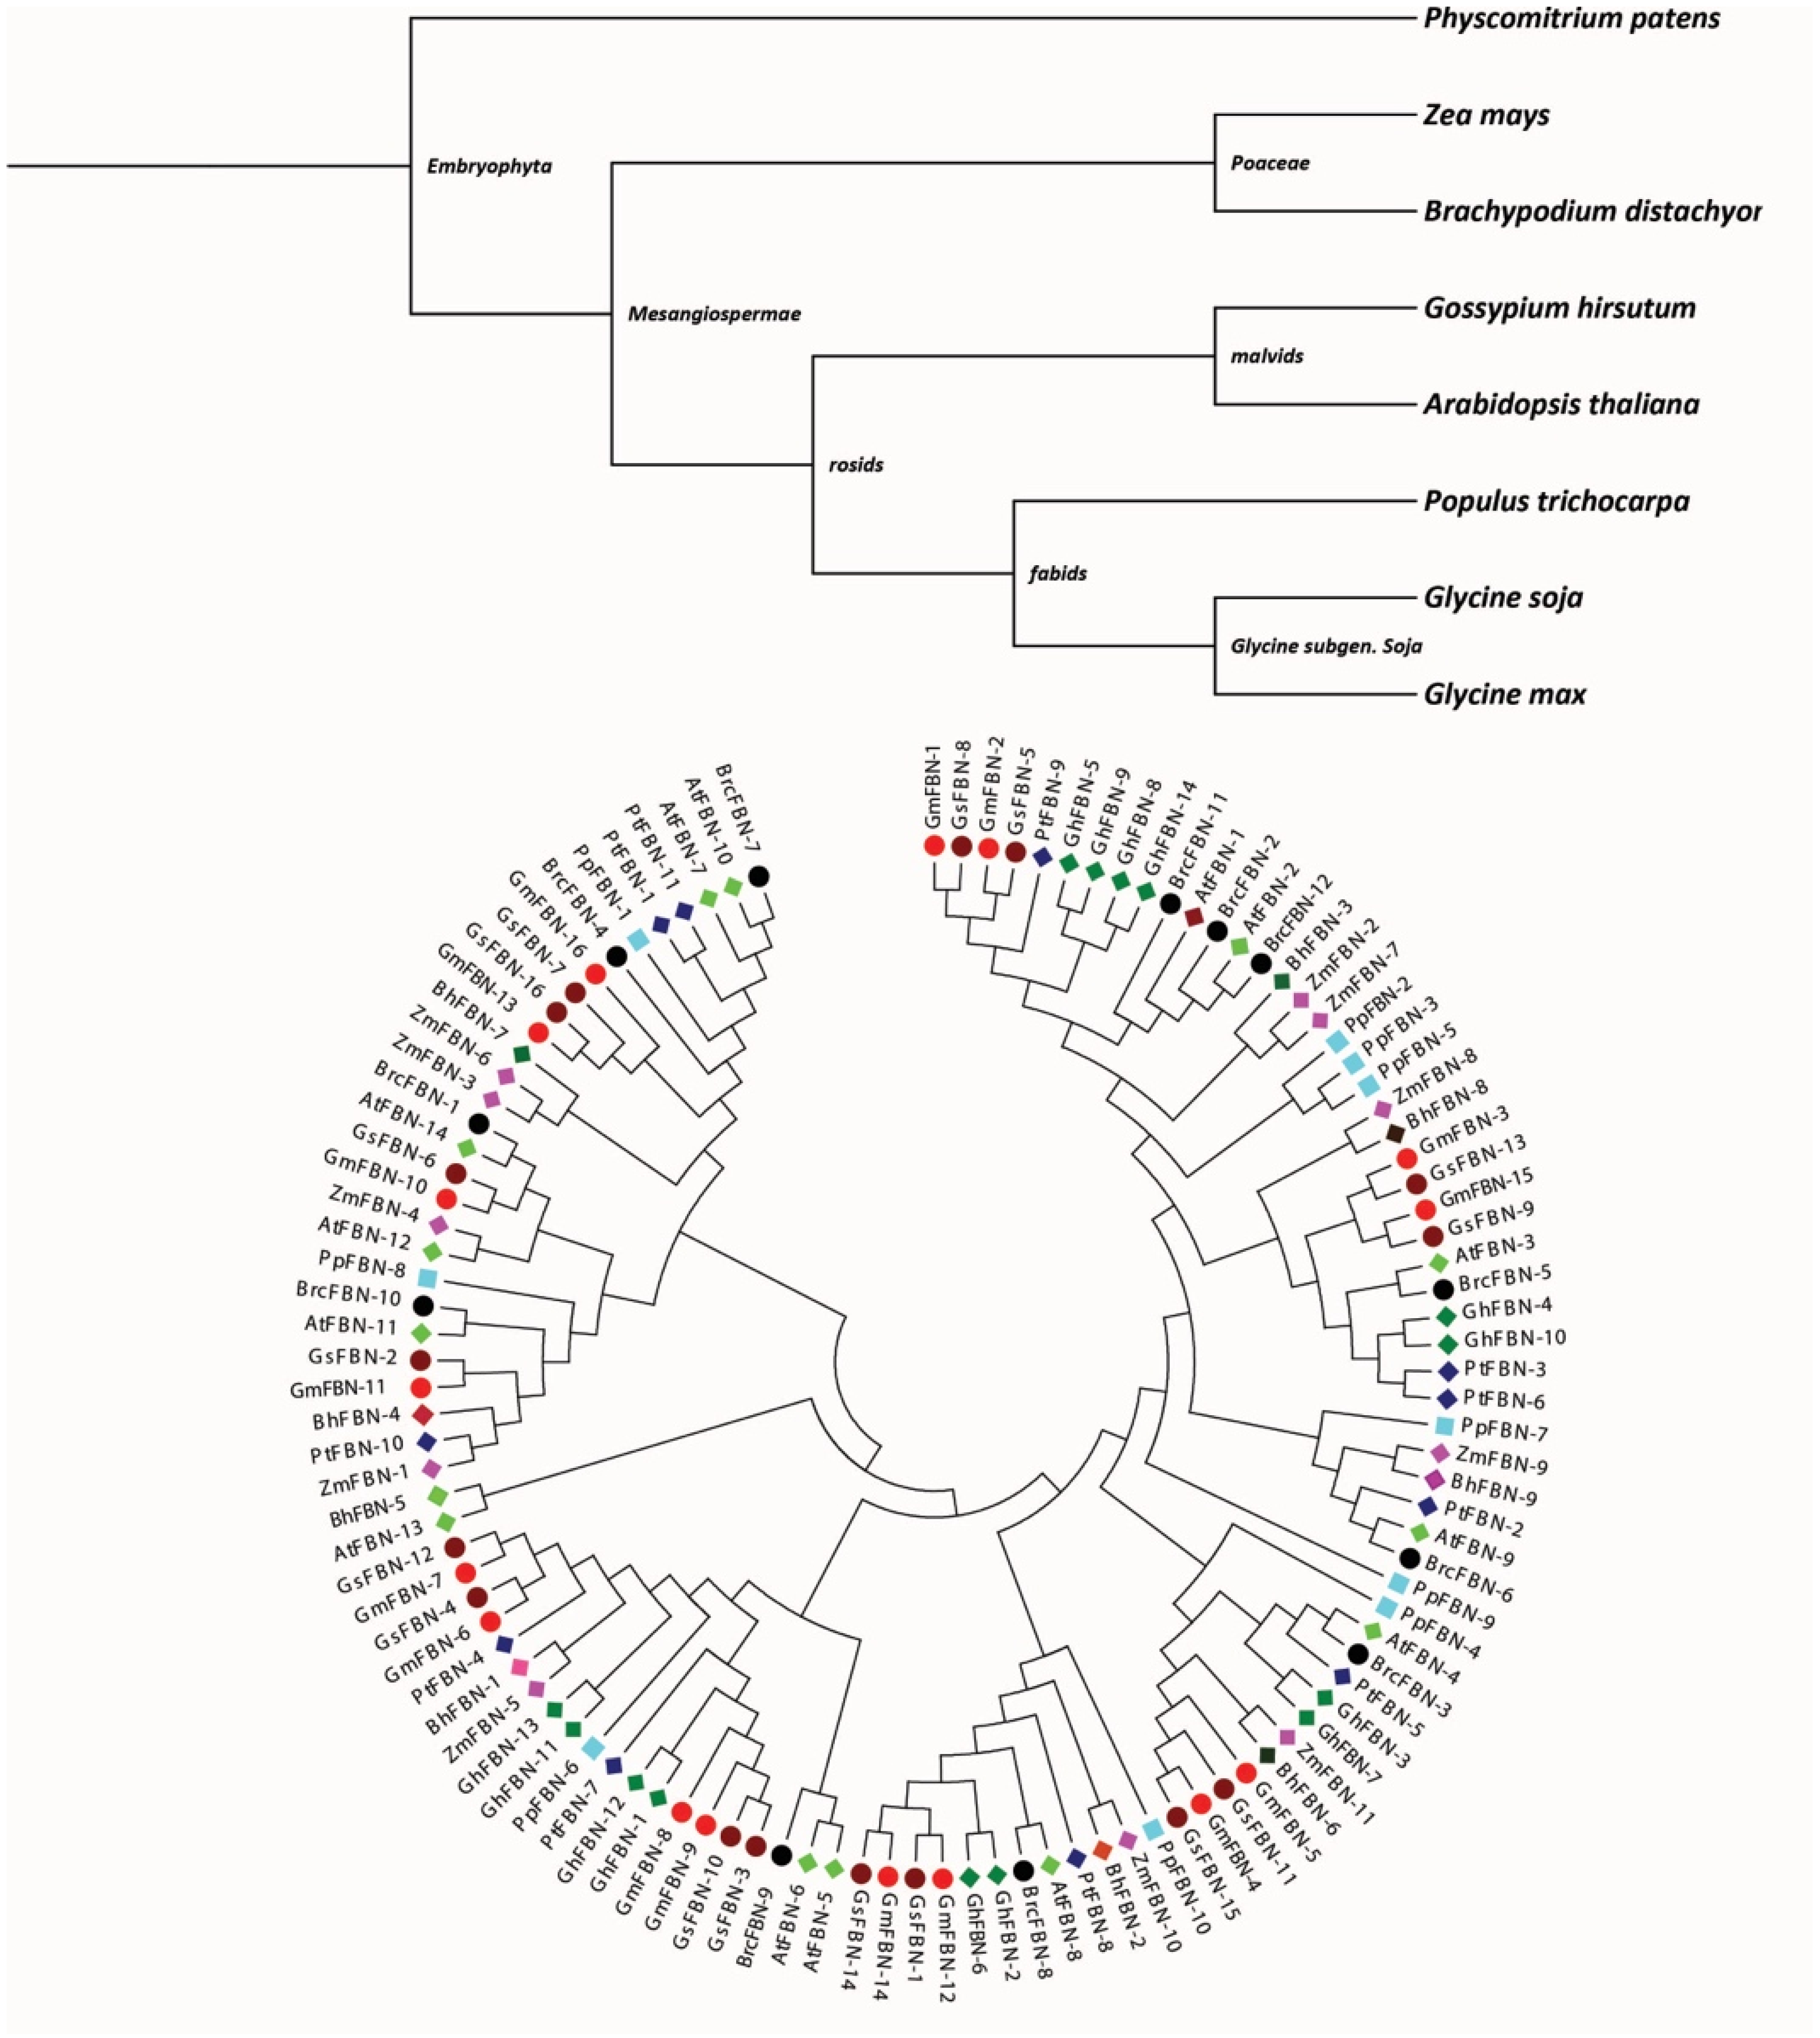
2.2. Phylogenetic Analysis of FBN

The protein sequences of G. max, Arabidopsis thaliana, Glycine soja, Brachypodium distachyon, Gossypium hirsutum, Solanum. melongena, Populus. trichocarpa, Physcomitrella. patens, Zea mays, and Brassica. rapa were aligned. MEGA11 was used to perform phylogenetic analysis using FBN protein sequences of the aforementioned species to determine the evolutionary history of FBN genes. Sequences were aligned using ClustalW, the while Neighbor-Joining (NJ) method was used to deduce evolutionary history [17]. To test the phylogenetic tree, the bootstrap method with 1000 replicates was used.

2.3. Gene Structure, Protein Motif and Cis-Acting Element Analysis

The GSDS 2.0.8. (http://gsds.gao-lab.org accessed on 7 October 2022) server was used to evaluate retrieved coding and genomic sequences from databases to identify the exon-intron structure. To examine the exon-intron structure, BED file and NJ phylogenetic tree data were used. The MEME web portal was utilized to analyze protein motif distributions. A PlantCARE database (accessed on 11 November 2022) [18] was to evaluate 2 kb upstream regions to characterize cis-elements based on their projected biological activities, and results were visualized using TBtools.

2.4. In-Silico Prediction and Physiochemical Properties of FBN in G. max

Physicochemical properties were predicted by ExPASy ProtParam (http://web.expasy.org/protparam/ accessed on 11 October 2022). Data regarding protein length, amino acid composition, protein molecular weight, p-value, and GRAVY score were retrieved for all GmFBNs using ExPASy ProtParam.

2.5. Sequence Logos of FBN Genes

To construct the sequence logos for conserved amino acid residues, multiple sequence alignment of G. max, Z. mays, and A. thaliana was carried out individually by Clustal X 2.0. (http://www.clustal.org/clustal2/ accessed on 16 November 2022), and sequence logos were created using WEBLOG (https://weblogo.berkeley.edu/logo.cgi accessed on 16 November 2022) [19].

2.6. Chromosomal Distribution and Synteny analyses of GmFBN

Soybean genome assemblies files were used to create a chromosomal length file, and data extracted from a physicochemical properties file were used to create a gene location file. These files were then visualized in PhenoGram (http://visualization.ritchielab.org/phenograms/plot accessed on 17 November 2022), following Kumar et al. [20]. To identify potential paralogous FBN gene pairings, a phylogenetic tree was used for interpretation. Rates of synonymous and non-synonymous substitution were calculated using TBtools on the resulting groups of two pairs. Additionally, the Ka/Ks ratio was also examined to determine the pattern of codon selection that occurred during evolution [21]. To perform the synteny analysis, Fa and GFF files of A. thaliana and G. max were used to generate the collinearity data. From previously generated data, collinearity, GFF, and CTL files were used for synteny visualization, following Yang et al. [22].

2.7. In-Silico Gene Expression Analysis of GmFBN

The transcript level values were retrieved from the NCBI GEO Dataset (Accession Number: GSE98958) and used to study the expression of GmFBN genes in dehydration and control conditions (https://www.ncbi.nlm.nih.gov/DataSets/ accessed on 12 December 2022). The FBN expression values (based on FPKM) were extracted to generate the heat map of GmFBNs expressed in response to drought. The heat map was constructed using TBtools software to express the transcript level of the GmFBN genes.

2.8. Soybean Plant Material and Phenotyping

Forty-six soybeans accessions were planted in 2021 at the MNS University of Agriculture, Multan. Following augmented design, the field experiment was conducted under both water-limited (WL) and well-water (WW) experimental units. The field was prepared by laser leveling followed by standard agronomic practices. Briefly, one bag of urea and di-ammonium phosphate per acre were applied before sowing. Each soybean genotype was planted (using 2–3 seed planting sites) in two beds, each measuring 15 feet long and 2.5 feet wide. Plant-to-plant spacing was strictly controlled at 1 foot. Plant thinning was also performed to eradicate unhealthy plants. Weeds were also controlled manually. The WL experimental units were subjected to drought conditions, specifically during the flowering period, while WW experimental units received irrigation once every two weeks. Data regarding maximum and minimum temperature, relative humidity, and rainfall is presented in Supplementary Table S1. Plant height, pods per plant, thousand seed weight, seed weight per pod, seed thickness, seeds per pod, seed length, seed width, and pod length were measured across both experimental units. Plant height was recorded at physiological maturity. Seed length, width, and thickness were measured using scanner S500A3B (Shenzhen Eloam Technology, China) from both water regimes [23]. Thousand seed weight was measured by weighing duplicate samples of almost 500 seeds from each soybean genotype [23].

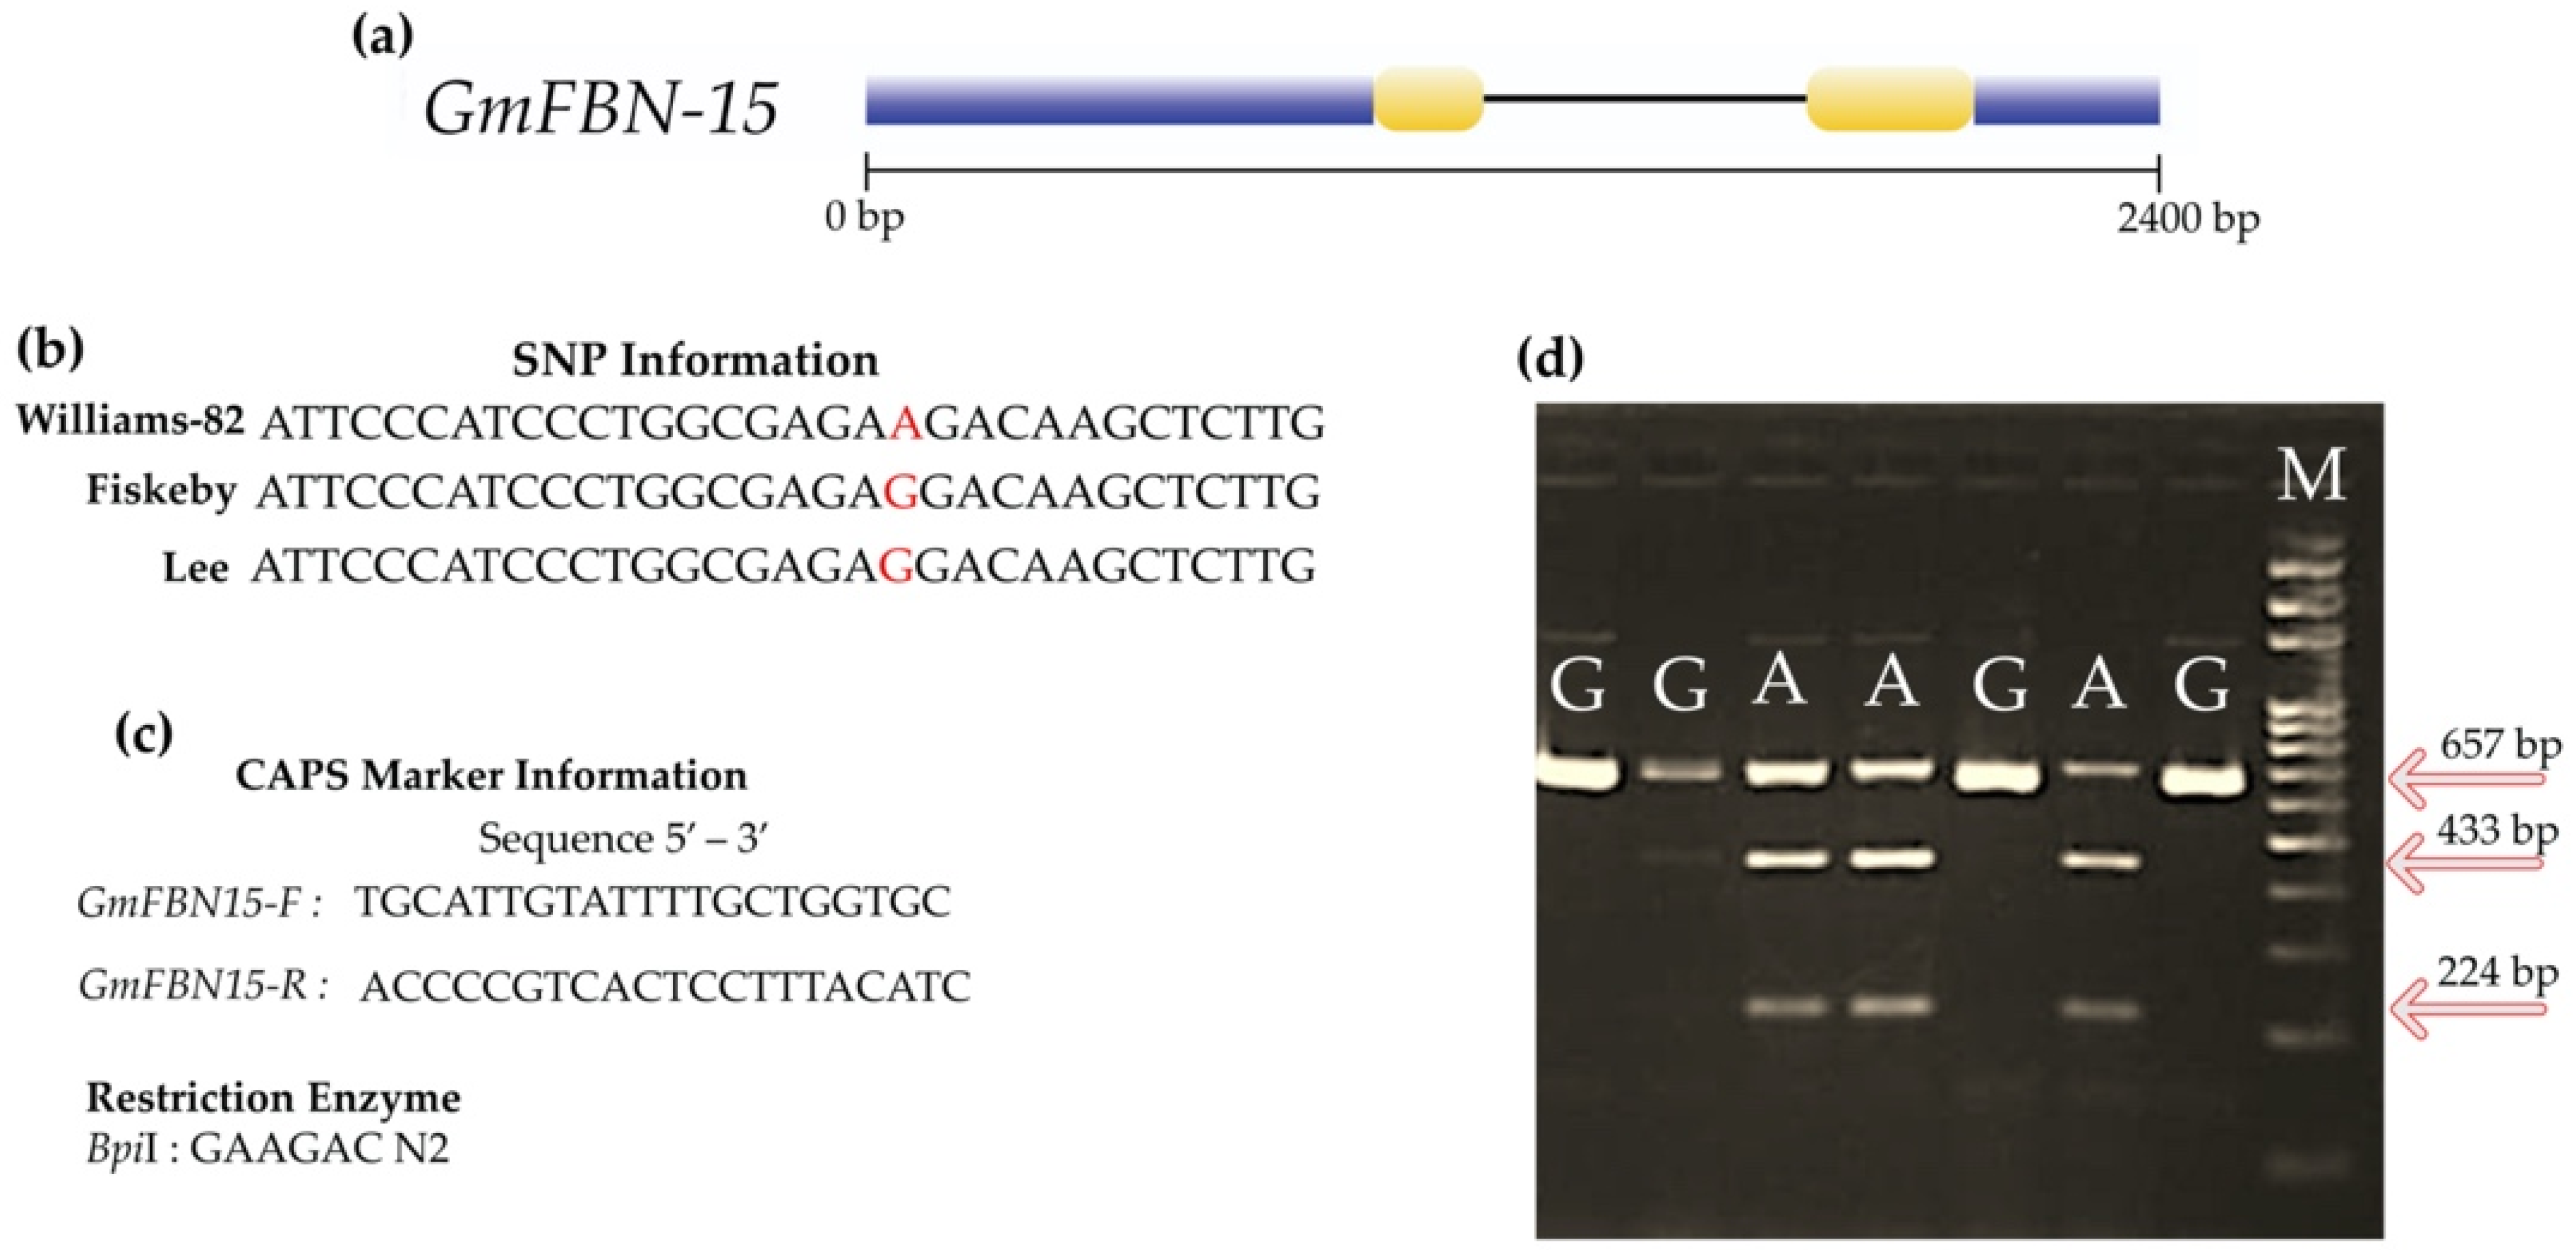
2.9. Development of Single Nucleotide Polymorphism Based Cleaved Amplified Polymorphic Sequence (CAPS) Marker for GmFBN-15

The CTAB method was used to isolate genomic DNA from soybean seedling leaves [24]. DNA concentration was measured with a NANO-Drop (K5800C MicroSpectrophotometer) followed by running on 1.0% agarose gel to perform quality checks. After extraction, concentrated and diluted (100 ng/µL) DNA samples were placed at −80 °C for later usage.
The whole genome sequence of three cultivars of soybean (Williams-82, Fiskeby, and Lee) was downloaded from (https://phytozome-next.jgi.doe.gov/ 21 September 2022). The GmFBN sequences in the above-mentioned soybean cultivars were retrieved using Local BLAST. The Seqman program from the DNASTAR Lasergene package was used for multiple sequence alignment, which revealed sequence polymorphism only in GmFBN-15. This approach has been reported earlier by Nisar et al. and Fatima et al. [1,2]. Standard cleaved amplified polymorphic sequence (CAPS) guidelines were followed to develop the CAPS marker on the identified single nucleotide polymorphism (SNP) of GmFBN-15.
The CAPS marker was developed on the identified SNP of GmFBN-15. From the PAN-genome, we identified that Williams-82 carried the GmFBN-15-A allele at 433 nt, while Fiskeby and Lee contained the GmFBN-15-G at the respective location (https://www.soybase.org/dlpages/ accessed on 21 September 2022). Specific primers were designed flanking the SNP at 433 bp. The PCR recipe, 2.0 µL of genomic DNA at 100 ng/µL, 0.5 µL of forward and reverse primers at 10 µm, 6.0 µL of 2× PCR Master Mix (NOVOPROTIEN, China), and 4 µL ddH2O, was used to make a final volume of 13.0 µL. DNA thermal cycler (BIO-RAD, Model No. T100TM Thermal Cycler) was used to amplify the target region. The PCR reaction was: denaturation at 94 °C for 3 min, followed by multiple cycles (32 cycles for GmFBN-15) of denaturation at 94 °C for 30 s, annealing at temperature 56.7 °C for 30 s, extension at 72 °C for 25 s, and a 5 min final extension at 72 °C. The amplified PCR product was then subjected to digestion using BpiI restriction enzyme. The conditions for enzymatic digestion were: 5.0 µL of PCR product, 0.2 µL BpiI FastDigest enzyme, 1 µL 10× FastDigest Green Buffer, and 9.0 µL nuclease-free water for each sample, and incubation at 37 °C for ~20 min followed by gel electrophoresis. Agarose gel (2.5%) was used to separate the digested fragments, in 1× Tris-borate-EDTA (TBE) at 90 volts for 30 min.

2.10. Statistical Analyses

Descriptive statistics were conducted using Microsoft Excel 2019. The effect of each allelic variation on the observed phenotypic traits was analyzed using the Student’s t-test at a significance level of p < 0.05.

3. Results

3.1. Identification of FBNs Gene Family Members in Different Species

A total of 113 FBN genes were retrieved from nine different species, including A. comosus (angiosperm), A. thaliana, G. max, G. soja, G. hirsutum, B. rapa and P. trichocarpa (dicotyledons), B. distachyon and Z. mays (monocotyledons), and P. patens (Bryophyte). Among these, 16 FBN genes were identified in G. max, 16 in G. soja, 14 in A. thaliana, 11 in Z. mays, 12 in B. rapa, 14 in G. hirsutum, 11 in P. trichocarpa, 9 in B. distachyon, and 10 in P. patens. Gene IDs of the studied species are presented in Supplementary Table S2. We found that almost all the selected organisms had at least nine FBN genes (B. distachyon lowest number of FBNs), indicating that the FBN genes were subjected to large-scale expansion.

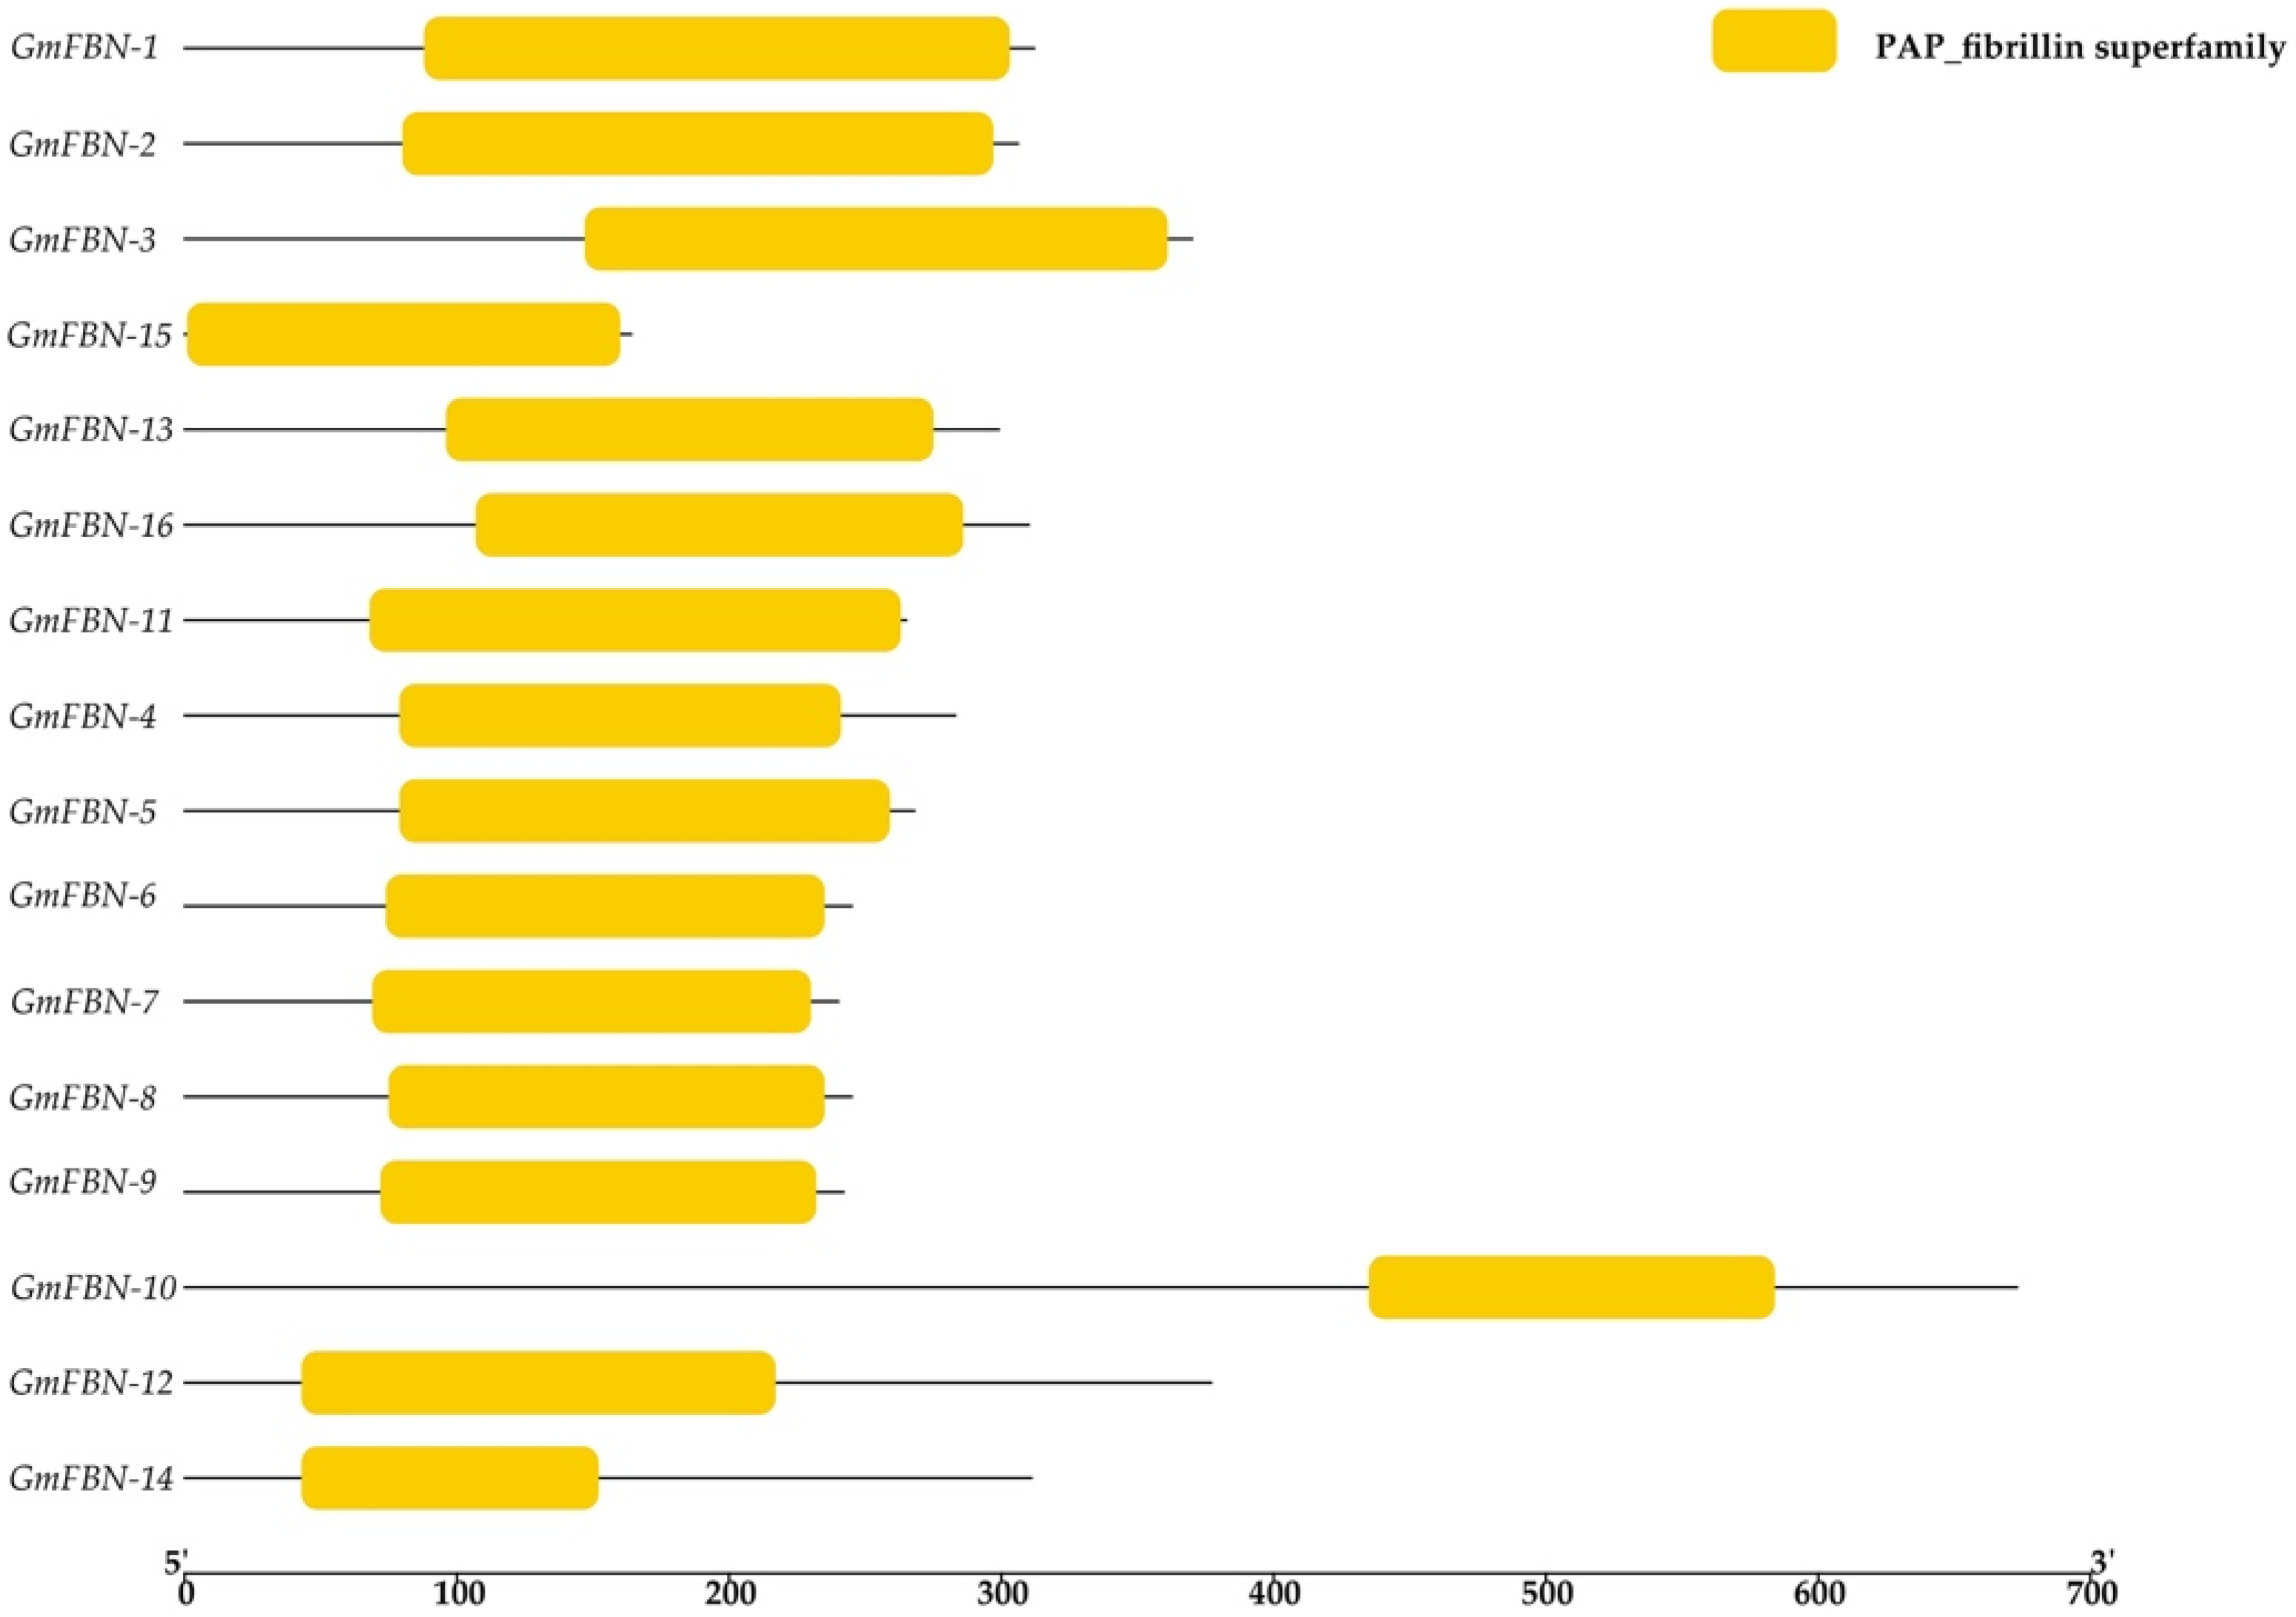
3.2. Conserved Domain, Gene Structure, Protein Motif Analysis and Cis-Acting Elements

Conserved motifs play a vital role in the basic functions of gene families. Multiple alignments of FBN protein sequences revealed that the FBN genes contained conserved the PAP fibrillin superfamily domain in all GmFBN genes. The PAP fibrillin superfamily domain was around 100 amino acids long and was present in the GmFBN genes (Figure 1). The structure of the PAP fibrillin domain, which is also a conserved domain, serves as a foundation for the categorization of fibrillin protein. The genomic and coding sequences were used to construct the gene structure. The intron numbers ranged from 1–11 (Figure 2). Using MEME, (Multiple Em for Motif Elicitation), we found that 16 GmFBN genes shared a total of 10 conserved motifs. There were a total of 6 motifs in GmFBN-1, GmFBN-2, and GmFBN-3. There were 4 and 5 in GmGBN-4 and GmFBN-5, respectively. Six each were present in GmFBN-6, GmFBN-7, GmFBN-8, and GmFBN-9. GmFBN-10 had 3, GmFBN-11 had 4, GmFBN-12 had 6, GmFBN-13 had 4, GmFBN-14 had 5, GmFBN-15, and GmFBN-16 each had 4 (Figure 3). Additionally, we identified cis-acting elements that were found in the upstream regions of GmFBN (Figure 4a). The cis-acting elements present in all GmFBNs were involved in processes such as plant growth, stress tolerance, and photosynthesis (Figure 4b).

3.3. Phylogenetic Analysis of FBNs Gene Family

To understand the evolutionary relationships among FBNs and explore the extent of diversification of this gene family, a phylostartum and phylogenetic tree was constructed. Phylostratum analysis of FBN genes identified the primitive ancestry as FBN genes were present in P. patens (Bryophyte), one of the early plant pedigrees (Figure 5). The FBN gene family existed in A. comosus (angiosperm), A. thaliana, G. max, G. soja, G. hirsutum, B. rapa and P. trichocarpa (dicotyledons), B. distachyon and Z. mays (monocotyledons), and P. patens (Bryophyte) (Supplementary Table S2). According to these findings, FBNs that evolved from primitive plants and potential orthologous genes are present throughout kingdom Plantae. Next, an NJ tree was constructed to estimate the deeper relationships of FBN genes in the studied organism. Upon closer inspection of the phylogenetic tree, six distinct clades were identified, each representing a distinct stage in the transition from single-celled to multicellular life. Clade-1 was the largest and comprised 32 genes from virtually all species. Clade-1 contained genes from angiosperm, dicots, monocots and bryophytes, indicating the evolution of these FBN genes after the split of lycophytes, chlorophytes and bryophytes. Hence Clade-1 can be considered the earliest group of FBN genes, having FBN gene family members from all the studied organisms. The phylogenetic analyses indicated that G. max experienced gene family expansion because it had more FBN genes compared to the other studied organisms, except G. soja. Generally, GmFBNs and GsFBNs cluster together in the phylogenetic tree, which can be interpreted as evidence of a common pedigree.
Overall, it was observed that the orthologs of the FBN gene family were present throughout the plant kingdom, indicating that the family originated from organisms such as P. patens through the course of evolution. In order to evaluate the extent of conservation within the FBN protein family, multiple sequence alignment was used to create sequence logos for each amino acid residue among G. max, Z. mays, and A. thaliana. We found that there were no conservation regions of G. max with G. soja, and A. thaliana, except M(1) in G. max, Z. mays, and A. thaliana (Figure 6). Additionally, sequence logos give a clear picture of how all the species are diverse. Furthermore, it can be deduced that the FBN gene family is universally less conserved among different species.

3.4. In-Silico Prediction and Physiochemical Properties of FBN in G. max

As our main focus was G. max so further, basic information for GmFBNs, i.e., gene length, CDS length, protein length, protein molecular weight, isoelectric point, gravity, and predicted sub-cellular location are provided in Supplementary Table S3. GmFBN-1-GmFBN-16 included proteins with lengths ranging from 164 to 674 amino acids. The GmFBN genes’ CDS (coding sequence) lengths ranged from 495 bp to 2022 bp, and the gene lengths ranged from 1610 bp to 7747 bp, from GmFBN-1 to GmFBN-16. The calculated molecular weight of GmFBN-1–GmFBN-16 was between 17,669.25 and 75,594.61 kDa. The theoretical isoelectric point (pI) for GmFBN proteins was studied to be in the range of 5.24 to 9.69. As a further note, GmFBN proteins had GRAVY values ranging from –0.039 to –0.327 (Supplementary Table S3). GmFBN sub-cellular localizations were hypothesized to help identify its expression in distinct cellular and organelle contexts. The predicted sub-cellular localizations of GmFBN indicated that they were all found in the inner membrane. It was predicted that the vast majority of GmFBNs would be found in chloroplasts (Figure 7).

3.5. Chromosomal Distribution, Gene Duplication and Synteny Analysis

The position of the GmFBN genes on the G. max chromosomes was predicted through chromosomal localization analysis. A total of 16 GmFBN genes were distributed on the nine chromosomes. GmFBN-3, GmFBN-13, GmFBN-4, and GmFBN-10 were mapped on chromosomes 1, 2, 5, and 6 respectively. GmFBN-5, GmFBN-7, and GmFBN-9 were identified on chromosome 8. GmFBN-1, GmFBN-16, and GmFBN-15 were mapped on chromosome 9. GmFBN-14 was located on chromosome 10. GmFBN-2, GmFBN-6, and GmFBN-8 were located on chromosome 15 while GmFBN-11 and GmFBN-12 were located on chromosome 2. In addition, this analysis revealed there are seven paralogs (Supplementary Table S4). The segmental duplication event was detected between GmFBN-1 and GmFBN-2, GmFBN-3 and GmFBN-15, GmFBN-4 and GmFBN-5, GmFBN-6 and GmFBN-7, GmFBN-8 and GmFBN-9, GmFBN-13 and GmFBN-16, and GmFBN-12 and GmFBN-14, respectively (Figure 8a). We performed synteny analyses, in which we observed the location of two genes on a chromosome to see how they were linked. The synteny analysis proved that all GmFBNs had a certain degree of genetic similarity.
The expansion of a gene family is dependent on whole genome duplication, tandem duplication, and segmental duplication. Among the analyzed gene pairs, 10 were found to have been duplicated due to segmental duplication. GmFBN-1 represented collinearity between chromosome 9 in G. max and chromosome 4 in A. thaliana. The GmFBN-2 represented collinearity between chromosome 15 in G. max and chromosome 4 in A. thaliana. GmFBN-3 represented collinearity between chromosome 1 in G. max and chromosome 2 in A. thaliana. GmFBN-5 represented collinearity between chromosome 8 in G. max and chromosome 5 in A. thaliana. GmFBN-11 represented collinearity between chromosome 20 in G. max and chromosome 3 in A. thaliana. GmFBN-13 represented collinearity between chromosome 2 in G. max; its one copy was present on chromosome 2 and its second copy was present on chromosome 3 in A. thaliana. GmFBN-15 represented collinearity between chromosome 9 in G. max and chromosome 2 in A. thaliana. GmFBN-16 indicated collinearity between chromosome 2 in G. max; its one copy was present on chromosome 2 and its second copy was present on chromosome 3 in A. thaliana, respectively (Figure 8b).
The synteny analysis between G. max and A. thaliana revealed that both species had conserved regions. The results showed that there was strong conservation of some gene loci between GmFBN and AtFBN. According to Darwinian theory (natural selection), we investigated non-synonymous and synonymous divergence levels (Ka and Ks, respectively) between GmFBN gene pairs. It was established that six duplicated gene pairs showed Ka/Ks values <0.5, whereas one duplicated gene pair showed Ka/Ks values of 0.5 (Table 1 and Supplementary Table S4). While no pairs showed Ka/Ks value greater than 1. Ka/Ks of the examined gene pairs were typically less than 1, indicating that the GmFBN gene family was subject to purifying selection pressure with limited functional divergence. This functional divergence might take place after a segmental duplication event during polyploidization followed by hybridization in soybean evolution.

3.6. In-Silico Gene Expression Analysis GmFBN

The Gene Expression Omnibus (GEO) dataset was used to investigate GmFBN gene expression. As a transcriptional activator, GmFBN controls the activity of several genes involved in responding to stress. These genes are involved in the Ca2+ signaling route, the ABA signaling system, or both. Expression analyses through RNA-seq were performed on three different samples of transgenic soybeans (designated A004A, A005B, and B010C), and on null (control) plants for comparison [25]. Gene expression profiles in response to drought were generated using the sequence data as reported by Wei et. al. [25]. In response to drought, the soybean plant relied on GmFBN-2, GmFBN-1, GmFBN-10, GmFBN-11, and GmFBN-15 members of the fibrillin gene family that were found to be strongly upregulated by the gene expression analyses (Figure 9).

3.7. Development of SNP Based Marker Using CAPS Technique and Marker Trait Association Analysis

For GmFBN-15, a polymorphic site was identified in the coding region. To distinguish the allelic variation, one molecular marker (GmFBN-15-F/R) was developed using the CAPS technique. One allelic variation (A-allele) had a BpiI restriction site, un-restricted for G-allele (Figure 10). For GmFBN-15, 30% of the studied germplasm possessed a GmFBN-15-A allele, while 70% possessed a GmFBN-15-G allele. Association analysis was performed on studied traits under both growing environments, and a statistically non-significant association was found for all traits except thousand seed weight. GmFBN-15-A showed an association with higher thousand seed weight under both water regime conditions (Figure 11).

4. Discussion

FBN genes have been characterized in different organisms, including Arabidopsis, brassica, rice, cucumber, wheat, chickpea, and tobacco [4,7,8,9,10,13]. To date, no comprehensive assessment of GmFBN genes has been carried out. We performed detailed bioinformatics analyses of GmFBN in order to characterize FBN and its potential use in soybean molecular breeding. Overall, the results of this work provide basic information and lay the foundation for further work into the FBN gene function in soybean. In this study, we identified 16 FBN genes in the soybean genome. These genes were distributed on nine chromosomes (Figure 8a). All of the identified GmFBN genes were localized in chloroplast and contained chloroplast transit peptides. These results provided clear evidence that many FBNs might play a role in photosynthesis. GRAVY was used to determine the hydrophobicity of each protein sequence, with higher positive values suggesting a more hydrophobic protein. Protein hydrophobicity may be influenced by their spatial organization and the proportion of hydrophobic residues they contain [10].
To analyze the evolutionary relationships of the FBN genes, we constructed a phylogenetic tree with a total of 113 FBN genes in nine investigated species, including A. comosus (angiosperm), A. thaliana, G. max, G. soja, G. hirsutum, B. rapa and P. trichocarpa (dicotyledons), B. distachyon and Z. mays (monocotyledons), and P. patens (Bryophyte). Members of the GmFBNs gene family were distributed widely in all the phylogenetic groups. Based on these findings, it appears that the FBN genes in these monocots that were in the same clade might have a similar biological function. Furthermore, the evolutionary study provides a base for future functional studies on FBN genes in soybean.
We identified 16 GmFBN genes in the G. max genome (~978 Mb) which were higher in number compared to P. trichocarpa (~500 Mb genome), P. patens (~500 Mb genome), and A. thaliana (~125 Mb genome). The probable reason for the larger number of FBNs in G. max (16), as compared to P. trichocarpa (11), P. patens (10), and A. thaliana (14), is that G. max is allotetraploid and the uneven distribution of GmFBNs on G. max chromosomes shows probable gene addition through segmental duplication incidents. It has been reported that gene duplication and divergence generally leads towards evolution [1,2,21]. The gene duplication phenomenon is crucial for speciation and adaptability in ever-changing environmental conditions. We found duplicated genes present on different chromosomes of the same sub-genome. This duplication might be a consequence of segmental or whole genome duplication (Figure 8b). Almost 65 MYA segmental and whole genome duplications in primitive plants have contributed to the expansion of the number of gene families. Hence it can be anticipated that FBN also expanded and contributed to the genome complexity of plants.
Gene structure analyses exhibited that GmFBNs have varied intron lengths that might play crucial roles in the functional divergence of GmFBNs. It has been well documented that intron played an important role in the evolution of different species [1,2].
Gene function determines the extent to which a gene is expressed in various tissues and at various times during development. Several research works have reported the effects of abiotic stress on FBNs, and it is evident that they are regulated by a wide range of biological and environmental factors [10,11,12,25]. The expression of cis-regulatory elements in downstream genes is regulated by transcription factors, which play a role in a wide range of biological activities [25]. The promoter sequences of the GmFBN genes contained numerous cis-regulatory elements. Hormonal-responsive elements, including MeJA, abscisic acid, gibberellic acid, salicylic acid, and auxin, were also present in this blend, and these factors are connected in their response to light and drought. Unexpectedly, several components associated with light sensitivity were also present in all GmFBN genes.
Over the last ~100 years soybean genetic gain is estimated to be ~12 kg/acre [26]. This improvement has largely been attained by breeding for grain yield following conventional breeding and selection approaches. The coupling of these approaches with genomic tools will definitively fast-track the genetic gain in crop plants [27]. The soybean PAN-genome has the potential to close the phenotype-genotype gap in soybean breeding. PAN-genome has recently been utilized to identify genes in G. soja that regulate flowering timing [3]. In order to keep improving soybeans, it is essential to use marker-assisted selection to identify important best genes. If efficient molecular platforms are available, the application of elite allelic variants in cultivars can be increased [1,2,27,28,29,30]. The sequence polymorphism of GmFBN was investigated in this study using the G. max PAN-genome. All GmFBN genes were analyzed for sequence polymorphism; however, allelic variation was only found in the GmFBN-15 coding area. Therefore, in order to conduct marker-trait association studies, only this candidate gene was considered. Allele fixation throughout evolution may account for the lack of variation in the other GmFBN genes, or this may be related to the small sample size of accessible G. max accessions in PAN-genomics research. Additional research is needed to confirm or explore these two possibilities. SNP-based molecular markers are easy to deal with and offer higher throughput compared to other markers [31,32]. A single nucleotide polymorphism was found in GmFBN-15. Williams-82 contained A-allele while the other two cultivars contained G-allele at that point [Figure 11b]. Although there was only one restriction site in 657 bp fragment length and it should produce only two bands (at 433 bp and 224 bp) on agarose gel, it still produced three bands for the genotypes carrying A-allele. The probable reason is that the GmFBN-15-F/GmFBN-15-R (primer pair) might have amplified the paralog of GmFBN-15, which is GmFBN-3 present on chromosome 1.
This study provides useful information for GmFBN genes in that members of the FBN gene family may improve plant performance for abiotic stress and increase yield-related traits in different stages, and can be used further for soybean breeding programs. The findings presented here will be useful for future studies into the biological roles of GmFBN genes.

5. Conclusions

In this study, we analyzed 113 different FBN genes in nine different organisms. Bioinformatics analyses revealed that FBN genes are relatively less conserved and contain cis-acting elements necessary for plant growth and development, and respond to various external stimuli, including drought. Moreover, marker-trait association analyses also highlighted the potential role of FBN in soybean molecular breeding.

Supplementary Materials

The following supporting information can be downloaded at: https://www.mdpi.com/article/10.3390/genes14061188/s1. Table S1: Weather conditions; Table S2: Gene IDs; Table S3: Physio-chemical properties; Table S4: Collinearity, synteny and Ka/Ks analyses of GmFBN gene family.

Author Contributions

Conceptualization, S.U.R.; Data curation, M.Z.Z., M.A.B., U.W. and M.S. (Maria Siddique); Analysis, M.Z.Z.; Funding acquisition, X.G. and Z.G.; Investigation, M.Z.Z. and M.S. (Muhammad Sajjad); Methodology, M.Z.Z.; Project administration, S.U.R.; Resources, M.H.N.T. and Z.G.; Supervision, S.U.R.; Visualization, Z.K., M.S. (Muhammad Sajjad) and M.A.B.; Writing—original draft, M.Z.Z.; Writing—review and editing, M.H.N.T., Z.K., M.S. (Muhammad Sajjad), X.G., U.W. and M.S. (Maria Siddique). All authors have read and agreed to the published version of the manuscript.

Funding

This research was funded by the Key Technology and Science Promotion Cooperation Based on the Whole Industrial Chain of Bean, Project Number: GHJD-2020025, and the Punjab Agricultural Research Board, Project Number: PARB-830.

Institutional Review Board Statement

The study did not require ethical approval.

Informed Consent Statement

Not applicable.

Data Availability Statement

The datasets presented in this study can be found in online repositories. The names of the repository/repositories and accession number(s) can be found in the article Supplementary Material.

Acknowledgments

The authors are grateful to the Director of University Farms, Abdul Ghaffar, and the Deputy Director of University Farms, Mahmood Alam Khan, MNS University of Agriculture, Multan (MNSUAM), for providing the facility to conduct field research. The authors are also thankful to Habib Ur Rahman, lecturer, Department of Agronomy, MNSUAM, for providing the air temperature (°C) maximum and minimum, relative humidity, and rainfall data. We also acknowledge Muhammad Awais (PBG-8th-Semester-2019-uam-455, MNSUAM) for his contribution to improve the quality of images.

Conflicts of Interest

The authors declare no conflict of interest.

References

  1. Nisar, T.; Tahir, M.H.N.; Iqbal, S.; Sajjad, M.; Nadeem, M.A.; Qanmber, G.; Baig, A.; Khan, Z.; Zhao, Z.; Geng, Z.; et al. Genome-wide characterization and sequence polymorphism analyses of cysteine-rich poly comb-like protein in Glycine max. Front. Plant Sci. 2022, 13, 996265. [Google Scholar] [CrossRef] [PubMed]
  2. Fatima, C.; Tahir, M.H.N.; Ikram, M.; Khan, Z.; Sajjad, M.; Qanmber, G.; Darwish, E.; Geng, Z.; Xiangkuo, G.; Rehman, S.U. Characterization of Histone H3 gene family reveals that GmHH3-3 is associated with higher seed weight in Glycine max. Front. Genet. 2022, 13, 949027. [Google Scholar] [CrossRef] [PubMed]
  3. Li, Y.H.; Zhou, G.; Ma, J.; Jiang, W.; Jin, L.G.; Zhang, Z. De novo assembly of soybean wild relatives for pan-genome analysis of diversity and agronomic traits. Nat. Biotechnol. 2014, 32, 1045–1052. [Google Scholar] [CrossRef] [PubMed]
  4. Kim, E.H.; Lee, Y.; Kim, H.U. Fibrillin 5 is essential for plastoquinone-9 biosynthesis by binding to solanesyl diphosphas in Arabidopsis. Plant Cell 2015, 27, 2956–2971. [Google Scholar] [PubMed]
  5. Deruere, J.; Romer, S.; D’harlingue, A.; Backhaus, R.A.; Kuntz, M.; Camara, B. Fibril assembly and carotenoid overaccumulation in chromoplasts: A model for supramolecular lipoprotein structures. Plant Cell 1994, 6, 119–133. [Google Scholar]
  6. Pozueta-Romero, J.; Rafia, F.; Houlne, G.; Cheniclet, C.; Carde, J.P.; Schantz, M.L.; Schantz, R. A ubiquitous plant housekeeping gene, PAP, encodes a major protein component of bell pepper chromoplasts. Plant Physiol. 1997, 115, 1185–1194. [Google Scholar] [CrossRef]
  7. Ting, J.T.; Wu, S.S.; Ratnayake, C.; Huang, A.H. Constituents of the tapetosomes and elaioplasts in Brassica campestris tapetum and their degradation and retention during microsporogenesis. Plant J. 1998, 16, 541–551. [Google Scholar] [CrossRef]
  8. Kim, E.H.; Lee, D.W.; Lee, K.R.; Jung, S.J.; Jeon, J.S.; Kim, H.U. Conserved function of fibrillin 5 in the plastoquinone pathway in Arabidopsis and rice. Front. Plant Sci. 2017, 8, 1197. [Google Scholar] [CrossRef]
  9. Kim, I.; Lee, S.C.; Kim, E.H.; Song, K.; Yang, T.J.; Kim, H.U. Genome-wide identification and expression analyses of the fibrillin family genes suggest their involvement in photoprotection in cucumber. Plants 2018, 7, 50. [Google Scholar] [CrossRef]
  10. Jiang, Y.; Hu, H.; Ma, Y.; Zhou, J. Genome-wide identification and characterization of the fibrillin gene family in Triticum aestivm L. PeerJ 2020, 8, e9225. [Google Scholar] [CrossRef]
  11. Sun, H.; Ren, M.; Zhang, J. Genome-wide identification and expression analyses of fibrillin (FBN) gene family in tomato(Solanum lycopersicum L.). PeerJ 2022, 10, e13414. [Google Scholar] [CrossRef]
  12. Pandey, A.; Sharma, P.; Mishra, D.; Dey, S.; Malviya, R.; Gayen, D. Genome-wide identification of fibrillin gene family in chickpea (Cicer arietium L.) and its response to drought stress. Intl. J. Biol. Macromol. 2023, 15, 123757. [Google Scholar] [CrossRef]
  13. Singh, D.K.; McNellis, T.W. Fibrillin protein function the tip of the iceberg? Trends Plant Sci. 2011, 16, 432–441. [Google Scholar] [CrossRef]
  14. Gasteiger, E.A.; Gattiker, C.; Hoogland, I.; Ivanyi, R.D.; Appel, A.; Bairoch, A. ExPASy: The proteomics server for in-depth protein knowledge and analysis. Nucleic Acids Res. 2003, 31, 3784–3788. [Google Scholar] [CrossRef]
  15. Briesemeister, S.; Rahnenfuhrer, J.; Kohlbacher, O. YLoc-an interpretable web server for predicting subcellular localization. Nucleic Acids Res. 2010, 38, 497–502. [Google Scholar] [CrossRef]
  16. Horton, P.; Park, K.J.; Obayashi, T.; Fujita, N.; Harada, H.; Adams-Collier, C.J.; Nakai, K. WoLF PSORT: Protein localization predictor. Nucleic Acids Res. 2007, 35, W585–W587. [Google Scholar] [CrossRef]
  17. Tamura, K.; Stecher, G.; Kumar, S. MEGA11: Molecular evolutionary genetics analysis version 11. Mol. Biol. Evol. 2021, 38, 3022–3027. [Google Scholar] [CrossRef]
  18. Lescot, M.; Déhais, P.; Thijs, G.; Marchal, K.; Moreau, Y.; Van De Peer, Y.; Rouzé, P.; Rombauts, S. PlantCARE base of plant cis-acting regulatory elements and a portal to tools for in silico analysis of promoter sequences. Nucleic Acids Res. 2002, 30, 325–327. [Google Scholar] [CrossRef]
  19. Crooks, G.; Hon, G.; Chandonia, J.M.; Brenner, S.E. WebLogo: A sequence logo generator. Genome Res. 2004, 14, 1188–1190. [Google Scholar] [CrossRef]
  20. Kumar, A.; Sandhu, N.; Kumruthi, P.; Singh, J.; Kaur, S.; Chhuneja, P. Genome-wide identification and in silico analysis of NPF, NRT2, CLC and SLAC1/SLAH nitrate transporters in hexaploid wheat (Triticum aestivum). Sci. Rep. 2022, 12, 11227. [Google Scholar] [CrossRef]
  21. Mayrose, I.; Doron-Faigenboim, A.; Bacharach, E.; Pupko, T. Towards realistic codon models: Among site variability and dependency of synonymous and non-synonymous rates. Bioinformatics 2007, 23, i319–i327. [Google Scholar] [CrossRef] [PubMed]
  22. Yang, Z.; Gong, Q.; Qin, W.; Yang, Z.; Cheng, Y.; Lu, L.; Ge, X.; Zhang, C.; Wu, Z.; Li, F. Genome-wide analysis of WOX genes in upland cotton and their expression pattern under different stresses. BMC Plant Biol. 2017, 17, 113. [Google Scholar] [CrossRef] [PubMed]
  23. Zafer, Z.M.; Tahir, M.H.N.; Bakhtavar, M.A.; Darwish, E.; Khan, M.A.; Khan, Z.; Fatima, C.; Aftab, A.; Rahman, S.U.; Rehman, S.U. Drought susceptibility index; a preferred criterion in screening for tolerance in soybean. J. Bioresour. Manag. 2023, 10, 8. [Google Scholar]
  24. Ali, Q.; Salisu, I.B.; Raza, A.; Shahid, A.A.; Rao, A.Q.; Husnain, T.A. Modified protocol for rapid DNA isolation from cotton (Gossypium spp.). MethodsX 2019, 6, 259–264. [Google Scholar] [CrossRef]
  25. Wei, W.; Liang, D.W.; Bian, X.H.; Shen, M.; Xiao, J.H.; Zhang, W.K.; Ma, B.; Lin, Q.; Lv, J.; Cen, S.Y.; et al. GmWRKY54 improves drought tolerance through activating genes in abscisic acid and Ca2+ signaling pathways in transgenic soybean. Plant J. 2019, 100, 384–398. [Google Scholar] [CrossRef]
  26. Rincker, K.; Nelson, R.; Specht, J.; Cart, T.; Cianzio, S.R.; Casteel, S.; Conley, S.; Chen, P.; Davis, V.; Fox, C. Genetic improvement of US soybean in maturity groups, II, III and IV. Crop Sci. 2014, 54, 1419–1432. [Google Scholar] [CrossRef]
  27. Rasheed, A.; Hao, Y.; Xia, X.; Khan, A.; Xu, Y.; Varshney, R.K.; He, Z. Crop breeding chips and genotyping platforms: Progress, challenges, and perspectives. Mol. Plant 2017, 10, 1047–1064. [Google Scholar] [CrossRef]
  28. Majeed, U.; Darwish, E.; Rehman, S.U.; Zhang, X. Kompetitive allele specific PCR (KASP) a singleplex genotyping platform and its application. J. Agric. Sci. 2018, 11, 11–20. [Google Scholar] [CrossRef]
  29. Ur Rehman, S.; Sher, M.A.; Saddique, M.A.B.; Ali, Z.; Khan, M.A.; Mao, X.; Irshad, A.; Sajjad, M.; Ikram, R.M.; Naeem, M.; et al. Development and exploitation of KASP assays for genes underpinning drought tolerance among wheat cultivars from Pakistan. Front. Genet. 2021, 12, 684702. [Google Scholar] [CrossRef]
  30. Yadav, S.; Kushwaha, H.R.; Kumar, K.; Verma, P.K. Comparative structural modelling of monothiol GRX from chickpea: Insight in iron-sulfur cluster assembly. Int. J. Biol. Macromol. 2012, 51, 266–273. [Google Scholar] [CrossRef]
  31. Bao, J.S.; Corke, E.H.; Sun, E.M. Microsatellites, single nucleotide polymorphisms and a sequence tagged site in starch-synthesizing genes in relation to starch physicochemical properties in non-waxy rice (Oryza sativa L.). Theor. Appl. Genet. 2006, 113, 1185–1196. [Google Scholar] [CrossRef]
  32. He, Y.; Han, Y.; Jiang, L.; Xu, C.; Lu, J.; Xu, M. Functional analysis of starch-synthesis genes in determining rice eating and cooking qualities. Mol. Breed 2006, 18, 277–290. [Google Scholar] [CrossRef]
Figure 1. GmFBN conserved domain proteins. All GmFBN genes contained PAP superfamily domains. The amino acid length can be inferred by the ruler at the bottom.
Genes 14 01188 g001
Figure 2. Gene structure analysis of GmFBN based on phylogenetic relationships. Yellow boxes indicate exon, blue boxes indicate the upstream and downstream regions, and black lines indicate intron.
Genes 14 01188 g002
Figure 3. Conserved motifs prediction of GmFBN family. A Total of 10 motifs are presented in different colors. The amino acid length can be inferred by the ruler at the bottom.
Genes 14 01188 g003
Figure 4. Composition of cis-acting regulatory elements in the promoters of GmFBNs. (a) Stress-responsive related elements, plant growth, and light-responsive related elements are shown by different colors represented by TBtools; (b) Graphical representation of cis-acting elements. LRE, light-responsive elements; AAR, amino acid responsive; MLR, methylene jasmonate responsive; DMLR, DNA module involved in light responsiveness; ESAR, elements involved in salicylic acid responsiveness; ELR, Ethylene responsive; GRE, gibberellin responsive; LTR, low temperature responsive; LRM, light responsive module.
Genes 14 01188 g004
Figure 5. Phylogenetic analysis of FBNs proteins: The phylostartum analyses of FBN gene family; Phylogenetic analysis among G. max, G. soja, B. distachyon, G. hirsutum, P. trichocarpa, P. patens, Z. mays, A. thaliana, and B. rapa using the MEGA11 by the neighbor-joining method.
Genes 14 01188 g005
Figure 6. Conserved region (amino acid residues) sequence logo of G. max, A. thaliana, and Z. mays.
Genes 14 01188 g006
Figure 7. In-silico sub-cellular localization prediction of 16 GmFBNs.
Genes 14 01188 g007
Figure 8. The chromosome location of GmFBNs genes and synteny analysis between G. max and A. thaliana: (a) Members of FBNs were divided into groups present on different chromosomes; blue indicates the first group, black indicates the second group, green indicates the third group, and red indicates the fourth group; (b) Synteny analysis for duplicated gene pairs in G. max and A. thaliana. Chromosomal lines are represented by red.
Genes 14 01188 g008
Figure 9. Expression analysis of GmFBNs genes. Expression levels from high (red) to medium (blue) to low (yellow) are shown. A004A, A005B, B001A, B010C = soybean plant grown under normal conditions; D-A004A, D-A005B, D-B001A, D-B010C = soybean plant grown under drought conditions [25].
Genes 14 01188 g009
Figure 10. Sequence polymorphism and molecular marker development of GmFBN-15. (a) Showing GmFBN-15 gene structure with intron, exons region, and untranslated regions; black line indicates intron, yellow box indicates exon, and blue box indicates untranslated regions. (b) Presents the polymorphic site in three different soybean accessions. (c) Primers for CAPS marker and restriction enzyme information. (d) Agarose gel electrophoretic profile of selected samples showing the banding patterns run with M = 100 bp DNA ladder. Undigested PCR amplicon size is 657 bp. BpiI digested the amplified product into two fragments i.e., 433 bp and 224 bp.
Genes 14 01188 g010
Figure 11. Genotyping results of soybean accessions carrying A-allele or G-allele under well-water (WW) and water-limited (WL) conditions; Error bar denotes standard error; * p < 0.05, ** p < 0.01.
Genes 14 01188 g011
Table 1. Calculation of nonsynonymous (Ka) and synonymous (Ks) substitution rates and determination time (MYA) of soybean FBN genes.
Gene 1 IDGene 2 IDKa/KsTime (MYA)
GmFBN-1GmFBN-20.1294091281
GmFBN-3GmFBN-150.2345907942
GmFBN-12GmFBN-140.1720726261
GmFBN-13GmFBN-160.138743961
GmFBN-4GmFBN-50.5041245686
GmFBN-10GmFBN-70.4820735213
GmFBN-8GmFBN-90.4373483053
Disclaimer/Publisher’s Note: The statements, opinions and data contained in all publications are solely those of the individual author(s) and contributor(s) and not of MDPI and/or the editor(s). MDPI and/or the editor(s) disclaim responsibility for any injury to people or property resulting from any ideas, methods, instructions or products referred to in the content.

