

Mapping the Genomic Regions Controlling Germination Rate and Early Seedling Growth Parameters in Rice
 , , , , ,
Abstract
:1. Introduction
2. Material and Methods
2.1. Seed Material
2.2. Phenotyping of Germination Rate and Early Seedling Growth Parameters in the Germplasm Lines
2.3. Genomic DNA Isolation, PCR Analysis and Marker Selection
2.4. Molecular Data Analysis
3. Results
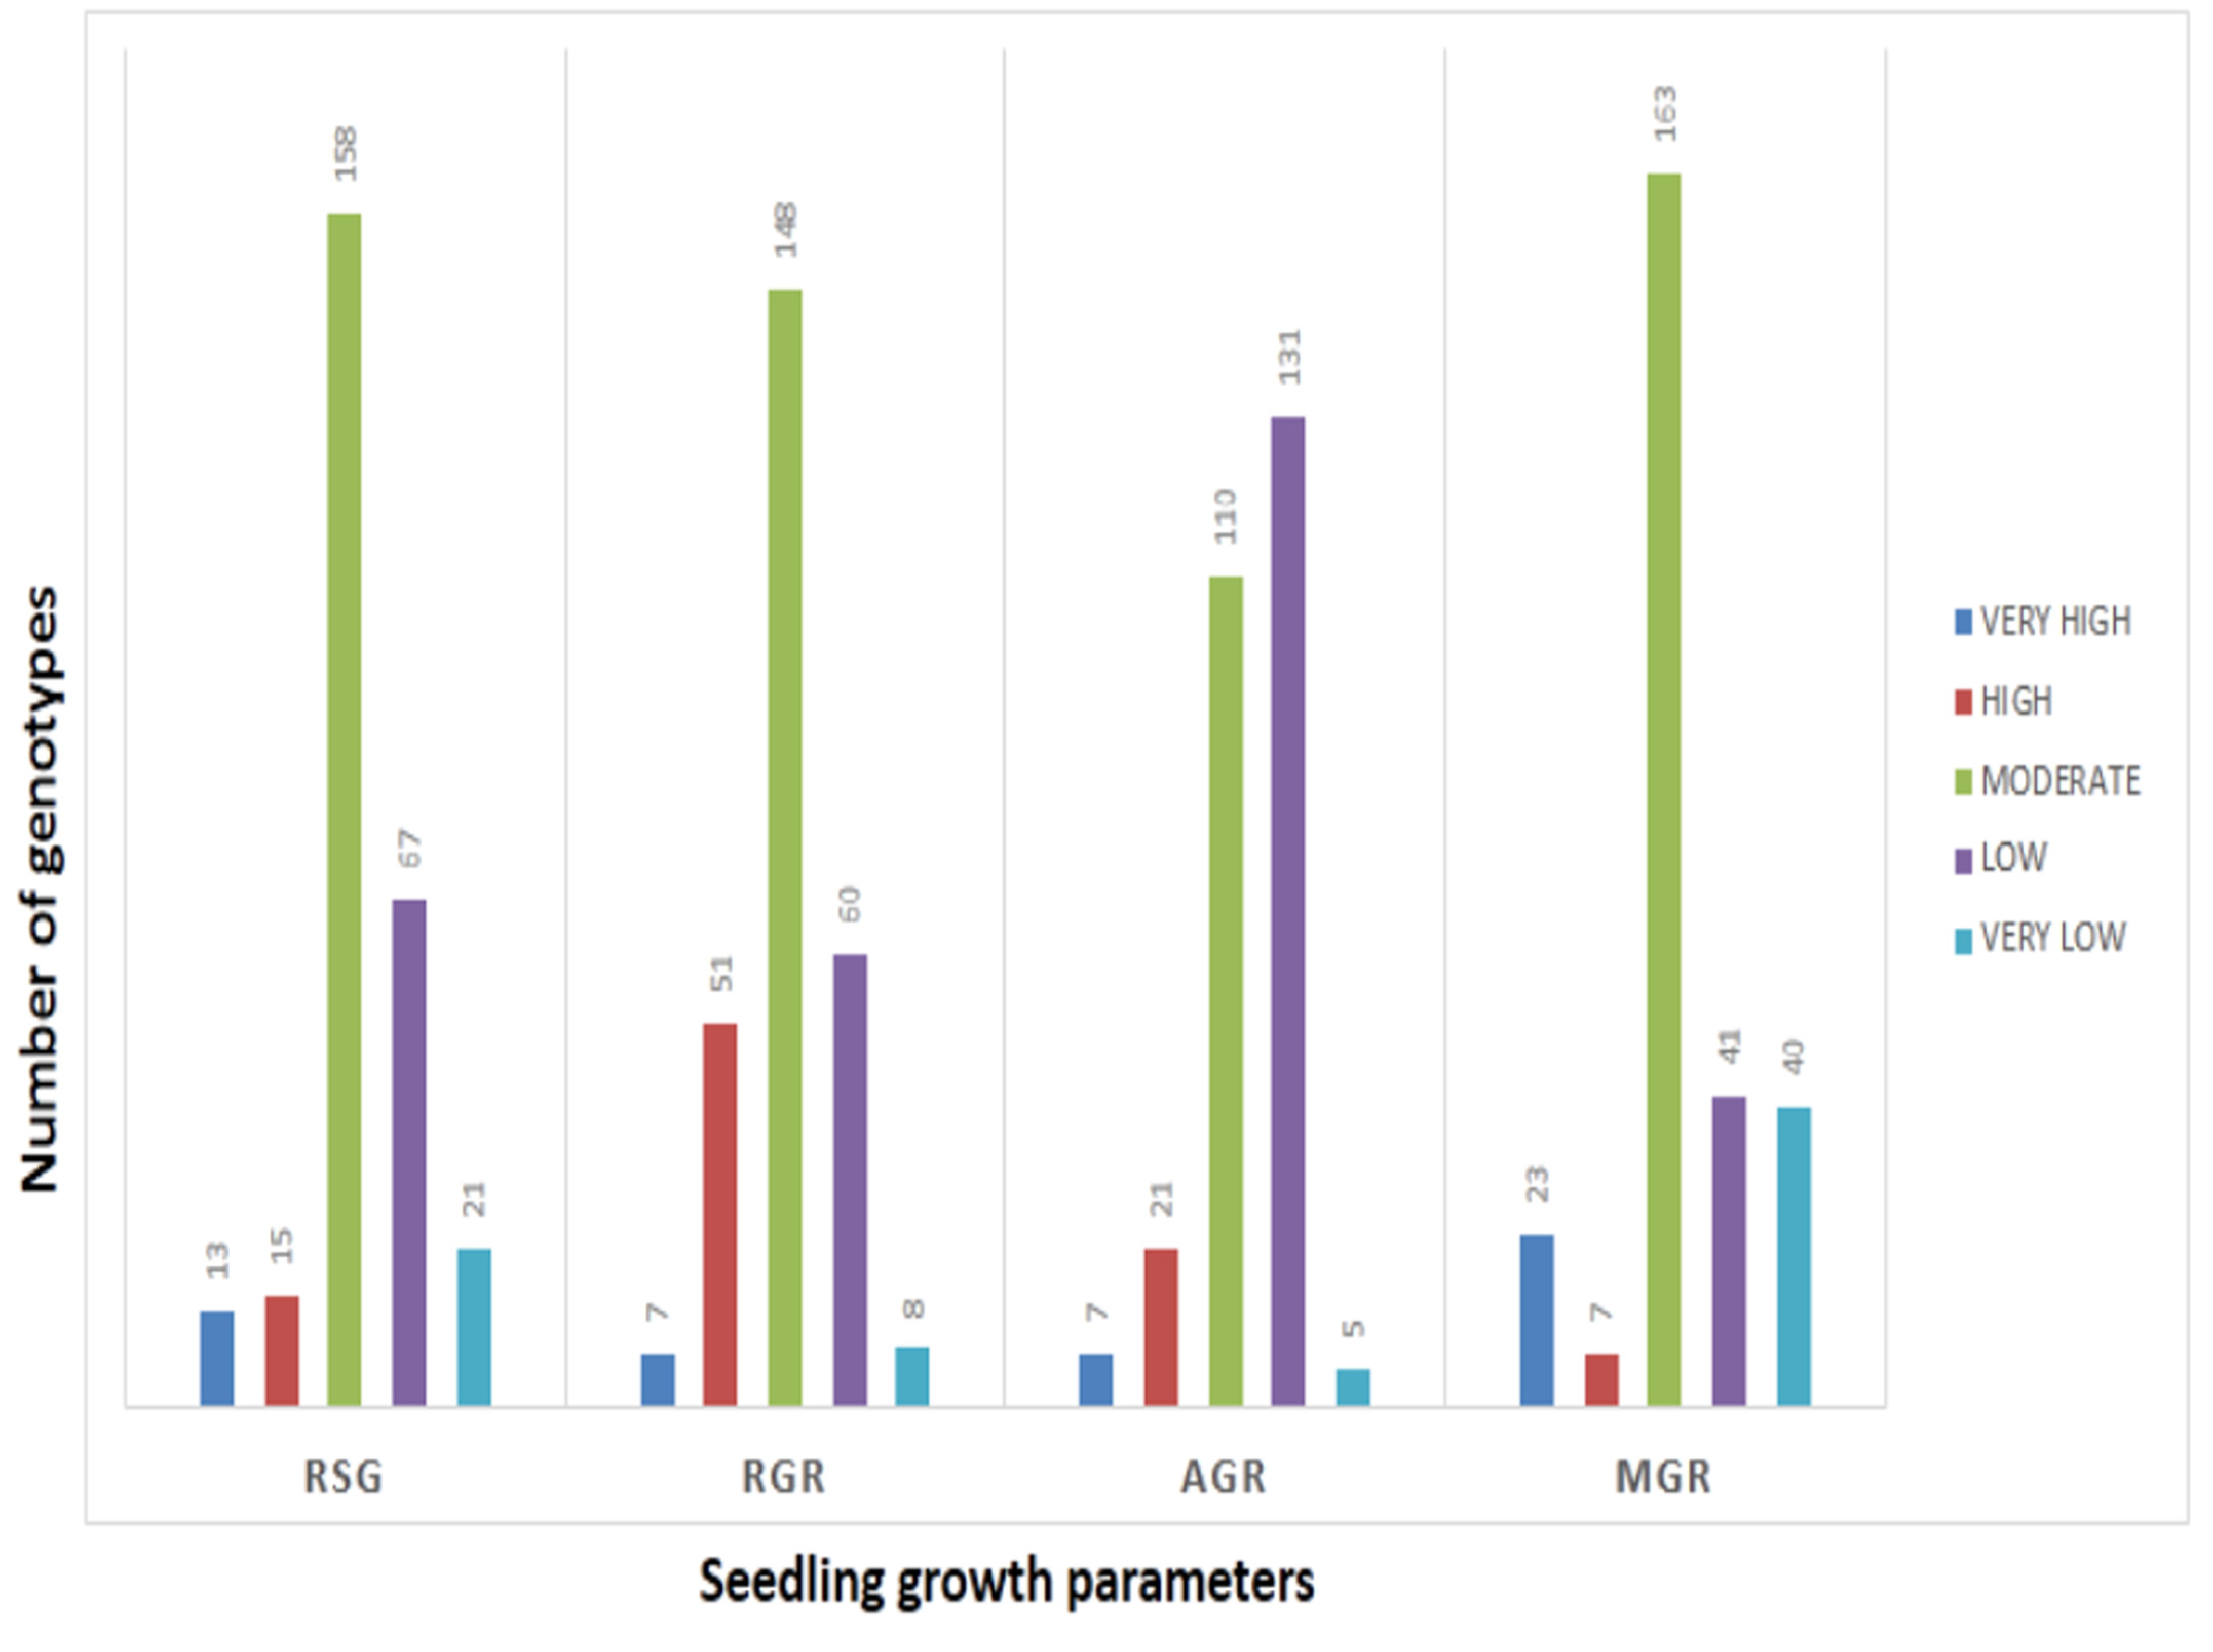
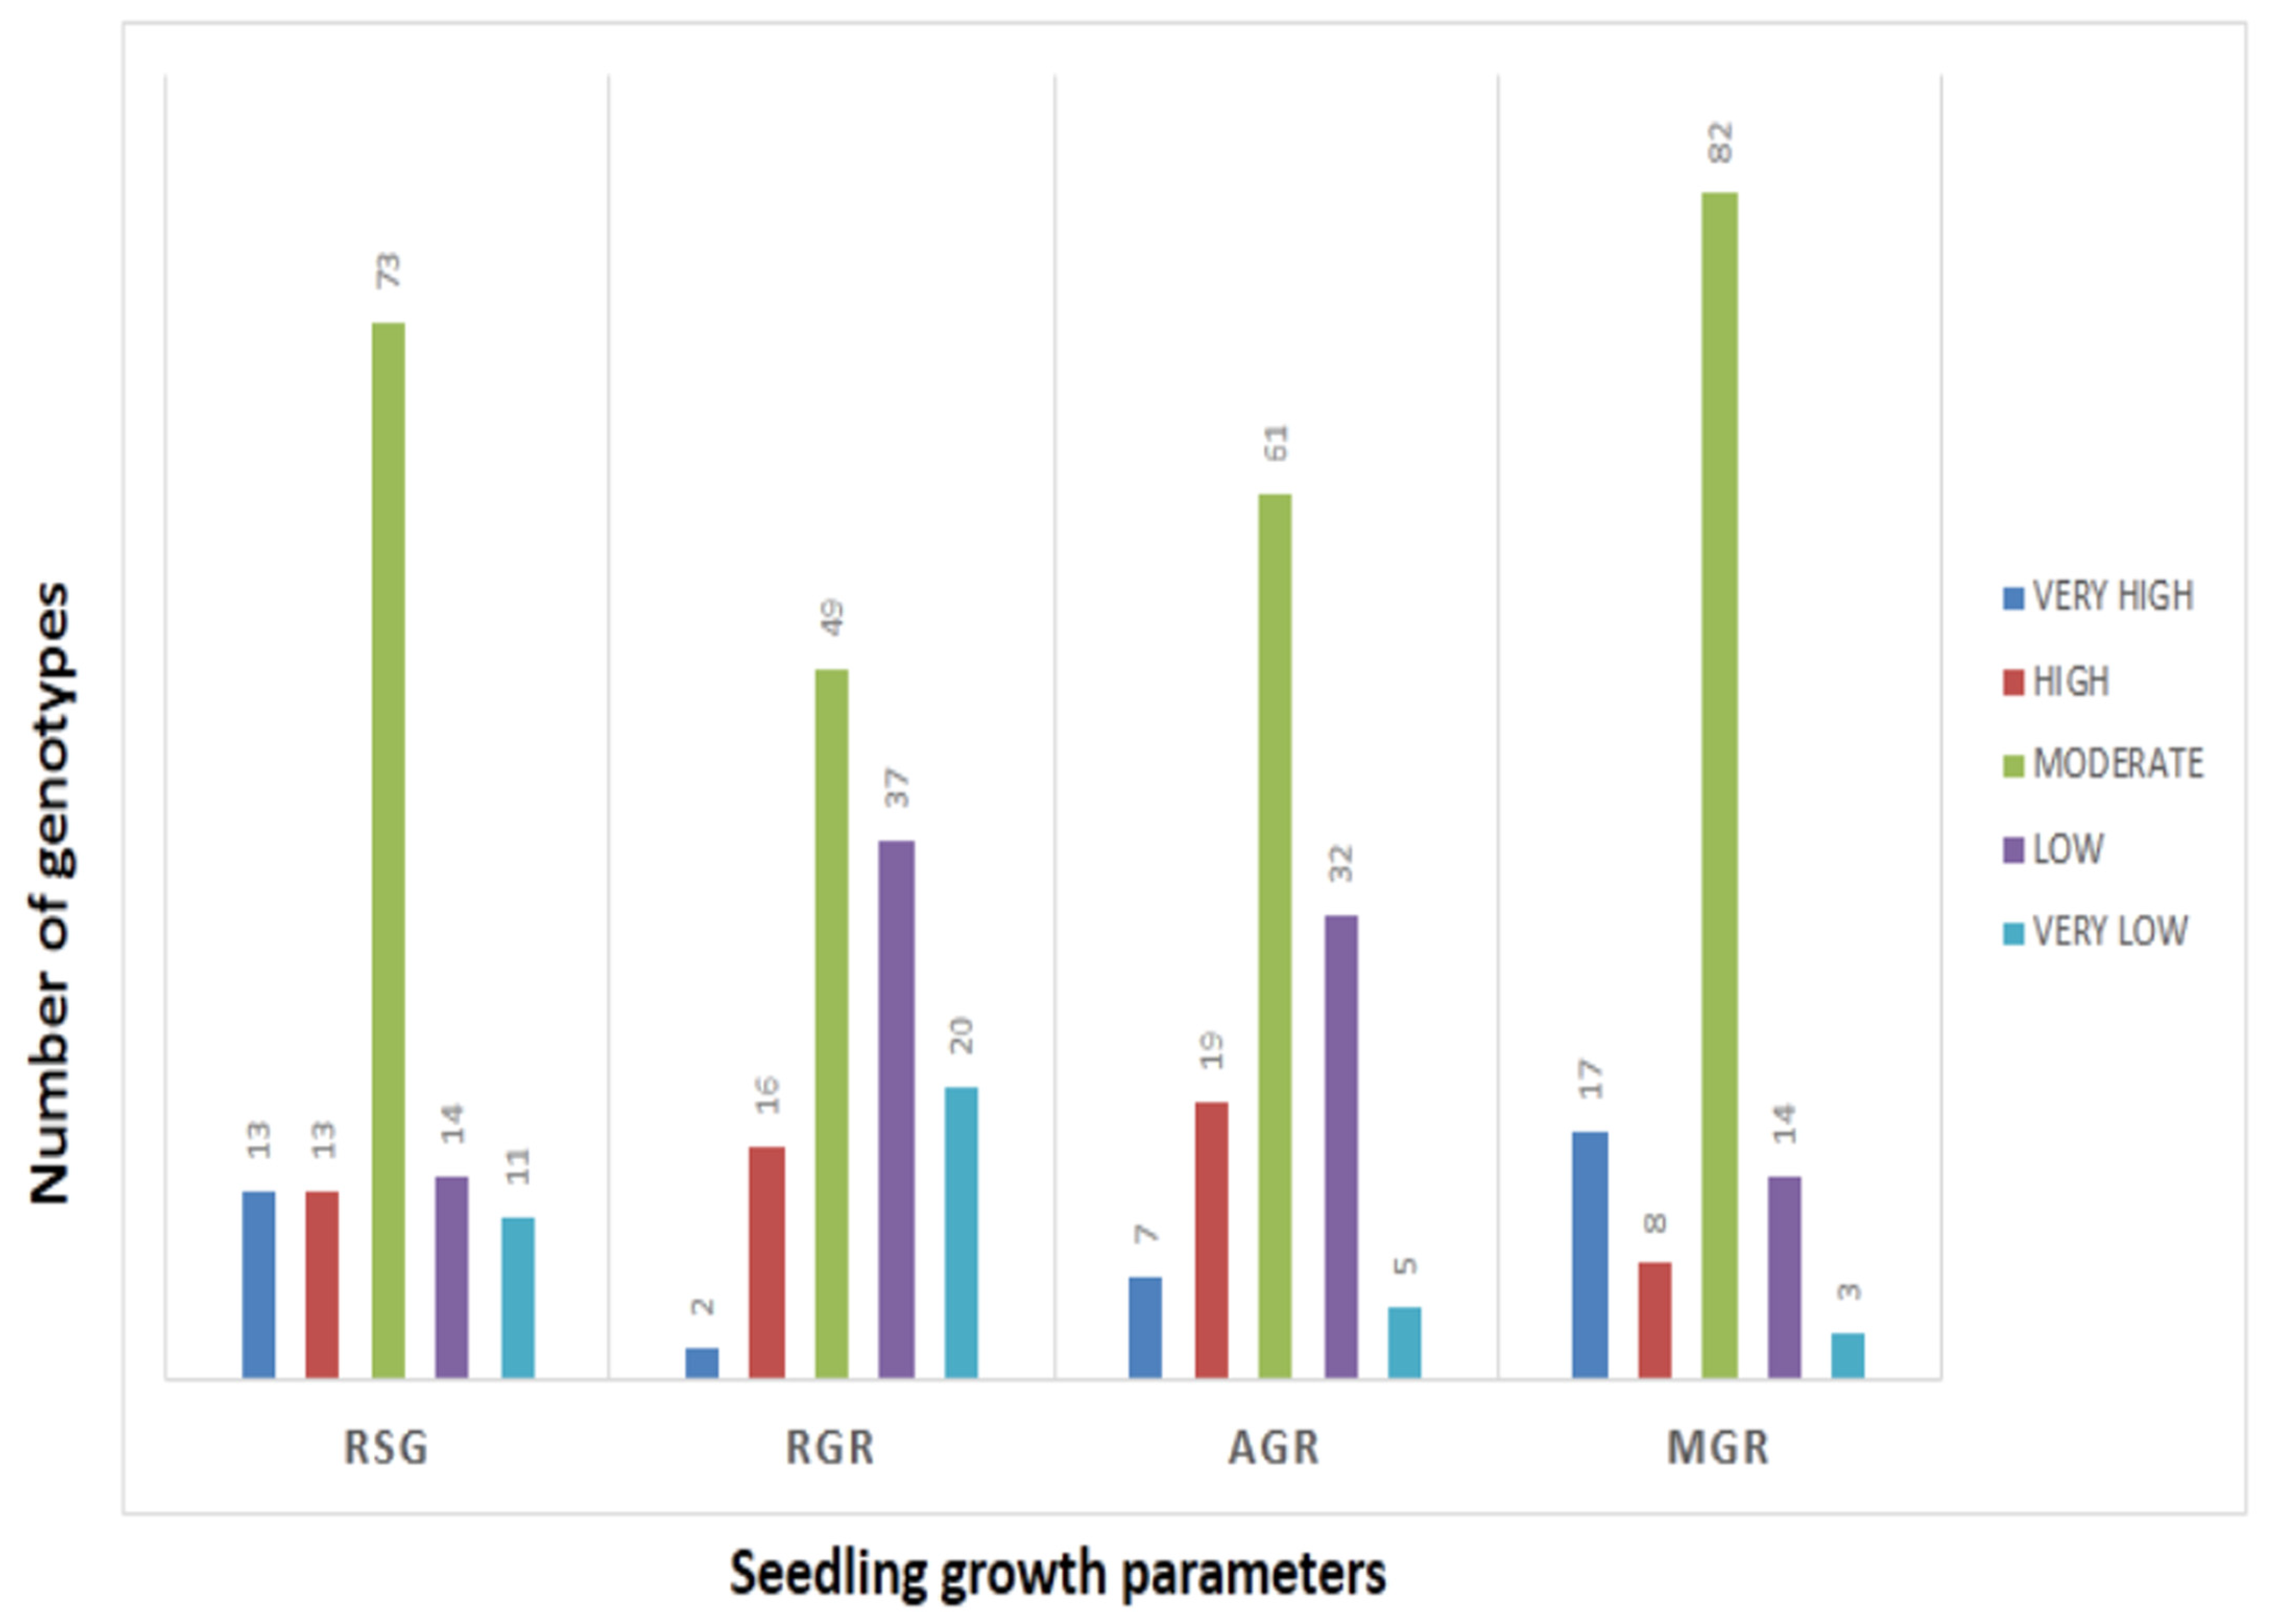
3.1. Phenotyping for Germination Rate and Early Seedling Growth Parameters in the Target Population
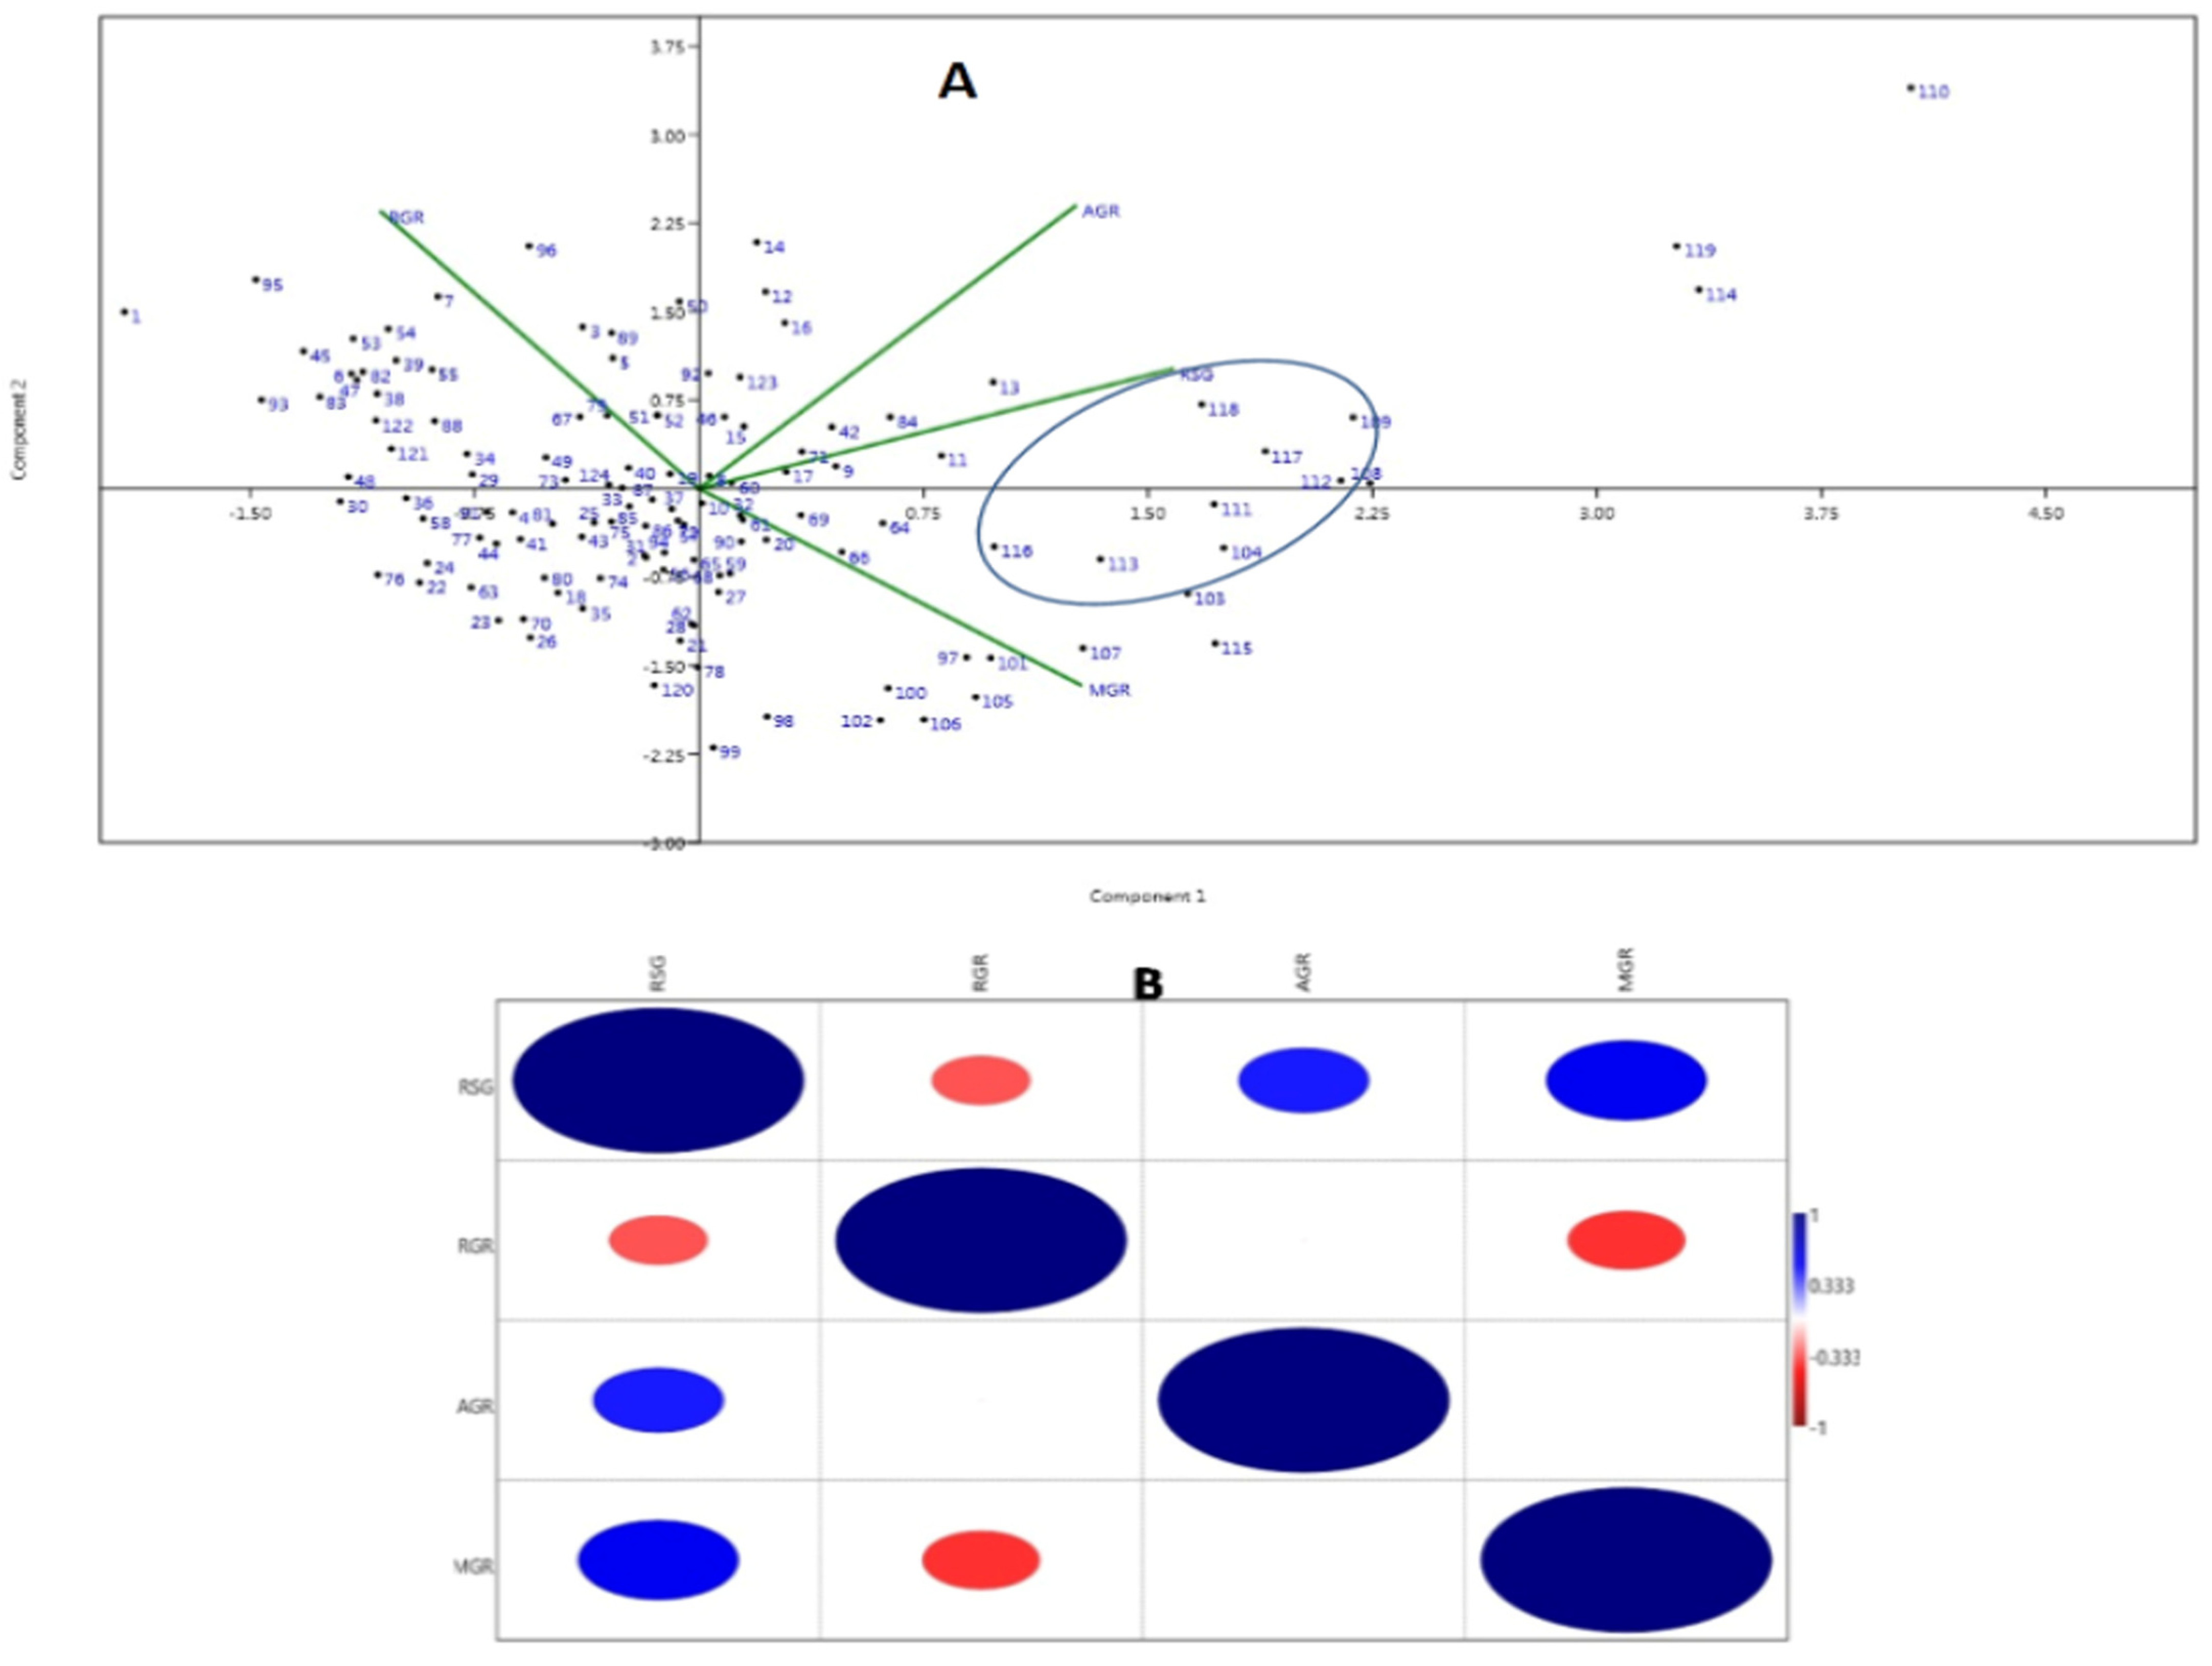
3.2. Principal Component and Association Analyses
3.3. Genetic Diversity Parameters’ Analysis
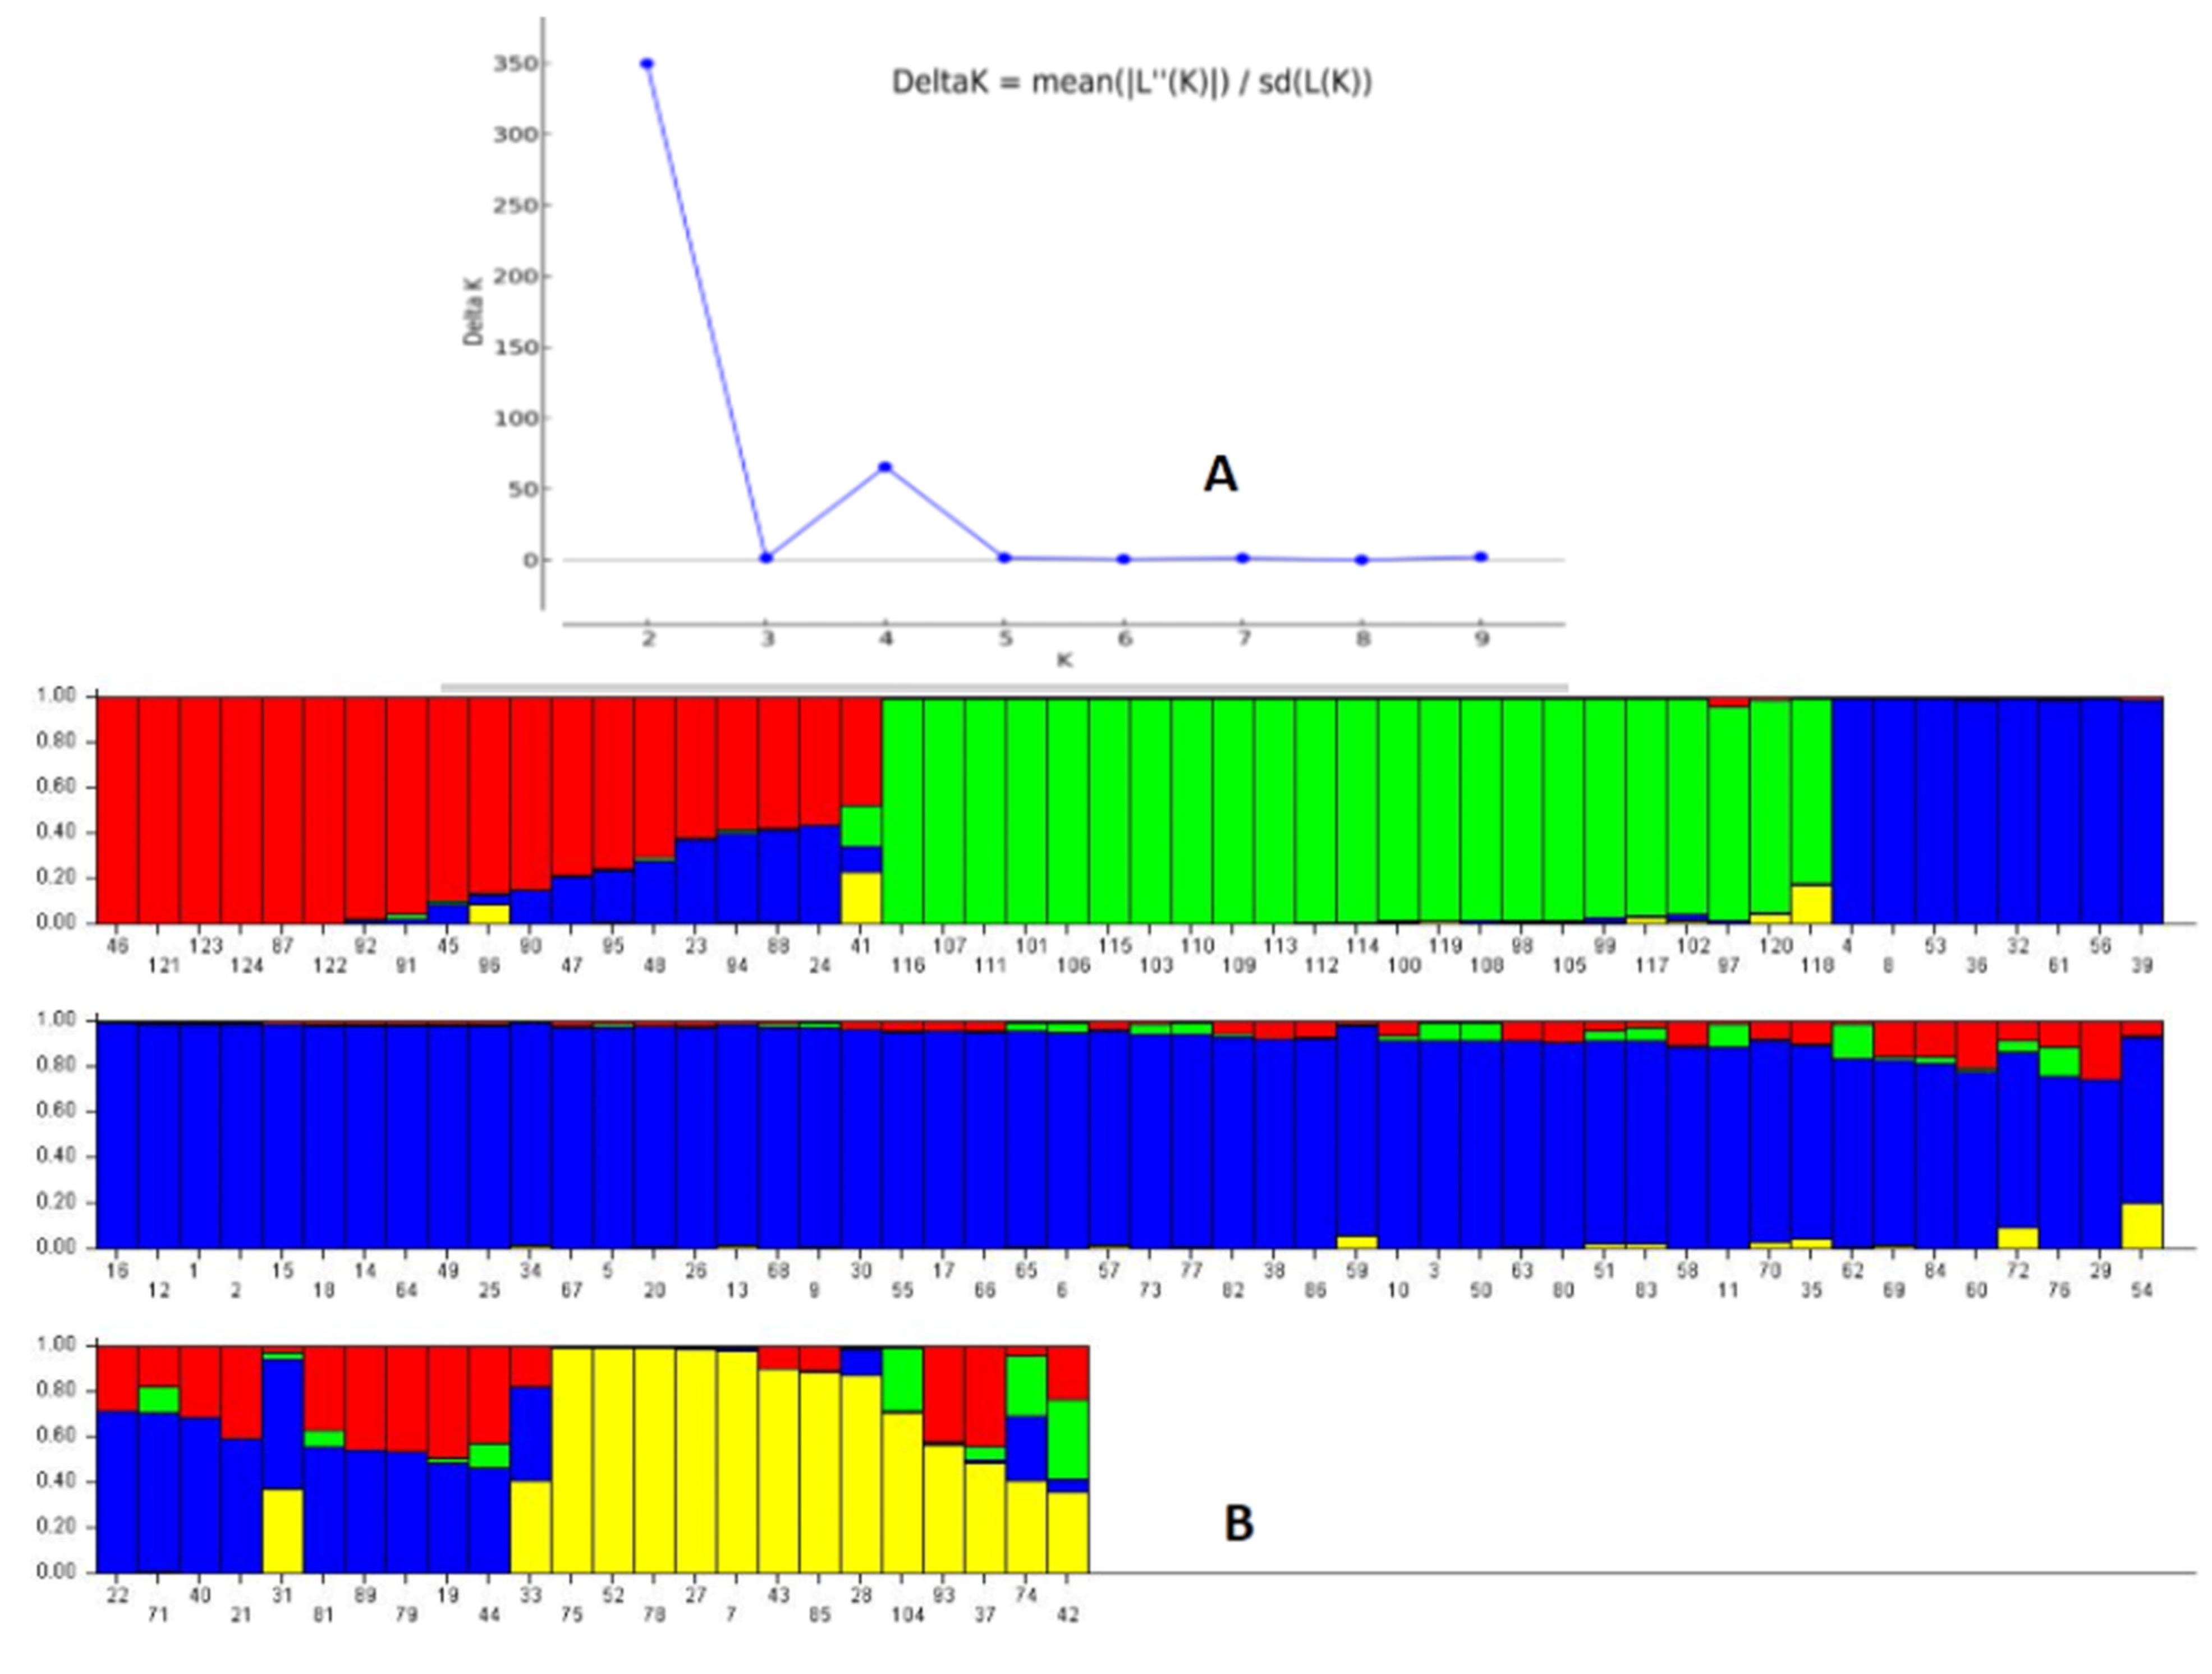
3.4. Population Genetic Structure Analysis
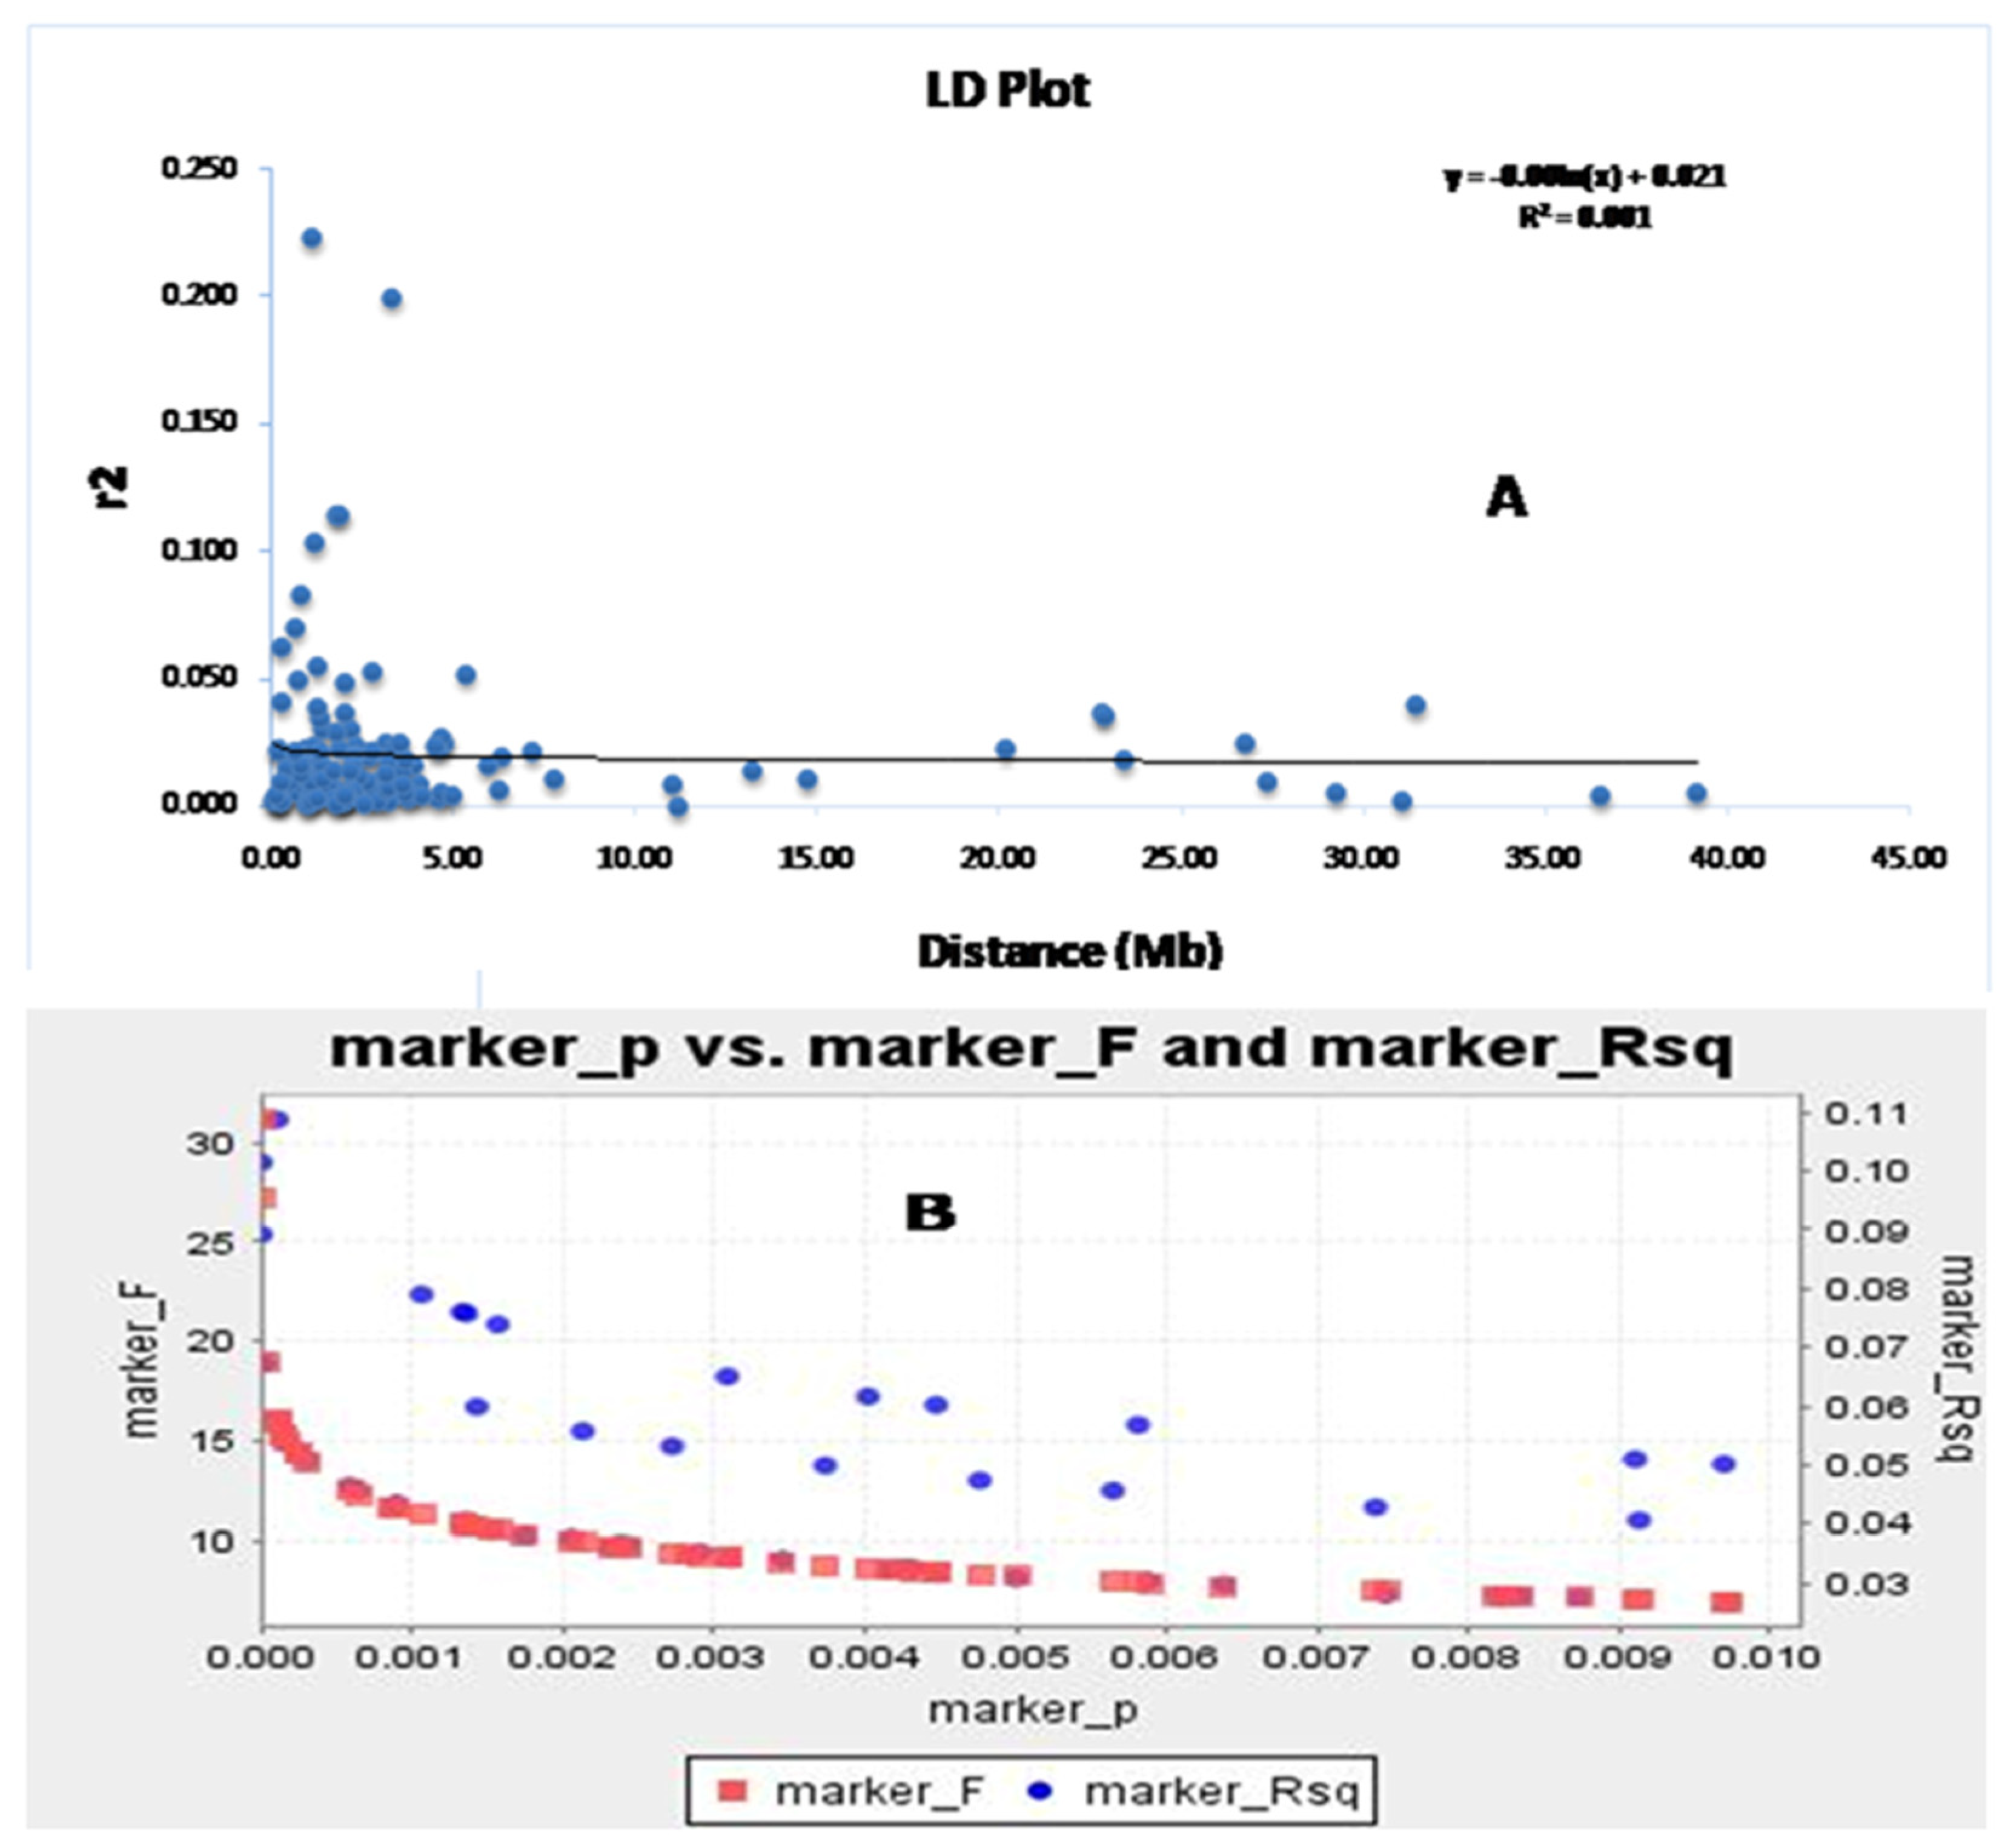
3.5. Analysis of Molecular Variance (AMOVA) and LD Decay Plot
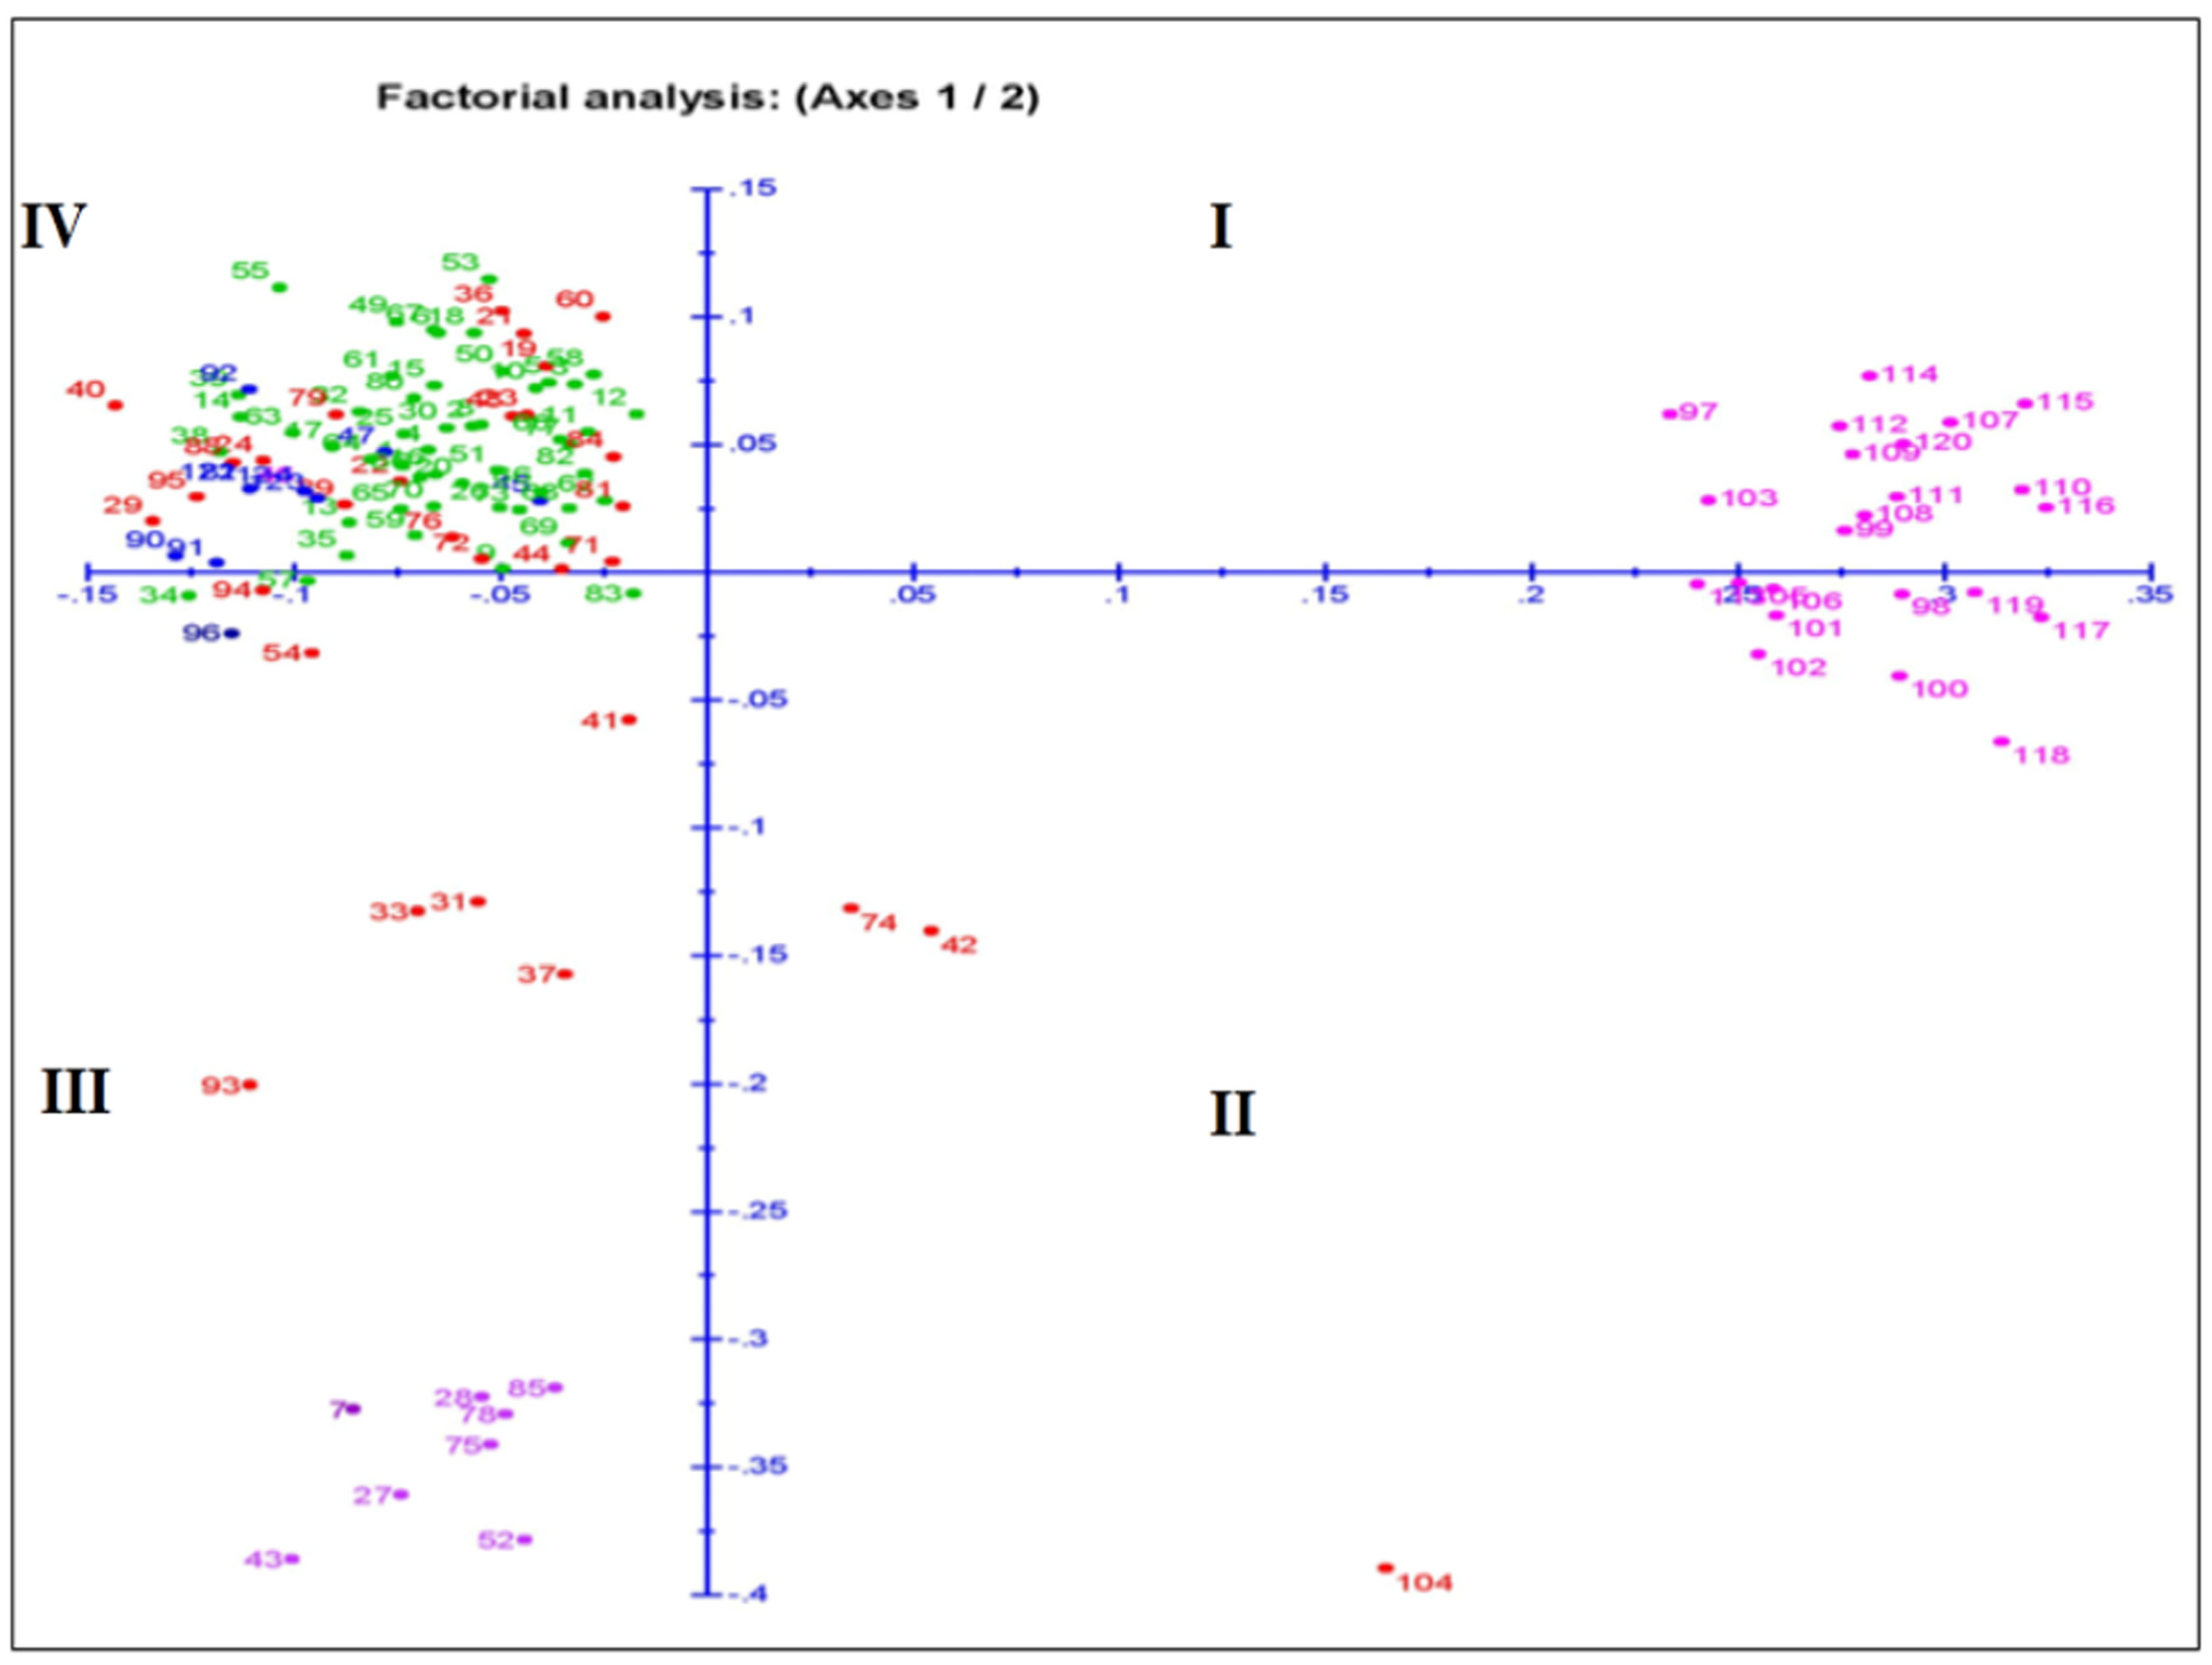
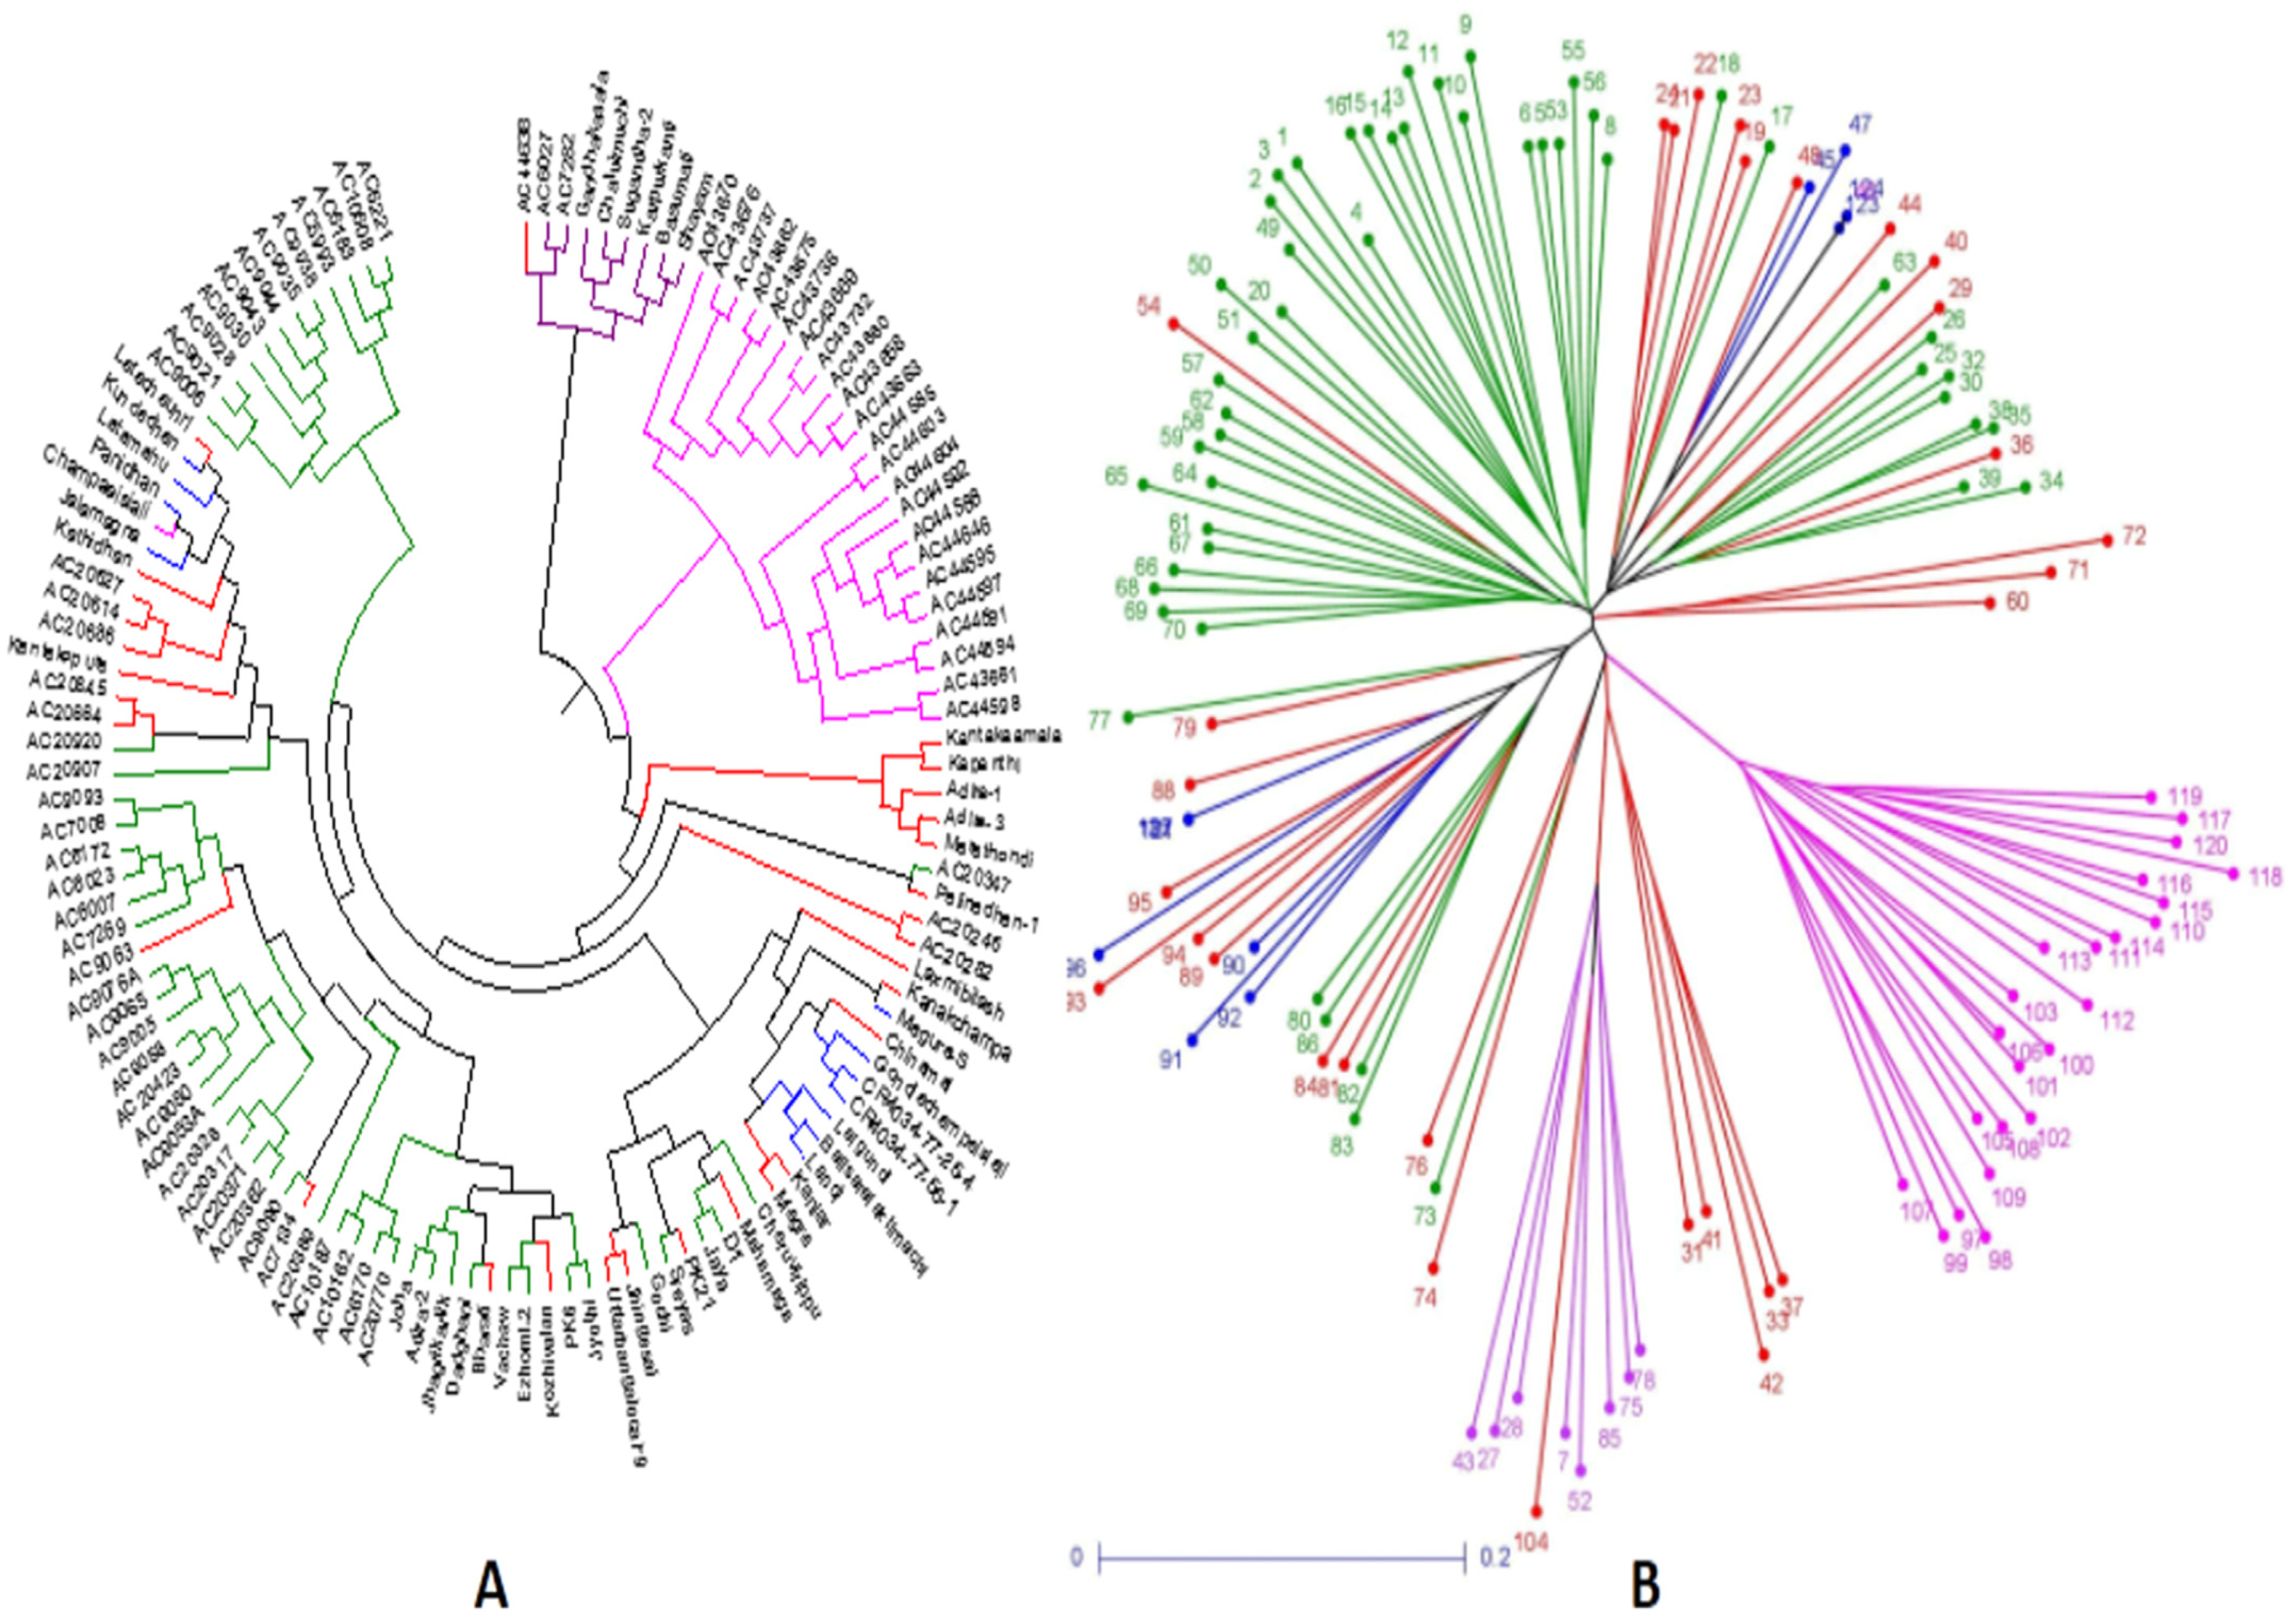
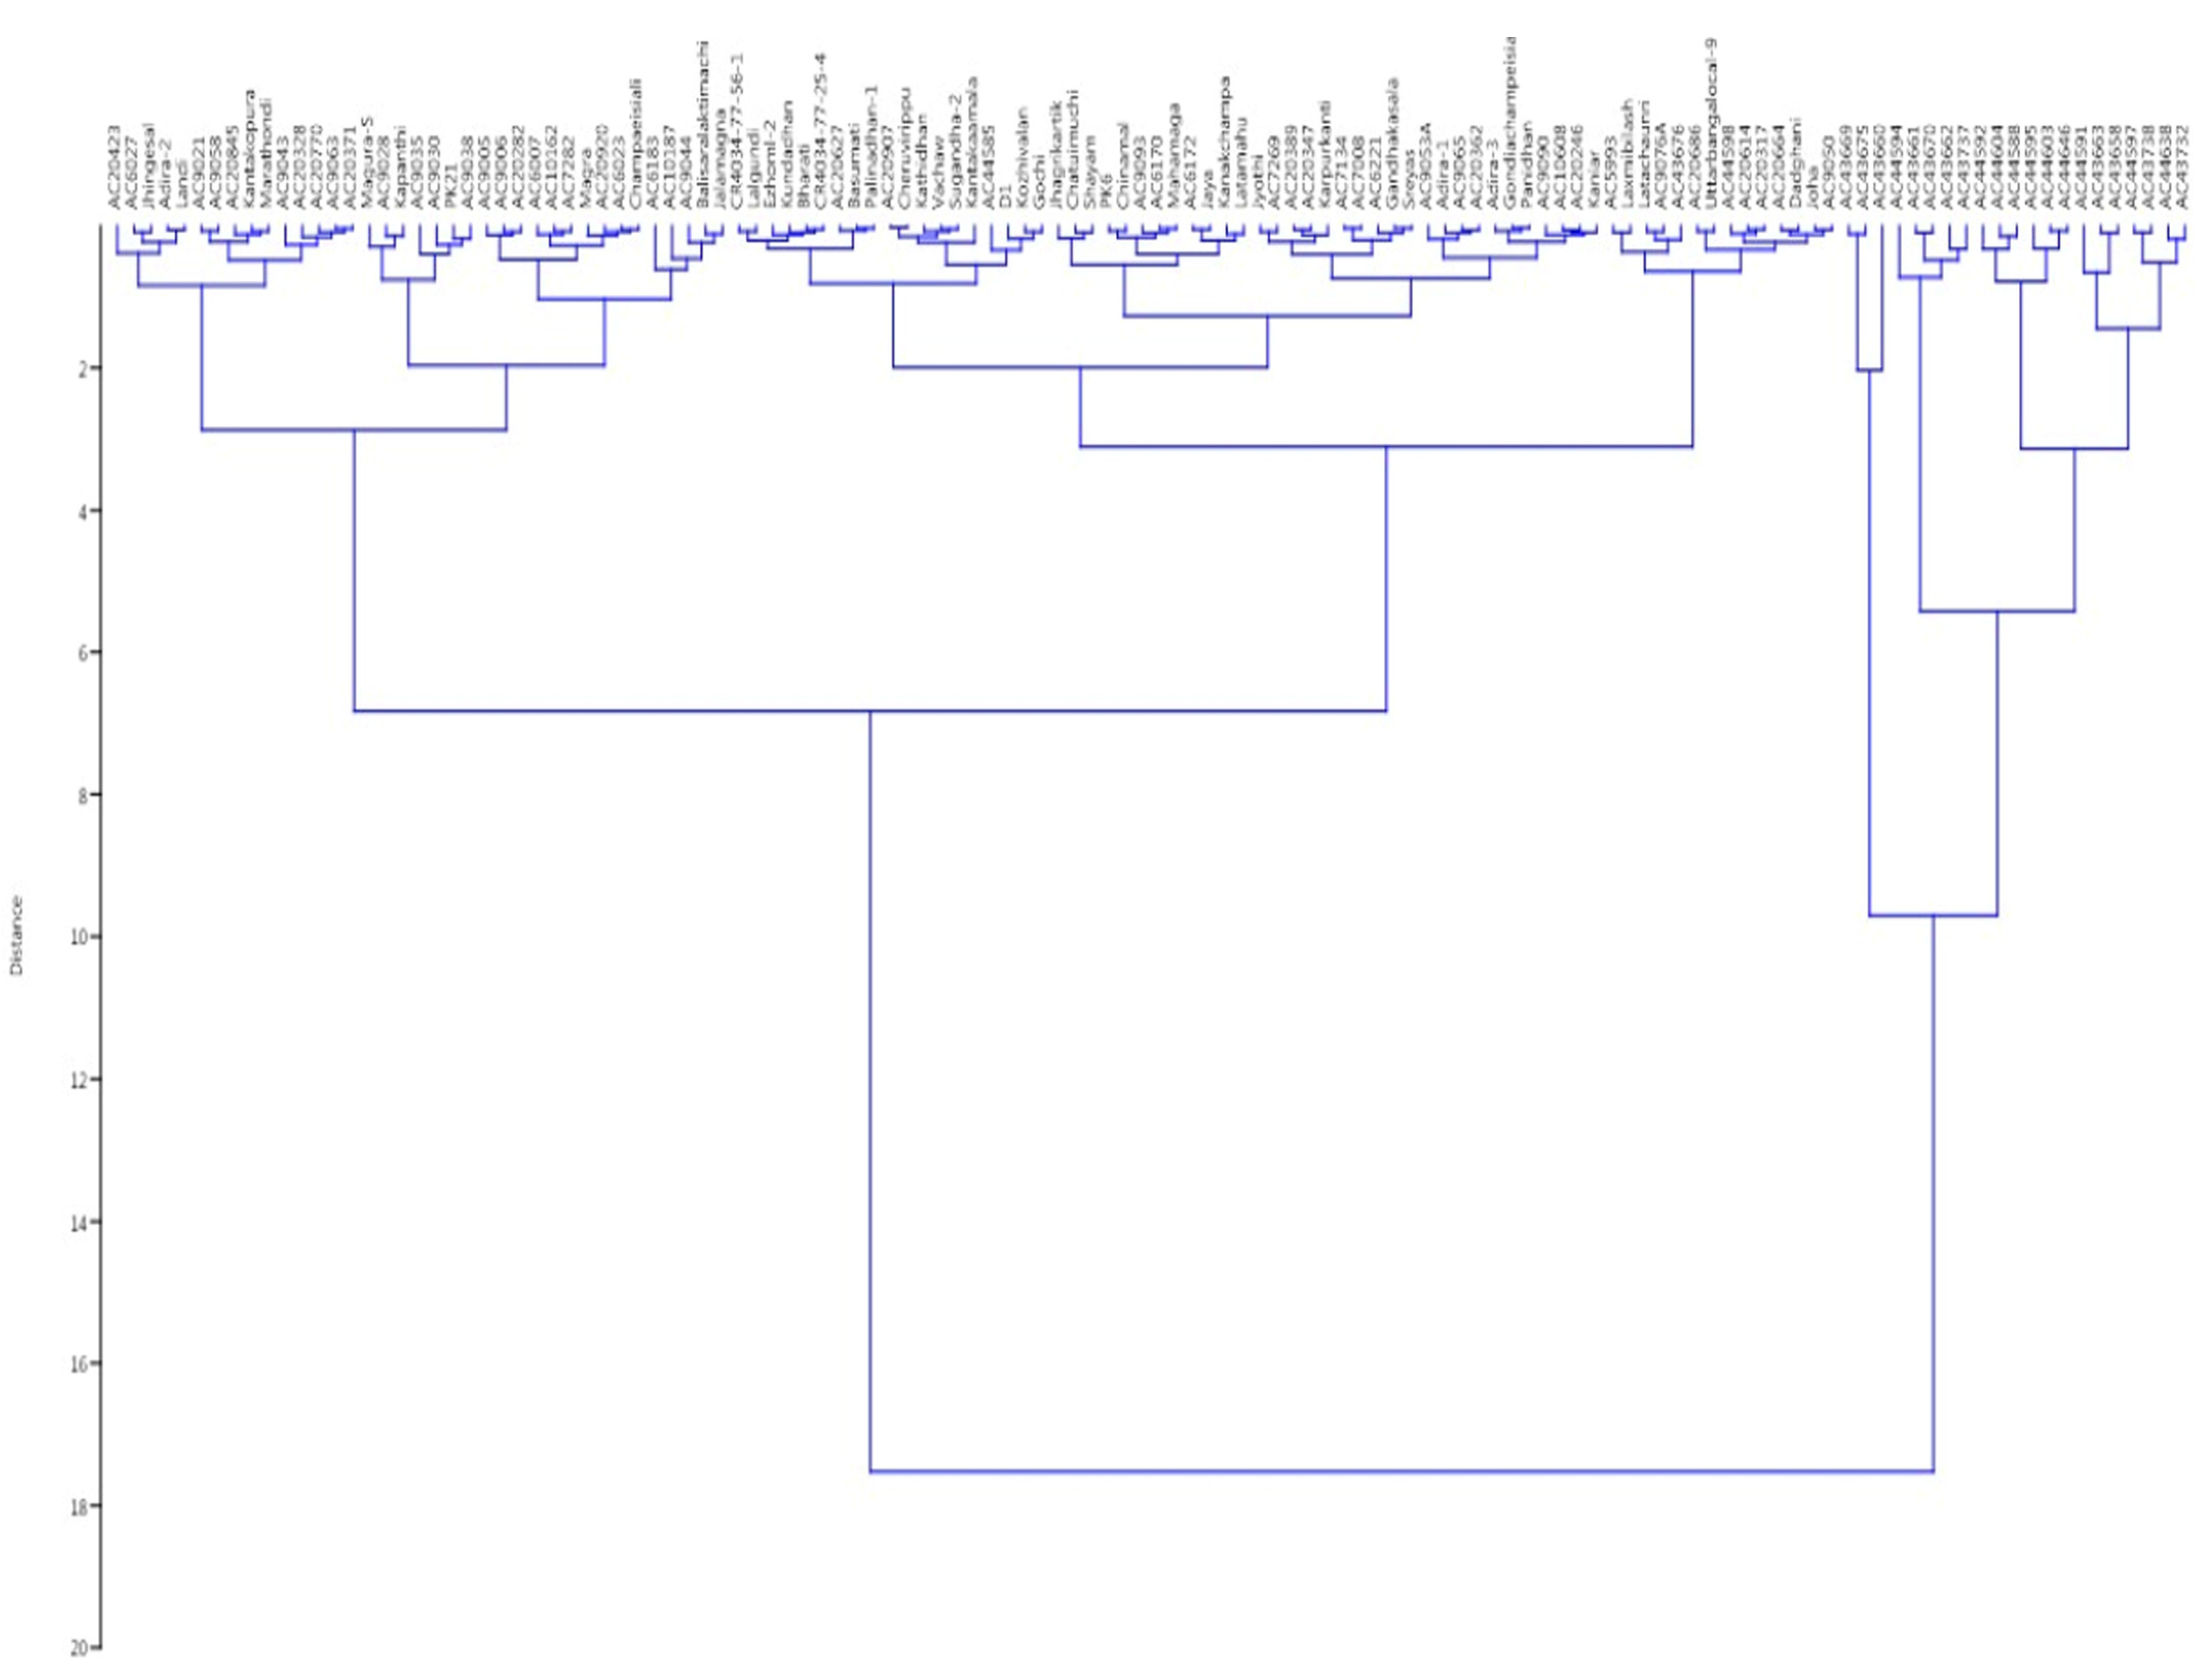
3.6. Relatedness among the Germplasm Lines through Principal Coordinates and Cluster Analyses
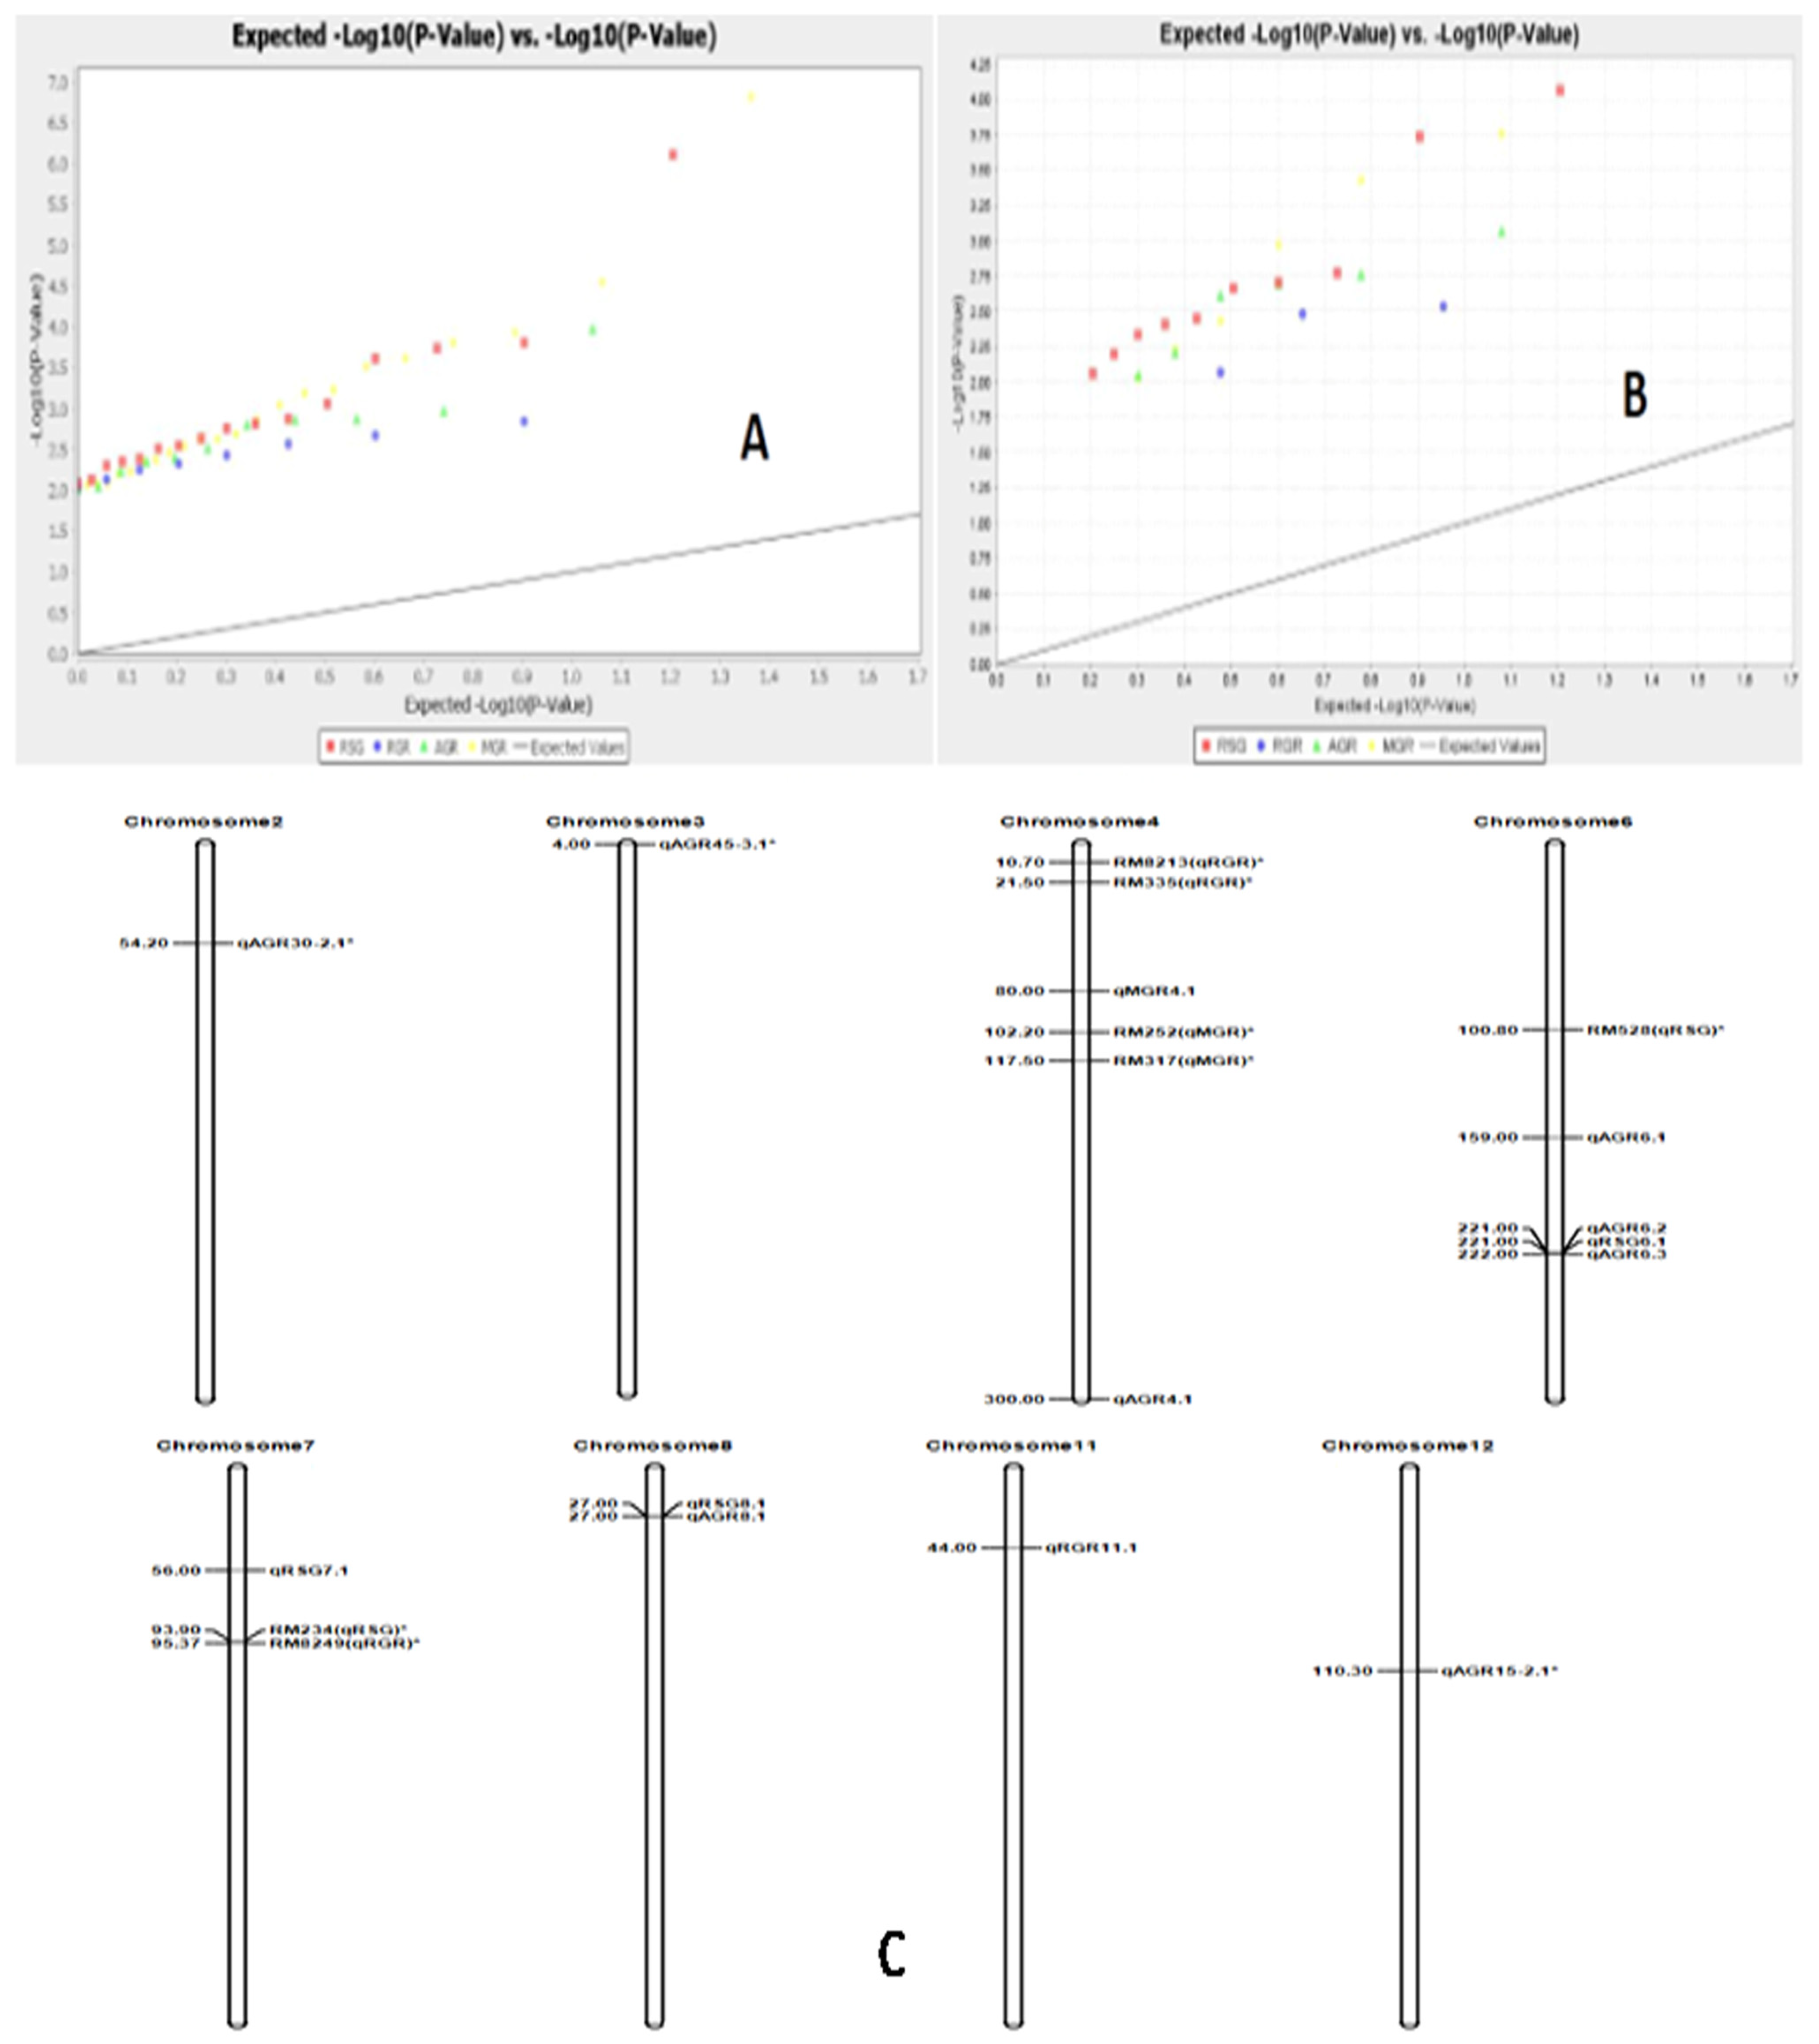
3.7. Association of Marker Alleles with Germination Rate and Early Seedling Growth Parameters in Rice
4. Discussion
5. Conclusions
Supplementary Materials
Author Contributions
Funding
Institutional Review Board Statement
Informed Consent Statement
Data Availability Statement
Conflicts of Interest
References
- Pradhan, S.K.; Pandit, E.; Pawar, S.; Baksh, S.Y.; Mukherjee, A.K.; Mohanty, S.P. Development of flash-flood tolerant and durable bacterial blight resistant versions of mega rice variety ‘Swarna’ through marker-assisted backcross breeding. Sci. Rep. 2019, 9, 12810. [Google Scholar] [CrossRef] [PubMed] [Green Version]
- Pradhan, S.K.; Pandit, E.; Barik, S.R.; Mohanty, S.P.; Nayak, D.K.; Sah, R.P.; Behera, L.; Sanghamitra, P.; Bose, L.K.; Das, S.R. Climate-Smart Rice Breeding: Progress and Challenges for the Rain-fed ecologies in India. In Advances in Rice Breeding: Stress Tolerance, Climate Resilience, Quality and High Yield; ICAR-NRRI: Cuttack, India, 2021; pp. 144–162. [Google Scholar]
- Pandit, E.; Pawar, S.; Barik, S.R.; Mohanty, S.P.; Meher, J.; Pradhan, S.K. Marker assisted backcross breeding for improvement of submergence tolerance and grain yield in the popular Rice variety ‘Maudamani’. Agronomy 2021, 11, 1263. [Google Scholar] [CrossRef]
- Mohapatra, S.; Bastia, A.K.; Meher, J.; Sanghamitra, P.; Pradhan, S.K. Development of submergence tolerant, bacterial blight lines of popular variety, ‘Swarna’ through marker-assisted breeding approach. Front. Plant Sci. 2021, 12, 672618. [Google Scholar] [CrossRef] [PubMed]
- Rajjou, L.; Duval, M.; Gallardo, K.; Catusse, J.; Bally, J.; Job, C.; Job, D. Seed germination and vigour. Annu. Rev. Plant Biol. 2012, 63, 507–533. [Google Scholar] [CrossRef] [Green Version]
- Mahender, A.; Anandan, A.; Pradhan, S.K. Early seedling vigour, an imperative trait for direct seeded rice: An overview on physio-morphological parameters and molecular markers. Planta 2015, 241, 1027–1050. [Google Scholar] [CrossRef]
- Sahoo, S.; Sanghamitra, P.; Nanda, N.; Pawar, S.; Pandit, E.; Bastia, R.; Muduli, K.C.; Pradhan, S.K. Association of molecular markers with physio-biochemical traits related to seed vigour in rice. Physiol. Mol. Biol. Plants 2020, 26, 1989–2003. [Google Scholar] [CrossRef]
- Dingkuhn, M.; Johnson, D.E.; Sowa, A.; Audeberta, A.Y. Relationship between upland rice canopy characteristics and weed competitiveness. Field Crops Res. 1999, 61, 79–95. [Google Scholar] [CrossRef]
- Sanghamitra, P.; Nanda, N.; Barik, S.R.; Sahoo, S.; Pandit, E.; Bastia, R.; Bagchi, T.B.; Pradhan, S.K. Genetic structure and molecular markers-trait association for physiological traits related to seed vigour in rice. Plant Gene 2021, 28, 100338. [Google Scholar] [CrossRef]
- Barik, S.R.; Pandit, E.; Sanghamitra, P.; Mohanty, S.P.; Behera, A.; Mishra, J.; Nayak, D.K.; Bastia, R.; Moharana, A.; Sahoo, A.; et al. Unraveling the genomic regions controlling the seed vigour index, root growth parameters and germination per cent in rice. PLoS ONE 2022, 17, e0267303. [Google Scholar] [CrossRef]
- Cui, K.H.; Peng, S.B.; Xing, Y.Z.; Xu, C.G.; Yu, S.B.; Zhang, Q. Molecular dissection of seedling vigor and associated physiological traits in rice. Theor. Appl. Genet. 2002, 105, 745–753. [Google Scholar] [CrossRef]
- Wang, Z.; Wan, J.; Bao, Y.; Wang, F.; Zhang, H. Quantitative trait loci analysis for rice seed vigor during the germination stage. J. Zhejiang Univ. Sci. B (Biomed. Biotechnol.) 2010, 11, 958–964. [Google Scholar] [CrossRef] [Green Version]
- Diwan, J.; Channbyregowda, M.; Shenoy, V.; Salimath, P.; Bhat, R. Molecular mapping of early vigour related QTLs in rice. Res. J. Biol. 2013, 1, 24–30. [Google Scholar]
- Liu, L.; Lai, Y.; Cheng, J.; Wang, L.; Du, W.; Wang, Z.; Zhang, H. Dynamic Quantitative Trait Locus Analysis of Seed Vigor at Three Maturity Stages in Rice. PLoS ONE 2014, 9, e115732. [Google Scholar] [CrossRef] [Green Version]
- Yang, J.; Yang, G.; Yang, M.; Su, L.; Xia, A.; Li, D.; Huang, C.; Zhou, D.; Liu, Y.; Wang, H.; et al. Quantitative trait locus analysis of seed germination and early seedling growth in rice. Front. Plant Sci. 2019, 10, 1582. [Google Scholar] [CrossRef] [Green Version]
- Finch-Savage, W.E.; Bassel, G.W. Seed vigour and crop establishment: Extending performance beyond adaptation. J. Exp. Bot. 2016, 67, 567–591. [Google Scholar] [CrossRef] [PubMed] [Green Version]
- Sanghamitra, P.; Bastia, R.; Mishra, J.; Sahoo, S.; Pradhan, S.K. Genetic enhancement of seed quality traits in rice. Climate-Smart Rice Breeding: Progress and Challenges for the Rain-fed ecologies in India. In Advances in Rice Breeding: Stress Tolerance, Climate Resilience, Quality and High Yield; ICAR-NRRI: Cuttack, India, 2021; pp. 280–315. [Google Scholar]
- Abe, A.; Kosugi, S.; Yoshida, K.; Natsume, S.; Takagi, H.; Kanzaki, H.; Matsumura, H.; Yoshida, K.; Mitsuoka, C.; Tamiru, M.; et al. Genome sequencing reveals agronomically important loci in rice using MutMap. Nat. Biotechnol. 2012, 30, 174–178. [Google Scholar] [CrossRef] [Green Version]
- Chen, H.; He, H.; Zou, Y.; Chen, W.; Yu, R.; Liu, X.; Yang, Y.; Gao, Y.-M.; Xu, J.-L.; Fan, L.-M.; et al. Development and application of a set of breeder-friendly SNP markers for genetic analyses and molecular breeding of rice (Oryza sativa L.). Theor. Appl. Genet. 2011, 123, 869–879. [Google Scholar] [CrossRef]
- Yang, J.; Chang, Y.; Qin, Y.; Chen, D.; Zhu, T.; Peng, K.; Wang, H.; Tang, N.; Li, X.; Wang, Y.; et al. A lamin-like protein OsNMCP1 regulates drought resistance and root growth through chromatin accessibility modulation by interacting with a chromatin remodeller OsSWI3C in rice. New Phytol. 2020, 227, 65–83. [Google Scholar] [CrossRef]
- He, X.; Feng, X.; Sun, D.; Liu, F.; Bao, Y.; He, Y. Rapid and Nondestructive Measurement of Rice Seed Vitality of Different Years Using Near-Infrared Hyperspectral Imaging. Molecules 2019, 24, 2227. [Google Scholar] [CrossRef] [Green Version]
- Anandan, A.; Anumalla, M.; Pradhan, S.K.; Ali, J. Population structure, diversity and trait association analysis in rice (Oryza sativa L.) germplasm for early seedling vigour (ESV) using trait linked SSR markers. PLoS ONE 2016, 11, 406. [Google Scholar] [CrossRef] [Green Version]
- Pandit, E.; Tasleem, S.; Barik, S.R.; Mohanty, D.P.; Nayak, D.K.; Mohanty, S.P.; Das, S.; Pradhan, S.K. Genome-wide association mapping reveals multiple QTLs governing tolerance response for seedling stage chilling stress in indica rice. Front. Plant Sci. 2017, 8, 552. [Google Scholar] [CrossRef] [Green Version]
- Pradhan, S.K.; Pandit, E.; Pawar, S.; Naveenkumar, R.; Barik, S.R.; Mohanty, S.P.; Nayak, D.K.; Ghritlahre, S.K.; Rao, D.S.; Reddy, J.N.; et al. Linkage disequilibrium mapping for grain Fe and Zn enhancing QTLs useful for nutrient dense rice breeding. BMC Plant Biol. 2020, 20, 57. [Google Scholar] [CrossRef] [PubMed] [Green Version]
- Barik, S.R.; Pandit, E.; Pradhan, S.K.; Singh, S.; Swain, P.; Mohapatra, T. QTL mapping for relative water content trait at reproductive stage drought stress in rice. Indian J. Genet. 2018, 78, 401–408. [Google Scholar]
- Das, S.; Pandit, E.; Guru, M.; Nayak, D.K.; Tasleem, S.; Barik, S.R.; Mohanty, D.P.; Mohanty, S.P.; Patra, B.C.; Pradhan, S.K. Genetic diversity, population structure, marker validation and kinship analysis for seedling stage cold tolerance in indica rice. Oryza 2018, 55, 396–405. [Google Scholar] [CrossRef]
- Barik, S.R.; Pandit, E.; Mohanty, S.P.; Nayak, D.K.; Pradhan, S.K. Genetic mapping of physiological traits associated with terminal stage drought tolerance in rice. BMC Genet. 2020, 21, 76. [Google Scholar] [CrossRef]
- Pawar, S.; Pandit, E.; Mohanty, I.C.; Saha, D.; Pradhan, S.K. Population genetic structure and association mapping for iron toxicity tolerance in rice. PLoS ONE 2021, 16, e0246232. [Google Scholar] [CrossRef]
- Mohapatra, S.; Pandit, E.; Barik, S.R.; Patra, B.C.; Pradhan, S.K. Genetic diversity and population structure in early duration rice genotypes. Oryza 2017, 54, 158–168. [Google Scholar] [CrossRef]
- Yu, J.; Pressoir, G.; Briggs, W.H.; Vroh Bi, I.; Yamasaki, M.; Doebley, J.F.; McMullen, M.D.; Gaut, B.S.; Nielsen, D.M.; Holland, J.B.; et al. A unified mixed model method for association mapping that accounts for multiple levels of relatedness. Nat. Genet. 2006, 38, 203–208. [Google Scholar] [CrossRef]
- Nayak, D.K.; Sahoo, S.; Barik, S.R.; Sanghamitra, P.; Sangeeta, S.; Pandit, E.; Reshmi Raj, K.R.; Basak, N.; Pradhan, S.K. Association mapping for protein, total soluble sugars, starch, amylose and chlorophyll content in rice. BMC Plant Biol. 2022, 22, 620. [Google Scholar] [CrossRef]
- Xie, L.; Tan, Z.; Zhou, Y.; Xu, R.; Feng, L.; Xing, Y.; Qi, X. Identification and fine mapping of quantitative trait loci for seed vigor in germination and seedling establishment in rice. J. Integr. Plant Biol. 2014, 56, 749–759. [Google Scholar] [CrossRef]
- Redford, P.J. Growth analysis formulae their use and abuse. Crop Sci. 1967, 7, 171–175. [Google Scholar] [CrossRef]
- Fisher, R.A. Some remarks on the methods formulated in a recent article on ‘The quantitative analysis of plant growth’. Ann. Appl. Biol. 1921, 7, 367–372. [Google Scholar] [CrossRef] [Green Version]
- Ellis, R.H.; Roberts, E.H. The Quantification of Ageing and Survival in Orthodox Seeds. Seed Sci. Technol. 1981, 9, 373–409. [Google Scholar]
- Murray, M.G.; Thompson, W.F. Rapid isolation of high molecular weight plant DNA. Nucleic Acids Res. 1980, 8, 4321–4325. [Google Scholar] [CrossRef] [Green Version]
- Pradhan, S.K.; Nayak, D.K.; Mohanty, S.; Behera, L.; Barik, S.R.; Pandit, E.; Lenka, S.; Anandan, A. Pyramiding of three bacterial blight resistance genes for broad-spectrum resistance in deepwater rice variety, Jalmagna. Rice 2015, 8, 19. [Google Scholar] [CrossRef]
- Pradhan, S.K.; Nayak, D.K.; Pandit, E.; Behera, L.; Anandan, A.; Mukherjee, A.K.; Lenka, S.; Barik, D.P. Incorporation of bacterial blight resistance genes into lowland rice cultivar through marker-assisted backcross breeding. Phytopathology 2016, 106, 710–718. [Google Scholar] [CrossRef] [Green Version]
- Mohapatra, S.; Bastia, A.K.; Panda, A.K.; Pradhan, S.K. Marker-assisted selection for transfer of submergence tolerance, bacterial blight resistance and yield enhancement in the rice backcross derivatives. Aust. J. Crop Sci. 2020, 14, 1288–1294. [Google Scholar] [CrossRef]
- Liu, K.; Muse, S.V. Power Marker: An integrated analysis environment for genetic marker analysis. Bioinformatics 2005, 21, 2128–2129. [Google Scholar] [CrossRef] [Green Version]
- Pritchard, J.K.; Stephens, M.; Donnelly, P. Inference of population structure using multilocus genotype data. Genetics 2000, 155, 945–959. [Google Scholar] [CrossRef]
- Evanno, G.; Regnaut, S.; Goudet, J. Detecting the number of clusters of individuals using the software STRUCTURE: A simulation study. Mol. Ecol. 2005, 14, 2611–2620. [Google Scholar] [CrossRef] [Green Version]
- Earl, D.A.; Vonholdt, B.M. Structure Harvester: A website and program for visualizing STRUCTURE output and implementing the Evanno method. Conserv. Genet. Resour. 2012, 4, 359–361. [Google Scholar] [CrossRef]
- Perrier, X.; Flori, A.; Bonnot, F. Data analysis methods. In Genetic Diversity of Cultivated Tropical Plants; Hamon, P., Seguin, M., Perrier, X., Glaszmann, J.C., Eds.; Science Publishers: Montpellier, France, 2003; pp. 43–76. [Google Scholar]
- Peakall, R.O.D.; Smouse, P.E. GENALEX 6: Genetic analysis in Excel. Population genetic software for teaching and research. Mol. Ecol. Notes 2006, 6, 288–295. [Google Scholar] [CrossRef]
- Bradbury, P.J.; Zhang, Z.; Kroon, D.E.; Casstevens, T.M.; Ramdoss, Y.; Buckler, E.S. TASSEL: Software for association mapping of complex traits in diverse samples. Bioinformatics 2007, 23, 2633–2635. [Google Scholar] [CrossRef] [PubMed]
- Bose, L.K.; Das, S.; Pradhan, S.K.; Subudhi, H.N.; Singh, S.; Singh, O.N. Genetic variability of quality characters and grain yield in lowland rice genotypes of eastern India. Korean J. Breed. Sci. 2007, 39, 39–44. [Google Scholar]
- Huang, L.; He, H.; Chen, H.; Ren, X.; Chen, Y.; Zhou, X.; Xia, Y.; Wang, X.; Jiang, X.; Liao, B.; et al. Quantitative trait locus analysis of agronomic and quality-related traits in cultivated peanut (Arachis hypogaea L.). Theor. Appl. Genet. 2015, 128, 1103–1115. [Google Scholar] [CrossRef] [Green Version]
- Pradhan, S.K.; Nayak, D.K.; Guru, M.; Pandit, E.; Das, S.; Barik, S.R.; Mohanty, S.P.; Anandan, A. Screening and classification of genotypes for seedling-stage chilling stress tolerance in rice and validation of the trait using SSR markers. Plant Genet. Resour. 2016, 16, 173–182. [Google Scholar] [CrossRef]
- Pradhan, S.K.; Barik, S.R.; Sahoo, J.; Pandit, E.; Nayak, D.K.; Pani, D.R.; Anandan, A. Comparison of Sub1 markers and their combinations for submergence tolerance and analysis of adaptation strategies of rice in rainfed lowland ecology. C. R. Biol. 2015, 338, 650–659. [Google Scholar] [CrossRef]
- Pradhan, S.K.; Barik, S.R.; Sahoo, A.; Mohapatra, S.; Nayak, D.K.; Mahender, A.; Meher, J.; Anandan, A.; Pandit, E. Population structure, genetic diversity and molecular marker-trait association analysis for high temperature stress tolerance in rice. PLoS ONE 2016, 11, 123. [Google Scholar] [CrossRef] [Green Version]
- Pandit, E.; Panda, R.K.; Sahoo, A.; Pani, D.R.; Pradhan, S.K. Genetic Relationship and Structure Analysis of Root Growth Angle for Improvement of Drought Avoidance in Early and Mid-Early Maturing Rice Genotypes. Rice Sci. 2020, 27, 124–132. [Google Scholar] [CrossRef]
- Pandit, E.; Sahoo, A.; Panda, R.K.; Mohanty, D.P.; Pani, D.R.; Anandan, A.; Pradhan, S.K. Survey of rice cultivars and landraces of upland ecology for phosphorous uptake 1 (pup1) QTL using linked and gene specific molecular markers. Oryza 2016, 53, 1–9. [Google Scholar]
- Pradhan, S.K.; Chakraborti, M.; Chakraborty, K.; Behera, L.; Meher, J.; Subudhi, H.N.; Mishra, S.K.; Pandit, E.; Reddy, J.N. Genetic improvement of rainfed shallow lowland rice for higher yield and climate resilience. In Book Rice Research for Enhancing Productivity, Profitability and Climate Resilience; ICAR-NRRI Publication: Cuttack, India, 2018; pp. 107–121. [Google Scholar]
- Bose, L.K.; Pradhan, S.K. Genetic divergence in deepwater rice genotypes. J. Cent. Eur. Agric. 2005, 6, 635–640. [Google Scholar]
- Barik, S.R.; Pandit, E.; Pradhan, S.K.; Mohanty, S.P.; Mohapatra, T. Genetic Mapping of morpho-physiological traits involved during reproductive stage drought tolerance in rice. PLoS ONE 2019, 14, e0214979. [Google Scholar] [CrossRef] [Green Version]
- Singh, Y.; Pani, D.R.; Pradhan, S.K.; Bajpai, A.; Singh, U.S. Divergence analysis for quality traits in some indigenous basmati rice genotypes. Oryza 2008, 45, 263–267. [Google Scholar]
- Pradhan, S.K.; Mani, S.C. Genetic diversity in basmati rice. Oryza 2005, 42, 150. [Google Scholar]
- Arjun, P.; Wagh, M.; Pawar, S.; Mohanty, I.C.; Pandit, E.; Meher, J.; Pradhan, S.K. Genetic Structure and Markers -Trait Association Analyses for Fe-Toxicity Tolerance, Grain-Fe Content and Yield Component Traits in Rice. J. Plant Biol. Crop. Res. 2020, 3, 1022. [Google Scholar]
- Pradhan, S.K.; Pandit, E.; Pawar, S.; Bharati, B.; Chatopadhyay, K.; Singh, S.; Dash, P.; Reddy, J.N. Association mapping reveals multiple QTLs for grain protein content in rice useful forbiofortification. Mol. Genet. Genom. 2019, 294, 963–983. [Google Scholar] [CrossRef]
- Pawar, S.; Pandit, E.; Arjun, P.; Wagh, M.; Bal, D.; Panda, S.; Bastia, D.N.; Pradhan, S.K.; Mohanty, I.C. Genetic variation and association of molecular markers for iron toxicity tolerance in rice. Oryza 2017, 54, 356–366. [Google Scholar] [CrossRef]
- Bastia, R.; Pandit, E.; Sanghamitra, P.; Barik, S.; Nayak, D.K.; Sahoo, A.; Moharana, A.; Meher, J.; Dash, P.K.; Raj, R.; et al. Association Mapping for Quantitative Trait Loci Controlling Superoxide Dismutase, Flavonoids, Anthocyanins, Carotenoids, γ-Oryzanol and Antioxidant Activity in Rice. Agronomy 2022, 12, 3036. [Google Scholar] [CrossRef]
- Jin, J. QTL Mapping of Seed Vigor of Backcross Inbred Lines Derived From Oryza longistaminata Under Artificial Aging. Front. Plant Sci. 2018, 9, 1909. [Google Scholar] [CrossRef] [Green Version]
- Bharamappanavara, M.; Siddaiah, A.M.; Ponnuvel, S.; Ramappa, L.; Patil, B.; Appaiah, M.; Maganti, S.M.; Sundaram, R.M.; Shankaappa, S.K.; Tuti, M.D.; et al. Mapping QTL hotspots associated with weed competitive traits in backcross population derived from Oryza sativa L. and O. glaberrima Steud. Sci. Rep. 2020, 10, 22103. [Google Scholar] [CrossRef]
- To, H.T.M.; Nguyen, H.T.; Dang, N.T.M.; Dang, N.T.M.; Nguyen, N.H.; Bui, T.X.; Lavarenne, J.; Phung, N.T.P.; Gantet, P.; Lebrun, M.; et al. Unraveling the Genetic Elements Involved in Shoot and Root Growth Regulation by Jasmonate in Rice Using a Genome-Wide Association Study. Rice 2019, 12, 69. [Google Scholar] [CrossRef] [PubMed] [Green Version]
- Zhao, Y.; Jiang, C.; Rehman, R.M.A.; Zhang, H.L.; Li, J.; Li, Z.C. Genetic analysis of roots and shoots in rice seedling by association mapping. Genes Genom. 2019, 41, 95–105. [Google Scholar] [CrossRef] [PubMed] [Green Version]
- Han, B.; Xue, Y.; Li, J.; Deng, X.W.; Zhang, Q. Rice functional genomics research in China. Philos. Trans. R. Soc. B 2007, 362, 1009–1021. [Google Scholar] [CrossRef] [PubMed]
- Dang, X.; Thi, T.G.T.; Dong, G.; Wang, H.; Edzesi, W.M.; Hong, D. Genetic diversity and association mapping of seed vigour in rice (Oryza sativa L.). Planta 2014, 239, 1309–1319. [Google Scholar] [CrossRef] [PubMed]
- Kato, Y.; Kamoshita, A.; Yamagishi, J.; Imoto, H.; Abe, J. Growth of Rice (Oryza sativa L.) Cultivars Under Upland Conditions with Different Levels of Water Supply. Root System Development, Soil Moisture Change and Plant Water Status. Plant Prod. Sci. 2007, 10, 3–13. [Google Scholar] [CrossRef] [Green Version]


| Sl. No. | Accession No./ Vernacular Name of the Germplasm Line | Rate of Shoot Growth (RSG) | Relative Growth Rate (RGR) | Absolute Growth Rate (AGR) | Mean Germination Rate (MGR) | Inferred Ancestry Value at K = 4 | Germplasm Lines with High Seedling Growth Parameters | ||||
|---|---|---|---|---|---|---|---|---|---|---|---|
| Q1 | Q2 | Q3 | Q4 | Group | |||||||
| 1 | AC. 5993 | 0.317 | 0.347 | 0.577 | 0.182 | 0.007 | 0.004 | 0.985 | 0.004 | SP3 | RGR |
| 2 | AC. 6221 | 0.667 | 0.105 | 1.283 | 0.209 | 0.004 | 0.009 | 0.984 | 0.003 | SP3 | RGR |
| 3 | AC. 6183 | 0.520 | 0.186 | 2.137 | 0.210 | 0.003 | 0.081 | 0.913 | 0.003 | SP3 | RGR, AGR |
| 4 | AC. 6170 | 0.577 | 0.108 | 1.023 | 0.202 | 0.002 | 0.002 | 0.993 | 0.002 | SP3 | |
| 5 | AC. 6023 | 0.947 | 0.126 | 2.017 | 0.182 | 0.009 | 0.015 | 0.973 | 0.002 | SP3 | AGR |
| 6 | AC. 6172 | 0.440 | 0.261 | 1.040 | 0.213 | 0.007 | 0.042 | 0.949 | 0.002 | SP3 | |
| 7 | AC. 6027 | 1.017 | 0.241 | 1.570 | 0.224 | 0.002 | 0.002 | 0.013 | 0.982 | SP4 | RSG, MGR |
| 8 | AC. 6007 | 0.880 | 0.034 | 2.053 | 0.195 | 0.002 | 0.003 | 0.993 | 0.002 | SP3 | AGR |
| 9 | AC. 9006 | 1.227 | 0.120 | 2.063 | 0.284 | 0.005 | 0.018 | 0.964 | 0.012 | SP3 | RSG, AGR, MGR |
| 10 | AC. 9021 | 1.099 | 0.146 | 1.339 | 0.279 | 0.059 | 0.021 | 0.914 | 0.006 | SP3 | RSG, MGR |
| 11 | AC. 9028 | 1.373 | 0.114 | 2.297 | 0.305 | 0.008 | 0.105 | 0.884 | 0.004 | SP3 | RSG, AGR, MGR |
| 12 | AC. 9030 | 1.767 | 0.239 | 2.293 | 0.267 | 0.006 | 0.006 | 0.987 | 0.001 | SP3 | RSG, RGR, AGR, MGR |
| 13 | AC. 9035 | 1.800 | 0.113 | 2.717 | 0.283 | 0.01 | 0.004 | 0.968 | 0.019 | SP3 | RSG, AGR, MGR |
| 14 | AC. 9038 | 1.623 | 0.276 | 2.527 | 0.273 | 0.013 | 0.002 | 0.983 | 0.002 | SP3 | RSG, RGR, AGR, MGR |
| 15 | AC. 9043 | 1.363 | 0.221 | 1.643 | 0.309 | 0.012 | 0.002 | 0.984 | 0.002 | SP3 | RSG, RGR, MGR |
| 16 | AC. 9044 | 1.103 | 0.272 | 2.350 | 0.320 | 0.003 | 0.003 | 0.988 | 0.006 | SP3 | RSG, RGR, AGR, MGR |
| 17 | AC. 20920 | 1.120 | 0.039 | 2.073 | 0.219 | 0.037 | 0.004 | 0.954 | 0.006 | SP3 | RSG, AGR |
| 18 | AC. 20907 | 0.523 | 0.066 | 0.790 | 0.225 | 0.013 | 0.002 | 0.984 | 0.001 | SP3 | |
| 19 | AC. 20845 | 1.030 | 0.101 | 1.540 | 0.227 | 0.487 | 0.023 | 0.489 | 0.001 | Admix | RSG |
| 20 | AC. 20770 | 1.207 | 0.049 | 1.493 | 0.243 | 0.015 | 0.004 | 0.973 | 0.008 | SP3 | RSG |
| 21 | AC. 20627 | 0.700 | 0.013 | 0.927 | 0.241 | 0.402 | 0.002 | 0.595 | 0.001 | Admix | |
| 22 | AC. 20686 | 0.203 | 0.159 | 0.350 | 0.250 | 0.282 | 0.003 | 0.714 | 0.002 | Admix | |
| 23 | AC. 20664 | 0.290 | 0.080 | 0.510 | 0.232 | 0.616 | 0.01 | 0.372 | 0.002 | Admix | |
| 24 | AC. 20614 | 0.193 | 0.148 | 0.513 | 0.237 | 0.558 | 0.001 | 0.437 | 0.004 | Admix | |
| 25 | Jhagrikartik | 0.337 | 0.096 | 1.307 | 0.232 | 0.012 | 0.009 | 0.977 | 0.002 | SP3 | |
| 26 | Dadghani | 0.340 | 0.096 | 0.450 | 0.259 | 0.021 | 0.006 | 0.969 | 0.004 | SP3 | MGR |
| 27 | Shayam | 0.473 | 0.070 | 1.283 | 0.277 | 0.003 | 0.002 | 0.004 | 0.991 | SP4 | MGR |
| 28 | Basumati | 0.663 | 0.066 | 0.953 | 0.277 | 0.006 | 0.005 | 0.116 | 0.873 | SP4 | MGR |
| 29 | Bharati | 1.047 | 0.183 | 0.873 | 0.230 | 0.253 | 0.001 | 0.742 | 0.004 | Admix | RSG, RGR |
| 30 | Joha | 0.280 | 0.183 | 0.500 | 0.209 | 0.033 | 0.002 | 0.962 | 0.002 | SP3 | RGR |
| 31 | Adira-1 | 0.887 | 0.069 | 1.117 | 0.232 | 0.026 | 0.03 | 0.57 | 0.374 | Admix | |
| 32 | Adira-2 | 0.890 | 0.065 | 1.643 | 0.242 | 0.005 | 0.002 | 0.991 | 0.002 | SP3 | |
| 33 | Adira-3 | 0.840 | 0.109 | 1.373 | 0.227 | 0.173 | 0.005 | 0.413 | 0.409 | Admix | |
| 34 | PK6 | 0.620 | 0.157 | 1.083 | 0.204 | 0.002 | 0.004 | 0.977 | 0.017 | SP3 | RGR |
| 35 | Vachaw | 0.413 | 0.038 | 0.877 | 0.221 | 0.099 | 0.002 | 0.855 | 0.044 | SP3 | |
| 36 | Kozhivalan | 0.527 | 0.184 | 0.620 | 0.224 | 0.005 | 0.003 | 0.992 | 0.001 | Admix | RGR |
| 37 | Marathondi | 1.067 | 0.057 | 1.427 | 0.210 | 0.441 | 0.056 | 0.014 | 0.489 | Admix | RSG, AGR |
| 38 | Ezhoml-2 | 0.677 | 0.257 | 0.920 | 0.252 | 0.073 | 0.001 | 0.924 | 0.002 | SP3 | RGR, MGR |
| 39 | Jyothi | 0.737 | 0.251 | 1.160 | 0.269 | 0.009 | 0.001 | 0.989 | 0.002 | SP3 | RGR, MGR |
| 40 | Kantakopura | 0.980 | 0.121 | 1.427 | 0.227 | 0.312 | 0.002 | 0.684 | 0.002 | Admix | |
| 41 | Kantakaamala | 0.370 | 0.082 | 1.010 | 0.206 | 0.478 | 0.178 | 0.114 | 0.23 | Admix | |
| 42 | Kapanthi | 1.513 | 0.066 | 2.190 | 0.224 | 0.234 | 0.35 | 0.055 | 0.361 | Admix | AGR |
| 43 | Karpurkanti | 0.707 | 0.068 | 1.110 | 0.208 | 0.093 | 0.001 | 0.001 | 0.905 | SP4 | |
| 44 | Kathidhan | 0.447 | 0.089 | 0.867 | 0.204 | 0.423 | 0.112 | 0.461 | 0.005 | Admix | |
| 45 | Kundadhan | 0.777 | 0.246 | 0.933 | 0.173 | 0.897 | 0.013 | 0.088 | 0.003 | SP1 | RGR |
| 46 | Champaeisiali | 0.947 | 0.104 | 2.060 | 0.224 | 0.996 | 0.001 | 0.002 | 0.001 | SP2 | AGR |
| 47 | Latamahu | 0.323 | 0.221 | 1.153 | 0.191 | 0.779 | 0.009 | 0.208 | 0.003 | SP1 | RGR |
| 48 | Latachaunri | 0.237 | 0.197 | 0.653 | 0.212 | 0.705 | 0.011 | 0.281 | 0.003 | Admix | |
| 49 | AC. 10608 | 0.850 | 0.121 | 1.290 | 0.200 | 0.014 | 0.006 | 0.979 | 0.001 | SP3 | AGR |
| 50 | AC. 10187 | 0.667 | 0.157 | 2.583 | 0.206 | 0.005 | 0.079 | 0.912 | 0.003 | SP3 | RGR, AGR |
| 51 | AC. 10162 | 0.890 | 0.073 | 1.957 | 0.182 | 0.04 | 0.043 | 0.893 | 0.023 | SP3 | |
| 52 | AC. 7282 | 0.990 | 0.075 | 1.917 | 0.212 | 0.002 | 0.001 | 0.002 | 0.995 | SP4 | MGR |
| 53 | AC. 7269 | 0.640 | 0.244 | 1.210 | 0.184 | 0.004 | 0.003 | 0.993 | 0.001 | SP3 | RGR |
| 54 | AC. 7134 | 0.690 | 0.233 | 1.377 | 0.182 | 0.058 | 0.01 | 0.727 | 0.205 | Admix | RGR |
| 55 | AC. 7008 | 0.700 | 0.191 | 1.360 | 0.182 | 0.042 | 0.002 | 0.955 | 0.001 | SP3 | RGR |
| 56 | AC. 9093 | 0.573 | 0.150 | 1.030 | 0.306 | 0.003 | 0.002 | 0.99 | 0.005 | SP3 | RGR, MGR |
| 57 | AC. 9090 | 0.797 | 0.147 | 1.273 | 0.288 | 0.032 | 0.006 | 0.945 | 0.018 | SP3 | MGR |
| 58 | AC. 9076A | 0.133 | 0.195 | 0.677 | 0.252 | 0.102 | 0.011 | 0.886 | 0.002 | SP3 | MGR |
| 59 | AC. 9065 | 0.883 | 0.121 | 1.153 | 0.302 | 0.012 | 0.005 | 0.921 | 0.062 | SP3 | RGR, MGR |
| 60 | AC. 9063 | 1.190 | 0.126 | 1.557 | 0.264 | 0.202 | 0.014 | 0.783 | 0.001 | Admix | RSG, MGR |
| 61 | AC. 9058 | 1.170 | 0.115 | 1.407 | 0.275 | 0.007 | 0.001 | 0.991 | 0.001 | SP3 | RSG, MGR |
| 62 | AC. 9053A | 1.057 | 0.013 | 1.197 | 0.255 | 0.009 | 0.155 | 0.823 | 0.013 | SP3 | RSG, MGR |
| 63 | AC. 9050 | 0.257 | 0.151 | 0.473 | 0.261 | 0.079 | 0.003 | 0.909 | 0.009 | SP3 | RGR |
| 64 | AC. 9005 | 1.109 | 0.077 | 1.912 | 0.293 | 0.01 | 0.005 | 0.981 | 0.003 | SP3 | RSG, MGR |
| 65 | AC. 20389 | 0.707 | 0.109 | 1.220 | 0.280 | 0.003 | 0.034 | 0.951 | 0.011 | SP3 | MGR |
| 66 | AC. 20371 | 1.193 | 0.100 | 1.540 | 0.307 | 0.041 | 0.006 | 0.952 | 0.001 | SP3 | RSG, AGR, MGR |
| 67 | AC. 20423 | 0.590 | 0.142 | 1.680 | 0.213 | 0.018 | 0.005 | 0.976 | 0.001 | SP3 | AGR |
| 68 | AC. 20362 | 1.130 | 0.100 | 1.187 | 0.286 | 0.008 | 0.017 | 0.968 | 0.007 | SP3 | RSG, AGR, MGR |
| 69 | AC. 20328 | 1.120 | 0.100 | 1.660 | 0.281 | 0.155 | 0.012 | 0.816 | 0.018 | SP3 | RSG, AGR, MGR |
| 70 | AC.20317 | 0.150 | 0.146 | 0.497 | 0.288 | 0.078 | 0.004 | 0.884 | 0.035 | SP3 | MGR |
| 71 | AC. 20282 | 1.150 | 0.094 | 2.033 | 0.251 | 0.172 | 0.12 | 0.695 | 0.013 | Admix | RSG, AGR, MGR |
| 72 | AC. 20246 | 0.893 | 0.123 | 1.297 | 0.266 | 0.084 | 0.047 | 0.775 | 0.094 | Admix | MGR |
| 73 | AC. 20347 | 0.693 | 0.130 | 1.257 | 0.224 | 0.008 | 0.048 | 0.942 | 0.002 | SP3 | |
| 74 | Palinadhan-1 | 0.660 | 0.075 | 0.927 | 0.236 | 0.039 | 0.267 | 0.284 | 0.411 | Admix | |
| 75 | Chatuimuchi | 0.527 | 0.142 | 1.190 | 0.266 | 0.001 | 0.001 | 0.001 | 0.996 | SP4 | MGR |
| 76 | Uttarbangalocal-9 | 0.107 | 0.159 | 0.307 | 0.236 | 0.114 | 0.124 | 0.76 | 0.002 | Admix | RGR |
| 77 | Gochi | 0.447 | 0.159 | 0.697 | 0.246 | 0.006 | 0.048 | 0.937 | 0.009 | SP3 | RGR |
| 78 | Sugandha-2 | 0.433 | 0.029 | 0.890 | 0.273 | 0.002 | 0.001 | 0.003 | 0.993 | SP4 | MGR |
| 79 | Jhingesal | 0.937 | 0.182 | 1.547 | 0.243 | 0.458 | 0.002 | 0.539 | 0.001 | Admix | RGR |
| 80 | Cheruvirippu | 0.503 | 0.084 | 0.803 | 0.228 | 0.088 | 0.004 | 0.906 | 0.002 | SP3 | |
| 81 | Mahamaga | 0.617 | 0.100 | 1.060 | 0.218 | 0.37 | 0.071 | 0.557 | 0.002 | Admix | |
| 82 | Jaya | 0.507 | 0.273 | 1.033 | 0.223 | 0.057 | 0.009 | 0.933 | 0.002 | SP3 | RGR |
| 83 | D1 | 0.483 | 0.241 | 0.840 | 0.198 | 0.028 | 0.057 | 0.887 | 0.028 | SP3 | RGR |
| 84 | PK21 | 1.613 | 0.059 | 2.400 | 0.231 | 0.152 | 0.031 | 0.814 | 0.002 | Admix | RSG, AGR |
| 85 | Gandhakasala | 0.670 | 0.091 | 1.390 | 0.227 | 0.106 | 0.004 | 0.002 | 0.888 | SP4 | |
| 86 | Sreyas | 0.707 | 0.064 | 1.373 | 0.220 | 0.071 | 0.003 | 0.923 | 0.004 | SP3 | |
| 87 | Gondiachampeisiali | 0.910 | 0.084 | 1.423 | 0.222 | 0.995 | 0.001 | 0.002 | 0.001 | SP1 | |
| 88 | Chinamal | 0.533 | 0.199 | 1.117 | 0.212 | 0.578 | 0.002 | 0.409 | 0.011 | Admix | RGR |
| 89 | Magra | 1.060 | 0.180 | 2.073 | 0.211 | 0.451 | 0.003 | 0.541 | 0.005 | Admix | RSG |
| 90 | Landi | 0.843 | 0.030 | 1.590 | 0.229 | 0.847 | 0.003 | 0.148 | 0.002 | SP1 | |
| 91 | Lalgundi | 0.600 | 0.143 | 1.443 | 0.224 | 0.956 | 0.017 | 0.022 | 0.005 | SP1 | RGR |
| 92 | Balisaralaktimachi | 0.977 | 0.141 | 2.170 | 0.227 | 0.976 | 0.007 | 0.014 | 0.003 | SP1 | |
| 93 | Laxmibilash | 0.377 | 0.259 | 0.650 | 0.256 | 0.416 | 0.006 | 0.013 | 0.565 | Admix | MGR |
| 94 | Kaniar | 0.843 | 0.051 | 1.250 | 0.225 | 0.579 | 0.014 | 0.394 | 0.012 | Admix | MGR |
| 95 | Kanakchampa | 0.457 | 0.308 | 1.190 | 0.179 | 0.756 | 0.008 | 0.223 | 0.014 | Admix | RGR |
| 96 | Magura-S | 1.350 | 0.246 | 2.097 | 0.189 | 0.862 | 0.003 | 0.043 | 0.092 | SP1 | RGR, AGR |
| 97 | AC. 44603 | 2.050 | 0.044 | 1.100 | 0.333 | 0.036 | 0.945 | 0.018 | 0.002 | SP2 | RSG, MGR |
| 98 | AC. 44585 | 0.750 | 0.064 | 0.611 | 0.333 | 0.004 | 0.978 | 0.006 | 0.013 | SP2 | MGR |
| 99 | AC. 44598 | 0.200 | 0.056 | 0.500 | 0.333 | 0.003 | 0.968 | 0.019 | 0.01 | SP2 | MGR |
| 100 | AC. 44592 | 1.517 | 0.047 | 0.883 | 0.333 | 0.002 | 0.982 | 0.002 | 0.015 | SP2 | RSG, MGR |
| 101 | AC. 44646 | 2.033 | 0.033 | 1.200 | 0.333 | 0.002 | 0.994 | 0.002 | 0.002 | SP2 | RSG, MGR |
| 102 | AC. 44604 | 1.717 | 0.037 | 0.622 | 0.333 | 0.003 | 0.951 | 0.029 | 0.017 | SP2 | RSG, MGR |
| 103 | AC. 44597 | 3.583 | 0.023 | 1.594 | 0.333 | 0.004 | 0.993 | 0.002 | 0.001 | SP2 | RSG, MGR |
| 104 | AC. 44638 | 3.433 | 0.030 | 2.006 | 0.333 | 0.001 | 0.284 | 0.001 | 0.714 | Admix | RSG, AGR, MGR |
| 105 | AC. 44595 | 2.283 | 0.023 | 0.856 | 0.333 | 0.003 | 0.977 | 0.008 | 0.012 | SP2 | RSG, MGR |
| 106 | AC. 44588 | 1.900 | 0.023 | 0.717 | 0.333 | 0.002 | 0.994 | 0.003 | 0.002 | SP2 | RSG, MGR |
| 107 | AC. 44591 | 3.100 | 0.025 | 1.144 | 0.333 | 0.002 | 0.995 | 0.003 | 0.001 | SP2 | RSG, MGR |
| 108 | AC. 44594 | 5.100 | 0.045 | 2.150 | 0.333 | 0.006 | 0.979 | 0.013 | 0.002 | SP2 | RSG, MGR |
| 109 | AC. 43737 | 4.850 | 0.027 | 2.617 | 0.293 | 0.002 | 0.991 | 0.003 | 0.003 | SP2 | RSG, AGR, MGR |
| 110 | AC. 43660 | 8.983 | 0.101 | 4.450 | 0.310 | 0.003 | 0.993 | 0.003 | 0.002 | SP2 | RSG, AGR, MGR |
| 111 | AC. 43732 | 3.683 | 0.051 | 2.089 | 0.323 | 0.002 | 0.995 | 0.002 | 0.001 | SP2 | RSG, AGR, MGR |
| 112 | AC. 43661 | 4.433 | 0.034 | 2.356 | 0.327 | 0.003 | 0.988 | 0.007 | 0.002 | SP2 | RSG, AGR, MGR |
| 113 | AC. 43738 | 3.467 | 0.032 | 1.556 | 0.301 | 0.004 | 0.991 | 0.002 | 0.003 | SP2 | RSG, AGR, MGR |
| 114 | AC. 43669 | 6.533 | 0.038 | 3.722 | 0.325 | 0.004 | 0.987 | 0.006 | 0.003 | SP2 | RSG, AGR, MGR |
| 115 | AC. 43663 | 2.483 | 0.075 | 1.689 | 0.417 | 0.002 | 0.994 | 0.002 | 0.003 | SP2 | RSG, AGR, MGR |
| 116 | AC. 43658 | 2.517 | 0.050 | 1.633 | 0.293 | 0.001 | 0.996 | 0.001 | 0.001 | SP2 | RSG, AGR, MGR |
| 117 | AC. 43662 | 4.567 | 0.034 | 2.250 | 0.290 | 0.002 | 0.96 | 0.004 | 0.034 | SP2 | RSG, AGR, MGR |
| 118 | AC. 43670 | 4.333 | 0.091 | 2.294 | 0.296 | 0.004 | 0.816 | 0.003 | 0.178 | SP2 | RSG, AGR, MGR |
| 119 | AC. 43675 | 6.650 | 0.054 | 3.828 | 0.310 | 0.002 | 0.98 | 0.003 | 0.014 | SP2 | RSG, AGR, MGR |
| 120 | AC. 43676 | 0.067 | 0.047 | 0.756 | 0.286 | 0.014 | 0.935 | 0.007 | 0.044 | SP2 | MGR |
| 121 | CR4034-77-56-1 | 0.692 | 0.173 | 0.825 | 0.189 | 0.996 | 0.001 | 0.002 | 0.001 | SP1 | RGR, MGR |
| 122 | CR4034-77-25-4 | 0.725 | 0.181 | 0.912 | 0.178 | 0.995 | 0.001 | 0.002 | 0.001 | SP1 | RGR, MGR |
| 123 | Jalamagna | 0.930 | 0.114 | 2.320 | 0.220 | 0.996 | 0.001 | 0.002 | 0.001 | SP1 | AGR, MGR |
| 124 | Panidhan | 0.900 | 0.081 | 1.390 | 0.201 | 0.996 | 0.001 | 0.002 | 0.001 | SP1 | |
| CV % | 10.56 | 11.71 | 12.74 | 4.17 | |||||||
| LSD5% | 0.145 | 0.051 | 0.232 | 0.089 | |||||||
| Sl. No | Marker | No. of Alleles | Major Allele Frequency | Gene Diversity | Heterozygosity | PIC | Inbreeding Coefficient (f) |
|---|---|---|---|---|---|---|---|
| 1 | RM5310 | 4 | 0.790 | 0.357 | 0.032 | 0.335 | 0.910 |
| 2 | RM582 | 4 | 0.718 | 0.454 | 0.032 | 0.422 | 0.930 |
| 3 | RM13335 | 4 | 0.577 | 0.525 | 0.008 | 0.430 | 0.985 |
| 4 | RM6275 | 4 | 0.730 | 0.436 | 0.056 | 0.402 | 0.871 |
| 5 | RM50 | 4 | 0.403 | 0.685 | 0.024 | 0.626 | 0.965 |
| 6 | RM85 | 4 | 0.431 | 0.669 | 0.121 | 0.608 | 0.821 |
| 7 | RM222 | 4 | 0.625 | 0.562 | 0.024 | 0.524 | 0.957 |
| 8 | RM247 | 5 | 0.500 | 0.594 | 0.065 | 0.515 | 0.892 |
| 9 | RM328 | 3 | 0.581 | 0.570 | 0.000 | 0.504 | 1.000 |
| 10 | RM337 | 6 | 0.431 | 0.667 | 0.113 | 0.609 | 0.832 |
| 11 | RM340 | 5 | 0.722 | 0.443 | 0.097 | 0.405 | 0.783 |
| 12 | RM470 | 5 | 0.464 | 0.689 | 0.839 | 0.643 | −0.213 |
| 13 | RM472 | 3 | 0.528 | 0.506 | 0.089 | 0.386 | 0.826 |
| 14 | RM506 | 3 | 0.694 | 0.450 | 0.129 | 0.383 | 0.715 |
| 15 | RM1812 | 3 | 0.444 | 0.604 | 0.000 | 0.519 | 1.000 |
| 16 | RM3701 | 4 | 0.677 | 0.481 | 0.492 | 0.425 | −0.019 |
| 17 | RM6947 | 3 | 0.871 | 0.231 | 0.000 | 0.215 | 1.000 |
| 18 | RM14978 | 3 | 0.419 | 0.637 | 0.000 | 0.560 | 1.000 |
| 19 | RM18776 | 3 | 0.851 | 0.260 | 0.024 | 0.236 | 0.908 |
| 20 | RM22034 | 3 | 0.919 | 0.150 | 0.000 | 0.143 | 1.000 |
| 21 | RM24161 | 4 | 0.540 | 0.613 | 0.129 | 0.552 | 0.791 |
| 22 | RM223 | 5 | 0.649 | 0.541 | 0.056 | 0.509 | 0.897 |
| 23 | RM440 | 5 | 0.403 | 0.695 | 0.266 | 0.641 | 0.620 |
| 24 | RM201 | 3 | 0.496 | 0.574 | 0.024 | 0.482 | 0.958 |
| 25 | RM216 | 4 | 0.528 | 0.629 | 0.121 | 0.574 | 0.809 |
| 26 | RM258 | 3 | 0.387 | 0.654 | 0.000 | 0.579 | 1.000 |
| 27 | RM286 | 4 | 0.464 | 0.631 | 0.113 | 0.560 | 0.823 |
| 28 | RM3735 | 4 | 0.339 | 0.722 | 0.960 | 0.670 | −0.325 |
| 29 | RM1347 | 3 | 0.516 | 0.565 | 0.000 | 0.472 | 1.000 |
| 30 | RM7571 | 3 | 0.706 | 0.445 | 0.008 | 0.388 | 0.982 |
| 31 | RM14723 | 4 | 0.508 | 0.634 | 0.194 | 0.573 | 0.697 |
| 32 | RM103 | 3 | 0.492 | 0.557 | 0.774 | 0.458 | −0.386 |
| 33 | RM315 | 3 | 0.871 | 0.228 | 0.000 | 0.209 | 1.000 |
| 34 | RM225 | 3 | 0.508 | 0.549 | 0.177 | 0.448 | 0.679 |
| 35 | RM486 | 3 | 0.649 | 0.481 | 0.105 | 0.398 | 0.783 |
| 36 | RM256 | 3 | 0.730 | 0.403 | 0.056 | 0.333 | 0.861 |
| 37 | RM1113 | 3 | 0.665 | 0.460 | 0.056 | 0.374 | 0.878 |
| 38 | RM3423 | 3 | 0.484 | 0.575 | 0.000 | 0.483 | 1.000 |
| 39 | RM6100 | 3 | 0.427 | 0.644 | 0.032 | 0.569 | 0.950 |
| 40 | RM590 | 3 | 0.718 | 0.441 | 0.065 | 0.395 | 0.855 |
| 41 | RM5793 | 3 | 0.629 | 0.531 | 0.016 | 0.471 | 0.970 |
| 42 | RM405 | 3 | 0.685 | 0.480 | 0.000 | 0.432 | 1.000 |
| 43 | RM547 | 5 | 0.488 | 0.570 | 0.161 | 0.477 | 0.719 |
| 44 | RM7364 | 5 | 0.633 | 0.561 | 0.161 | 0.529 | 0.714 |
| 45 | RM205 | 3 | 0.633 | 0.522 | 0.024 | 0.458 | 0.954 |
| 46 | RM167 | 4 | 0.714 | 0.452 | 0.097 | 0.412 | 0.787 |
| 47 | RM229 | 4 | 0.363 | 0.707 | 0.129 | 0.652 | 0.819 |
| 48 | RM20A | 3 | 0.637 | 0.523 | 0.016 | 0.463 | 0.969 |
| 49 | RM235 | 5 | 0.399 | 0.715 | 0.169 | 0.667 | 0.765 |
| 50 | RM7003 | 4 | 0.677 | 0.491 | 0.081 | 0.443 | 0.837 |
| 51 | RM5436 | 4 | 0.444 | 0.618 | 0.056 | 0.540 | 0.909 |
| 52 | RM25181 | 5 | 0.399 | 0.704 | 0.161 | 0.653 | 0.772 |
| 53 | RM469 | 3 | 0.633 | 0.514 | 0.040 | 0.444 | 0.922 |
| 54 | RM6547 | 3 | 0.871 | 0.233 | 0.016 | 0.220 | 0.931 |
| 55 | RM152 | 4 | 0.492 | 0.632 | 0.016 | 0.566 | 0.975 |
| 56 | RM148 | 2 | 0.669 | 0.443 | 0.081 | 0.345 | 0.819 |
| 57 | RM421 | 3 | 0.476 | 0.624 | 0.000 | 0.549 | 1.000 |
| 58 | RM2634 | 3 | 0.399 | 0.655 | 0.024 | 0.581 | 0.963 |
| 59 | RM248 | 4 | 0.335 | 0.734 | 0.113 | 0.685 | 0.847 |
| 60 | RM7179 | 5 | 0.331 | 0.763 | 0.347 | 0.724 | 0.548 |
| 61 | RM215 | 3 | 0.597 | 0.500 | 0.016 | 0.397 | 0.968 |
| 62 | RM324 | 4 | 0.556 | 0.624 | 0.153 | 0.579 | 0.756 |
| 63 | RM317 | 3 | 0.734 | 0.395 | 0.000 | 0.323 | 1.000 |
| 64 | RM174 | 3 | 0.524 | 0.612 | 0.065 | 0.543 | 0.895 |
| 65 | RM556 | 3 | 0.847 | 0.271 | 0.032 | 0.254 | 0.882 |
| 66 | RM257 | 4 | 0.395 | 0.662 | 0.226 | 0.592 | 0.661 |
| 67 | RM502 | 3 | 0.815 | 0.310 | 0.000 | 0.275 | 1.000 |
| 68 | RM331 | 4 | 0.468 | 0.672 | 0.056 | 0.619 | 0.917 |
| 69 | RM403 | 4 | 0.577 | 0.581 | 0.081 | 0.522 | 0.862 |
| 70 | RM309 | 3 | 0.698 | 0.458 | 0.040 | 0.403 | 0.913 |
| 71 | RM6641 | 3 | 0.565 | 0.585 | 0.000 | 0.520 | 1.000 |
| 72 | RM3 | 3 | 0.371 | 0.664 | 0.032 | 0.590 | 0.952 |
| 73 | RM594 | 3 | 0.585 | 0.558 | 0.008 | 0.487 | 0.986 |
| 74 | RM3392 | 4 | 0.488 | 0.617 | 0.105 | 0.545 | 0.831 |
| 75 | RM1278 | 3 | 0.774 | 0.372 | 0.065 | 0.337 | 0.828 |
| 76 | RM168 | 3 | 0.629 | 0.506 | 0.161 | 0.428 | 0.684 |
| 77 | RM3375 | 3 | 0.581 | 0.567 | 0.032 | 0.499 | 0.944 |
| 78 | RM282 | 3 | 0.734 | 0.426 | 0.000 | 0.387 | 1.000 |
| 79 | RM26632 | 4 | 0.367 | 0.701 | 0.153 | 0.645 | 0.783 |
| 80 | RM1341 | 3 | 0.593 | 0.546 | 0.024 | 0.472 | 0.956 |
| 81 | RM4112 | 3 | 0.504 | 0.615 | 0.153 | 0.542 | 0.753 |
| 82 | RM20377 | 4 | 0.762 | 0.382 | 0.081 | 0.338 | 0.790 |
| 83 | RM210 | 5 | 0.367 | 0.733 | 0.710 | 0.685 | 0.035 |
| 84 | RM218 | 4 | 0.597 | 0.574 | 0.032 | 0.522 | 0.944 |
| 85 | RM494 | 5 | 0.387 | 0.712 | 0.024 | 0.664 | 0.966 |
| 86 | RM336 | 5 | 0.387 | 0.706 | 0.089 | 0.655 | 0.875 |
| 87 | RM3475 | 4 | 0.452 | 0.662 | 0.040 | 0.600 | 0.940 |
| 88 | RM480 | 4 | 0.552 | 0.607 | 0.024 | 0.551 | 0.960 |
| 89 | RM566 | 4 | 0.452 | 0.650 | 0.016 | 0.585 | 0.975 |
| 90 | RM11701 | 3 | 0.653 | 0.464 | 0.000 | 0.370 | 1.000 |
| 91 | RM220 | 6 | 0.355 | 0.747 | 0.194 | 0.706 | 0.743 |
| 92 | RM488 | 6 | 0.310 | 0.753 | 0.202 | 0.711 | 0.734 |
| 93 | RM6374 | 6 | 0.327 | 0.772 | 0.073 | 0.737 | 0.907 |
| 94 | RM233 | 5 | 0.347 | 0.728 | 0.258 | 0.681 | 0.648 |
| 95 | RM112 | 3 | 0.879 | 0.216 | 0.000 | 0.199 | 1.000 |
| 96 | RM13600 | 4 | 0.480 | 0.663 | 0.097 | 0.608 | 0.855 |
| 97 | RM495 | 3 | 0.613 | 0.549 | 0.032 | 0.490 | 0.942 |
| 98 | RM493 | 7 | 0.274 | 0.817 | 0.573 | 0.792 | 0.303 |
| 99 | RM444 | 5 | 0.310 | 0.776 | 0.153 | 0.740 | 0.804 |
| 100 | RM468 | 3 | 0.778 | 0.369 | 0.024 | 0.338 | 0.935 |
| 101 | RM6054 | 3 | 0.927 | 0.137 | 0.016 | 0.133 | 0.883 |
| 102 | RM509 | 3 | 0.766 | 0.385 | 0.000 | 0.351 | 1.000 |
| 103 | RM5638 | 6 | 0.625 | 0.574 | 0.129 | 0.545 | 0.777 |
| 104 | RM8044 | 6 | 0.286 | 0.759 | 0.226 | 0.718 | 0.704 |
| 105 | RM8271 | 5 | 0.415 | 0.717 | 0.145 | 0.673 | 0.799 |
| 106 | RM171 | 4 | 0.500 | 0.640 | 0.056 | 0.580 | 0.912 |
| 107 | RM16686 | 3 | 0.403 | 0.656 | 0.000 | 0.582 | 1.000 |
| 108 | RM434 | 4 | 0.565 | 0.596 | 0.024 | 0.538 | 0.960 |
| 109 | RM6091 | 4 | 0.823 | 0.310 | 0.000 | 0.291 | 1.000 |
| 110 | RM209 | 4 | 0.540 | 0.613 | 0.000 | 0.552 | 1.000 |
| 111 | RM245 | 4 | 0.565 | 0.593 | 0.000 | 0.532 | 1.000 |
| 112 | RM1089 | 4 | 0.419 | 0.633 | 0.065 | 0.561 | 0.899 |
| 113 | RM228 | 4 | 0.637 | 0.533 | 0.185 | 0.481 | 0.654 |
| 114 | RM401 | 3 | 0.762 | 0.388 | 0.056 | 0.351 | 0.856 |
| 115 | RM11 | 3 | 0.464 | 0.588 | 0.008 | 0.499 | 0.986 |
| 116 | RM3351 | 3 | 0.597 | 0.511 | 0.000 | 0.415 | 1.000 |
| 117 | RM5749 | 3 | 0.585 | 0.505 | 0.024 | 0.399 | 0.952 |
| 118 | RM335 | 2 | 0.730 | 0.394 | 0.073 | 0.317 | 0.817 |
| 119 | RM144 | 3 | 0.593 | 0.512 | 0.169 | 0.416 | 0.672 |
| 120 | RM300 | 3 | 0.855 | 0.258 | 0.016 | 0.240 | 0.938 |
| 121 | RM1132 | 4 | 0.379 | 0.719 | 0.032 | 0.668 | 0.955 |
| 122 | RM400 | 4 | 0.363 | 0.717 | 0.468 | 0.665 | 0.352 |
| 123 | RM471 | 3 | 0.790 | 0.350 | 0.000 | 0.318 | 1.000 |
| 124 | RM243 | 3 | 0.573 | 0.553 | 0.016 | 0.474 | 0.971 |
| 125 | RM467 | 3 | 0.573 | 0.566 | 0.000 | 0.494 | 1.000 |
| 126 | RM564 | 4 | 0.452 | 0.610 | 0.097 | 0.530 | 0.842 |
| 127 | RM8007 | 3 | 0.774 | 0.375 | 0.000 | 0.344 | 1.000 |
| 128 | RM441 | 4 | 0.476 | 0.624 | 0.581 | 0.553 | 0.073 |
| 129 | RM518 | 3 | 0.540 | 0.537 | 0.000 | 0.436 | 1.000 |
| 130 | RM253 | 4 | 0.536 | 0.602 | 0.081 | 0.534 | 0.867 |
| 131 | RM274 | 3 | 0.677 | 0.467 | 0.000 | 0.399 | 1.000 |
| 132 | RM242 | 4 | 0.573 | 0.591 | 0.016 | 0.535 | 0.973 |
| 133 | RM3231 | 4 | 0.343 | 0.702 | 0.661 | 0.643 | 0.063 |
| 134 | RM5687 | 4 | 0.411 | 0.693 | 0.645 | 0.637 | 0.073 |
| 135 | RM5626 | 3 | 0.581 | 0.512 | 0.742 | 0.410 | −0.446 |
| 136 | RM452 | 3 | 0.460 | 0.626 | 0.000 | 0.548 | 1.000 |
| 137 | RM14960 | 2 | 0.976 | 0.047 | 0.000 | 0.046 | 1.000 |
| 138 | RM558 | 2 | 0.968 | 0.062 | 0.000 | 0.060 | 1.000 |
| 139 | RM406 | 2 | 0.968 | 0.062 | 0.000 | 0.060 | 1.000 |
| 140 | RM522 | 2 | 0.976 | 0.047 | 0.000 | 0.046 | 1.000 |
| 141 | RM10124 | 2 | 0.968 | 0.062 | 0.000 | 0.060 | 1.000 |
| 142 | RM181 | 3 | 0.919 | 0.151 | 0.000 | 0.146 | 1.000 |
| 143 | RM175 | 3 | 0.887 | 0.207 | 0.000 | 0.197 | 1.000 |
| Mean | 3.65 | 0.582 | 0.530 | 0.109 | 0.474 | 0.796 |
| Sources of Variation | AMOVA for the Four Subpopulations at K = 4 | |||
|---|---|---|---|---|
| df. | Mean Sum of Squares | Estimated Variance | Percentage Variation | |
| Among populations | 4 | 305.33 | 5.46 | 14 |
| Among individuals (accessions) within population | 119 | 60.61 | 26.42 | 67 |
| Within individuals (accessions) | 124 | 7.77 | 7.77 | 20 |
| Total | 247 | 39.65 | 100 | |
| F-Statistics | Value | p-value | ||
| FST | 0.138 | |||
| FIS | 0.773 | |||
| FIT | 0.804 | |||
| FST max. | 0.522 | |||
| F’ST | 0.264 | |||
| Traits | Marker | Chr # | Position | GLM | MLM | ||||||
|---|---|---|---|---|---|---|---|---|---|---|---|
| Marker_F | Marker_p | q Value | Marker_R2 | F | p | q Value | Marker_R2 | ||||
| RSG | RM337 | 8 | 27 | 27.20863 | 7.73E−07 | 7.34E−06 | 0.0892 | 16.54241 | 8.55E−05 | 0.001159 | 0.11592 |
| RSG | RM22034 | 7 | 56 | 15.24579 | 1.56E−04 | 0.000573 | 0.05441 | 7.72005 | 0.00634 | 0.007529 | 0.0541 |
| RSG | RM494 | 6 | 221 | 14.93372 | 1.81E−04 | 0.000573 | 0.05341 | 14.91786 | 1.83E−04 | 0.001159 | 0.10454 |
| RGR | RM1812 | 11 | 44 | 10.65642 | 0.00143 | 0.002236 | 0.05988 | 9.21126 | 0.00295 | 0.005605 | 0.07091 |
| AGR | RM337 | 8 | 27 | 16.07491 | 1.06E−04 | 0.000504 | 0.1088 | 9.56844 | 0.00246 | 0.005193 | 0.07805 |
| AGR | RM7179 | 6 | 159 | 10.79532 | 0.00133 | 0.002236 | 0.07601 | 10.27457 | 0.00173 | 0.005178 | 0.08381 |
| AGR | RM494 | 6 | 221 | 7.88757 | 0.00581 | 0.006494 | 0.0568 | 9.96554 | 0.00202 | 0.005178 | 0.08129 |
| AGR | RM16686 | 4 | 300 | 10.75337 | 0.00136 | 0.002236 | 0.07574 | 11.68419 | 8.62E−04 | 0.003276 | 0.09531 |
| MGR | RM3735 | 4 | 80 | 31.13489 | 1.52E−07 | 2.89E−06 | 0.10146 | 15.01011 | 1.75E−04 | 0.001159 | 0.1052 |
Disclaimer/Publisher’s Note: The statements, opinions and data contained in all publications are solely those of the individual author(s) and contributor(s) and not of MDPI and/or the editor(s). MDPI and/or the editor(s) disclaim responsibility for any injury to people or property resulting from any ideas, methods, instructions or products referred to in the content. |
© 2023 by the authors. Licensee MDPI, Basel, Switzerland. This article is an open access article distributed under the terms and conditions of the Creative Commons Attribution (CC BY) license (https://creativecommons.org/licenses/by/4.0/).
Share and Cite
Mohanty, S.P.; Nayak, D.K.; Sanghamitra, P.; Barik, S.R.; Pandit, E.; Behera, A.; Pani, D.R.; Mohapatra, S.; Raj K. R., R.; Pradhan, K.C.; et al. Mapping the Genomic Regions Controlling Germination Rate and Early Seedling Growth Parameters in Rice. Genes 2023, 14, 902. https://doi.org/10.3390/genes14040902
Mohanty SP, Nayak DK, Sanghamitra P, Barik SR, Pandit E, Behera A, Pani DR, Mohapatra S, Raj K. R. R, Pradhan KC, et al. Mapping the Genomic Regions Controlling Germination Rate and Early Seedling Growth Parameters in Rice. Genes. 2023; 14(4):902. https://doi.org/10.3390/genes14040902
Chicago/Turabian StyleMohanty, Shakti Prakash, Deepak Kumar Nayak, Priyadarsini Sanghamitra, Saumya Ranjan Barik, Elssa Pandit, Abhisarika Behera, Dipti Ranjan Pani, Shibani Mohapatra, Reshmi Raj K. R., Kartik Chandra Pradhan, and et al. 2023. "Mapping the Genomic Regions Controlling Germination Rate and Early Seedling Growth Parameters in Rice" Genes 14, no. 4: 902. https://doi.org/10.3390/genes14040902