Article

Integrative Transcriptomics Data Mining to Explore the Functions of TDP1α and TDP1β Genes in the Arabidopsis thaliana Model Plant

Department of Biology and Biotechnology “L. Spallanzani”, University of Pavia, 27100 Pavia, Italy
*
Author to whom correspondence should be addressed.
Genes 2023, 14(4), 884; https://doi.org/10.3390/genes14040884
Submission received: 17 March 2023 / Revised: 7 April 2023 / Accepted: 7 April 2023 / Published: 9 April 2023
(This article belongs to the Collection Feature Papers: 'Plant Genetics and Genomics' Section)

Abstract

:
The tyrosyl-DNA phosphodiesterase 1 (TDP1) enzyme hydrolyzes the phosphodiester bond between a tyrosine residue and the 3′-phosphate of DNA in the DNA–topoisomerase I (TopI) complex, being involved in different DNA repair pathways. A small TDP1 gene subfamily is present in plants, where TDP1α has been linked to genome stability maintenance, while TDP1β has unknown functions. This work aimed to comparatively investigate the function of the TDP1 genes by taking advantage of the rich transcriptomics databases available for the Arabidopsis thaliana model plant. A data mining approach was carried out to collect information regarding gene expression in different tissues, genetic backgrounds, and stress conditions, using platforms where RNA-seq and microarray data are deposited. The gathered data allowed us to distinguish between common and divergent functions of the two genes. Namely, TDP1β seems to be involved in root development and associated with gibberellin and brassinosteroid phytohormones, whereas TDP1α is more responsive to light and abscisic acid. During stress conditions, both genes are highly responsive to biotic and abiotic treatments in a time- and stress-dependent manner. Data validation using gamma-ray treatments applied to Arabidopsis seedlings indicated the accumulation of DNA damage and extensive cell death associated with the observed changes in the TDP1 genes expression profiles.

1. Introduction

One of the challenges that living organisms face is to respond promptly to genotoxic stress and avoid the accumulation of DNA damage. Maintenance of genome integrity is required for the proper development and faithful transmission of genetic information to the next generations. However, cells are continuously subjected to DNA damage, which is caused by either endogenous factors or exogenous stimuli. Hence, plants have evolved highly efficient mechanisms to detect and repair DNA damage to maintain genome stability [1,2,3,4].
Among the different types of DNA damage, strand breaks (single-SSB and double-DSB) are the most damaging and can be transiently induced by the cell under certain conditions [5,6]. Specific enzymes called topoisomerases I (TopI) produce SSBs to regulate the DNA topology. To accomplish their function, these enzymes form DNA-enzyme covalent intermediates, which are quickly broken at the end of the reaction. Modifications in DNA and the presence of specific drugs such as camptothecin (CPT) can cause the formation of stabilized covalent complexes of enzyme–DNA, posing a risk to genome integrity [7,8]. Tyrosyl-DNA phosphodiesterase 1 (TDP1) acts to disrupt these covalent complexes, releasing TopI. TDP1 was first identified in yeast [9,10] and mammals [11]. The human TDP1 (hTDP1) is a nuclear protein composed of two domains: an N-terminal regulatory domain necessary for recruitment at damaged sites, and a C-terminal catalytic domain [7]. The hTDP1 protein is characterized by two HKD (histidine, lysine, aspartate) motifs containing the conserved amino acid residues of the active site [7,12]. During the TDP1 reaction, a histidine residue (His-263) is responsible for the nucleophilic attack against the phosphorus atom linking the catalytic tyrosine of TopI and the 3′-oxygen of the nucleotide. The TDP1 enzyme binds to DNA, replacing the tyrosine residue. As a result, a TDP1–DNA covalent complex is formed. Subsequently, another histidine (His-493) activates a water molecule, with the consequent hydrolysis of the His-263–DNA bond and the release of the enzyme [11,13].
In plants, the TDP1 function was characterized in Arabidopsis thaliana by Lee et al. [14]. Loss-of-function AtTDP1 mutation resulted in a dwarf phenotype with defects in vegetative and flowering development and reduced fertility. The A. thaliana tdp1 mutant was hypersensitive to CPT [14], as previously observed in Saccharomyces cerevisiae [15]. Subsequent studies of the AtTDP1 enzyme showed that the HKD motifs are critical for its activity, and vanadate (inhibitor of phosphoryl transfer reactions) treatments repress its function [16], suggesting a conserved function in the human and yeast homologues. However, a peculiarity of the plant system is that a small TDP1 gene subfamily (composed of two members, TDP1α and TDP1β) has been identified [17] and a recent phylogenetic study reported that TDP1β is specific to the plant kingdom [18]. In terms of the amino acid sequence, the two TDP1 proteins contain the conserved fork-head associated domain (FHA) and HKD catalytic sites, while TDP1β contains an additional HIRAN (HIP116, Rad5p, N-terminal) domain, localized between the two HKD catalytic motifs [17,19]. The FHA-HIRAN-HKD sequence organization is present in other eukaryotic nuclear proteins with known functions in mediating phosphorylation-dependent protein–protein interactions [20,21]. The structure of the HIRAN domain was reported in several proteins [22,23], and its function has been related to the recruitment of DNA repair and chromatin remodeling enzymes to specific DNA sites, mainly at stalled replication forks and post-replication damage, possibly acting as a sensor of DNA damage checkpoints [21].
The human TDP1 plays a role in different DNA repair pathways [24]. Likewise, in plants, TDP1α (the canonical homologue of hTDP1) is mainly related to DNA–protein crosslink (DPC) repair [25] and base excision repair (BER) [26] pathways. Using specific single and double mutants of A. thaliana, Enderle et al. [25] demonstrated that TDP1(α) acts as a backup for the DNA endonuclease MUS81 and the protease WSS1A in DPC repair. Other studies using Medicago truncatula TDP1α-depleted plants revealed different levels of transcriptional modulation (up- and down-regulation, alternative splicing, activation of alternative promoter) of genes involved in DNA damage sensing, DNA repair (mainly BER), and chromatin remodeling, indicating an important role in maintaining genome integrity [26,27].
As for the TDP1β gene, this is far less characterized compared to TDP1α. In M. truncatula (barrel medic), it was shown to be ubiquitously expressed in all plant tissues and developmental stages [17,28]. Moreover, the TDP1β gene was differentially expressed upon exposure to NSC120686 (inhibitor of hTdp1 acting as substrate mimetic [29]), being downregulated in calli and upregulated in young seedlings [30,31], possibly suggesting its implication in different developmental aspects. In both A. thaliana and barrel medic plants subjected to multiple abiotic stress conditions (cold, heat, salinity, osmotic stress, and UV-B), TDP1β was highly upregulated at the earliest timepoints (0.5–1 h) following exposure to stress [19]. More recently, a comparative data mining study using different species (Selaginella moellendori, Zea mays, Oryza sativa, M. truncatula, Glycine max, Solanum lycopersicum, S. tuberosum) presented evidence of tissue- and stress-specific responses [18].
Despite the recent literature, the precise roles of the TDP1 genes in plant development and stress responses are still unclear, especially concerning the non-canonical TDP1β gene. To address this gap in knowledge, the current study was designed for an in-depth inquiry into the function of the TDP1 genes by taking advantage of the abundance of transcriptomics data and bioinformatic platforms available for the model plant Arabidopsis thaliana. Hence, an integrative data mining approach was carried out to collect information regarding the A. thaliana TDP1α and TDP1β gene expression using platforms where RNA-seq and microarray data are deposited. Additionally, to further validate these data, an experimental system consisting of gamma-irradiated Arabidopsis thaliana plantlets was implemented and the expression of the two TDP1 genes comparatively monitored.

2. Materials and Methods

2.1. Bioinformatics Analyses

Phytozome version 13 (https://phytozome-next.jgi.doe.gov/) was used to retrieve the Arabidopsis thaliana TDP1α (Accession No. AT5G15170) and TDP1β (Accession No. AT5G07400) nucleotide and aminoacidic sequences. Gene organization and chromosome localization were obtained from the Phytozome gene browser (https://phytozome-next.jgi.doe.gov/jbrowse/) and ePlant chromosome viewer (http://bar.utoronto.ca/eplant/), respectively. Gene co-expression and co-localization data were retrieved from GeneMania (https://genemania.org/).
The alignment between the two protein sequences was carried out using the ClustalW tool available at https://www.genome.jp/tools-bin/clustalw. Protein–protein putative interaction analysis was conducted using the STRING (https://string-db.org/) online tool. Data from computationally predicted and experimentally documented subcellular localization of the proteins were obtained from ePlant [32,33], as recommended by Winter et al. [34], to generate a confidence score for each distinct subcellular compartment or region. The higher the confidence score for a given subcellular compartment, the more intense the red color in the Cell eFP Browser output.

2.2. Gene Expression Data Mining

Data mining was performed using the Bio-Analytic Resource for Plant Biology (BAR) Toronto eFP browser (http://bar.utoronto.ca/efp/cgi-bin/efpWeb.cgi), a visual analytic tool for exploring multiple levels of Arabidopsis thaliana data through a user-friendly interface. ePlant (http://bar.utoronto.ca/eplant) is connected to several publicly available web services to download genome, proteome, interactome, transcriptome, and 3D molecular structure data for one or more genes or gene products of interest [35]. Each piece of RNA-Seq or microarray data deposited in this database contains specific references to the study in which data were generated, the types of plant materials, treatments, and data analyses that were used. Mainly, the deposited affymetrix ATH1 array data come from developmental maps [36], seeds [37], developmental mutants [38,39,40,41,42,43], natural variants [44], hormones and chemical treatments [45], the stress atlas [46], and additional stress treatments related to drought [47], selenium [48], gamma-rays [49], and light series [50]. The genes taken into consideration in this data mining approach are TDP1α (Accession No. AT5G15170) and TDP1β (Accession No. AT5G07400). The selected mode for all the species was “absolute”, indicating that the expression levels for each type of sample/condition were directly associated with the most intense signal recorded for each gene. The mean values were retrieved and used to calculate the fold change (FC) relative to the control for each condition under study.
The obtained data are presented as heatmap models generated using the Shinyheatmap (http://shinyheatmap.com/) application, a software program that generates highly customizable static and interactive biological heatmaps in a web browser [51]. Within this application, the expression values are represented as Z-scores, a numerical measure that describes the relationship of a value with the mean of a group of values. The following parameters were set for all the generated heatmaps: low value—blue color, mid value—white color, high value—red color, apply clustering—none, distance metric—Euclidean, linkage algorithm—complete, apply scaling—row (per gene, not conditions), make trace—none. The Euclidean measure (differences in gene expression values) is used in many conventional algorithms.

2.3. Plant Material and Growth Conditions

Seeds of A. thaliana wild-type Col0 and sog1 mutant lines were provided by Dr. Cécile Raynaud (Institute of Plant Sciences Paris-Saclay, IPS2, Orsay, France). For each line, seeds were sterilized with 70% EtOH and 50% bleach as follows: seeds were suspended in a tube containing 50% bleach and, after bleach removal, seeds were washed with 70% EtOH twice. Subsequently, seeds were washed with sterile H2O and sown in Petri dishes containing half MS (Murashige & Skoog) media (Duchefa Biochemie) with 0.6% plant agar (Duchefa Biochemie), stratified at 4 °C for 3 days in the dark, and transferred into a growth chamber at 25 °C in light conditions with a photon flux density of 150 μmol m−2 s−1, photoperiod of 16/8 h, and 70–80% relative humidity. Ten-day-old seedlings were irradiated with gamma(γ)-rays (total dose 100 Gy), by using a panoramic dry 60Co source at room temperature. The Petri dishes were subsequently placed back into the growth chamber and samples were collected at selected intervals (30 min, 3 h, 6 h, 12 h) after the γ-ray treatment for the following molecular analysis.

2.4. Single-Cell Gel Electrophoresis (SCGE)

The SCGE, also known as the comet assay, was performed under alkaline conditions to quantitatively measure the levels of DNA damage in 10-day-old A. thaliana seedlings, as described by Ventura et al. [52]. For slide preparation, aliquots (600 μL) of 1% low-melting-point (LMP) agarose (Sigma-Aldrich, Milan, Italy) in phosphate-buffered saline (PBS) buffer (140 mM NaCl, 2.7 mM KCl, 10 mM Na2HPO4, 1.8 mM KH2PO4, pH 7.4) were equally distributed on 2/3 of each slide, carefully levelled horizontally on the bench. Agarose-precoated slides were then dried overnight at room temperature. To isolate the nuclei, approximately 80 seedlings were transferred in an Eppendorf tube containing 500 μL of TE buffer (0.4 M Tris HCl pH 7.5, 1 mM EDTA pH 8.0) and chilled in liquid nitrogen. The material was placed on an inclined Petri dish on ice and carefully sliced with a sharp razor blade. After the removal of cellular residues by filtration, 300 μL of the nuclear suspension was mixed with 200 μL 1% LMP agarose previously melted and kept at 38 °C in a water bath. Aliquots of 100 μL were then distributed on the precoated slides, covered immediately with a cover slip, and incubated on ice for 5 min under dark conditions. Nuclei were denatured in an alkaline buffer (1 mM Na2EDTA, 300 mM NaOH, pH 13.0) for 30 min at 4 °C and then electrophoresed in the same buffer for 20 min at 0.72 V cm−1 in a dark cold chamber. Slides were then washed in 0.4 M Tris–HCl pH 7.5 two times for 5 min, rinsed in 70% ethanol (v/v) three times for 10 min at 4 °C, and dried overnight at room temperature. To evaluate the nuclei’s morphologies, the prepared slides were stained with 4′,6-diamidino-2-phenylindole (DAPI, 20 μL; Sigma-Aldrich, Milan, Italy) and observed with an Olympus BX51 fluorescence microscope with a 100W mercury lamp (excitation filter of 340-380 nm and barrier filter of 400 nm). Nucleoids were classified into 5 classes according to the lengths of their tails, which reflected the extent of the damage, and results were expressed in arbitrary units (a.u.), calculated using the following formula: a.u. = Σ(Ncc) ∙ 100/Ntot, where, “Nc” indicates the number of nuclei identified for each class, “Ntot” the total nuclei identified, and “c” is the class identification number (0, 1, 2, 3, 4) [53]. For each treatment, three replicated samples were analyzed in two independent experiments.

2.5. Diffusion Assay

The DNA diffusion assay was performed as described by Macovei et al. [54] to assess cell viability based on nuclear morphology. The assay is based on the fact that low-molecular-weight DNA fragments generated during programmed cell death (PCD) and necrosis diffuse in the agarose, resulting in an average nuclear size three times higher compared to nuclei from viable cells. PCD nuclei are characterized by a DNA halo without a clear boundary, and this typical morphology results from the diffusion of nucleosomal-sized DNA fragments generated by endonucleolytic cleavage. By contrast, necrotic cell nuclei undergo random fragmentation that produces a clear DNA halo, with a well-defined outer boundary and nonhomogeneous content [54].
The nuclei’s isolation was performed as previously described for the comet assay. After the removal of the cover slip, the slides were immersed in saline lysis buffer (2.5 M NaCl, 100 mM EDTA, 10 mM Tris–HCl pH 7.5) for 20 min in a dark cold (4 °C) chamber. Subsequently, slides were incubated in neutral Tris–Borate–EDTA (TBE, 89 mM Tris Base, 89 mM Boric Acid, 2 mM EDTA, pH 8.3) solution for 5 min three consecutive times in the same cold chamber. The slides were rinsed in 70% ethanol for 5 min and subsequently in absolute (99.8%) ethanol for another 5 min, and finally air-dried overnight. To evaluate the nuclei’s morphology, the prepared slides were stained with 20 μL DAPI and observed with the same Olympus BX51 fluorescence microscope. One hundred nuclei/replicate stained with the fluorescent dye were analyzed for their morphology modifications and included in classes (0, 1, 2) resulting from the passive diffusion of DNA molecules. The level of cell death was scored in a.u. following the same formula as indicated for the SCGE, whereas the percentage (%) of nuclear morphology was also used to represent the different types of cell death reflected.

2.6. Quantitative Real-Time Polymerase Chain Reaction (qRT-PCR)

RNA isolation was carried out using the TRIzolTM Reagent (Thermo Fisher Scientific, Monza, Italy) according to the supplier’s indications. A DNase (Thermo Fisher Scientific) treatment was also performed, as indicated by the manufacturer. RNA was quantified using NanoDrop (Biowave DNA, WPA, Thermo Fisher Scientific). Subsequently, cDNAs were obtained using the RevertAid First Strand cDNA Synthesis Kit (Thermo Fisher Scientific), according to the manufacturer’s suggestions. The qRT-PCR was performed with the Maxima SYBR Green qPCR Master Mix (2×) (Thermo Fisher Scientific), according to the supplier’s indications, using a Rotor-Gene 6000 PCR apparatus (Corbett Robotics Pty Ltd., Brisbane, Australia). Amplification conditions were as follows: denaturation at 95 °C for 10 min, and 45 cycles of 95 °C for 15 s and 60 °C for 30 s and 72 °C for 30 s. Oligonucleotide primers were designed using the Real-Time PCR Primer Design program Primer3Plus (https://primer3plus.com) from GenScript and further validated through the online software Oligo Analyzer (https://eu.idtdna.com/calc/analyzer). The following genes were tested: TDP1α (Accession No. AT5G15170; FW: 5′-CGGTGACGGAGAGAGAAAGA-3′; RV: 5′-GGACAAAAACGACGAATGGC-3′) and TDP1β (Accession No. AT5G07400; FW: 5′-TCACCTTGTTGCTTCAGTGC-3′; RV: 5′-CCAGTCGTTTCAGTTGTGCT-3′). Relative quantification was carried out using ubiquitin 4 (Accession No. AT5G20620; FW: 5′-TCATTTGGTGCTTCGTCT-3′; RV: 5’-GTCTCTGCTGATCTGGTG-3′) as a reference gene [55]. The raw, background-subtracted fluorescence data provided by the Rotor-Gene 6000 Series Software 1.7 (Corbett Robotics) were used to estimate the PCR efficiency (E) and threshold cycle number (Ct) for each transcript’s quantification, while the Pfaffl method [56] was applied to calculate the transcript’s relative quantification. All reactions were performed in triplicate.

2.7. Statistical Analyses

For all data, statistically significant differences were determined using Student’s t-test. Means were considered statistically different when p ≤ 0.05 and are indicated with asterisks.

3. Results and Discussion

3.1. Arabidopsis TDP1α and TDP1β Have Different Sequence Organizations and Predicted Interactions

A preliminary in silico analysis was carried out comparatively for the TDP1α and TDP1β genes and protein sequences. The alignment between the two protein sequences indicates that only 123 aa are conserved, mainly located within the FHA domain and the catalytic HKD sites, translated into approximatively 11% similarity between TDP1α (606 aa) and TDP1β (1085 aa) (Figure S1). Both genes are localized on chromosome 5 (Figure S2a,b), and while TDP1α’s genomic sequence is of 3409 nucleotides organized in 14 exons, the TDP1β sequence has 4817 nucleotides divided into 12 exons (Figure S2a). A gene co-expression prediction using the GeneMania application indicates that TDP1α is mostly co-expressed with genes involved in abiotic (AT1G61240, AT1G68820), biotic (AT1G48430, AT5G08430, AT1G60860), and genotoxic (ZEU1, MTP1, XPD) stress responses, as well as with genes involved in light (AT1G06630, PHYC, XPD) and brassinosteroid (MNS4) signaling (Figure S3a). Nonetheless, the putative protein–protein interaction analysis shows that the majority of interacting proteins are involved in different DNA repair pathways, such as BER (AT3G14890, LIG6), NER (APTX), DPC repair (MUS81), DNA distortions (Top1α, Top1β), or DSB (KU70, KU80) repair (Figure S4a). Differently, the TDP1β gene co-expression network includes genes mostly involved in DNA binding (AT3G21430, AT4G15730, HDG9, HDG2, ATHB-14), DNA repair (FAN1, AZG2, MCM10), molecule transport (AT1G53660, AT4G75920, AT1G75920), and biotic stress (AT3G14580, AT5G15300, AT5G42840, AT3G13225, PCMP-E47, LECRK81, ULP1B) (Figure S3b). On the other hand, the putatively predicted protein–protein interactions include mainly proteins involved in DNA binding (AT5G51300, AT5G46630, HPPBF-1, OBP1) and DNA damage tolerance (RAD5) (Figure S4b). When considering the computationally predicted and experimentally documented subcellular localizations of the two proteins, the ePlant browser indicates that while TDP1α seems to be mostly spread in the cytoplasm (Figure S5a), TDP1β is largely found in the nucleus (Figure S5b). A previous study looking into promoter in silico analyses evidenced that the two gene promoters are rich in stress-related cis-elements, with light- and hormone-responsive elements being the most abundant [19]. Considering the elements specific to each promoter region, the Tdp1α gene promoter contains many elements involved in abscisic acid (ABA) responses, lignin biosynthesis, and light responses. The detected elements specific to Tdp1β include cis-elements involved in the gibberellin (GA) response, differentiation of mesophyll cells, and control of plant morphology [19].
The preliminary predictions gathered here can help to better discuss the following data relative to the comparative expression of the two genes in the multiple systems available for A. thaliana transcriptomics datasets mined in the current study.

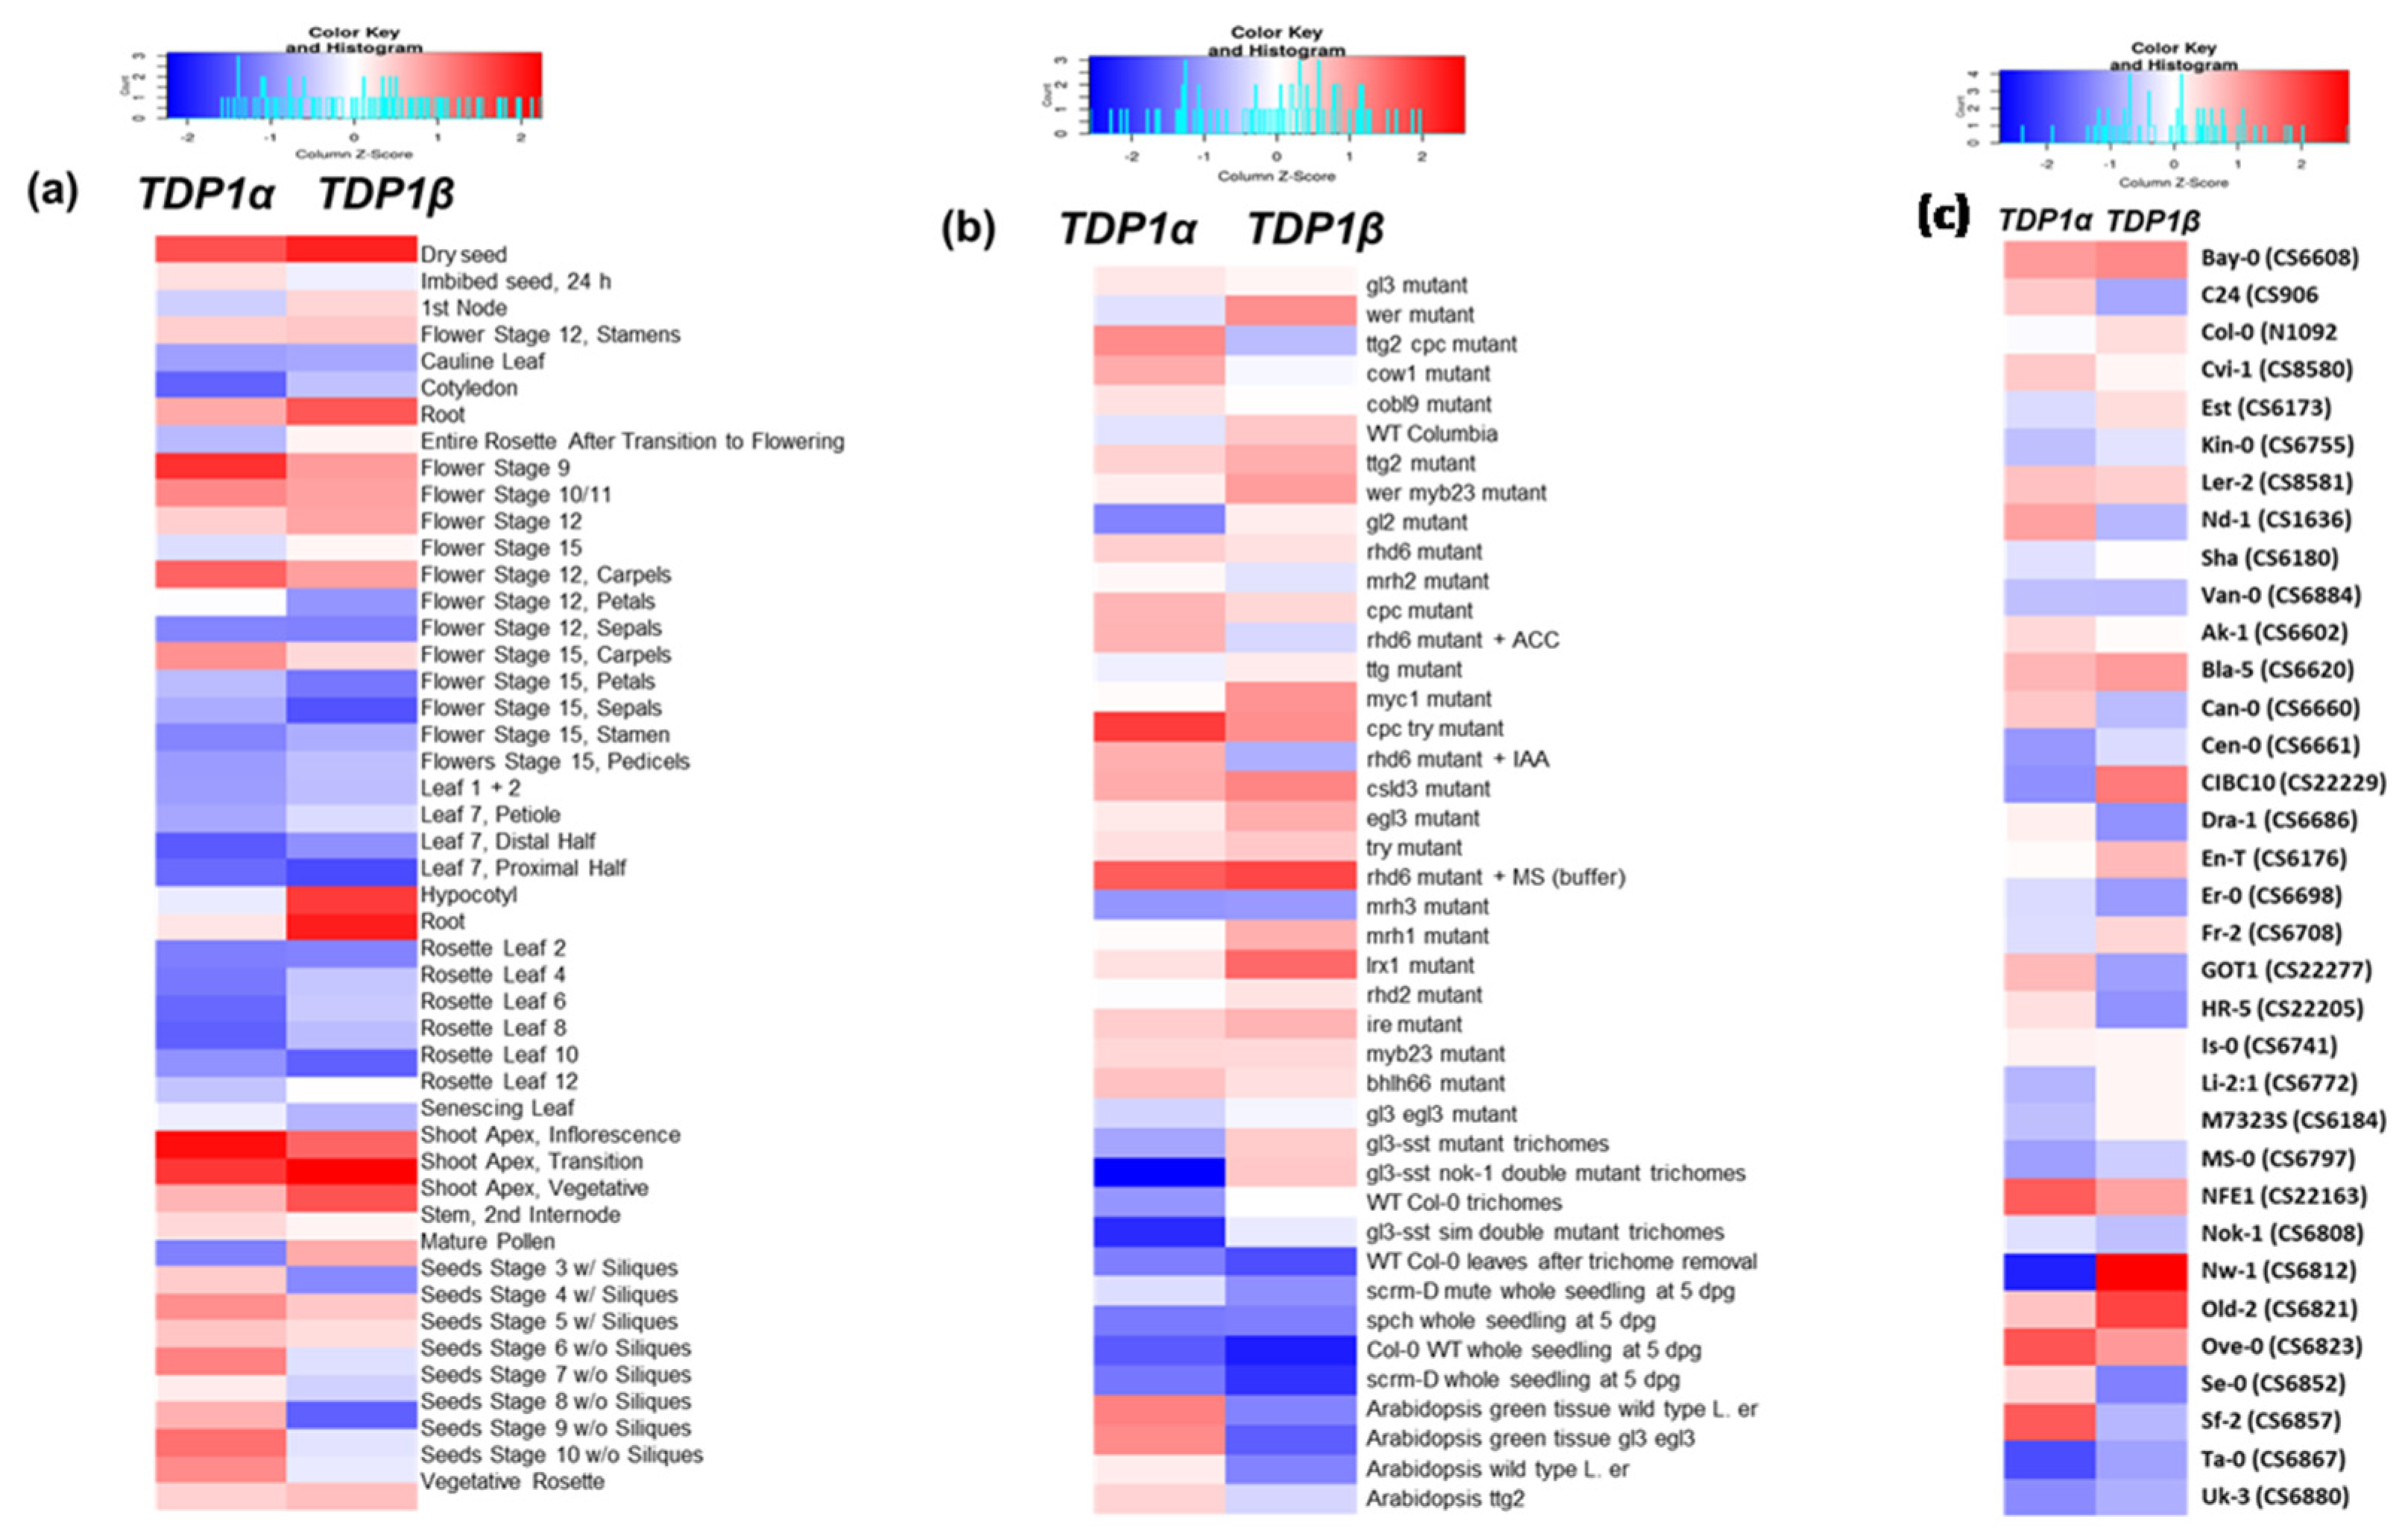
3.2. Arabidopsis TDP1α and TDP1β Comparative Expression during Plant Development and Ecotype Genetic Backgrounds

To evaluate the expression patterns of the two TDP1 genes, the first focus was placed on the different types of tissues, development stages, developmental defects (mutants), and ecotypes. The “developmental map” data present the TDP1α and TDP1β gene expression retrieved from the dataset published by Schmid et al. [36] (Figure 1a). Analyzing the pattern of expression shown in the heatmap, it is possible to observe that mostly the genes are similarly expressed, having generally low expression values in flowers and rosettes and high expression values in shoot apexes. This is in agreement with data from other species showing that both genes are highly expressed in shoot apical meristems [18], probably because these specific stem niches have to rapidly and promptly repair any type of DNA damage to avoid its propagation to generating tissues [57]. Focusing on the divergent expression between the two genes, it is possible to observe that the TDP1β gene is more expressed than TDP1α in roots and hypocotyls. This indicates that the function of this gene could be more required in these tissues.
To better investigate the involvement of the two genes in plant development, a collection of A. thaliana mutants, mainly considering mutations affecting specific phenotypes, was evaluated (Figure 1b). Considering the materials tested in this analysis, guard cell meristemoids [41], trichomes [38,39,40], and root epidermidis were sampled from Col-0 and mutants grown in vitro [42,43]. Looking at the heatmap, it is possible to observe that in the root epidermidis, TDP1β is more expressed than TDP1α in the wer mutant. The Weekly Epidemiological Record (WER) gene encodes a nuclear-localized MyB-related protein involved in root and hypocotyl epidermal cell fate determination and its loss of function produces a phenotype with extra root hairs [58]. These results may support the hypothesis of the possible involvement of TDP1β in root and hypocotyl development, in agreement with what was observed above (Figure 1a). Other mutants worth mentioning (with differential expression of the TDP1α and TDP1β genes) are gl2 and gl3 egl3 mutants, along with cpc and ttc, all being involved in the complex pathway of root hair formation. The data mining analysis showed that these mutants are characterized by a different pattern of expression of the two TDP1 genes. In fact, in the gl2 mutant, TDP1α is downregulated while the gl3 egl3 double mutant shows upregulation of the gene, a contrasting behavior compared to TDP1β (Figure 1b). This may indicate that the two genes may be differentially regulated in relation to the root hair formation pathway. Root hair cell fate is regulated by a transcription factor complex that promotes the expression of the homeodomain protein GLABRA 2 (GL2), which blocks root hair development; this is also influenced by hormonal regulation and mainly brassinosteroids [59]. This complex also includes WER, GL3, Enhancer of GL3 (EGL3), and TRANSPARENT TESTA GLABRA 1 (TTG). GL2 blocks the formation of root hairs by inhibiting Root Hair Defective 6 (RHD6). The suppression of GL2 triggers epidermal cells to enter into the root hair cell fate with the activation of RHD6. Here, both genes are highly expressed in the rhd6 mutant (Figure 1b). In these mutants, previous works reported that root hair formation is conditioned by nitric oxide (NO) and auxin in terms of cell wall remodeling [60]. Additionally, other reports indicate that the vanadate(V)-induced root hair formation is blocked in the rdh6 mutants, with a consequent delay in plant growth, suggesting that RHD6 may be involved in V-induced root hair initiation, probably through ethylene- and auxin-independent pathways [61]. This may be of relevance since, in the A. thaliana tdp mutant, vanadate was shown to inhibit the TDP1 enzymatic activity and retarded plant growth [16].
In trichoblasts, the presence of Caprice (CPC), along with GL3, EGL3, and TTG1, suppresses GL2, leading cells to enter the root hair cell fate [59]. The two TDP1 genes have contrasting behaviors in the ttg2 cpc mutant, with TDP1α being upregulated and TDP1β being downregulated. In addition, considering the TDP1β gene expression, it is possible to observe that it is highly expressed in the leucine-rich repeat extensin 1 (lrx1) mutant. Previous studies have shown that the inhibition of Target of Rapamycin (TOR) resulted in the suppression of phenotypic defects in the lrx1 mutant [62]. TOR is involved in the regulation of plant responses to a vast array of signals (e.g., nutrients, hormones, light, stresses, or pathogens) [63]. Due to its involvement in regulating cell division, TOR has been also shown to promote the activity of E2Fa/b transcription factors in activating cell cycle genes, especially in shoot and root apexes [64]. Based on these results, we could speculate about a possible relation between TDP1β and TOR concerning hair root formation, but these results will need to be further investigated.
Over 750 natural accessions, or ecotypes, of A. thaliana have been collected and deposited in specific databases, such as TAIR. The ecotypes vary in traits such as leaf shape, flowering time, disease resistance, seed dormancy, etc., and are generally used by the research community to uncover the genetic interactions that underlie plant responses to environmental conditions or the evolution of different morphological traits. Hence, the gene expression patterns of TDP1α and TDP1β were also examined in a collection of ecotypes to evaluate whether their profiles may change in these different genetic backgrounds (Figure 1c). The data analyzed were retrieved from aerial parts of 4-day-old seedlings grown in a greenhouse at 23 °C under continuous light [44]. The collected data indicate high variability in the expression profiles of the two genes among the different ecotypes. The upregulation of TDP1α is observed in the ecotypes NFE1 (CS22163, from UK), Ove-0 (CS6823, from Ovelgoenne, DE), and Sf-2 (CS6857, from San Feliu, ES). NFE1 is characterized by large rosettes with numerous leaves and vernalization at the rosette stage to induce flowering, while Ove-0 has an early flowering time, presenting epinastic leaves (downward bending) as a result of disturbances in their growth, and Sf-2 exhibits a late flowering behavior, but it can also be induced to flower early by low-temperature treatment [65]. An evident contrasting behavior among the two TDP1 genes is seen in the Nw-1 (CS6812, from Neuweilnau, DE) ecotype, where TDP1β is upregulated and TDP1α is downregulated. This ecotype is phenotypically characterized by leaf margins slightly serrated and it requires at least one week of cold treatment for optimal germination; hence, it requires longer treatments to break seed dormancy.
Summarizing these results, the TDP1β gene could have a role to play in root development; these data are supported also by the observations related to defective mutant collections, indicating its possible involvement in pathways related to root hair formation. As for the data coming from different Arabidopsis ecotypes, at this point, it is difficult to draw any meaningful conclusion, but future studies could be designed to possibly correlate the presence of specific SNPs with the gene expression data.

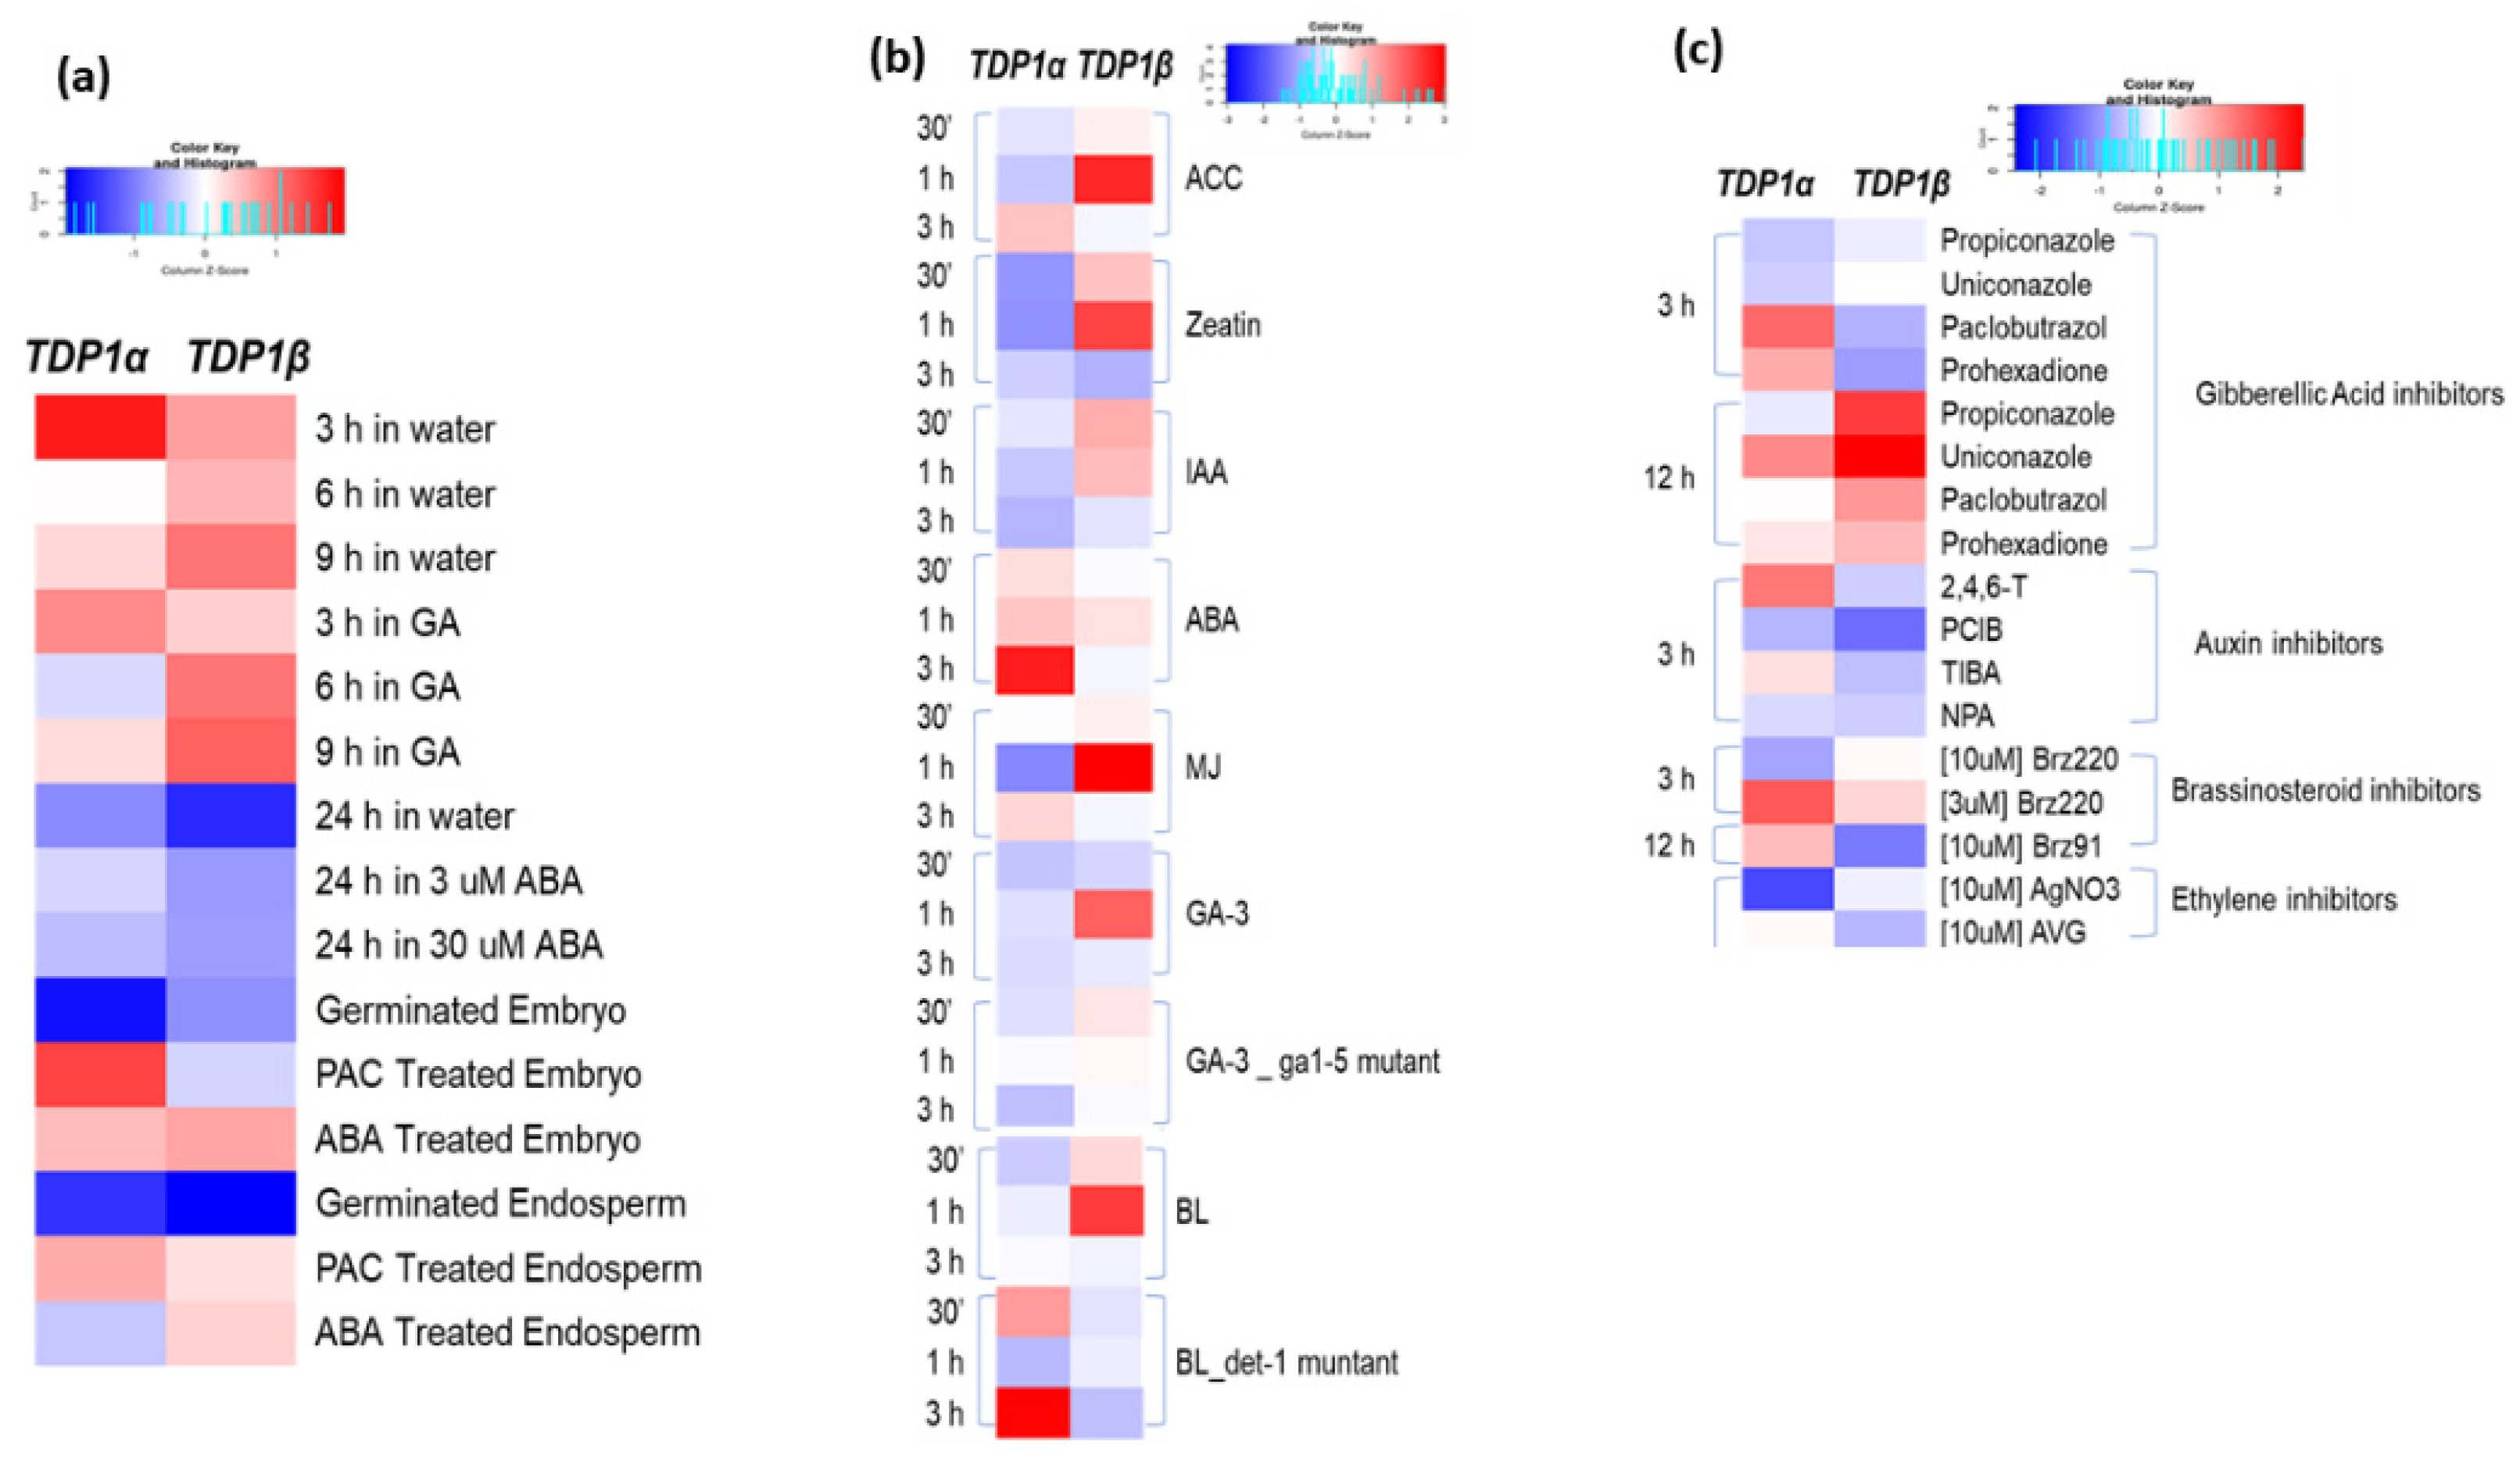
3.3. Arabidopsis TDP1α and TDP1β Comparative Expression in Response to Hormone Treatments

Plants rely on hormones to regulate every aspect of their biology as extensive crosstalk between hormone signaling pathways governs both plant development and stress responses. The expression patterns of TDP1α and TDP1β were evaluated in response to different hormone treatments (Figure 2) by mining data from studies where these treatments were implemented in A. thaliana plants. The plant material investigated came from seeds and 7-day-old plantlets, and the mined data are part of the AtGenExpress project [45]. The antagonistic roles of ABA and GA in the regulation of seed dormancy and germination are well established [66,67]. Additionally, several studies in other plants have already evidenced that the TDP1 genes change their expression during seed germination, both in the absence/presence of different stress-inducing agents and seed priming treatments [17,28,68,69,70]. Hence, the seed germination process was targeted to evaluate the expression profiles of the Arabidopsis TDP1α and TDP1β genes, particularly referring to seed imbibition and the involvement of hormones in this process (Figure 2a). Data collected from seeds imbibed in water or with the addition of hormone treatments (5 µM GA and 30 µM ABA) [37] were investigated. The first observation is that TDP1α is more expressed than TDP1β at 3 h of imbibition, while, at subsequent timepoints (6 h, 9 h), the TDP1β gene is more expressed; this is in agreement with experimental data reported in other plants [17,28]. When considering seed imbibition in the presence of different hormone treatments, both TDP1 genes seem to be upregulated by GA treatments and downregulated by ABA. Since GA is known to promote germination, the upregulation of the genes during this treatment suggests that both genes are required during seed germination, data in agreement with previously mentioned studies [17,28,68,69,70].
When looking at the expression of the two genes in Arabidopsis plantlets treated with different hormones (Figure 2b), the TDP1α gene is upregulated after 3 h of treatment with ABA, whereas TDP1β is upregulated by 1-aminocyclopropane 1-carboxylic acid (ACC), zeatin, methyl jasmonate (MJ), brassinosteroids (BL), and GA. Concerning at least the ABA and GA responses, this is in agreement with the presence of ABA-related cis-elements in TDP1α and GA elements in the TDP1β promoter [19]. When the BL treatment was carried out on det-1 mutants, the situation was inverted and the TDP1α gene was more expressed than TDP1β. De-etiolated 1 (DET1) is a key negative regulator of photomorphogenesis that positively regulates the light-induced greening of the etiolated seedlings by repressing ABA responses. DET1 interacts with damaged DNA binding protein 1 (DDB1) to form the COP10-DET1-DDB1 (CDD) complex, which facilitates the degradation of positive regulators of photomorphogenesis, repressing it under dark conditions [71]. The CDD complex negatively regulates ABA responses, leading to the degradation of ABA receptors. It has been hypothesized that ABA coordinates and regulates the greening of seedlings through a process in which three main proteins are involved: DET1, histone deacetylase 6 (HDA6), and far-red elongated hypocotyl 3 (FHY3) [72].
Among GA inhibitors, propiconazole (10 µM), paclobutrazol (10 µM), uniconazole (10 µM), and prohexadione (10 µM) treatments [45] resulted in the upregulation of the TDP1β gene at 12 h (Figure 2c). Auxin inhibitor treatments with 2,4,6-trihydroxybenzamide (10 µM), p-chlorophenoxyisobutyric acid (PCIB, 10 µM), and 2,3,5-triiodobenzoic acid (TIBA, 10 µM) resulted in the mild downregulation of TDP1β. BL inhibitor treatments with brassinazoles resulted in the upregulation of TDP1α at 3 h when Brz220 (3 µM) was used and the downregulation of TDP1β at 12 h when Brz91 (10 µM) was used.
Based on the gathered results, it could be hypothesized that the TDP1α gene may be mainly related to ABA responses, while the TDP1β gene is responsive to multiple hormone treatments, including GA and BLs. The responsiveness of TDP1β to BL treatments could also be connected to the putative roles of this gene in root hair formation, as seen in the previous section.

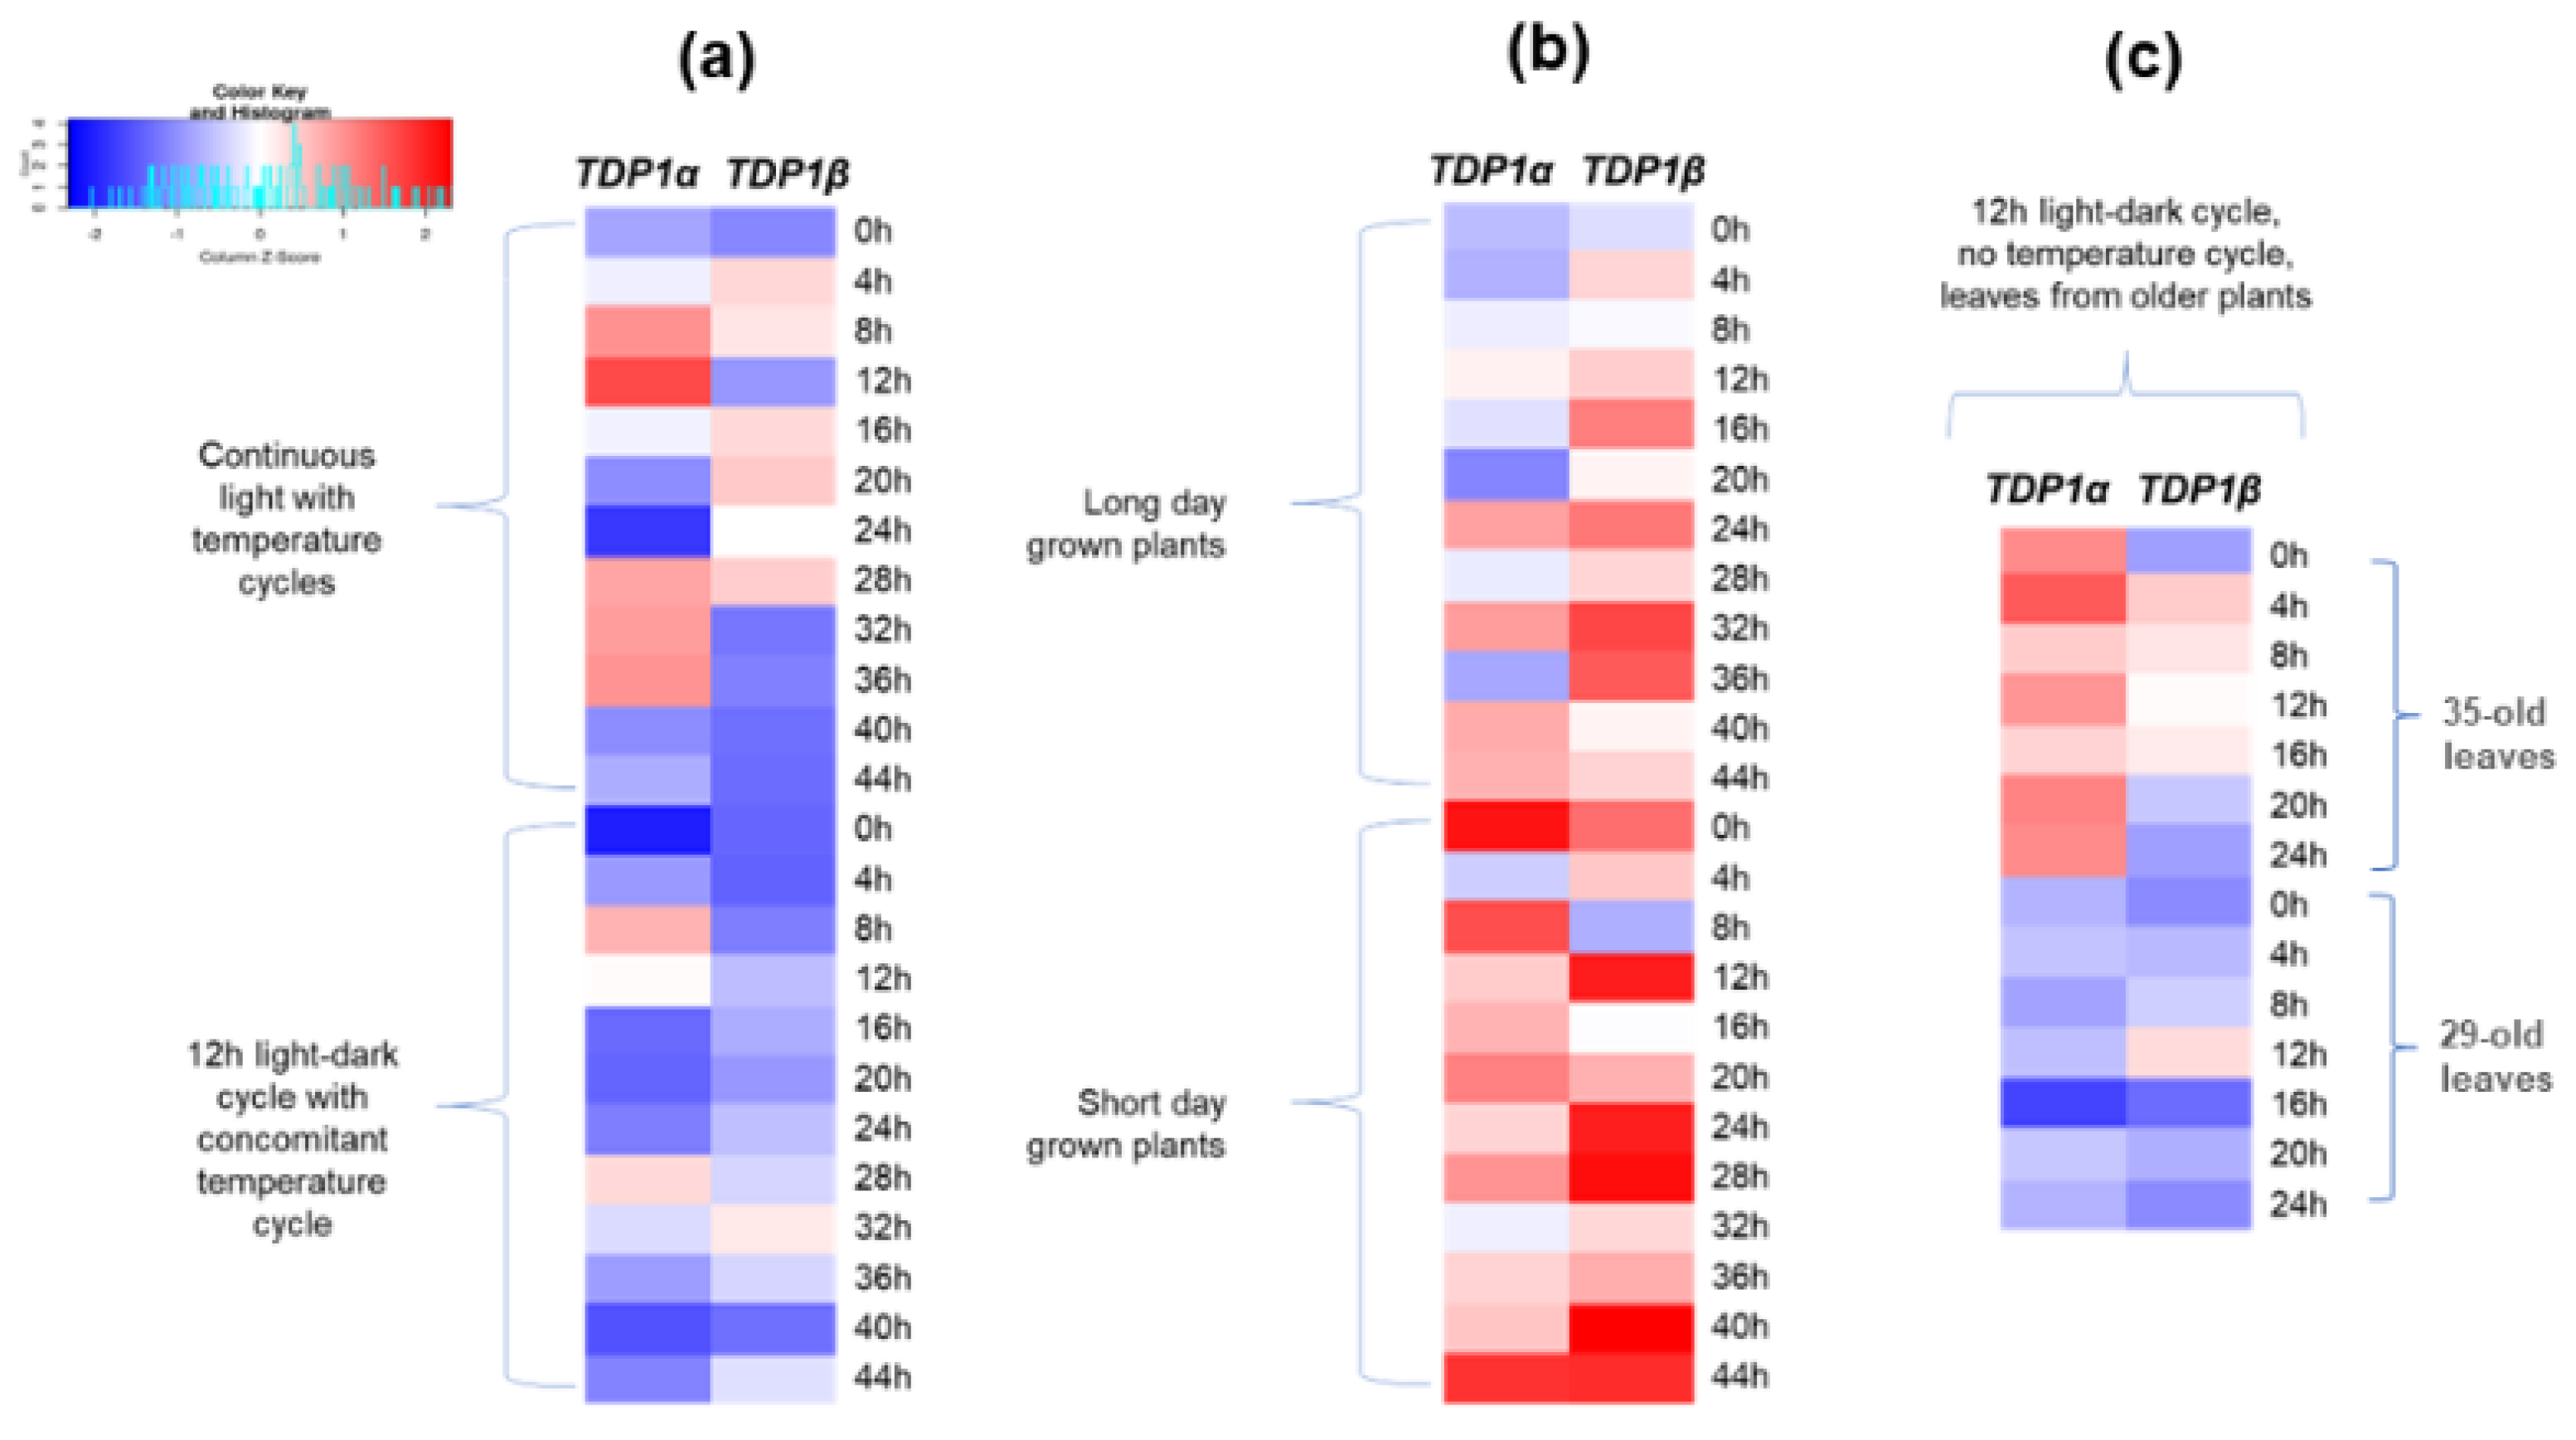
3.4. Arabidopsis TDP1α and TDP1β Comparative Expression under Different Light Series

The circadian clock regulates plant physiology and metabolism during the day (24 h). Natural responses to thermal and photo-cycles are essential for plant fitness and some studies suggest that 6% to 36% of the A. thaliana transcriptome is under the regulation of the circadian clock [50]. Plants are exposed to daily alternation between light and darkness, along with changes in irradiance, following the regulation of gene expression through red and blue light receptors. Moreover, the metabolic and physiological processes such as photosynthetic carbon fixation in leaves are regulated based on circadian rhythms. The fluctuation of the carbon balance is crucial to the growth of plants; even a few hours of carbon depletion leads to the inhibition of growth, which can be only slowly reversed [73]. To investigate whether the expression of the TDP1α and TDP1β genes is influenced by the circadian rhythm, the Arabidopsis atlas mined data were gathered and represented as a heatmap (Figure 3). Continuous light (100 µE) with temperature cycle treatment (22 °C/12 °C cycles for 12 h each) was monitored, along with a 12 h light–dark cycle with concomitant temperature cycle. Long-day and short-day treatments were performed with 16 h light at an intensity of 90 µE and 8 h at a light intensity of 180 µE, respectively, at 22 °C. Lastly, the 12 h light (180 µE)–dark cycle was carried out in plants of different growth stages (35-day- and 29-day-old) maintained in soil [50].
The hereby performed analysis indicates that TDP1α is upregulated by temperature during continuous light conditions but not during a light–dark cycle (Figure 3a). Seedlings grown on long-day and short-day cycles showed the generalized upregulation of both genes, with more intense expression during short-day conditions, maybe caused by the higher energy of the imposed light (Figure 3b). The two experiments with Col-0 leaves treated with a light–dark cycle of 12 h show that TDP1α is generally more expressed than TDP1β in older leaves (35 days) (Figure 3c). These results may suggest the higher responsiveness of the TDP1α gene to light cycles, in accordance with the presence of a high number of light-responsive cis-elements in its promoter region [19]. Moreover, recent studies point to a tight ABA–light crosstalk as ABA signaling components interact with multiple light modulators (e.g., photoreceptors, transcription factors, posttranslational modifiers) [74]. Therefore, this could also be the case for the TDP1α gene considering its response to both light and ABA treatments.

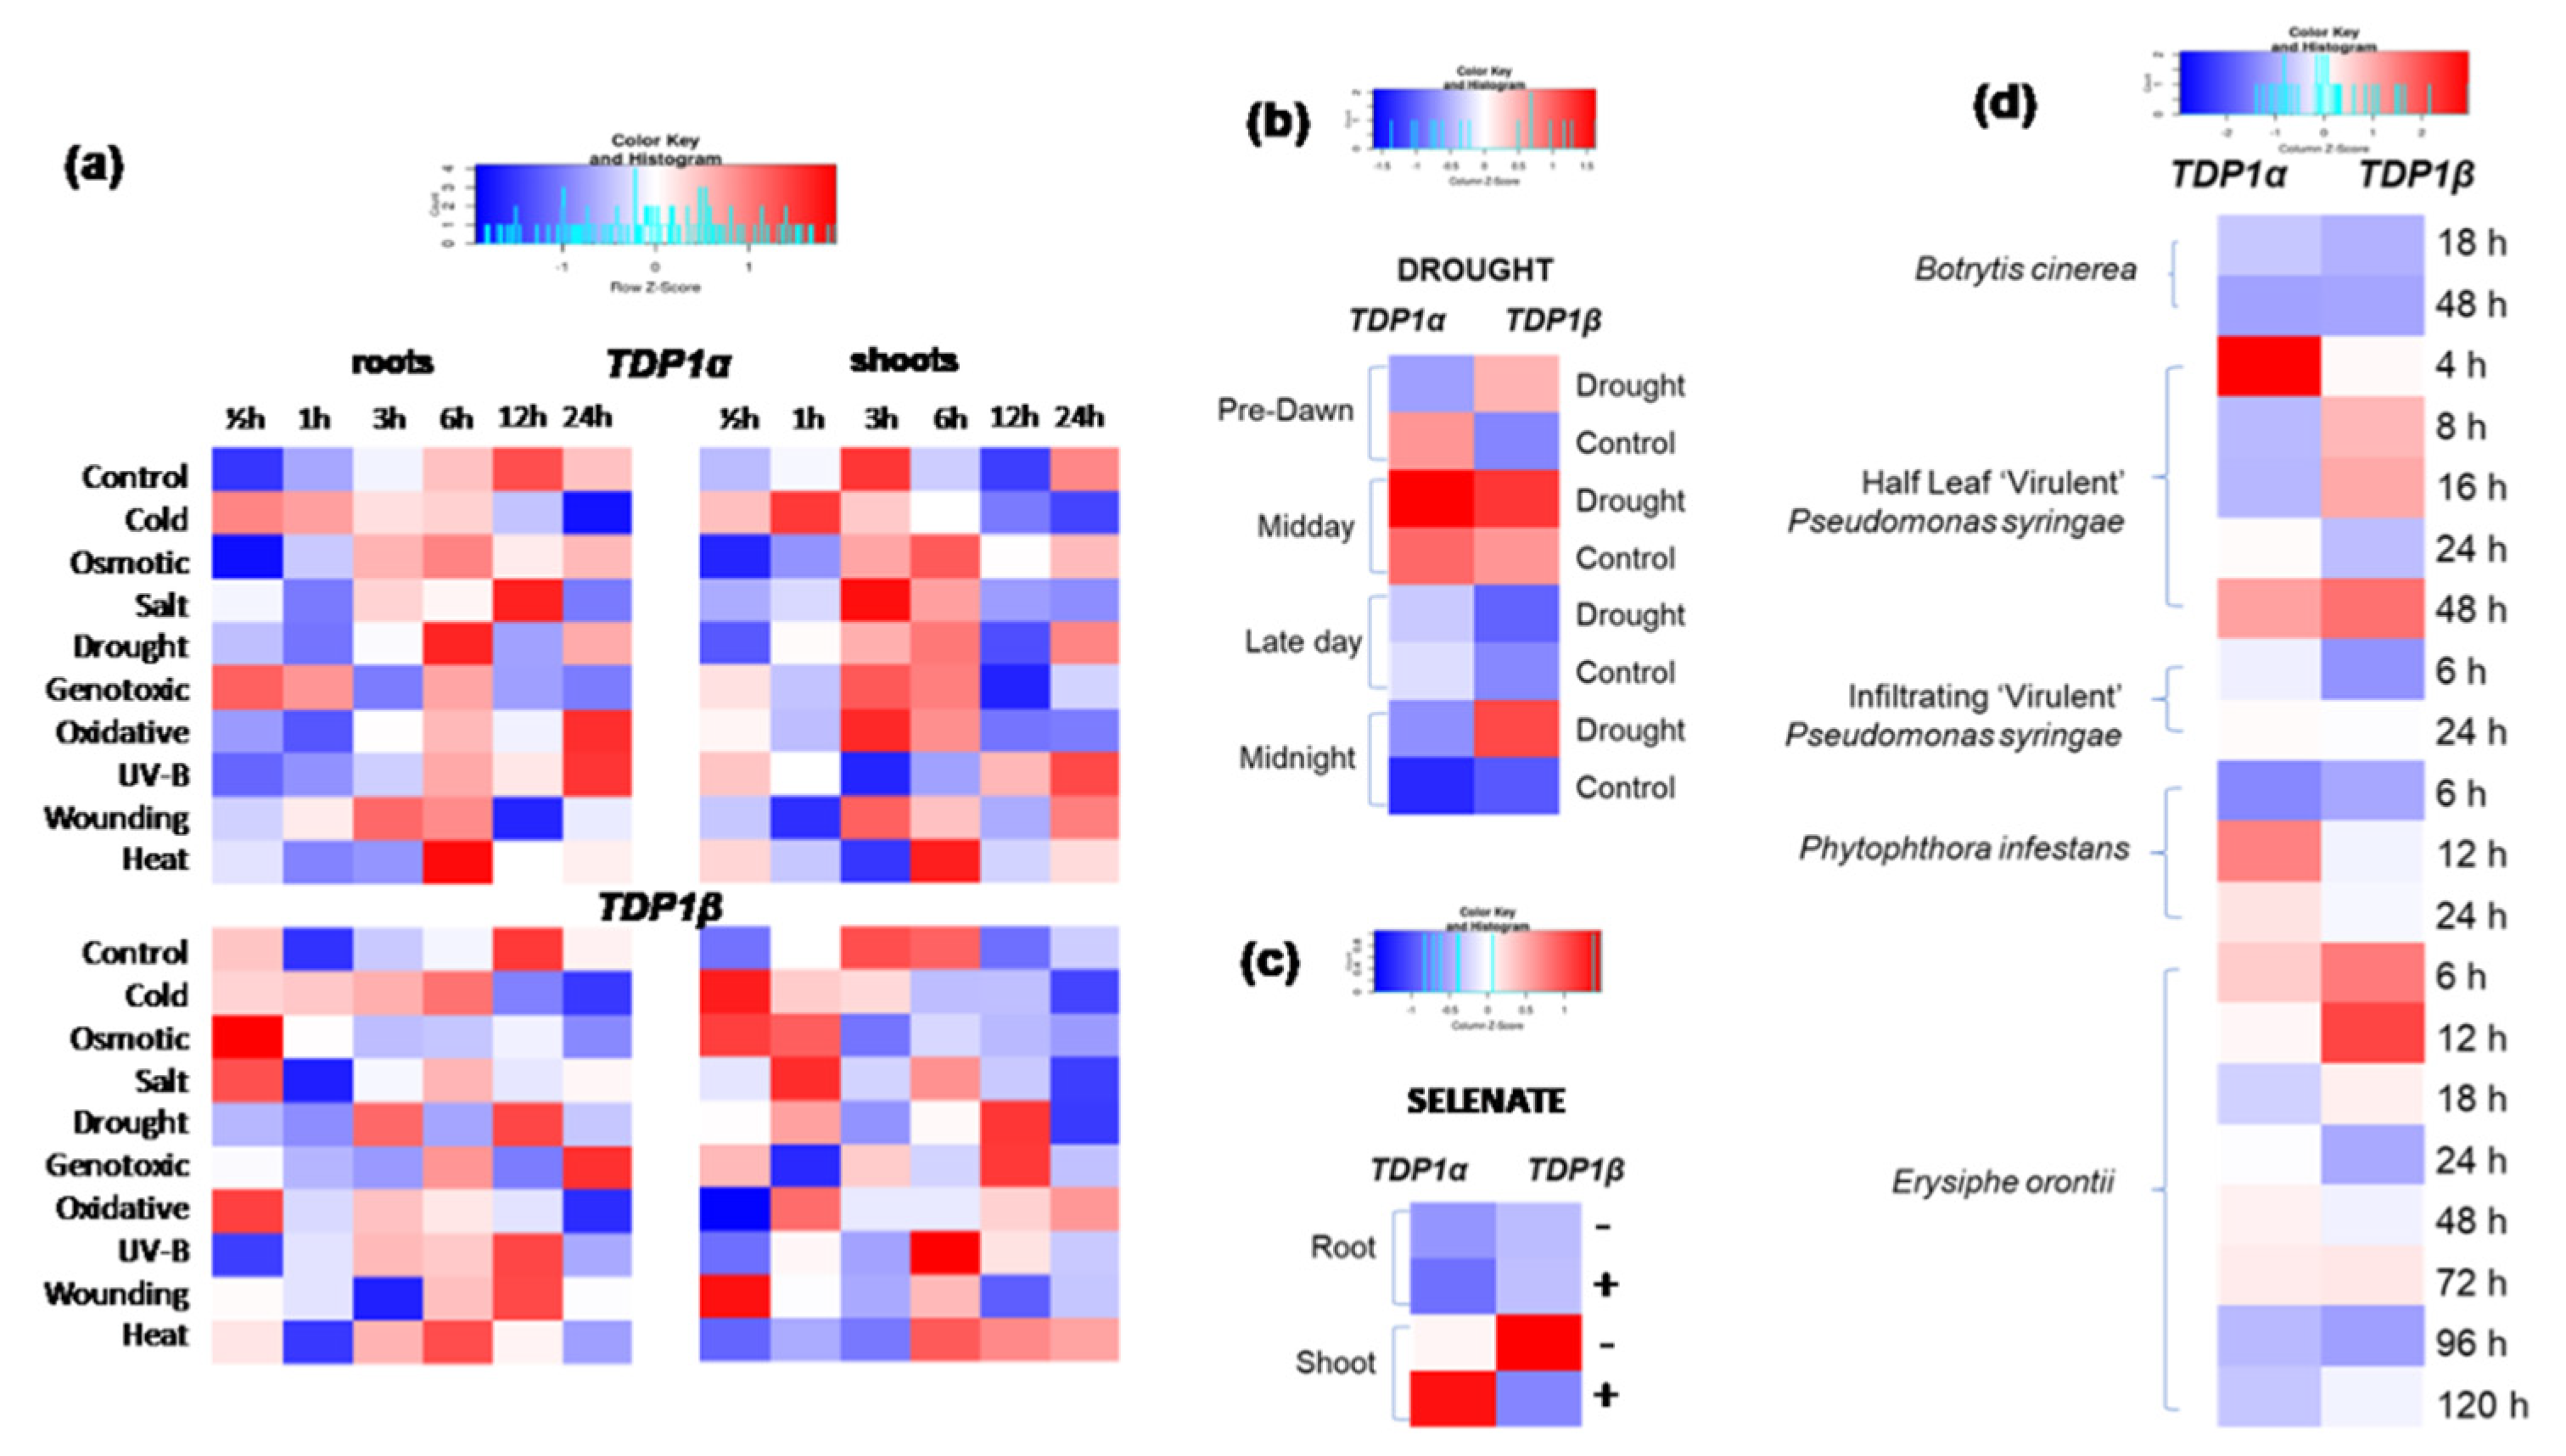
3.5. Arabidopsis TDP1α and TDP1β Comparative Expression during Abiotic and Biotic Stresses

The expression of the TDP1α and TDP1β genes was mined from different abiotic and biotic stress conditions (Figure 4). Data from abiotic stress were gathered from Kilian et al. [46], where A. thaliana ecotype Col-0 plants were exposed to the following abiotic stresses: heat (42 °C), cold (4 °C), drought (plants were removed from the growth boxes and exposed to a stream of air in a clean bench for 15 min), salt (NaCl, 250 mM), high osmolarity (PEG6000, 150 g/L), UV-B light (15 min exposure to 280–315 nm), wounding (punctuation of the leaves with a custom-made pin-tool consisting of 16 needles), oxidative (10 μM methyl viologen), and genotoxic (bleomycin 1.5 μg/mL) stress.
As shown in the heatmap (Figure 4a), the initial transcriptional stress reaction involves the upregulation of TDP1β, while TDP1α tends to be upregulated at later timepoints. It is also possible to observe that TDP1α is generally more responsive than TDP1β, especially in the aerial parts. Since drought is one of the major environmental factors influencing plant growth and development worldwide, the expression data of the two TDP1 genes were mined from the Arabidopsis atlas, where an additional experimental system was implemented for this type of stress (Figure 4b). The materials used in the study by Wilkins et al. [47] included rosette tissue from the leaves of 32-day-old Col-0 plants. The experimental system contained well-watered and water-stressed (25% water loss) plants sampled at different times during the natural circadian cycle. The data mining results support the previous results (Figure 4a, drought) as both genes were still differentially modulated by drought. Moreover, these data also show that TDP1β is mostly upregulated during pre-dawn, midday, and midnight, while TDP1α is mostly upregulated only at midday (Figure 4b), thus highlighting the more stringent circadian regulation of the latter. Selenium is an important micronutrient for plant growth since, at low concentrations, it can enhance the plant’s antioxidant defense but, at high concentrations, it becomes damaging, being associated with the overproduction of ROS, leading to growth suppression [75]. A. thaliana Wassilewskija ecotype 10-day-old plants were grown in the presence/absence of 40 µM selenate [48]. The gene expression data mining under these conditions indicates that both genes are downregulated in the roots, while the TDP1α gene is highly expressed in treated shoots and TDP1β is highly expressed in non-treated shoots (Figure 4c). Hence, while TDP1α induces by the presence of selenate, TDP1β is induced by the lack of this compound. The Arabidopsis transcriptome analyses related to selenium stress responses indicate that many genes involved in the ethylene and jasmonic acid signaling pathways were upregulated by these treatments, along with other transcripts generally associated with salt and osmotic stresses [48].
Biotic stress is a major issue, mostly due to pre- and postharvest losses [76]. Within the Arabidopsis atlas, biotic stress data gathered from different labs refer to studies using Botrytis cinerea, Pseudomonas syringae, Phytophthora infestans, and Erysiphe orontii infected plants. The B. cinerea infection was performed on 4-week-old A. thaliana (Col-0), whereas the E. orontii infection was carried out on leaves of 28-day-old plants. The P. syringae treatments were applied in two ways: the half-leaf experiment was carried out by injecting half of a plant leaf while the other was subsequently collected for analysis, while the infiltrating experiment data come from analyzing infiltrated leaves. The P. infestans data include plant material from leaves of 5-week-old plants. Data retrieved from all these platforms and represented as a heatmap (Figure 4d) show that the TDP1α gene is upregulated by P. syringae and P. infestans, while the TDP1β gene is upregulated by E. orontii at early timepoints after treatment, possibly suggesting that each gene may have a role to play during particular types of bacterial infections in a time-specific manner.
Taken together, these data pinpoint once more the involvement of both genes in response to both biotic and abiotic stresses, in accordance with other data [17,18,19,28,68,69], the predicted co-expression data (Figure S3), and the abundance of stress- and hormone-related cis-acting elements in their promoter regions [19].

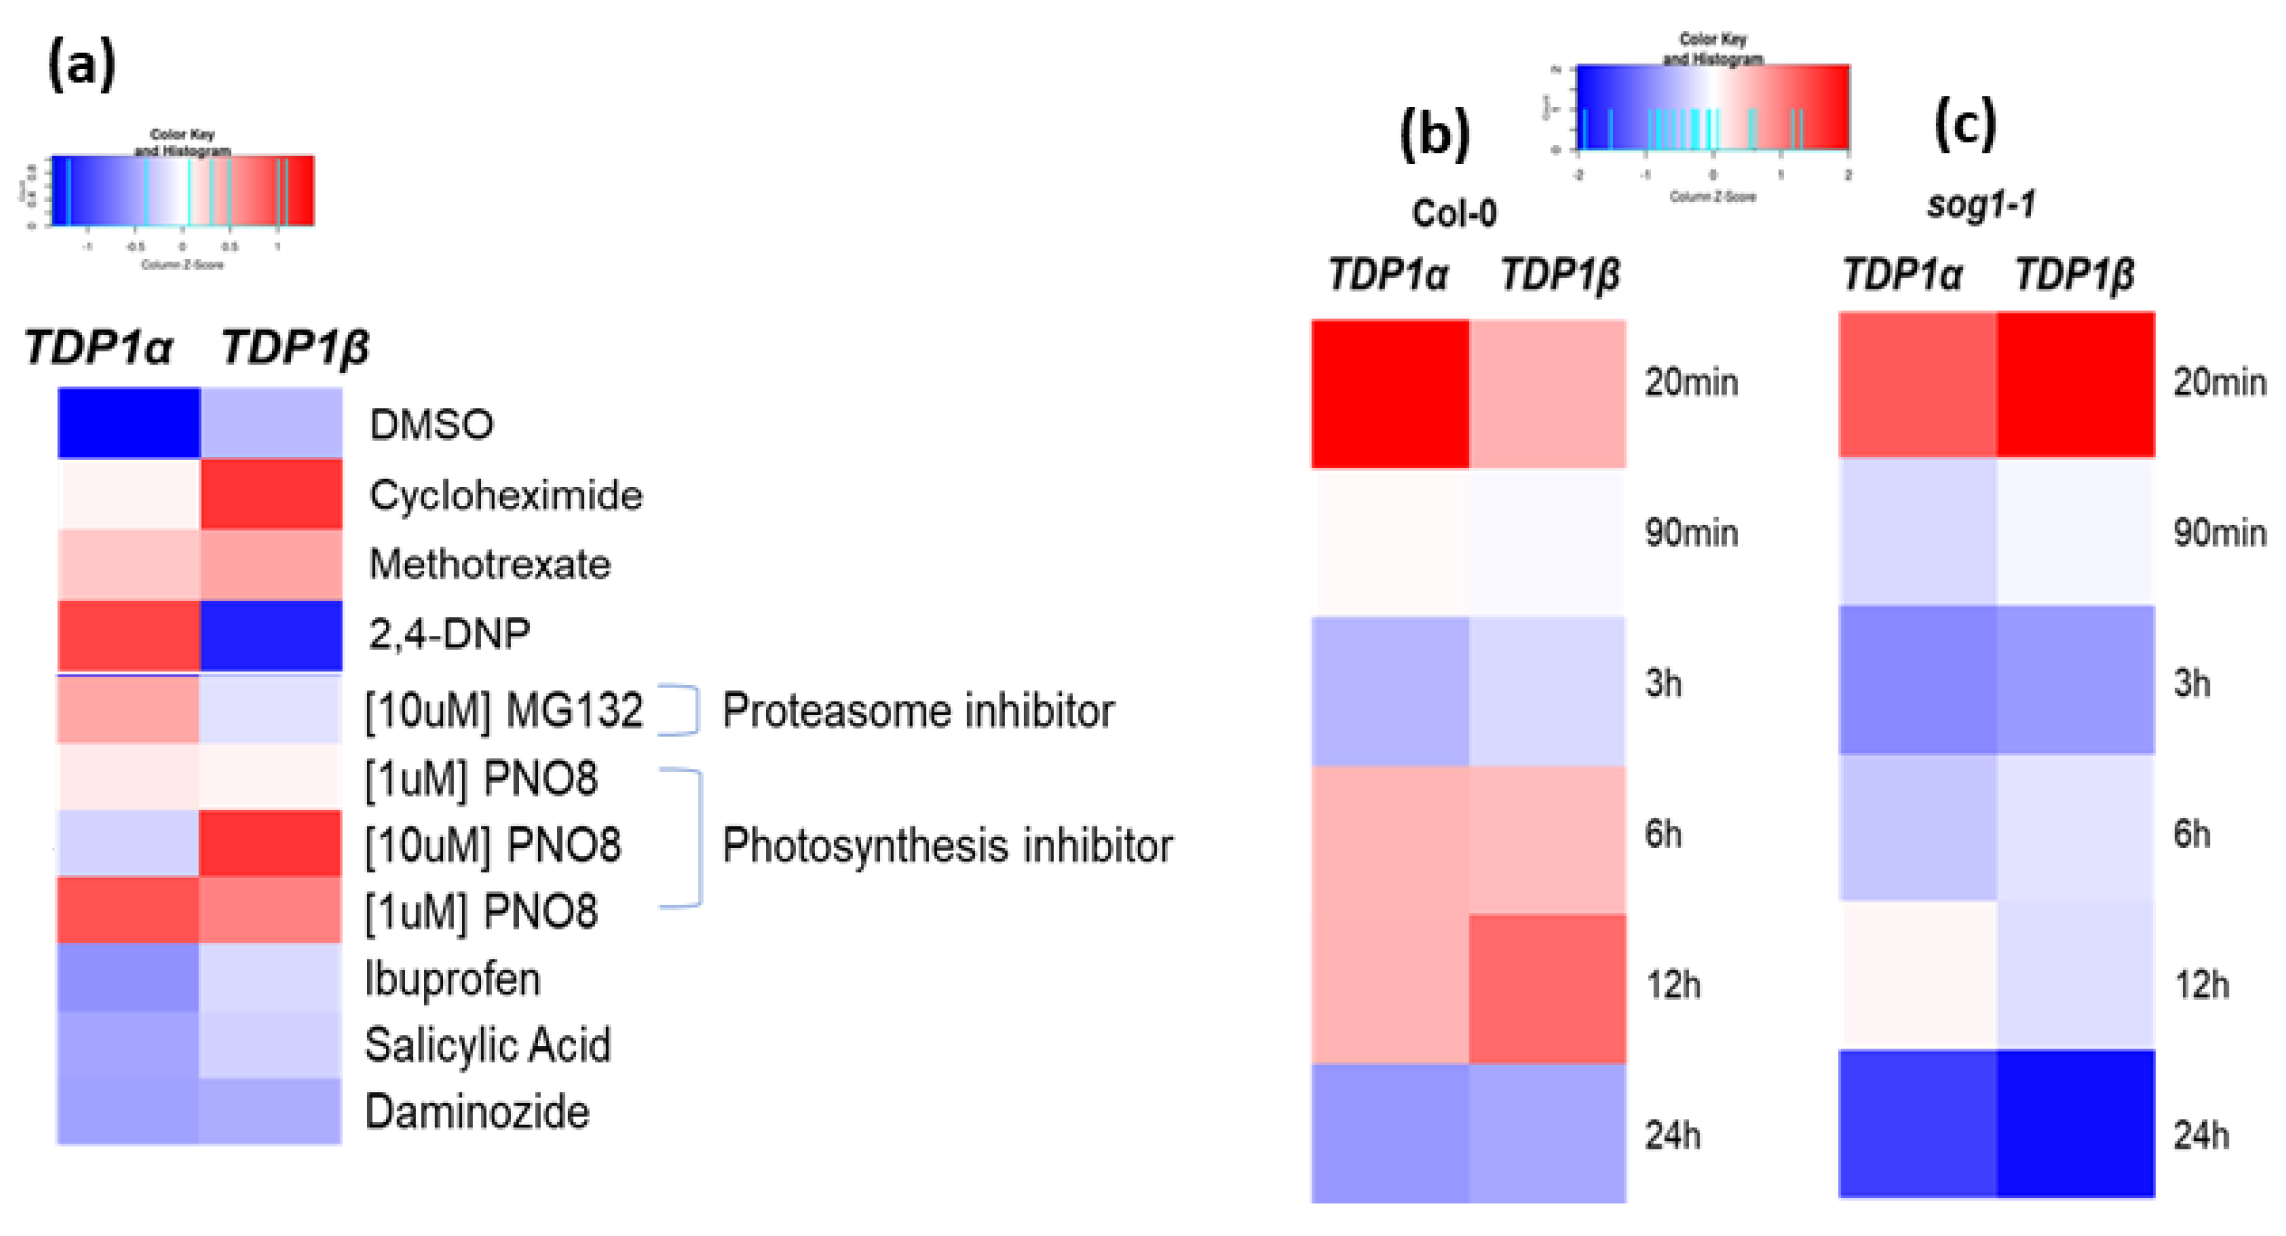
3.6. Arabidopsis TDP1α and TDP1β Comparative Expression during Treatments with Cytotoxic and Genotoxic Agents

Cytotoxic and genotoxic damages can be induced by endogenous and exogenous factors. In this case, different chemical and physical agents were used to induce cytotoxic and genotoxic stresses in seeds and seedlings, and data were mined from different studies where these treatments were implemented in Arabidopsis [37,45,49] (Figure 5).
Among the chemical treatments applied to seeds for a period of 24 h (Figure 5a) [37], dimethyl sulfoxide (DMSO, 1%) was used as a control and an agent to dissolve the chemical compounds, even though this compound can impair seed germination and plant development when used in high concentrations [77]. Indeed, the DMSO treatment seems to affect the expression of the TDP1 genes, in agreement with previous studies from other model systems [31]. Cycloheximide (CHX, 1 µM) strongly induces the expression of TDP1β, while 2,4-dinitrophenol (2,4-DNP, 25 μM) treatment acts oppositely on both genes, thus downregulating TDP1β and upregulating TDP1α. CHX is a naturally occurring fungicide produced by the bacterium Streptomyces griseus [78]. It exerts its effects by interfering with the translocation step in protein synthesis, hence blocking the eukaryotic translational elongation [79]. On the other hand, CHX treatments are responsible for the enhanced induction of many stress genes [80], while, in other studies, these were associated with hindered seed germination through the inhibition of protein synthesis [81]. The 2,4-DNP agent is an ATP synthesis uncoupler that inhibits ATP synthesis, and it was shown that its use in plants affected root permeability [82] in relation to auxin and ethylene production [83]. The observed results may indicate that, in seeds, TDP1α could be required in situations where stress conditions are related to low ATP, which affects membrane permeability during germination, whereas TDP1β could be necessary during transcriptional elongation.
Among the chemical treatments applied to plantlets [45], MG132 was used as a proteasome inhibitor [84] that can alter the production of reactive oxygen species (ROS), as proteasomes are among the direct regulatory mechanisms of ROS production in plants [85]. The gathered results indicate that TDP1α is more abundantly expressed compared to TDP1β, in agreement with the proposed role of this gene in the BER pathway [26]. Moreover, a photosynthesis PSII system inhibitor treatment was implemented by using the N-octyl-3-nitro-2,4,6- trihydroxybenzamide (PNO8, 1 and 10µM) compound, known to specifically hinder electron transport [86]; hence, it can be also used as an oxidative stress inducer [87]. This treatment resulted in both TDP1 genes’ upregulation, even at the lowest concentration, pointing again toward relevant roles in ROS-induced stresses [17,28,68,69,70]. The last compounds, ibuprofen (10µM), salicylic acid (10 µM), and daminozide, show mild downregulation in both genes. These treatment effects can be viewed in relation to the fact that pharmaceuticals pose a risk to the environment and their potential effects on plants can be connected with different hormone pathways [88,89]. Taken together, these analyses indicate that different chemical agents affect the expression of the TDP1α and TDP1β genes in distinct ways, possibly pointing to their involvement in particular processes.
The expression patterns of the two TDP1 genes were also evaluated in response to gamma irradiation (γ-ray) treatment, known to induce the accumulation of DSB and activation of the DNA damage response (DDR) pathway. The gathered data came from 6-day-old A. thaliana seedlings, where the Col0 wild-type and the sog1-1 mutant were exposed to a dose of 100 Gγ (10 Gγ/min), and the plant response was followed during a 24 h time course [49]. The sog1-1 mutant is deficient in the function of the suppressor of gamma response 1 (SOG1) gene, considered to be the master regulator of plant DDR and a functional homolog of the mammalian p53 [90,91]. As shown in the generated heatmaps, the data mining approach, provided as a fold change relative to control data, revealed the rapid upregulation (at 20 min after treatment) of both genes in response to γ-rays in wild-type seedlings, with TDP1α being more expressed than TDP1β (Figure 5b). Moreover, in the sog1-1 mutant, the highest expression level was observed at 20 min after the treatment, but, in this case, the TDP1β gene was more expressed than TDP1α (Figure 5c). The results indicate that the TDP1 genes are influenced by SOG1, while the rapid activation in response to γ-rays suggests that they are immediately recruited by the DNA repair systems, possibly through both SOG1-dependent and -independent pathways.
Considering the mined data for co-expression networks and putative protein–protein interactions (see Section 3.1), the two genes’ expression data further support the involvement of these genes in DNA damage repair and the response to genotoxic stresses, in agreement with previous publications [14,25,31].

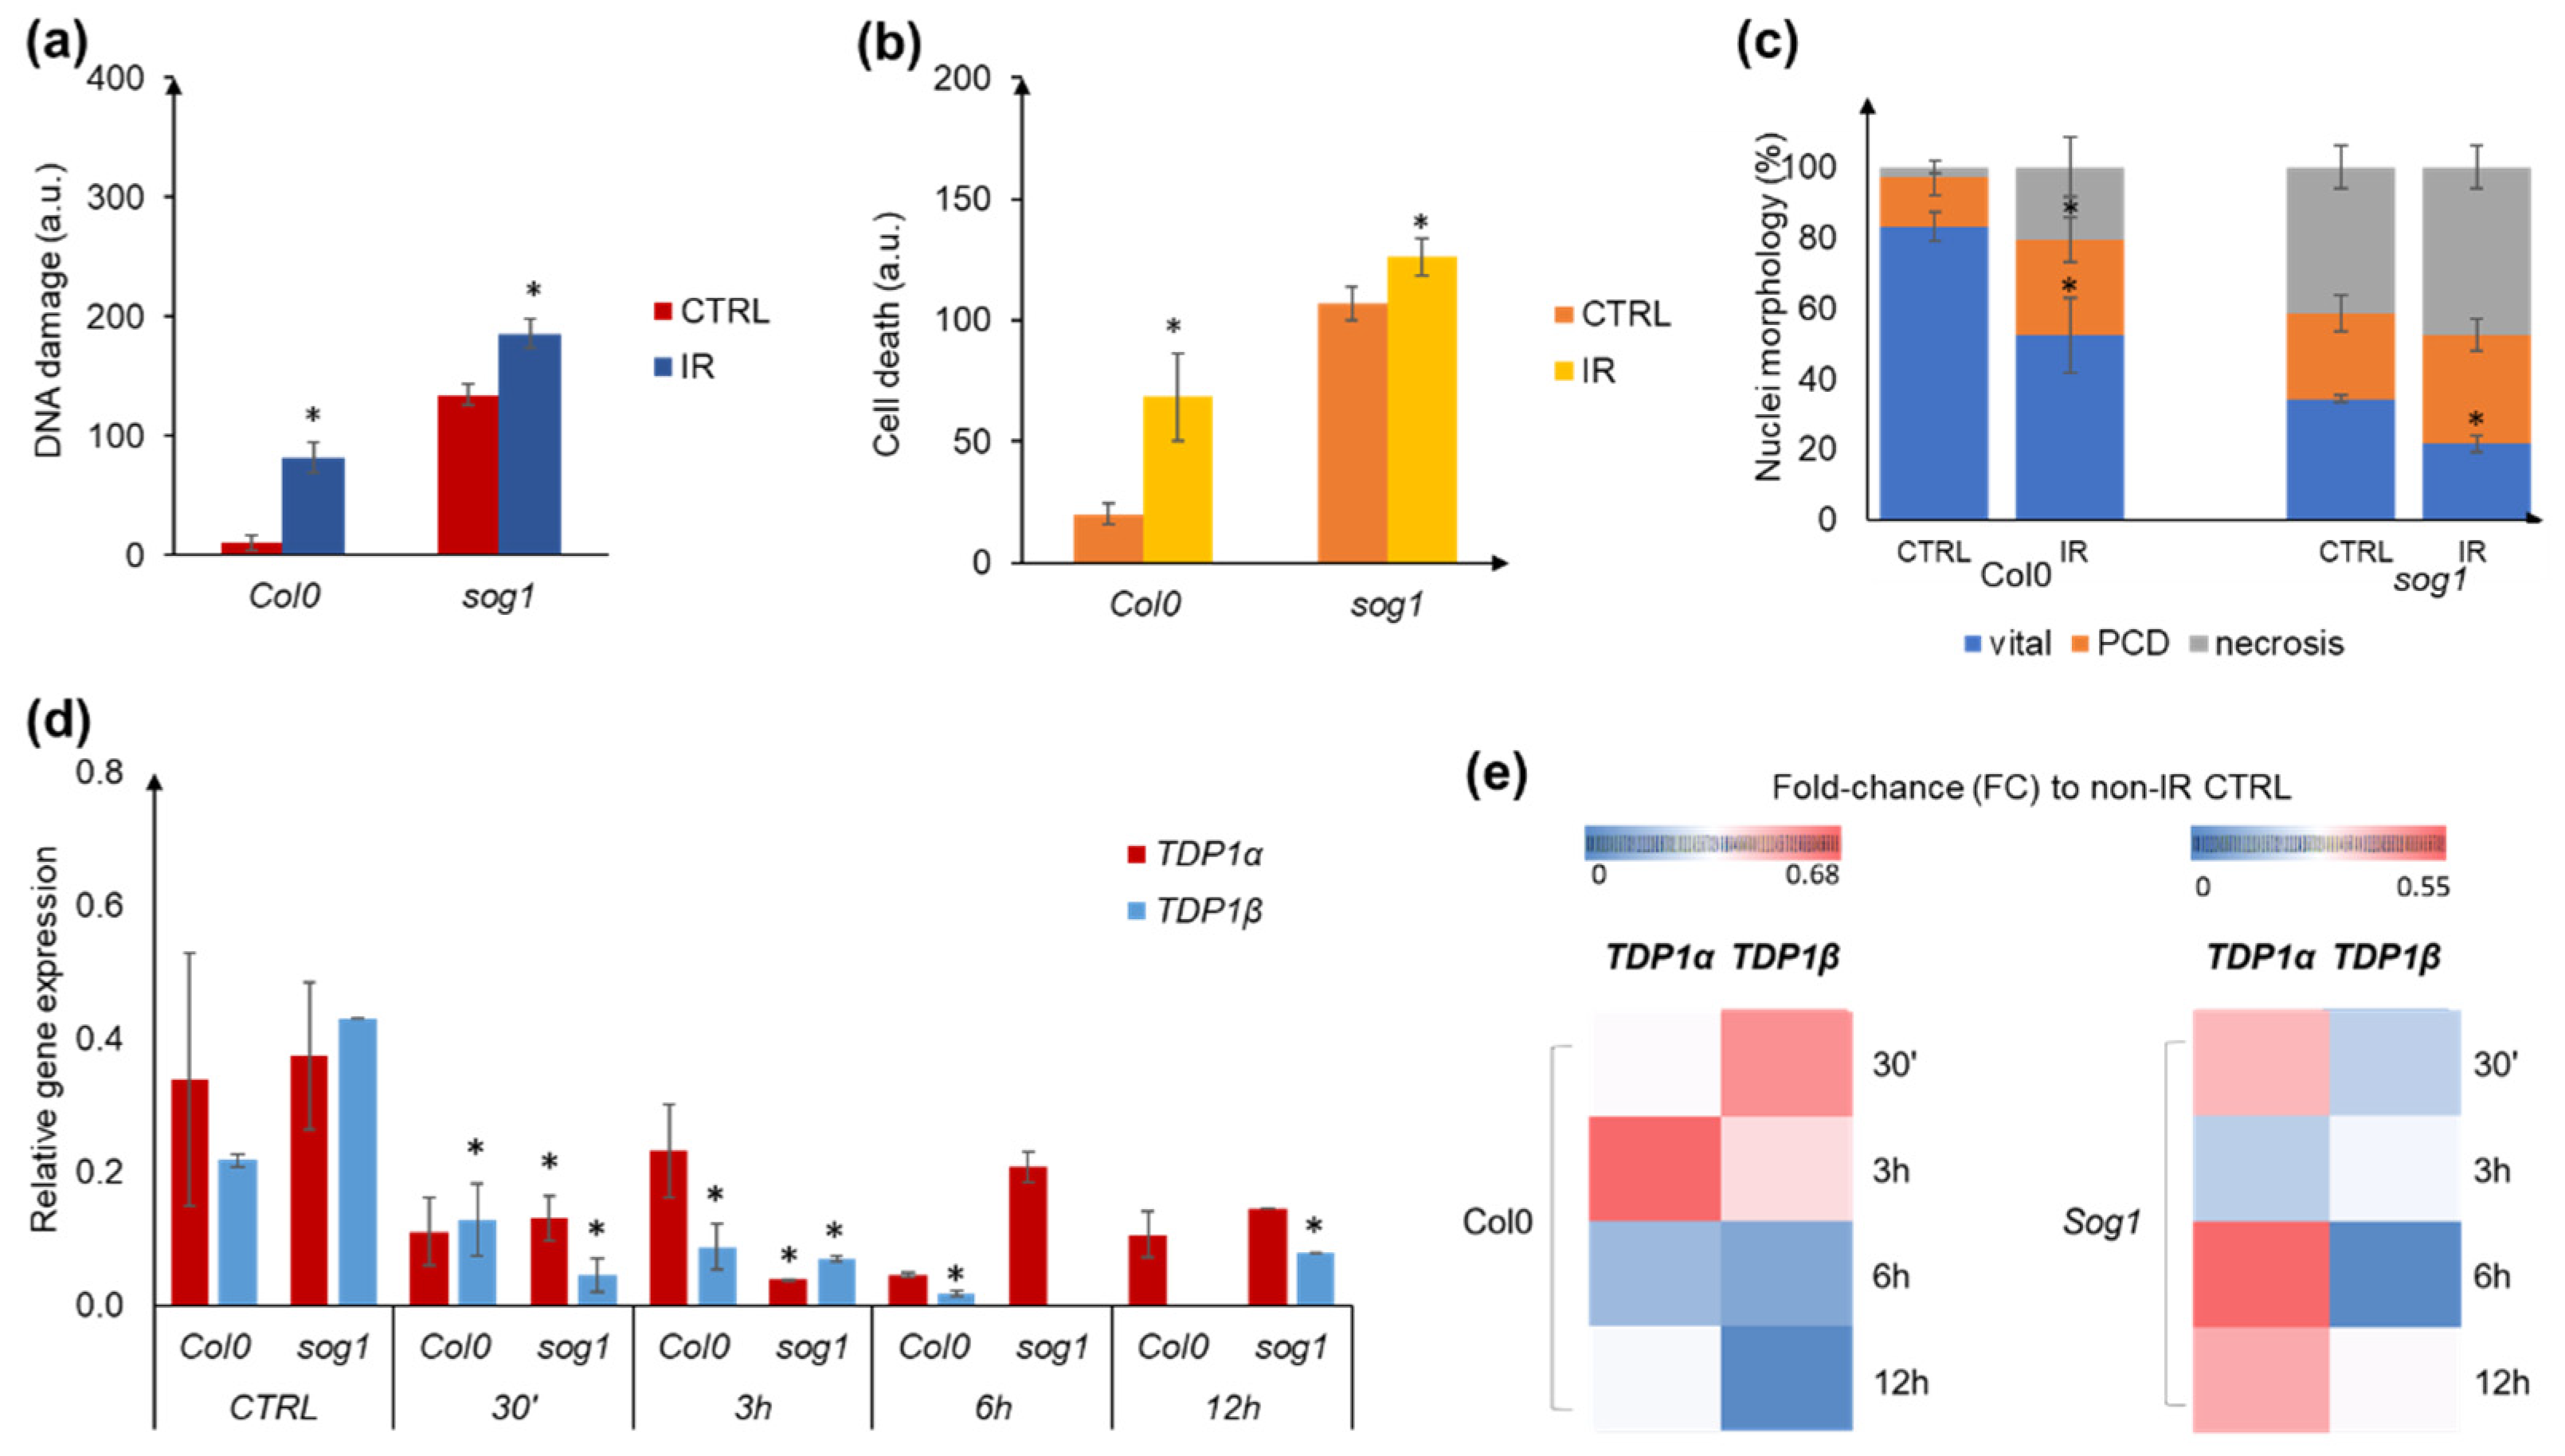
3.7. Experimental System to Corroborate the Impact of γ-Ray Treatment on TDP1α and TDP1β Gene Expression
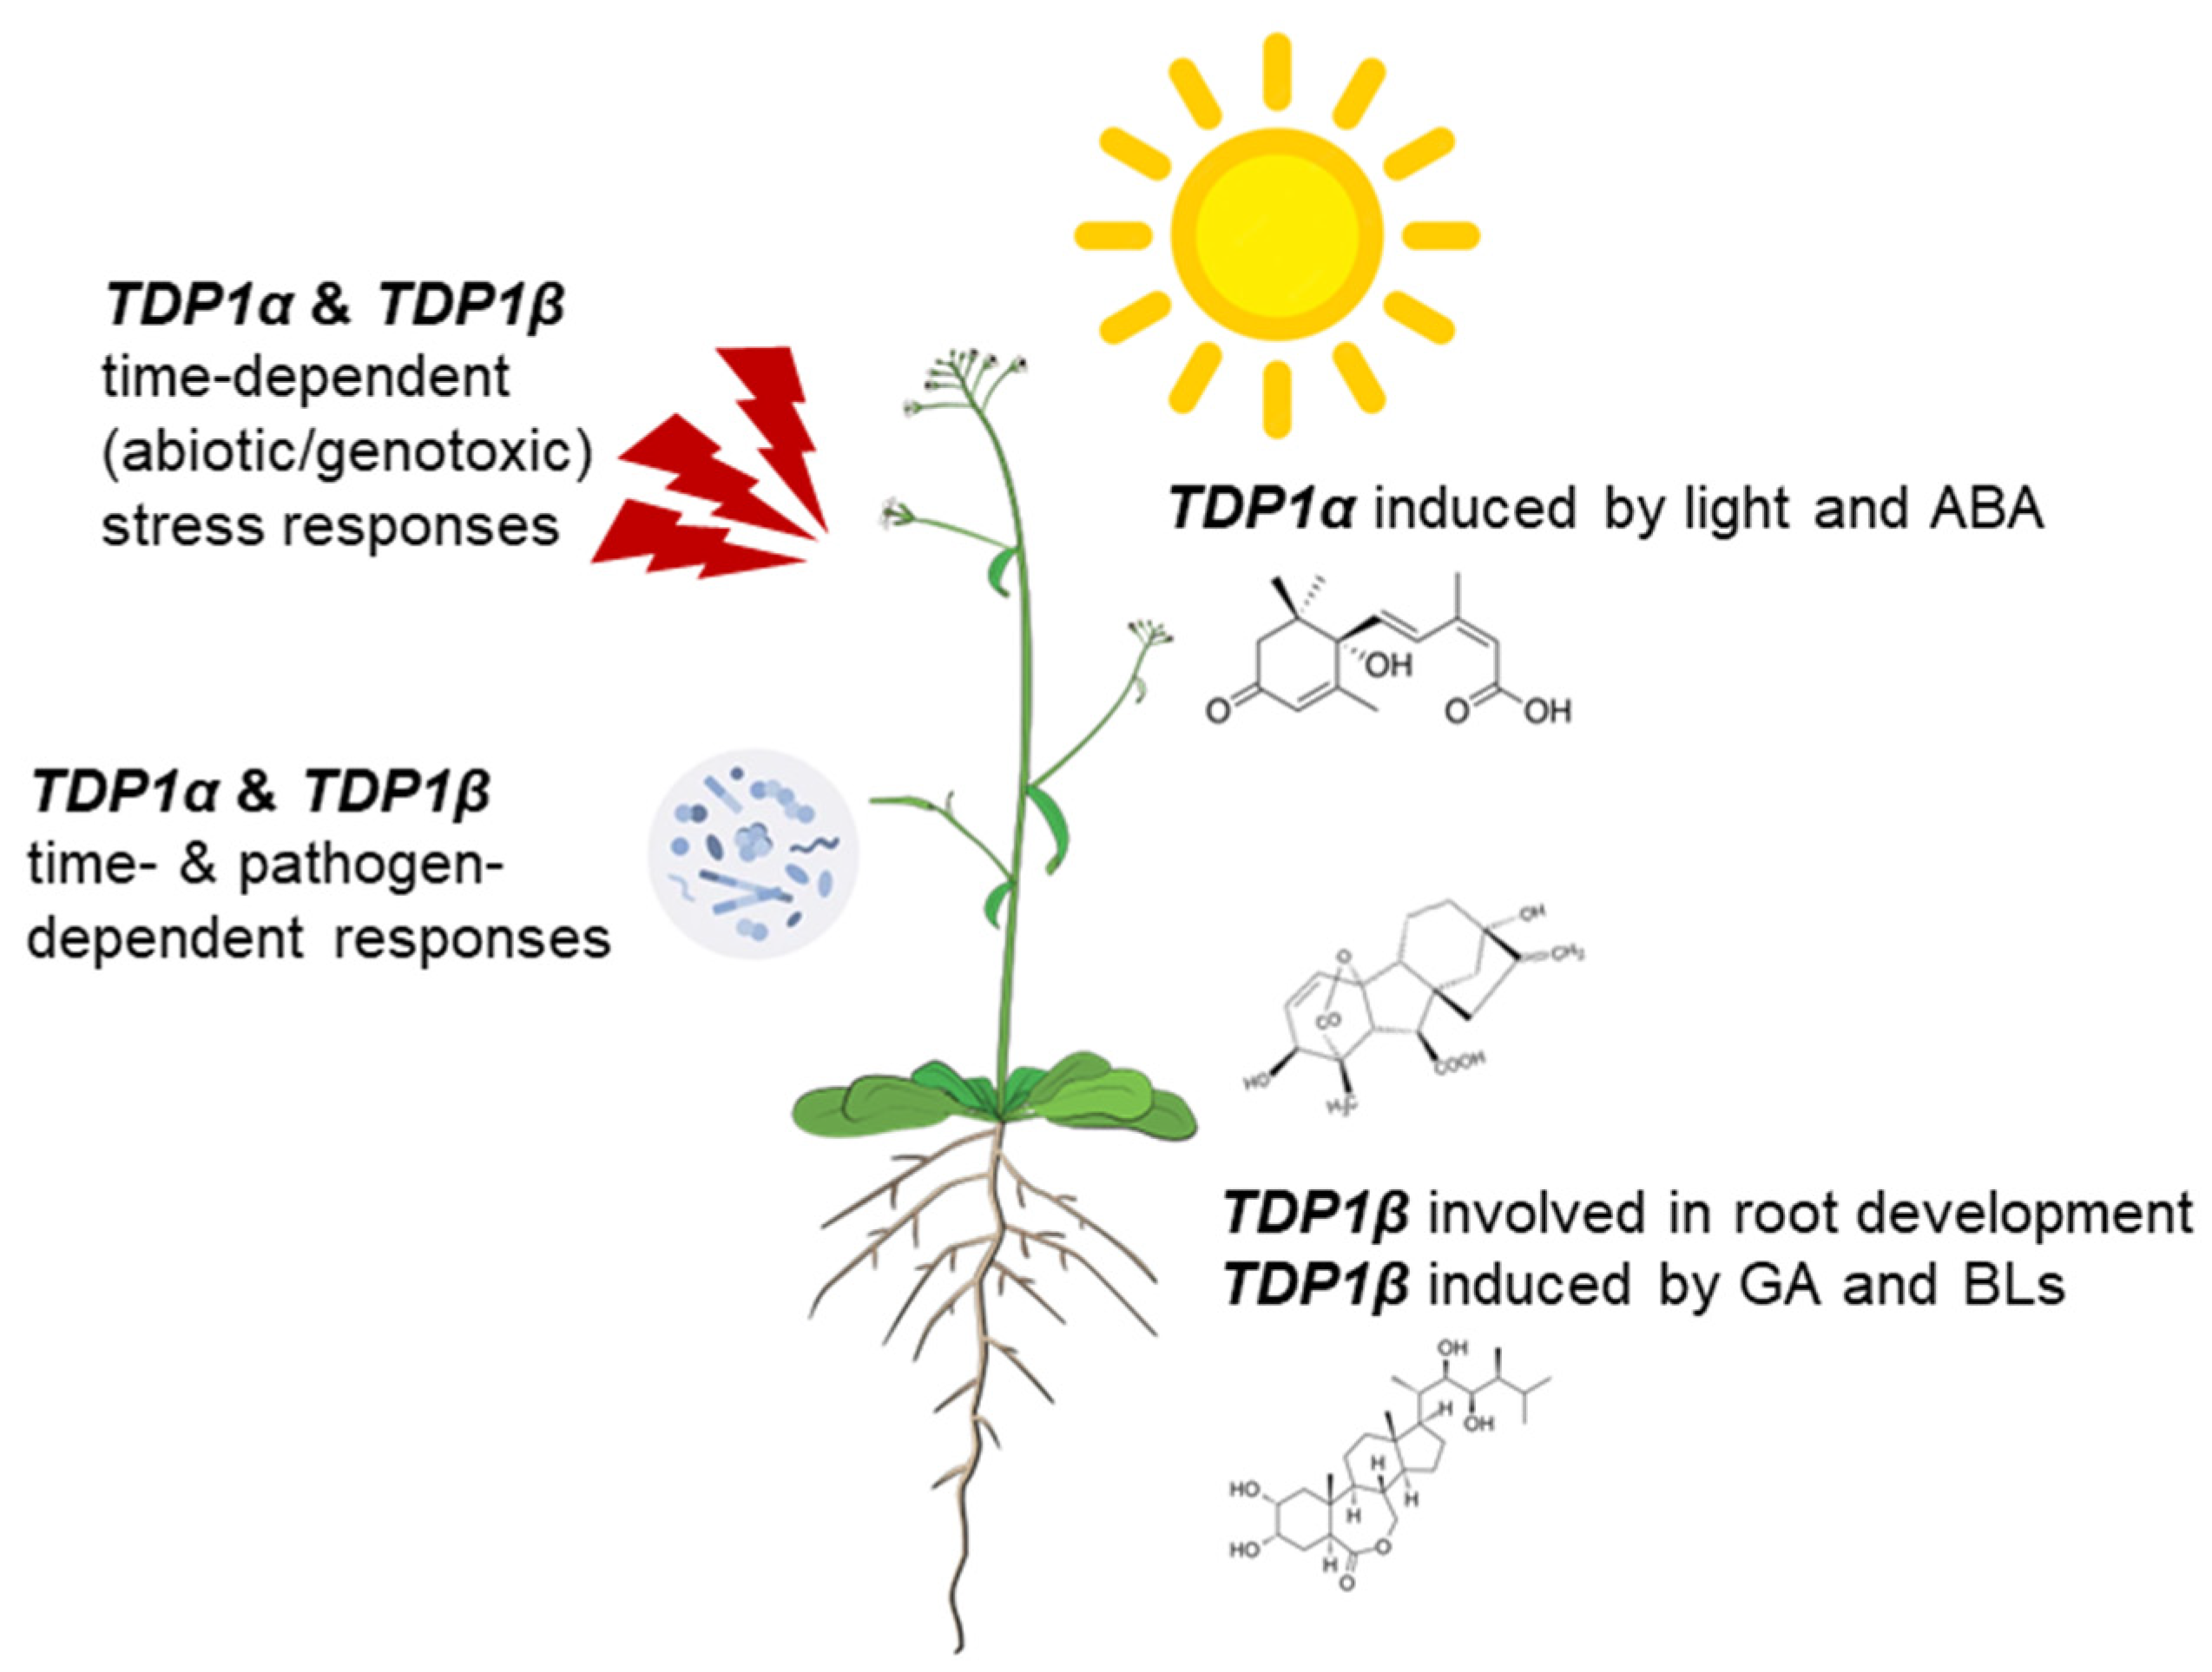
To try to verify some of the collected data, an ad hoc experimental system was designed similarly to the one proposed by Bourbousse et al. [49], with a few modifications. Namely, the Col0 and sog1-1 lines were treated with the same dose of γ-rays (100 Gy), which were, however, administered to 10-day-old plantlets, subsequently sampled at 30 min, 3 h, 6 h, and 12 h timepoints for qRT-PCR analyses. However, before proceeding with the evaluation of TDP1 gene expression, the comet and diffusion assays were carried out to evaluate the levels of DNA damage and cell death present in this system. As shown in Figure 6a, the irradiation (IR) treatment resulted in the significant accumulation of DNA damage compared with the non-treated samples (CTRL), and this accumulation was substantially higher in the sog1 mutant compared with the Col0 lines. The same pattern was obtained when cell death events were monitored, showing enhanced levels of cell mortality being present after IR, more pronounced in the sog1 mutant (Figure 6b). When considering the types of cellular mortality, IR induced the enhanced accumulation of programmed cell death (PCD) and necrotic nuclei in Col0, while these were more pronounced in the sog1 mutant gene in the absence of stress (Figure 6c). These results prove once more that the SOG1 gene deficiency is strongly correlated with defects in DNA repair activation and PCD induction [49,92,93,94]. When looking at the gene expression data, the first observation that can be made in our system is that the TDP1β gene seems to be more expressed in the sog1 mutant compared to the Col0 line in the absence of IR treatment, whereas the TDP1α gene is similarly expressed in both genotypes (Figure 6d, CTRL samples). After 30 min following IR, both genes were downregulated compared to the non-IR CTRL, a trend that was generally maintained also at later timepoints (Figure 6d). It could be also noted that the TDP1β gene expression values tend to be lower than TDP1α. Fluctuations in gene expression could be observed also when looking at the wild-type and mutant genotypes. Hence, it can be concluded that both the TDP1α and TDP1β genes are responsive to IR treatment in a genotype-dependent manner. However, when the pattern of expression was given in terms of fold change (FC) relative to the non-IR control (Figure 6e), the trend was more similar to that gathered from the data mining approach, with the activation of genes immediately after treatment (Figure 5b,c).
The two different data representation methods (histograms versus FC) were chosen to be able to give an overall picture of the gene expression in the CTRL and IR materials, as well as to compare the patterns of expression with those obtained from the high-throughput analyses. The observed differences may be attributed not only to the different techniques used (mRNA-seq versus qRT-PCR) but also to the seedling age (5- vs. 10-day-old A. thaliana plantlets), together with the growth chamber conditions and slightly different timepoints for material collection.

4. Conclusions

In conclusion, data mining approaches prove to be a powerful tool to gather information related to poorly investigated gene functions, particularly for model plants, given the richness of transcriptomics data available. In this study, we focused on a comparative transcriptomics approach exemplified using a small gene family, composed of the TDP1α and TDP1β genes, whose diverse functions are still far from being elucidated. Even in the A. thaliana model plant, most studies published so far refer only to the canonical TDP1α gene [14,16,26], while the TDP1β function remains more elusive. The gene expression data gathered in this study from the Bio-Analytic Resource for Plant Biology platform allowed us to pinpoint both common and divergent functions of the two genes. A more dissected analysis related to developmental aspects and stress responses allowed us to also focus on gene-specific responses. To summarize the core of the data gathered in this study, a schematic representation of the potential roles of the two genes in A. thaliana is given (Figure 7).
Specifically, the presented data indicate that while TDP1β would appear to be more involved in root development and associated with the GA and BL phytohormones, TDP1α is more responsive to light and ABA. On the other hand, when considering the expression patterns under stress conditions, both genes are highly responsive to different biotic and abiotic treatments, in a time- and stress-dependent manner. Moreover, the experimental system designed to corroborate the data mining results in response to IR treatment sustains the genes’ responsiveness in a genotype-dependent manner. Further studies connecting the role of the TDP1 genes in plant DDR are currently in progress. The hereby gathered data bring novel information related to the putative involvement of the TDP1 genes in plant development, aside from their already known implications in the stress response, paving the way for novel research dedicated to designing additional experimental systems for further validation and in-depth characterization of these genes in plants.

Supplementary Materials

The following supporting information can be downloaded at: https://www.mdpi.com/article/10.3390/genes14040884/s1. Figure S1: Protein alignment between TDP1α (AT5G15170) and TDP1β (AT5G07400) carried out with ClustalW tool; Figure S2: Arabidopsis thaliana TDP1α (AT5G15170) and TDP1β (AT5G07400) gene organization and chromosomal localization; Figure S3: A. thaliana TDP1α and TDP1β gene co-expression and co-localization networks generated using GeneMania; Figure S4: Predicted protein–protein interaction networks for Arabidopsis thaliana TDP1α and TDP1β sequences generated using STRING; Figure S5: Computationally predicted and experimentally documented subcellular localization of TDP1α and TDP1β proteins.

Author Contributions

Conceptualization, A.M.; methodology, P.P. and A.P.; software, S.P.; formal analysis, P.P., A.P. and A.M.; investigation, P.P.; data curation, S.P.; writing, reviewing, and editing, A.M. and A.B. All authors have read and agreed to the published version of the manuscript.

Funding

This research received no external funding.

Institutional Review Board Statement

Not applicable.

Informed Consent Statement

Not applicable.

Data Availability Statement

Not applicable.

Acknowledgments

The authors would like to acknowledge the support of the Italian Ministry of Education, University and Research (MUR), Dipartimenti di Eccellenza Program (2018–2022), given to the Department of Biology and Biotechnology “L. Spallanzani”, University of Pavia. The authors thank Cécile Raynaud (Institut de Sciences des Plantes Paris-Saclay, France) for providing the Arabidopsis thaliana seeds, and Daniele Dondi (Chemistry Department, University of Pavia, Italy) for providing access to the irradiation source.

Conflicts of Interest

The authors declare no conflict of interest.

References

  1. Britt, A.B. DNA damage and repair in plants. Annu. Rev. Plant Physiol. Plant Mol. Biol. 1996, 47, 75–100. [Google Scholar] [CrossRef]
  2. Balestrazzi, A.; Confalonieri, M.; Macovei, A.; Donà, M.; Carbonera, D. Genotoxic stress and DNA repair in plants: Emerging functions and tools for improving crop productivity. Plant Cell Rep. 2011, 30, 287–295. [Google Scholar] [CrossRef]
  3. Roy, S. Maintenance of genome stability in plants: Repairing DNA double strand breaks and chromatin structure stability. Front. Plant Sci. 2014, 5, 487. [Google Scholar] [CrossRef] [Green Version]
  4. Manova, V.; Gruszka, D. DNA damage and repair in plants—From models to crops. Front. Plant Sci. 2015, 6, 885. [Google Scholar] [CrossRef] [Green Version]
  5. Kuzminov, A. Single-strand interruptions in replicating chromosomes cause double-strand breaks. Proc. Natl. Acad. Sci. USA 2001, 98, 8241–8246. [Google Scholar] [CrossRef] [Green Version]
  6. Waterworth, W.M.; Drury, G.E.; Bray, C.M.; West, C.E. Repairing breaks in the plant genome: The importance of keeping it together. New Phytol. 2011, 192, 805–822. [Google Scholar] [CrossRef] [PubMed]
  7. Davies, D.R.; Interthal, H.; Champoux, J.J.; Hol, W.G.J. The crystal structure of human tyrosyl-DNA phosphodiesterase, Tdp1. Structure 2002, 10, 237–248. [Google Scholar] [CrossRef] [PubMed] [Green Version]
  8. Kawale, A.S.; Povirk, L.F. Tyrosyl-DNA phosphodiesterases: Rescuing the genome from the risks of relaxation. Nucleic Acids Res. 2018, 46, 520–537. [Google Scholar] [CrossRef] [Green Version]
  9. Yang, S.W.; Burgin, A.B., Jr.; Huizenga, B.N.; Robertson, C.A.; Yao, K.C.; Nash, H.A. A eukaryotic enzyme that can disjoin dead-end covalent complexes between DNA and type I topoisomerases. Proc. Natl. Acad. Sci. USA 1996, 93, 11534–11539. [Google Scholar] [CrossRef] [Green Version]
  10. Pouliot, J.J.; Yao, K.C.; Robertson, C.A.; Nash, H.A. Yeast gene for a Tyr-DNA phosphodiesterase that repairs topoisomerase I complexes. Science 1999, 286, 552–555. [Google Scholar] [CrossRef] [PubMed] [Green Version]
  11. Interthal, H.; Pouliot, J.J.; Champoux, J.J. The tyrosyl-DNA phosphodiesterase Tdp1 is a member of the phospholipase D superfamily. Proc. Natl. Acad. Sci. USA 2001, 98, 12009–12014. [Google Scholar] [CrossRef] [Green Version]
  12. Davies, D.R.; Interthal, H.; Champoux, J.J.; Hol, W.G.J. Explorations of peptide and oligonucleotide binding sites of tyrosyl-DNA phosphodiesterase using vanadate complexes. J. Med. Chem. 2004, 47, 829–837. [Google Scholar] [CrossRef]
  13. Pommier, Y.; Barcelo, J.M.; Rao, V.A.; Sordet, O.; Jobson, A.G.; Thibaut, L.; Miao, Z.-H.; Seiler, J.A.; Zhang, H.; Marchand, C.; et al. Repair of topoisomerase I-mediated DNA damage. Prog. Nucleic Acid Res. Mol. Biol. 2006, 81, 179–229. [Google Scholar] [CrossRef] [Green Version]
  14. Lee, S.-Y.; Kim, H.; Hwang, H.-J.; Jeong, Y.-M.; Na, S.H.; Woo, J.-C.; Kim, S.-G. Identification of tyrosyl-DNA phosphodiesterase as a novel DNA damage repair enzyme in Arabidopsis. Plant Physiol. 2010, 154, 1460–1469. [Google Scholar] [CrossRef] [Green Version]
  15. Vance, J.R.; Wilson, T.E. Yeast Tdp1 and Rad1-Rad10 function as redundant pathways for repairing Top1 replicative damage. Proc. Natl. Acad. Sci. USA 2002, 99, 13669–13674. [Google Scholar] [CrossRef] [PubMed] [Green Version]
  16. Kim, H.; Na, S.H.; Lee, S.-Y.; Jeong, Y.-M.; Hwang, H.-J.; Hur, J.Y.; Park, S.-H.; Woo, J.-C.; Kim, S.-G. Structure-function studies of a plant tyrosyl-DNA phosphodiesterase provide novel insights into DNA repair mechanisms of Arabidopsis thaliana. Biochem. J. 2012, 443, 49–56. [Google Scholar] [CrossRef] [Green Version]
  17. Macovei, A.; Balestrazzi, A.; Confalonieri, M.; Carbonera, D. The tyrosyl-DNA phosphodiesterase gene family in Medicago truncatula Gaertn.: Bioinformatic investigation and expression profiles in response to copper- and PEG-mediated stress. Planta 2010, 232, 303–407. [Google Scholar] [CrossRef]
  18. Mutti, G.; Raveane, A.; Pagano, A.; Bertolini, F.; Semino, O.; Balestrazzi, A.; Macovei, A. Plant TDP1 (Tyrosyl-DNA Phosphodiesterase 1): A phylogenetic perspective and gene expression data mining. Genes 2020, 11, 1465. [Google Scholar] [CrossRef] [PubMed]
  19. Sabatini, M.E.; Pagano, A.; Araùjo, S.; Balestrazzi, A.; Macovei, A. The Tyrosyl-DNA phosphodiesterase 1β (Tdp1β) gene discloses an early response to abiotic stresses. Genes 2017, 8, 305. [Google Scholar] [CrossRef] [PubMed] [Green Version]
  20. Durocher, D.; Henckel, J.; Fersht, A.R.; Jackson, S.P. The FHA domain is a modular phosphopeptide recognition motif. Mol. Cell 1999, 4, 387–394. [Google Scholar] [CrossRef] [PubMed]
  21. Iyer, L.M.; Babu, M.M.; Aravind, L. The HIRAN domain and recruitment of chromatin remodeling and repair activities to damaged DNA. Cell Cycle 2006, 5, 775–782. [Google Scholar] [CrossRef] [PubMed] [Green Version]
  22. Hishiki, A.; Hara, K.; Ikegaya, Y.; Yokoyama, H.; Shimizu, T.; Sato, M.; Hashimoto, H. Structure of a novelDNA-binding domain of helicase-like transcription factor (HLTF) and its functional implication in DNA damage tolerance. J. Biol. Chem. 2015, 290, 13215–13223. [Google Scholar] [CrossRef] [PubMed] [Green Version]
  23. Korzhnev, D.M.; Neculai, D.; Dhe-Paganon, S.; Arrowsmith, C.H.; Bezsonova, I. Solution NMR structure of the HLTF HIRAN domain: A conserved module in SWI2/SNF2 DNA damage tolerance proteins. J. Biomol. NMR 2016, 66, 209–219. [Google Scholar] [CrossRef]
  24. Pommier, Y.; Huang, S.N.; Gao, R.; Das, B.B.; Murai, J.; Marchand, C. Tyrosyl-DNA-phosphodiesterases (TDP1 and TDP2). DNA Repair 2014, 19, 114–129. [Google Scholar] [CrossRef] [PubMed] [Green Version]
  25. Enderle, J.; Dorn, A.; Beying, N.; Trapp, O.; Puchta, H. The protease WSS1A, the endonuclease MUS81 and the phosphodiesterase TDP1 are involved in independent pathways of DNA-protein crosslink repair in plants. Plant Cell 2019, 31, 775–790. [Google Scholar] [CrossRef]
  26. Donà, M.; Confalonieri, M.; Minio, A.; Biggiogera, M.; Buttafava, A.; Raimondi, E.; Delledonne, M.; Ventura, L.; Sabatini, M.E.; Macovei, A.; et al. RNA-Seq analysis discloses early senescence and nucleolar dysfunction triggered by Tdp1α depletion in Medicago truncatula. J. Exp. Bot. 2013, 64, 1941–1951. [Google Scholar] [CrossRef] [PubMed] [Green Version]
  27. Sabatini, M.E.; Donà, M.; Leonetti, P.; Minio, A.; Delledonne, M.; Carbonera, D.; Confalonieri, M.; Giraffa, G.; Balestrazzi, A. Depletion of tyrosyl-DNA phosphodiesterase 1α (MtTdp1α) affects transposon expression in Medicago truncatula. J. Integr. Plant Biol. 2016, 58, 618–622. [Google Scholar] [CrossRef] [Green Version]
  28. Balestrazzi, A.; Confalonieri, M.; Macovei, A.; Carbonera, D. Seed imbibition in Medicago truncatula Gaertn.: Expression profiles of DNA repair genes in relation to PEG-mediated stress. J. Plant Physiol. 2011, 168, 706–713. [Google Scholar] [CrossRef]
  29. Weidlich, I.E.; Dexheimer, T.; Marchand, C.; Antony, S.; Pommier, Y.; Nicklaus, M.C. Inhibitors of human tyrosyl-DNA phosphodiesterase (hTdp1) developed by virtual screening using ligand-based pharmacophores. Bioorg. Med. Chem. 2010, 18, 182–189. [Google Scholar] [CrossRef] [Green Version]
  30. Macovei, A.; Pagano, A.; Sabatini, M.E.; Grandi, S.; Balestrazzi, A. The human Tyrosyl-DNA Phosphodiesterase 1 (hTdp1) inhibitor NSC120686 as an exploratory tool to investigate plant Tdp1 genes. Genes 2018, 9, 186. [Google Scholar] [CrossRef] [Green Version]
  31. Gualtieri, C.; Gianella, M.; Pagano, A.; Cadeddu, T.; Araújo, S.; Balestrazzi, A.; Macovei, A. Exploring microRNA signatures of DNA damage response using an innovative system of genotoxic stress in Medicago truncatula seedlings. Front. Plant Sci. 2021, 12, 645323. [Google Scholar] [CrossRef]
  32. Tanz, S.K.; Castleden, I.; Hooper, C.M.; Vacher, M.; Small, I.; Millar, H.A. SUBA3: A database for integrating experimentation and prediction to define the SUBcellular location of proteins in Arabidopsis. Nucleic Acids Res. 2013, 41, D1185–D1191. [Google Scholar] [CrossRef] [PubMed] [Green Version]
  33. Hooper, C.M.; Castleden, I.R.; Tanz, S.K.; Aryamanesh, N.; Millar, A.H. SUBA4: The interactive data analysis centre for Arabidopsis subcellular protein locations. Nucleic Acids Res. 2017, 45, D1064–D1074. [Google Scholar] [CrossRef] [PubMed] [Green Version]
  34. Winter, D.; Vinegar, B.; Nahal, H.; Ammar, R.; Wilson, G.V.; Provart, N.J. An “Electronic Fluorescent Pictograph” browser for exploring and analyzing large-scale biological data sets. PLoS ONE 2007, 2, e718. [Google Scholar] [CrossRef]
  35. Waese, J.; Fan, J.; Pasha, A.; Yu, H.; Fucile, G.; Shi, R.; Cumming, M.; Kelley, L.A.; Sternberg, M.J.; Krishnakumar, V.; et al. ePlant: Visualizing and exploring multiple levels of data for hypothesis generation in plant biology. Plant Cell 2017, 29, 1806–1821. [Google Scholar] [CrossRef] [Green Version]
  36. Schmid, M.; Davison, T.S.; Henz, S.R.; Pape, U.J.; Demar, M.; Vingron, M.; Schölkopf, B.; Weigel, D.; Lohmann, J.U. A gene expression map of Arabidopsis thaliana development. Nat. Genet. 2005, 37, 501–506. [Google Scholar] [CrossRef] [PubMed]
  37. Bassel, G.W.; Fung, P.; Chow, T.F.; Foong, J.A.; Provart, N.J.; Cutler, S.R. Elucidating the germination transcriptional program using small molecules. Plant Physiol. 2008, 147, 143–155. [Google Scholar] [CrossRef] [Green Version]
  38. Marks, M.D.; Wenger, J.P.; Gilding, E.; Jilk, R.; Dixon, R.A. Transcriptome analysis of Arabidopsis wild-type and gl3-sst sim trichomes identifies four additional genes required for trichome development. Mol. Plant 2009, 2, 803–822. [Google Scholar] [CrossRef]
  39. Gilding, E.K.; Marks, M.D. Analysis of purified glabra3-shapeshifter trichomes reveals a role for NOECK in regulating early trichome morphogenic events. Plant J. 2010, 64, 304–317. [Google Scholar] [CrossRef]
  40. Morohashi, K.; Grotewold, E. A systems approach reveals regulatory circuitry for Arabidopsis trichome initiation by the GL3 and GL1 selectors. PLoS Genet. 2009, 5, e1000396. [Google Scholar] [CrossRef] [Green Version]
  41. Pillitteri, L.J.; Peterson, K.M.; Horst, R.J.; Torii, K.U. Molecular profiling of stomatal meristemoids reveals new component of asymmetric cell division and commonalities among stem cell populations in Arabidopsis. Plant Cell 2011, 23, 3260–3275. [Google Scholar] [CrossRef] [PubMed] [Green Version]
  42. Bruex, A.; Kainkaryam, R.M.; Wieckowski, Y.; Kang, Y.H.; Bernhardt, C.; Xia, Y.; Zheng, X.; Wang, J.Y.; Lee, M.M.; Benfey, P.; et al. A gene regulatory network for root epidermis cell differentiation in Arabidopsis. PLoS Genet. 2012, 8, e1002446. [Google Scholar] [CrossRef] [PubMed] [Green Version]
  43. Simon, M.; Bruex, A.; Kainkaryam, R.M.; Zheng, X.; Huang, L.; Woolf, P.J.; Schiefelbein, J. Tissue-specific profiling reveals transcriptome alterations in Arabidopsis mutants lacking morphological phenotypes. Plant Cell 2013, 25, 3175–3185. [Google Scholar] [CrossRef] [Green Version]
  44. Lempe, J.; Balasubramanian, S.; Sureshkumar, S.; Singh, A.; Schmid, M.; Weigel, D. Diversity of flowering responses in wild Arabidopsis thaliana strains. PLoS Genet. 2005, 1, 109–118. [Google Scholar] [CrossRef]
  45. Goda, H.; Sasaki, E.; Akiyama, K.; Maruyama-Nakashita, A.; Nakabayashi, K.; Li, W.; Ogawa, M.; Yamauchi, Y.; Preston, J.; Aoki, K.; et al. The AtGenExpress hormone and chemical treatment data set: Experimental design, data evaluation, model data analysis and data access. Plant J. 2008, 55, 526–542. [Google Scholar] [CrossRef] [PubMed]
  46. Kilian, J.; Whitehead, D.; Horak, J.; Wanke, D.; Weinl, S.; Batistic, O.; D’Angelo, C.; Bornberg-Bauer, E.; Kudla, J.; Harter, K. The AtGenExpress global stress expression data set: Protocols, evaluation and model data analysis of UV-B light, drought and cold stress responses. Plant J. 2007, 50, 347–363. [Google Scholar] [CrossRef] [PubMed]
  47. Wilkins, O.; Bräutigam, K.; Campbell, M.M. Time of day shapes Arabidopsis drought transcriptomes. Plant J. 2010, 63, 715–727. [Google Scholar] [CrossRef]
  48. Van Hoewyk, D.; Takahashi, H.; Inoue, E.; Hess, A.; Tamaoki, M.; Pilon-Smits, E.A. Transcriptome analyses give insights into selenium-stress responses and selenium tolerance mechanisms in Arabidopsis. Physiol. Plant 2008, 132, 236–253. [Google Scholar] [CrossRef] [PubMed]
  49. Bourbousse, C.; Vegesna, N.; Law, J.A. SOG1 activator and MYB3R repressors regulate a complex DNA damage network in Arabidopsis. Proc. Natl. Acad. Sci. USA 2018, 115, E12453–E12462. [Google Scholar] [CrossRef] [Green Version]
  50. Schaffer, R.; Landgraf, J.; Accerbi, M.; Simon, V.; Larson, M.; Wisman, E. Microarray analysis of diurnal and circadian-regulated genes in Arabidopsis. Plant Cell 2001, 13, 113–123. [Google Scholar] [CrossRef] [Green Version]
  51. Khomtchouk, B.B.; Hennessy, J.R.; Wahlestedt, C. shinyheatmap: Ultra fast low memory heatmap web interface for big data genomics. PLoS ONE 2017, 12, e0176334. [Google Scholar] [CrossRef] [PubMed] [Green Version]
  52. Ventura, L.; Giovannini, A.; Savio, M.; Donà, M.; Macovei, A.; Buttafava, A.; Carbonera, D.; Balestrazzi, A. Single cell gel electrophoresis (Comet) assay with plants: Research on DNA repair and ecogenotoxicity testing. Chemosphere 2013, 92, 1–9. [Google Scholar] [CrossRef]
  53. Collins, A.R. The comet assay for DNA damage and repair. Mol. Biotech. 2004, 26, 249–261. [Google Scholar] [CrossRef] [PubMed]
  54. Macovei, A.; Donà, M.; Carbonera, D.; Balestrazzi, A. DNA diffusion assay applied to plant cells. In ‘Plant Programmed Cell Death’ Methods in Molecular Biology; De Gara, L., Locato, V., Eds.; Humana Press: New York, NY, USA, 2018; Volume 1743, pp. 107–115. [Google Scholar] [CrossRef]
  55. Czechowski, T.; Stitt, M.; Altmann, T.; Udvardi, M.K.; Scheible, W.R. Genome-wide identification and testing of superior reference genes for transcript normalization in Arabidopsis. Plant Physiol. 2005, 139, 5–17. [Google Scholar] [CrossRef] [PubMed] [Green Version]
  56. Pfaffl, M.W. A new mathematical model for relative quantification in real-time RT-PCR. Nucleic Acids Res. 2001, 29, e45. [Google Scholar] [CrossRef] [PubMed]
  57. Fulcher, N.; Sablowski, R. Hypersensitivity to DNA damage in plant stem cell niches. Proc. Natl. Acad. Sci. USA 2009, 106, 20984–20988. [Google Scholar] [CrossRef] [Green Version]
  58. Kaufmann, C.; Stührwohldt, N.; Sauter, M. Tyrosyl protein sulfotransferase-dependent and -independent regulation of root development and signaling by PSK LRR receptor kinases in Arabidopsis. J. Exp. Bot. 2021, 72, 5508–5521. [Google Scholar] [CrossRef]
  59. Borassi, C.; Dorosz, J.G.; Ricardi, M.M.; Sardoy, M.C.; Pol Fachin, L.; Marzol, E.; Mangano, S.; Garcia, D.R.R.; Pacheco, J.M.; Guerrero, Y.D.C.R.; et al. A cell surface arabinogalactan-peptide influences root hair cell fate. New Phytol. 2020, 227, 732–743. [Google Scholar] [CrossRef]
  60. Moro, C.F.; Gaspar, M.; da Silva, F.R.; Pattathil, S.; Hahn, M.G.; Salgado, I.; Braga, M.R. S-nitrosoglutathione promotes cell wall remodelling, alters the transcriptional profile and induces root hair formation in the hairless root hair defective 6 (rhd6) mutant of Arabidopsis thaliana. New Phytol. 2017, 213, 1771–1786. [Google Scholar] [CrossRef]
  61. Lin, C.Y.; Huang, L.Y.; Chi, W.C.; Huang, T.L.; Kakimoto, T.; Tsai, C.R.; Huang, H.J. Pathways involved in vanadate-induced root hair formation in Arabidopsis. Physiol. Plant 2015, 153, 137–148. [Google Scholar] [CrossRef]
  62. Schaufelberger, M.; Galbier, F.; Herger, A.; de Brito Francisco, R.; Roffler, S.; Clement, G.; Diet, A.; Hörtensteiner, S.; Wicker, T.; Ringli, C. Mutations in the Arabidopsis ROL17/isopropylmalate synthase 1 locus alter amino acid content, modify the TOR network, and suppress the root hair cell development mutant lrx1. J. Exp. Bot. 2019, 70, 2313–2323. [Google Scholar] [CrossRef]
  63. Ingargiola, C.; Duarte, G.T.; Robaglia, C.; Leprince, A.S.; Meyer, C. The plant Target of Rapamycin: A conduc TOR of nutrition and metabolism in photosynthetic organisms. Genes 2020, 11, 1285. [Google Scholar] [CrossRef] [PubMed]
  64. Li, X.; Cai, W.; Liu, Y.; Li, H.; Fu, L.; Liu, Z.; Xu, L.; Liu, H.; Xu, T.; Xiong, Y. Differential TOR activation and cell proliferation in Arabidopsis root and shoot apexes. Proc. Natl. Acad. Sci. USA 2017, 114, 2765–2770. [Google Scholar] [CrossRef] [Green Version]
  65. Michaels, S.D.; He, Y.; Scortecci, K.C.; Amasino, R.M. Attenuation of FLOWERING LOCUS C activity as a mechanism for the evolution of summer-annual flowering behavior in Arabidopsis. Proc. Natl. Acad. Sci. USA 2003, 100, 10102–10107. [Google Scholar] [CrossRef] [PubMed] [Green Version]
  66. Finch-Savage, W.E.; Leubner-Metzger, G. Seed dormancy and the control of germination. New Phytol. 2006, 171, 501–523. [Google Scholar] [CrossRef]
  67. Penfield, S. Seed dormancy and germination. Curr. Biol. 2017, 27, R874–R878. [Google Scholar] [CrossRef] [Green Version]
  68. Pagano, A.; Araújo, S.S.; Macovei, A.; Leonetti, P.; Balestrazzi, A. The seed repair response during germination: Disclosing correlations between DNA repair, antioxidant response, and chromatin remodeling in Medicago truncatula. Front. Plant Sci. 2017, 8, 1972. [Google Scholar] [CrossRef]
  69. Pagano, A.; de Sousa Araújo, S.; Macovei, A.; Dondi, D.; Lazzaroni, S.; Balestrazzi, A. Metabolic and gene expression hallmarks of seed germination uncovered by sodium butyrate in Medicago truncatula. Plant Cell Environ. 2019, 42, 259–269. [Google Scholar] [CrossRef] [PubMed] [Green Version]
  70. Forti, C.; Ottobrino, V.; Bassolino, L.; Toppino, L.; Rotino, G.L.; Pagano, A.; Macovei, A.; Balestrazzi, A. Molecular dynamics of pre-germinative metabolism in primed eggplant (Solanum melongena L.) seeds. Hortic. Res. 2020, 7, 87. [Google Scholar] [CrossRef]
  71. Yanagawa, Y.; Sullivan, J.A.; Komatsu, S.; Gusmaroli, G.; Suzuki, G.; Yin, J.; Ishibashi, T.; Saijo, Y.; Rubio, V.; Kimura, S.; et al. Arabidopsis COP10 forms a complex with DDB1 and DET1 in vivo and enhances the activity of ubiquitin conjugating enzymes. Genes Dev. 2004, 18, 2172–2181. [Google Scholar] [CrossRef] [Green Version]
  72. Fernando, V.C.; Schroeder, D.F. Arabidopsis DDB1-CUL4 E3 ligase complexes in det1 salt/osmotic stress resistant germination. Plant Signal Behav. 2016, 11, e1223004. [Google Scholar] [CrossRef] [PubMed] [Green Version]
  73. Foyer, C.H.; Neukermans, J.; Queval, G.; Noctor, G.; Harbinson, J. Photosynthetic control of electron transport and the regulation of gene expression. J. Exp. Bot. 2012, 63, 1637–1661. [Google Scholar] [CrossRef] [PubMed] [Green Version]
  74. Yadukrishnan, P.; Datta, S. Light and abscisic acid interplay in early seedling development. New Phytol. 2021, 229, 763–769. [Google Scholar] [CrossRef]
  75. Hasanuzzaman, M.; Bhuyan, M.H.M.B.; Raza, A.; Hawrylak-Nowak, B.; Matraszek-Gawron, R.; Al Mahmud, J.; Nahar, K.; Fujita, M. Selenium in plants: Boon or bane? Environ. Exp. Bot. 2020, 178, 104170. [Google Scholar] [CrossRef]
  76. Ansari, M.W.; Tuteja, N. Post-harvest quality risks by stress/ethylene: Management to mitigate. Protoplasma 2015, 252, 121–132. [Google Scholar] [CrossRef]
  77. Zhang, X.; Yu, X.; Yue, D. Phytotoxicity of dimethyl sulfoxide (DMSO) to rice seedlings. Int. J. Environ. Sci. Technol. 2016, 13, 607–614. [Google Scholar] [CrossRef] [Green Version]
  78. Müller, F.; Ackermann, P.; Margot, P. Fungicides, Agricultural, 2. Individual Fungicides. In Ullmann’s Encyclopedia of Industrial Chemistry; Wiley-VCH: Weinheim, Germany, 2012. [Google Scholar] [CrossRef]
  79. Schneider-Poetsch, T.; Ju, J.; Eyler, D.E.; Dang, Y.; Bhat, S.; Merrick, W.C.; Green, R.; Shen, B.; Liu, J.O. Inhibition of eukaryotic translation elongation by cycloheximide and lactimidomycin. Nat. Chem. Biol. 2010, 6, 209–217. [Google Scholar] [CrossRef] [Green Version]
  80. Agarwal, M.; Singh, A.; Mittal, D.; Sahi, C.; Grover, A. Cycloheximide-mediated superinduction of genes involves both native and foreign transcripts in rice (Oryza sativa L.). Plant Physiol. Biochem. 2011, 49, 9–12. [Google Scholar] [CrossRef]
  81. Kimura, M.; Nambara, E. Stored and neosynthesized mRNA in Arabidopsis seeds: Effects of cycloheximide and controlled deterioration treatment on the resumption of transcription during imbibition. Plant Mol. Biol. 2010, 73, 119–129. [Google Scholar] [CrossRef]
  82. Jackson, P.C.; John, J.B. Effects of 2,4-dinitrophenol on membrane lipids of roots. Plant Physiol. 1982, 70, 858–862. [Google Scholar] [CrossRef] [Green Version]
  83. Lau, O.L.; Murr, D.P.; Yang, S.F. Effect of 2,4-dinitrophenol on auxin-induced ethylene production and auxin conjugation by mung bean tissue. Plant Physiol. 1974, 54, 182–185. [Google Scholar] [CrossRef] [Green Version]
  84. Hayashi, M.; Saito, Y.; Kawashima, S. Calpain activation is essential for membrane fusion of erythrocytes in the presence of exogenous Ca2+. Biochem. Biophys. Res. Commun. 1992, 182, 939–946. [Google Scholar] [CrossRef] [PubMed]
  85. Kim, M.; Ahn, J.W.; Jin, U.H.; Choi, D.; Paek, K.H.; Pai, H.S. Activation of the programmed cell death pathway by inhibition of proteasome function in plants. J. Biol. Chem. 2003, 278, 19406–19415. [Google Scholar] [CrossRef] [PubMed] [Green Version]
  86. Nakajima, Y.; Yoshida, S.; Inoue, Y.; Yoneyama, K.; Ono, T. Selective and specific degradation of the D 1 protein induced by binding of a novel Photosystem II inhibitor to the QB site. Biochim. Biophys. Acta 1995, 1230, 38–44. [Google Scholar] [CrossRef] [Green Version]
  87. Vaahtera, L.; Brosché, M.; Wrzaczek, M.; Kangasjärvi, J. Specificity in ROS signaling and transcript signatures. Antioxid. Redox Signal. 2014, 21, 1422–1441. [Google Scholar] [CrossRef] [Green Version]
  88. Karimi, M.; Hashemi, J.; Ahmadi, A.; Abbasi, A.; Pompeiano, A.; Tavarini, S.; Guglielminetti, L.; Angelini, L.G. Opposing effects of external gibberellin and daminozide on stevia growth and metabolites. Appl. Biochem. Biotechnol. 2015, 175, 780–791. [Google Scholar] [CrossRef]
  89. Zhang, T.; Li, N.; Chen, G.; Xu, J.; Ouyang, G.; Zhu, F. Stress symptoms and plant hormone-modulated defense response induced by the uptake of carbamazepine and ibuprofen in Malabar spinach (Basella alba L.). Sci. Total Environ. 2021, 793, 148628. [Google Scholar] [CrossRef]
  90. Preuss, S.B.; Britt, A.B. A DNA-damage-induced cell cycle checkpoint in Arabidopsis. Genetics 2003, 164, 323–334. [Google Scholar] [CrossRef]
  91. Yoshiyama, K.O. SOG1: A master regulator of the DNA damage response in plants. Genes Genet. Syst. 2016, 90, 209–216. [Google Scholar] [CrossRef] [Green Version]
  92. Furukawa, T.; Curtis, M.J.; Tominey, C.M.; Duong, Y.H.; Wilcox, B.W.; Aggoune, D.; Hays, J.B.; Britt, A.B. A shared DNA-damage-response pathway for induction of stem-cell death by UVB and by gamma irradiation. DNA Repair (Amst) 2010, 9, 940–948. [Google Scholar] [CrossRef]
  93. Waterworth, W.M.; Latham, R.; Wang, D.; Alsharif, M.; West, C.E. Seed DNA damage responses promote germination and growth in Arabidopsis thaliana. Proc. Natl. Acad. Sci. USA 2022, 119, e2202172119. [Google Scholar] [CrossRef] [PubMed]
  94. Pedroza-Garcia, J.A.; Xiang, Y.; De Veylder, L. Cell cycle checkpoint control in response to DNA damage by environmental stresses. Plant J. 2022, 109, 490–507. [Google Scholar] [CrossRef] [PubMed]
Figure 1. Heatmap representation of TDP1α and TDP1β gene expression obtained for (a) developmental map, (b) developmental mutant, and (c) natural variant ecotype collections.
Genes 14 00884 g001
Figure 2. Heatmap representation of TDP1α and TDP1β gene expression during hormone treatments (a) in seeds during the early phases of germination and (b) in 7-day-old A. thaliana seedlings. (c) TDP1 gene expression patterns in response to hormone inhibitors.
Genes 14 00884 g002
Figure 3. Heatmap representation of TDP1α and TDP1β gene expression during different light series. (a) 7-day-old seedlings under continuous light with temperature cycles and 12 h light–dark cycle with concomitant temperature cycle. (b) Seedlings under long-day and short-day conditions. (c) Leaves of 35-day- and 29-day-old plants grown in soil under 12 h light–dark cycle, no temperature cycle.
Genes 14 00884 g003
Figure 4. Heatmap representation of TDP1α and TDP1β gene expression in (a) roots and shoots of A. thaliana plants subjected to different stress conditions and monitored at several time intervals, (b) drought stress, (c) selenate treatment, and (d) biotic stresses.
Genes 14 00884 g004
Figure 5. Heatmap representation of TDP1α and TDP1β gene expression in response to (a) different chemical treatments, and (b) gamma-rays in Col-0 wild-type and (c) sog1-1 mutants.
Genes 14 00884 g005
Figure 6. Effect of γ-ray (IR) treatments on 10-day-old Arabidopsis seedlings from Col0 and sog1 mutant. (a) Levels of DNA damage as evidenced by comet assay and represented as arbitrary units (a.u.). (b) Levels of cell mortality as evidenced by diffusion assay and represented as arbitrary units (a.u.). (c) Percentage (%) of nuclei morphology corresponding to viable cells, programmed cell death (PCD), and necrosis events. (d) TDP1α and TDP1β relative gene expression at different intervals (0 h, 30 min, 3, 6, 12 h) as measured through qRT-PCR. (e) Gene expression data represented as fold change (FC) relative to non-irradiated control (CTRL) for each genotype. Values are expressed as mean ± SD of three replicates. Statistical significance (p < 0.05) is shown with an asterisk (*).
Genes 14 00884 g006
Figure 7. Schematic representation of the roles of the TDP1α and TDP1β genes in A. thaliana hypothesized based on transcriptomics data mining approaches.
Genes 14 00884 g007
Disclaimer/Publisher’s Note: The statements, opinions and data contained in all publications are solely those of the individual author(s) and contributor(s) and not of MDPI and/or the editor(s). MDPI and/or the editor(s) disclaim responsibility for any injury to people or property resulting from any ideas, methods, instructions or products referred to in the content.

