Article

DNA Barcoding, Phylogenetic Analysis and Secondary Structure Predictions of Nepenthes ampullaria, Nepenthes gracilis and Nepenthes rafflesiana

1
Department of Biosciences, Faculty of Science, Universiti Teknologi Malaysia, Johor Bahru 81310, Johor, Malaysia
2
Media and Games Innovation Centre, Universiti Teknologi Malaysia, Johor Bahru 81310, Johor, Malaysia
3
Borneo Medical and Health Research Center, Faculty of Medicine and Health Sciences, Universiti Malaysia Sabah, Kota Kinabalu 88400, Sabah, Malaysia
4
Faculty of Applied Sciences & Technology, Universiti Tun Hussein Onn Malaysia (UTHM), Hab Pendidikan Tinggi Pagoh, KM1, Jalan Panchor, Muar 84600, Johor, Malaysia
5
College of Forestry and Natural Resources, University of the Philippines Los Banos College, Los Baños 4031, Laguna, Philippines
*
Author to whom correspondence should be addressed.
Genes 2023, 14(3), 697; https://doi.org/10.3390/genes14030697
Submission received: 7 February 2023 / Revised: 2 March 2023 / Accepted: 9 March 2023 / Published: 11 March 2023
(This article belongs to the Special Issue Phylogenetics, Genetics, and Breeding of Medicinal Plants)

Abstract

:
Nepentheceae, the most prominent carnivorous family in the Caryophyllales order, comprises the Nepenthes genus, which has modified leaf trap characteristics. Although most Nepenthes species have unique morphologies, their vegetative stages are identical, making identification based on morphology difficult. DNA barcoding is seen as a potential tool for plant identification, with small DNA segments amplified for species identification. In this study, three barcode loci; ribulose-bisphosphate carboxylase (rbcL), intergenic spacer 1 (ITS1) and intergenic spacer 2 (ITS2) and the usefulness of the ITS1 and ITS2 secondary structure for the molecular identification of Nepenthes species were investigated. An analysis of barcodes was conducted using BLASTn, pairwise genetic distance and diversity, followed by secondary structure prediction. The findings reveal that PCR and sequencing were both 100% successful. The present study showed the successful amplification of all targeted DNA barcodes at different sizes. Among the three barcodes, rbcL was the least efficient as a DNA barcode compared to ITS1 and ITS2. The ITS1 nucleotide analysis revealed that the ITS1 barcode had more variations compared to ITS2. The mean genetic distance (K2P) between them was higher for interspecies compared to intraspecies. The results showed that the DNA barcoding gap existed among Nepenthes species, and differences in the secondary structure distinguish the Nepenthes. The secondary structure generated in this study was found to successfully discriminate between the Nepenthes species, leading to enhanced resolutions.

1. Introduction

Among the pitcher plants, the Nepentheceae family is the largest, with 120 species that produce specialized cup-shaped pitchers that attract small insects and kill them through digestive enzymes [1]. In Malaysia, there are eleven species of Nepenthes known to exist, including Nepenthes gracillis, Nepenthes ampullaria and Nepenthes rafflesiana [2,3]. According to previous reports, taxonomic classification of Nepenthes has been based on morphological characteristics such as shape, color, size and ornamentation [1,2,4,5,6,7]. Although this is common for Nepenthes, it frequently causes confusion because of characters that can be hard to find [8]. For example, taxonomic confusion in Nepenthes has been reported when N. pilosa was confused with N. chaniana, N. talangensis with N. bongso, and N. lamii with N. vieillardii [3,7]. Human interest in Nepenthes extends beyond these plants’ decorative nature to their therapeutic benefits, in addition to their uniqueness and beauty. The Nepenthes plant has traditionally been employed in traditional medicine to control the menstrual cycle, facilitate childbirth, reduce asthma, cure eye inflammation, and treat stomach ulcers, jaundice, high blood pressure, indigestion, and dysentery, and has been used as an astringent [4,9,10,11]. The “Jakun” community believes that the decoction of N. ampullaria can ease asthma attacks, while the stem can treat malaria [12,13]. Other pitcher plants have also been used in traditional delicacies [14]. Due to their purported health benefits, various studies have revealed the therapeutic value of plants employed in traditional herbal therapy.
Since their development, DNA barcodes have been viewed as the most promising approach to resolving this taxonomic issue [15]. Previous simulation studies for Nepenthes species using NCBI GenBank collection data showed that a single locus ITS or one coupled with plastid regions (matK) exhibited the best species discrimination with distinct barcoding gaps [16]. According to the previous literature, trnL and ITS DNA barcodes can be used to distinguish between the Nepenthes species based on their geographical origin area [17]. Meanwhile, other studies concluded that RNA secondary structure prediction is an advanced tool for species discrimination [18], and the integration of secondary structure information in species identification can significantly improve its accuracy for other plant species [18,19,20]. However, there are not many reports on how ITS1 and ITS2 secondary structure predictions can be used together to differentiate between species. In our study, we aimed to investigate the efficacy of rbcL, ITS2 and ITS1 DNA barcodes in combination with ITS1 and ITS2 secondary structure predictions in distinguishing between three Nepenthes species.

2. Materials and Methods

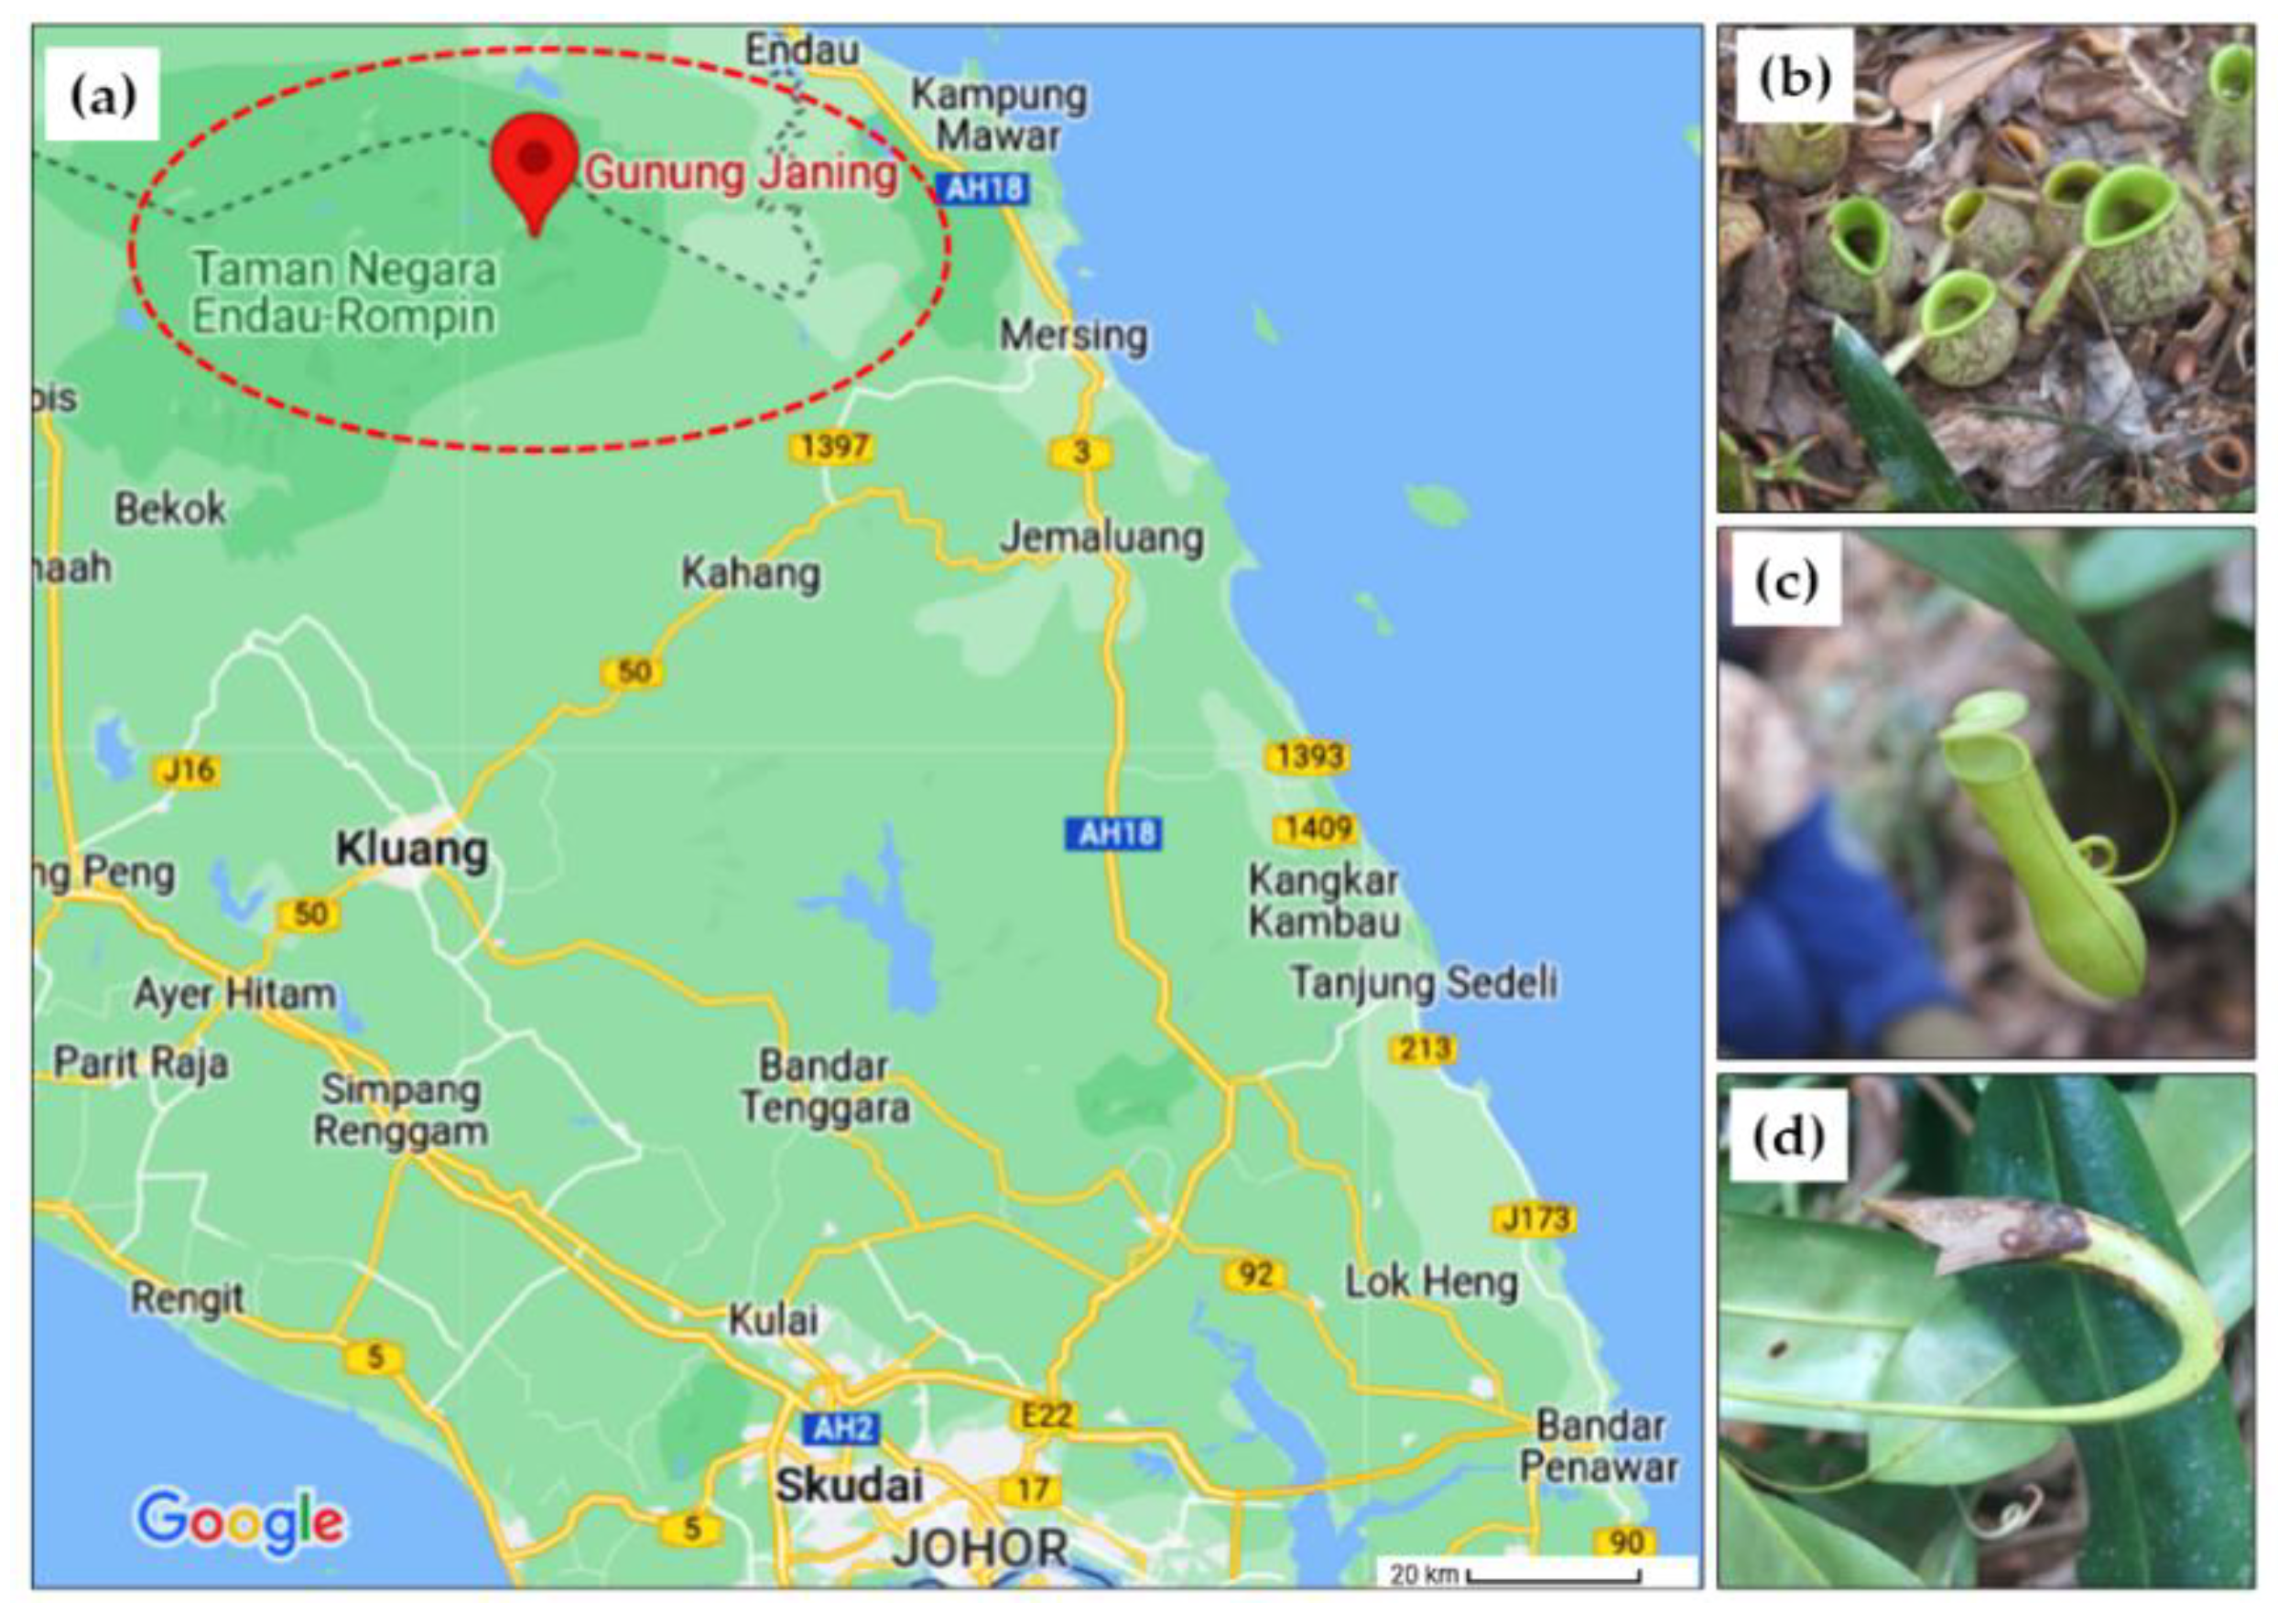
2.1. Sample Collection

The three Nepenthes species used in this study (N. ampullaria, N. gracilis and N. rafflesiana) were collected from a sampling trip in Gunung Janing, Kampung Peta, Endau-Rompin National Park, Johor, Malaysia (GPS location; 2.529908870220549, 103.41185691378324), and identified by Assoc Prof. Dr Alona Cuevas Linatoc. The geographical location from which the three Nepenthes samples were collected is presented in Figure 1. The collected Nepenthes species were wrapped with aluminum foil and kept in an ice box prior to extraction at the laboratory. The plant samples were cut and kept at −80 °C prior to extraction with designated labels of NA, NR and NG for N. ampullaria, N. rafflesiana and N. gracilis, respectively.

2.2. Genomic DNA Extraction and PCR Amplification

For genomic DNA extraction, frozen plant samples were first thawed before proceeding with the extraction using the commercial kit NucleoSpin Plant II (Macherey-Nagel, Duren, Germany), following the manufacturer’s instructions. Approximately 100 mg of the plant sample was ground with liquid nitrogen to produce a fine powder using mortar and pestle. The plant samples were subjected to isolation steps as detailed in the protocol. Then the genomic DNA (gDNA) obtained was quantified using a Nanodrop machine (Eppendorf, Hamburg, Germany) and checked using 1% (w/v) agarose gel electrophoresis. The integrity and quality of the gDNA obtained was verified with a Gel Documentation System (BioRad). Then, the good quality gDNAwas used as a DNA template for PCR amplification. The PCRs for rbcL, ITS1 and ITS2 were conducted separately in 25 µL of the total reaction volume containing 12.5 µL of 2X PrimeSTAR® Max DNA Polymerase, 10 ng of gDNA for N. gracilis, N. ampullaria and N. rafflesiana, 0.625 µM of each primer set and topped up with sterile nano-pure water. The PCR was conducted using the Mastercycler® nexus gradient (Eppendorf AG, Hamburg, Germany) through three different PCR profiles according to the DNA barcodes (Table 1). The PCR products were visualized on 2% (w/v) agarose gel electrophoresis in 1X TAE buffer and later sent for sequencing using Sanger sequencing at Apical Scientific Sdn. Bhd. Sequencing was performed for both the forward and reverse directions using the same primers as those used in PCR. The details of the primers are shown in Table 2.

2.3. Bioinformatics Analysis and Phylogenetic Tree

The forward and reverse sequences of the amplicon obtained from rbcL, ITS1 and ITS2 primers were edited using BioEdit software. Each generated consensus sequence of the forward and reverse sequences was submitted to the Basic Local Alignment Search Tool (BLAST) of the National Centre for Biotechnology Information (NCBI) for a homology search (https://blast.ncbi.nlm.nih.gov/Blast.cgi; accessed on 24 December 2022). The GenBank accession number for the generated barcode sequences were obtained after the sequences were submitted to GenBank via BankIt for rbcL, (https://submit.ncbi.nlm.nih.gov/about/bankit/; accessed on 24 December 2022) and the submission portal of NCBI for ITS1 and ITS2 (https://submit.ncbi.nlm.nih.gov/about/genbank/; accessed on 24 December 2022).
The BLASTn results were selected by determining the sequences with the maximum similarity score and lowest E value. The generated sequence of each barcode in the present study and its similarity was recorded as a percentage. Multiple sequence alignment was performed using Jalview v2.11.1.0 with all the obtained sequences. The phylogenetic analysis was performed following the neighbor-joining (NJ) tree and minimum evolution method with the 1000 “Boostrap phylogeny” test method using MEGAX software. The DNA best-fit substitution model for each dataset (Table 3) was determined prior to the NJ tree construction using MEGAX [23]. An outlier, Dionaea muscipula (accession number: AB072558.1), was selected in the NJ analysis to verify the identification of the three Nepenthes under study. Sequence divergences were calculated using the Kimura-2-parameter (K2P) distance model [24]. The calculation of the sequence divergences was implemented in MEGAX [23]. From the sequence divergence data, the extent of DNA barcoding gap/overlap was then explored as is typical for barcoding studies [25].

2.4. Secondary Structure Predictions

The DNA barcodes of the three Nepenthes were generated using a Bio-Rad DNA barcode generator (http://biorad-ads.com/DNABarcodeWeb/; accessed on 28 November 2022). To complement the tree-based methods, RNA secondary structure predictions were performed using the nucleotide sequences from ITS1 and ITS2 primers for the identification of the best potential barcodes using the rRNA database RNAfold WebServer v2.4.18 (http://rna.tbi.univie.ac.at//cgi-bin/RNAWebSuite/RNAfold.cgi; accessed on 28 November 2022). The results of RNA secondary prediction enhanced the resolution of the DNA barcodes.

3. Results

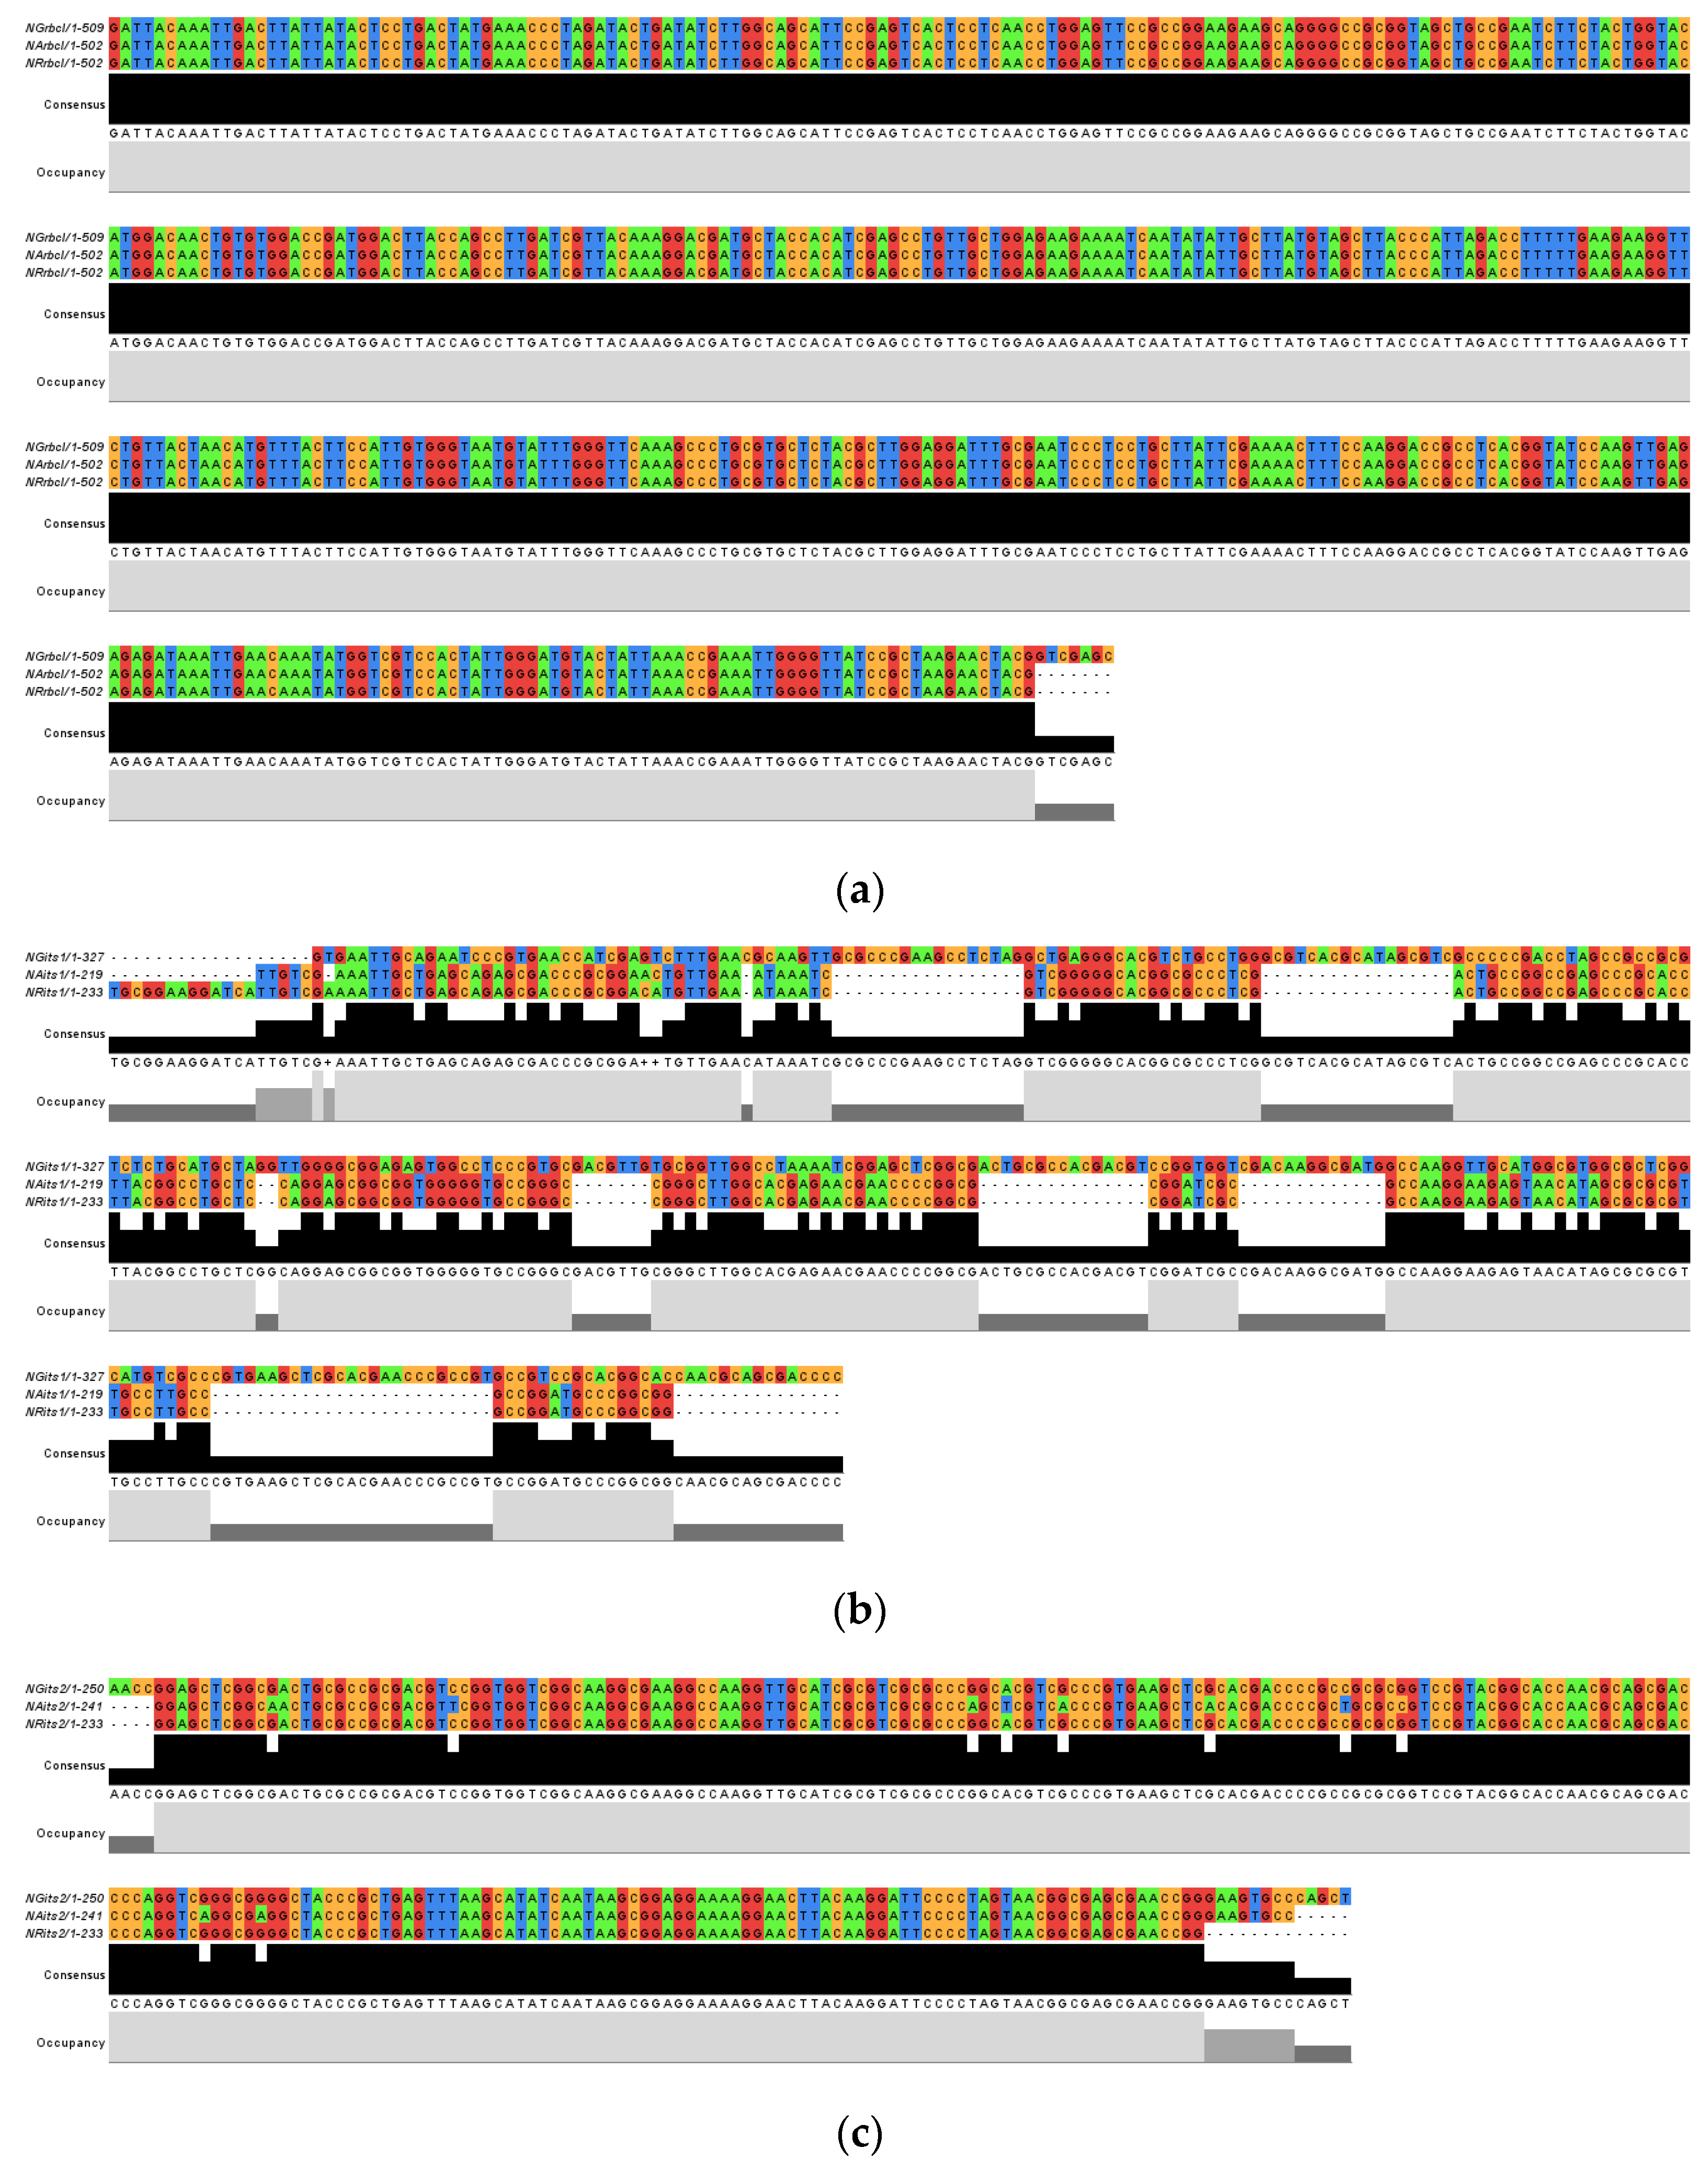
3.1. Amplification, Sequencing, Multiple Sequence Alignment and Species Identification

The DNA barcode primers, rbcL, ITS1 and ITS2, produced amplicons of 599 bp, 300–400 bp and 300–500 bp, respectively. In analyzing the sequences, rbcL was found to exhibit the most extensive sequence length (502–509 bp), followed by ITS1 (219–327 bp) and ITS2 (241–250 bp). All the sequences were submitted to GenBank, and the accession numbers were obtained. The top BLASTn score for the species identification of all three Nepenthes species is presented in Table 4. Using the BLASTn tool, the three Nepenthes species were identified as different Nepenthes species at different barcode regions of rbcL, ITS1 and ITS2. In the BLAST search, rbcL and ITS2 genes identified all three Nepenthes species as N. mirabilis and N. gracilis, respectively. However, the barcode did not discriminate between the three Nepenthes species. Meanwhile, the ITS1 barcode identified the specimen NGits1 as N. ventricosa, while the specimens NAits1 and NRits1 were identified as Nepenthes x intermedia.
Multiple sequence alignment (MSA) of the DNA barcode sequences (Figure 2) was used to determine that rbcL had the largest alignment, followed by ITS1 and ITS2 (Figure 2a). The alignment obtained for rbcL showed the highest similarities (100%) among the three Nepenthes species, whereas ITS2 showed a slight difference in N. ampullaria, (NAits2) with a ten-nucleotide difference between N. gracillis (NGits2) and N. rafflesiana (NRits2) (Figure 2c) at nucleotides 15, 31, 77, 80, 85, 98, 110, 115, 149 and 154. In contrast, ITS1 showed the highest difference between the three Nepenthes species (Figure 2b) based on the length and nucleotide composition of each sequence. Indisputably, among the three ITS1 sequences, NGits1 showed the highest variation followed by NAits1 and NRits1. Variation between NAits1 and NRits1 were based on the difference in sequence length, as NRits1 is fourteen nucleotides longer than NAits1 with a two-base difference at nucleotides 44 and 73. This corresponds with the ATGC percentage of the sequences showing that rbcL had the lowest GC content (44.6–45%), followed by ITS2 (63.1–66.5%) and ITS1 (66.1 to 68.5%) (Table 5). Nucleotide composition analysis also allowed us to conclude that sequences amplified using the rbcL barcode have the least variability since the AT and GC percentages were almost the same. Meanwhile, both ITS1 and ITS2 sequences show variations in AT and GC content, indicating more variability.
All the sequences generated from the amplification of rbcL, ITS1 and ITS2 barcodes were successfully deposited into the GenBank database. The accession number for each barcode is as follows: rbcL: OP534746 (N. ampullaria), OP534747 (N. rafflesiana), OP534748 (N. gracilis); ITS1: OQ123732 (N. ampullaria), OQ123724 (N. rafflesiana), OQ123725 (N. gracilis); and ITS2: OQ123720 (N. ampullaria), OQ123721 (N. rafflesiana), OQ123722 (N. gracilis).

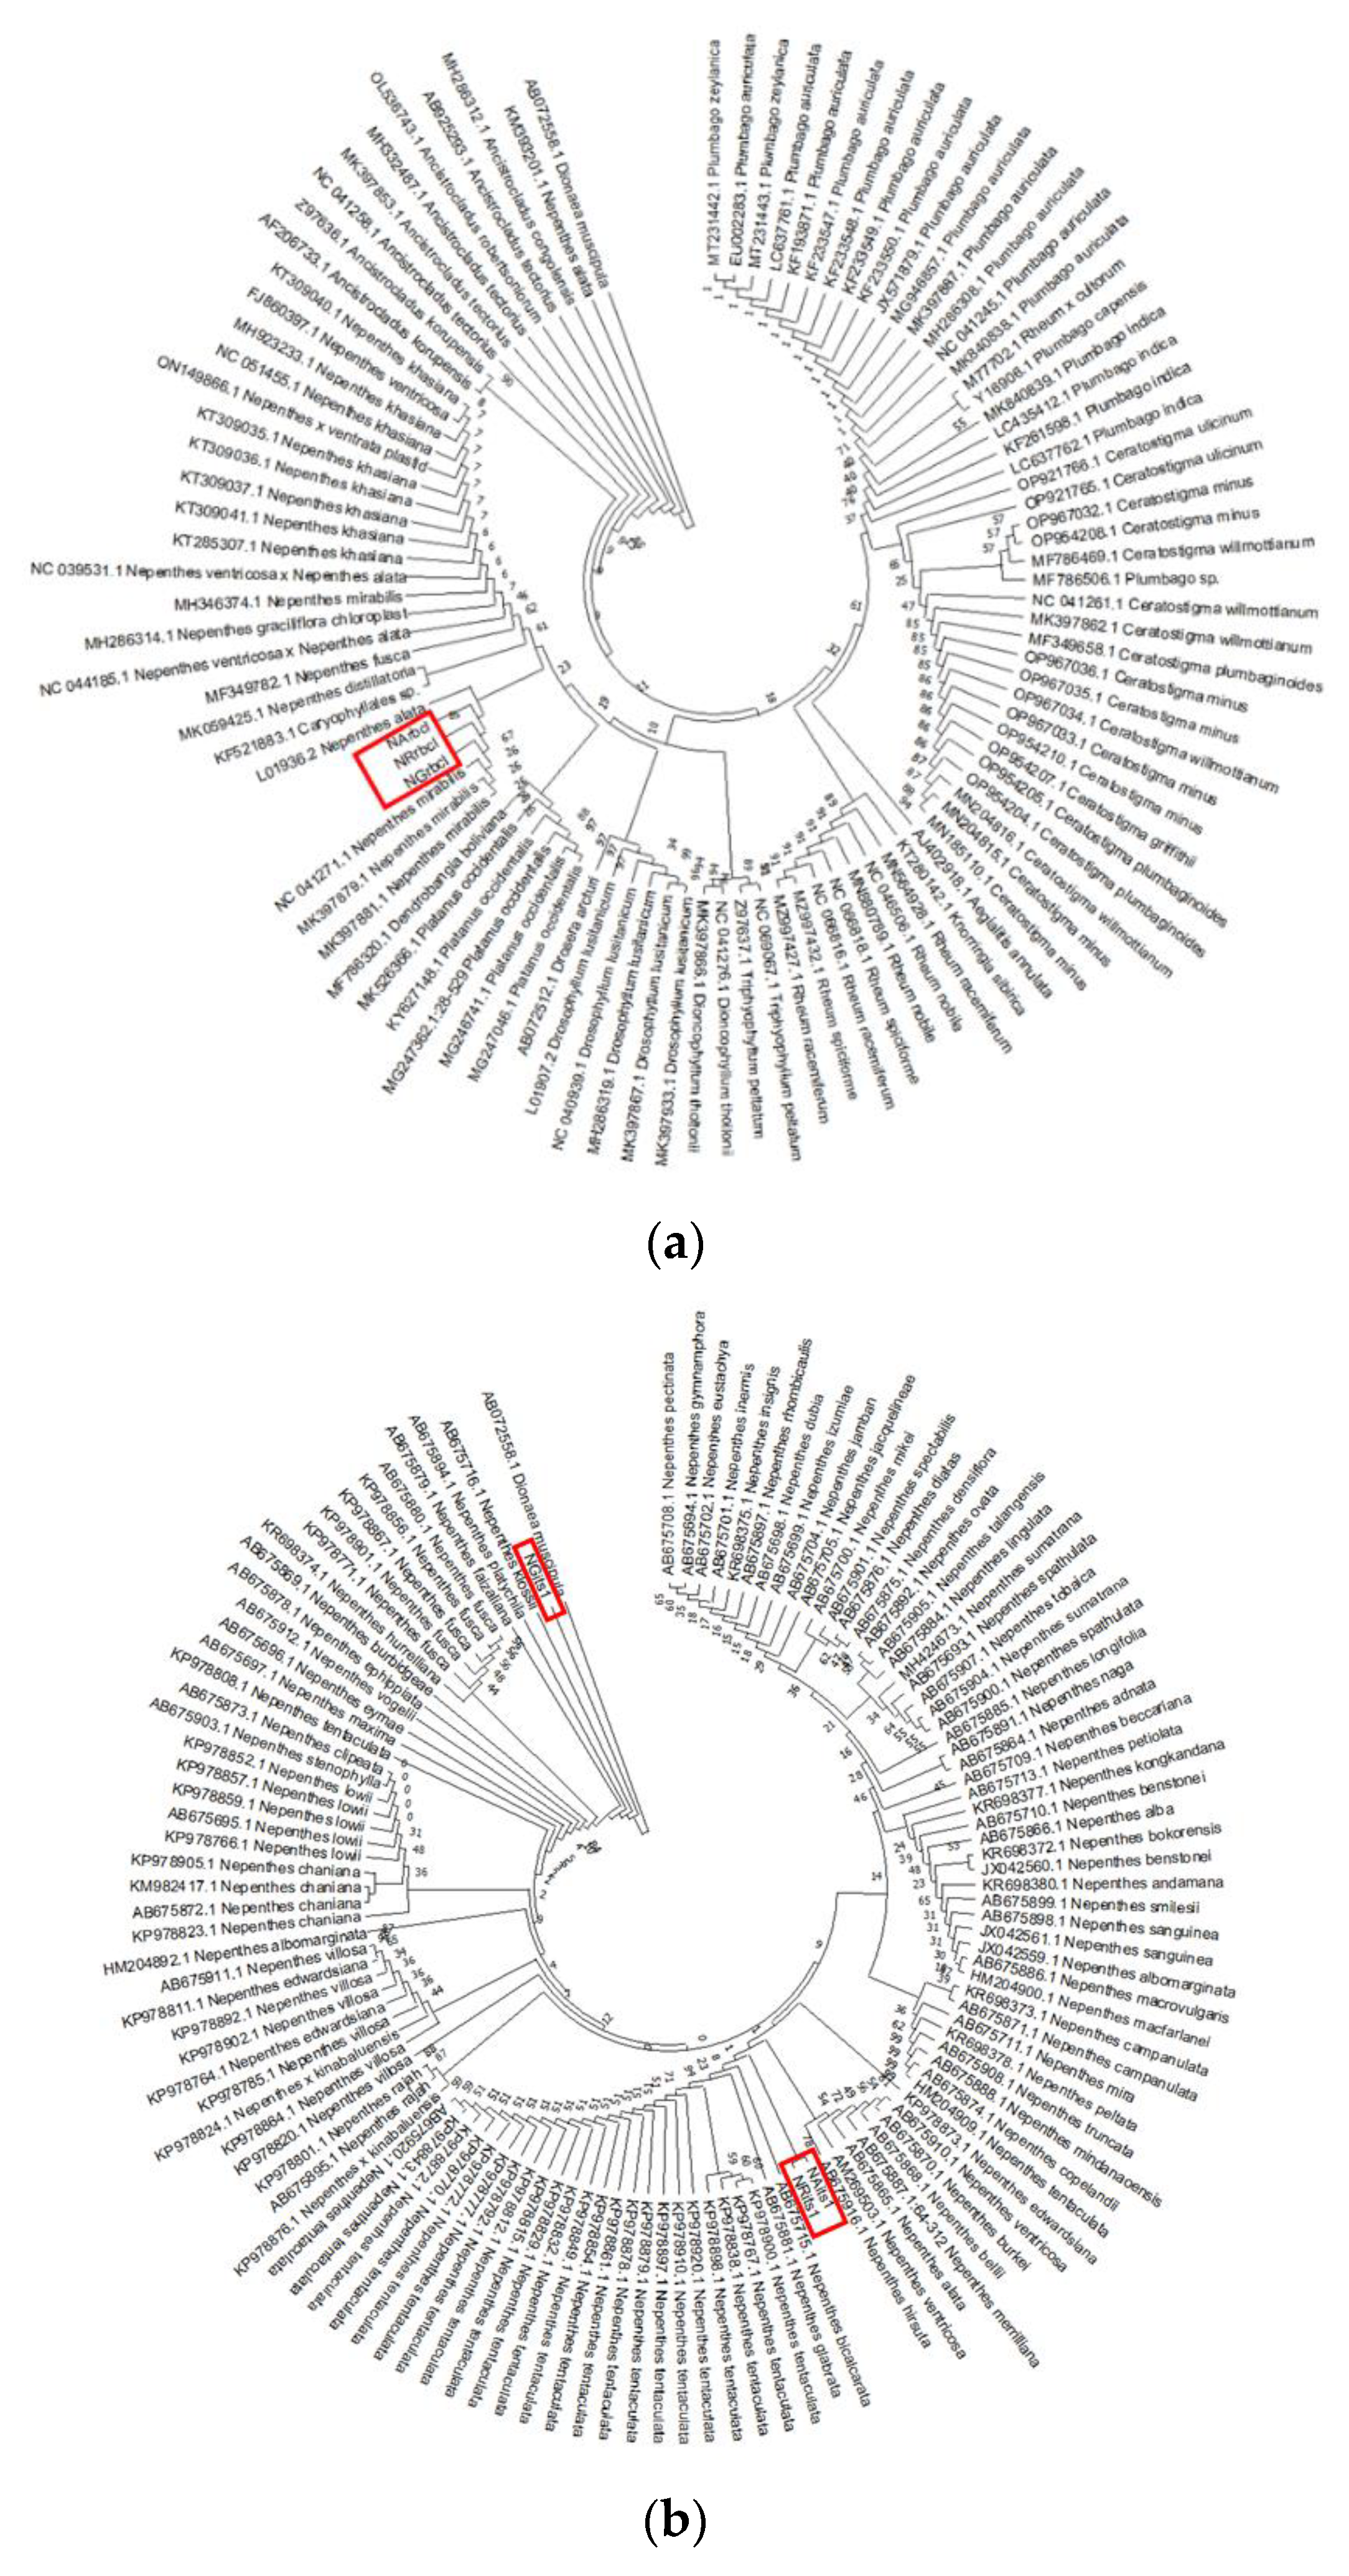
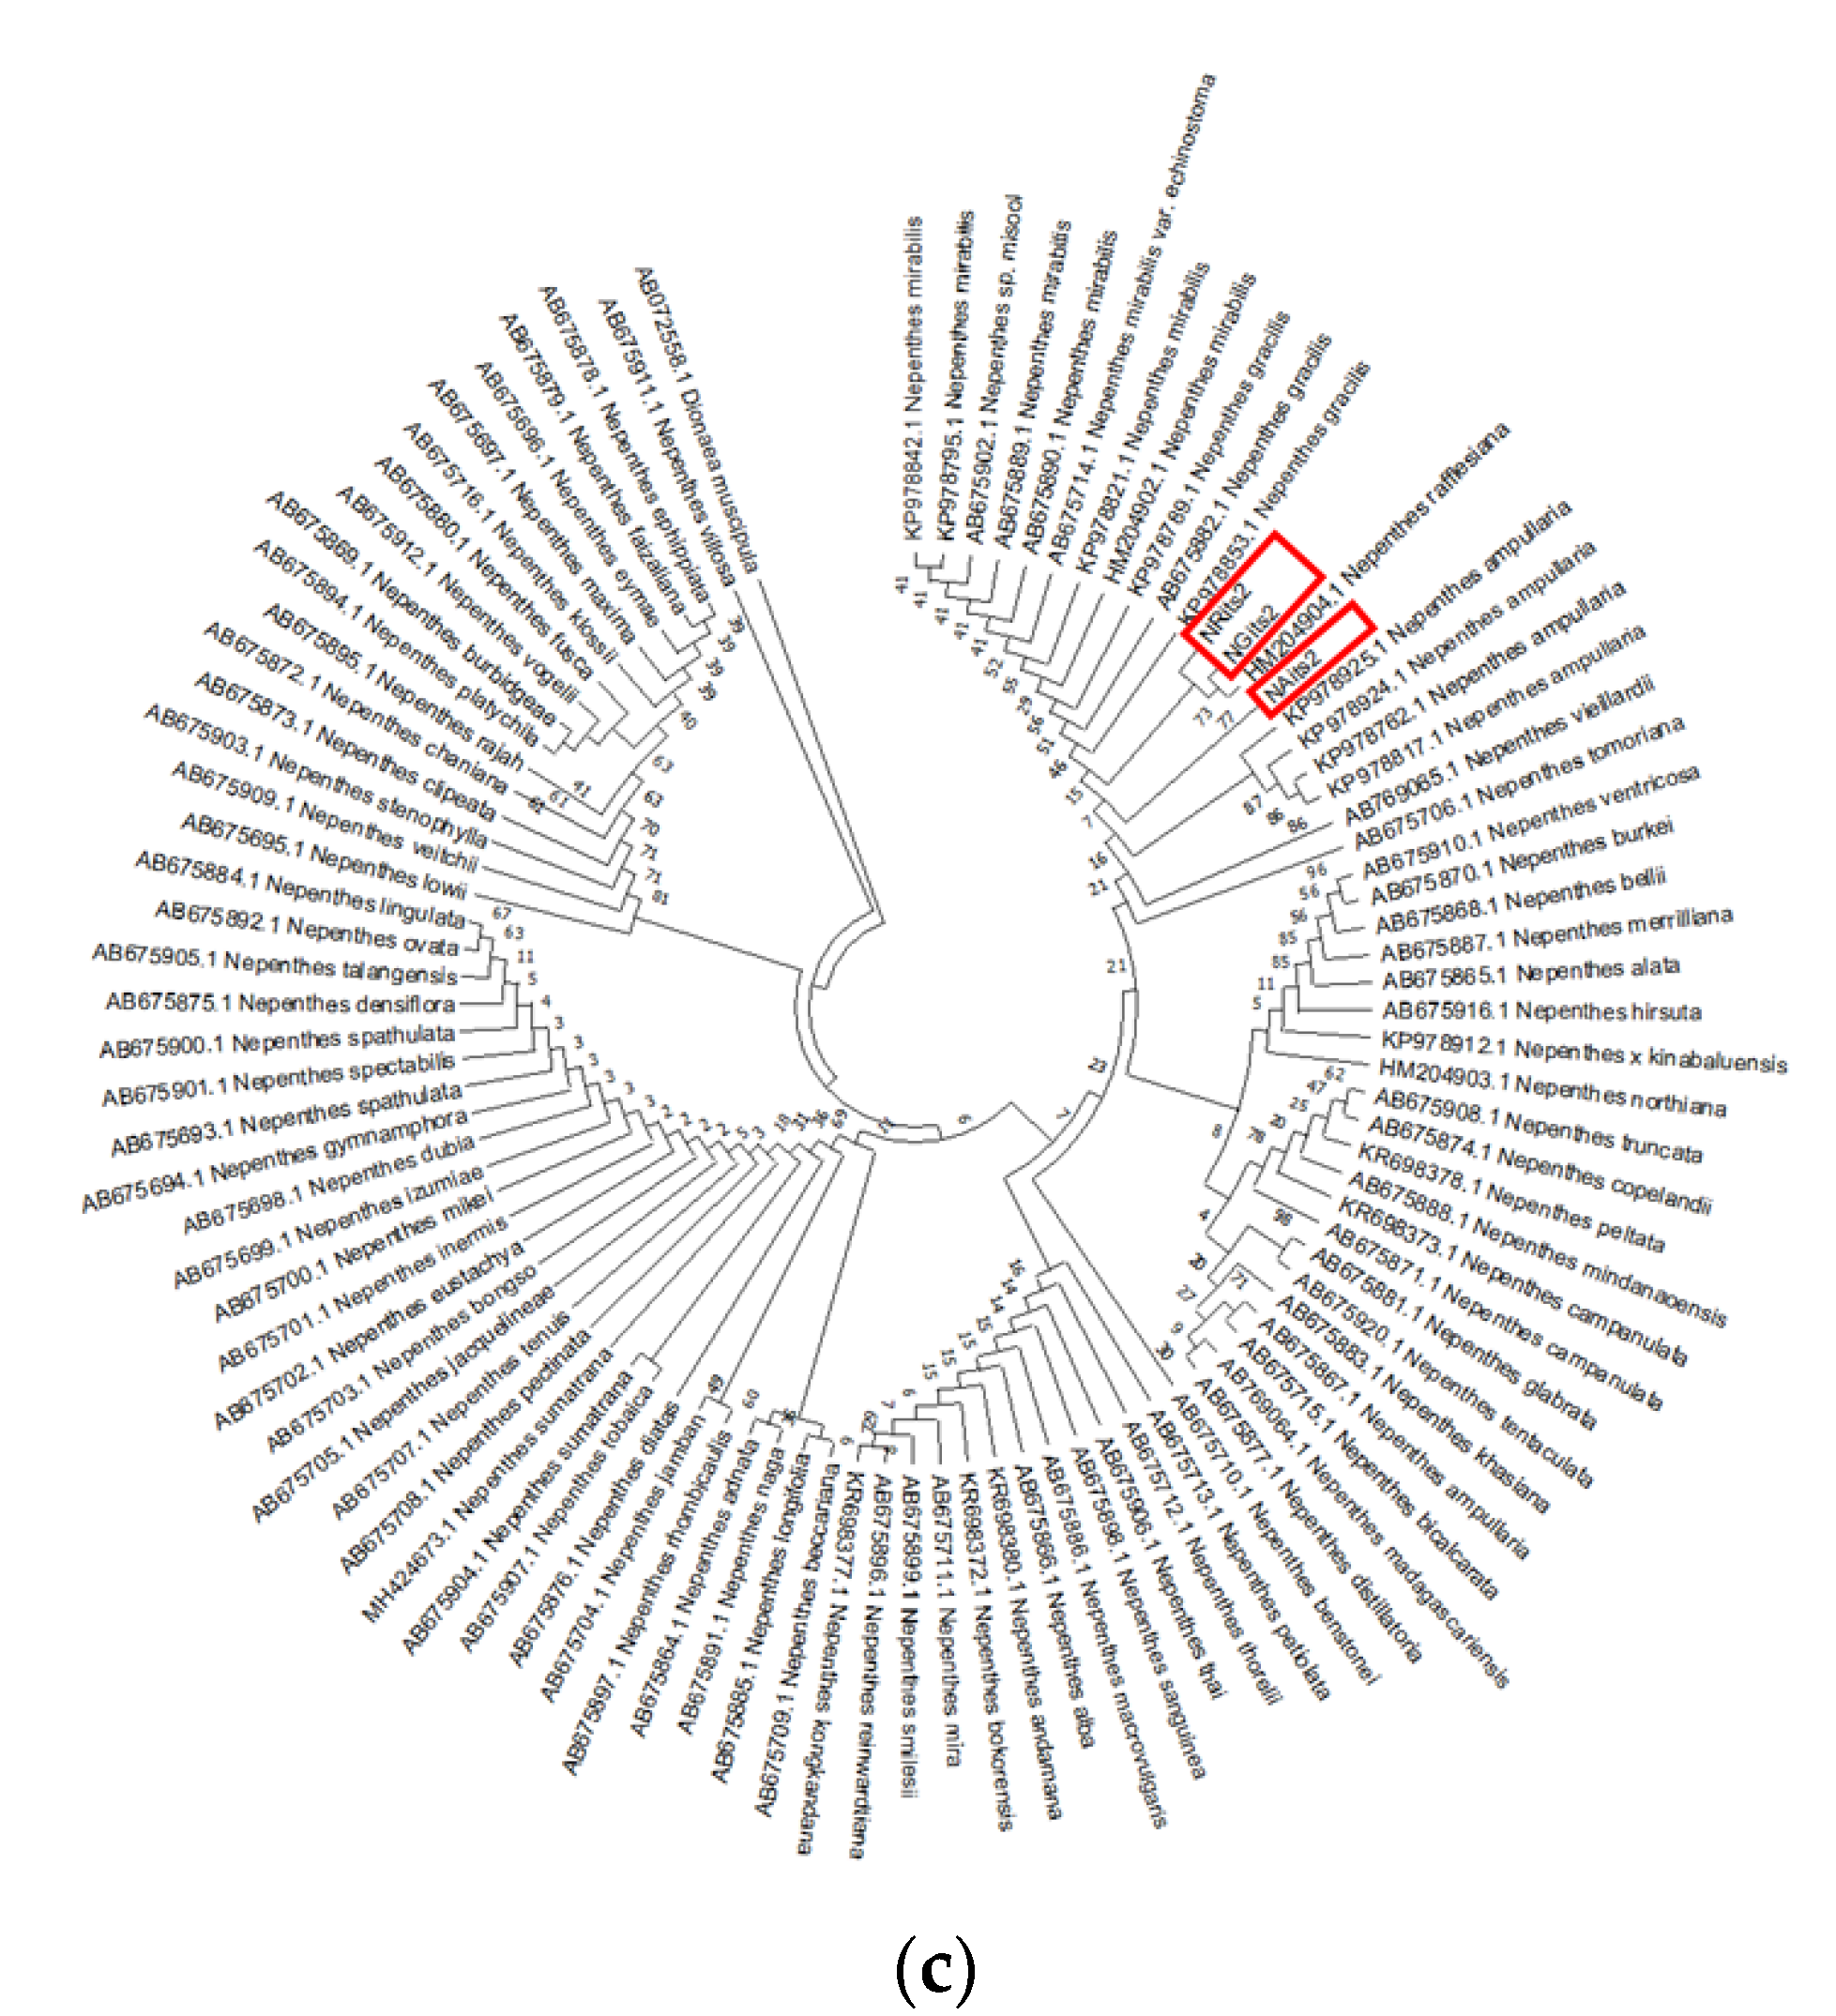
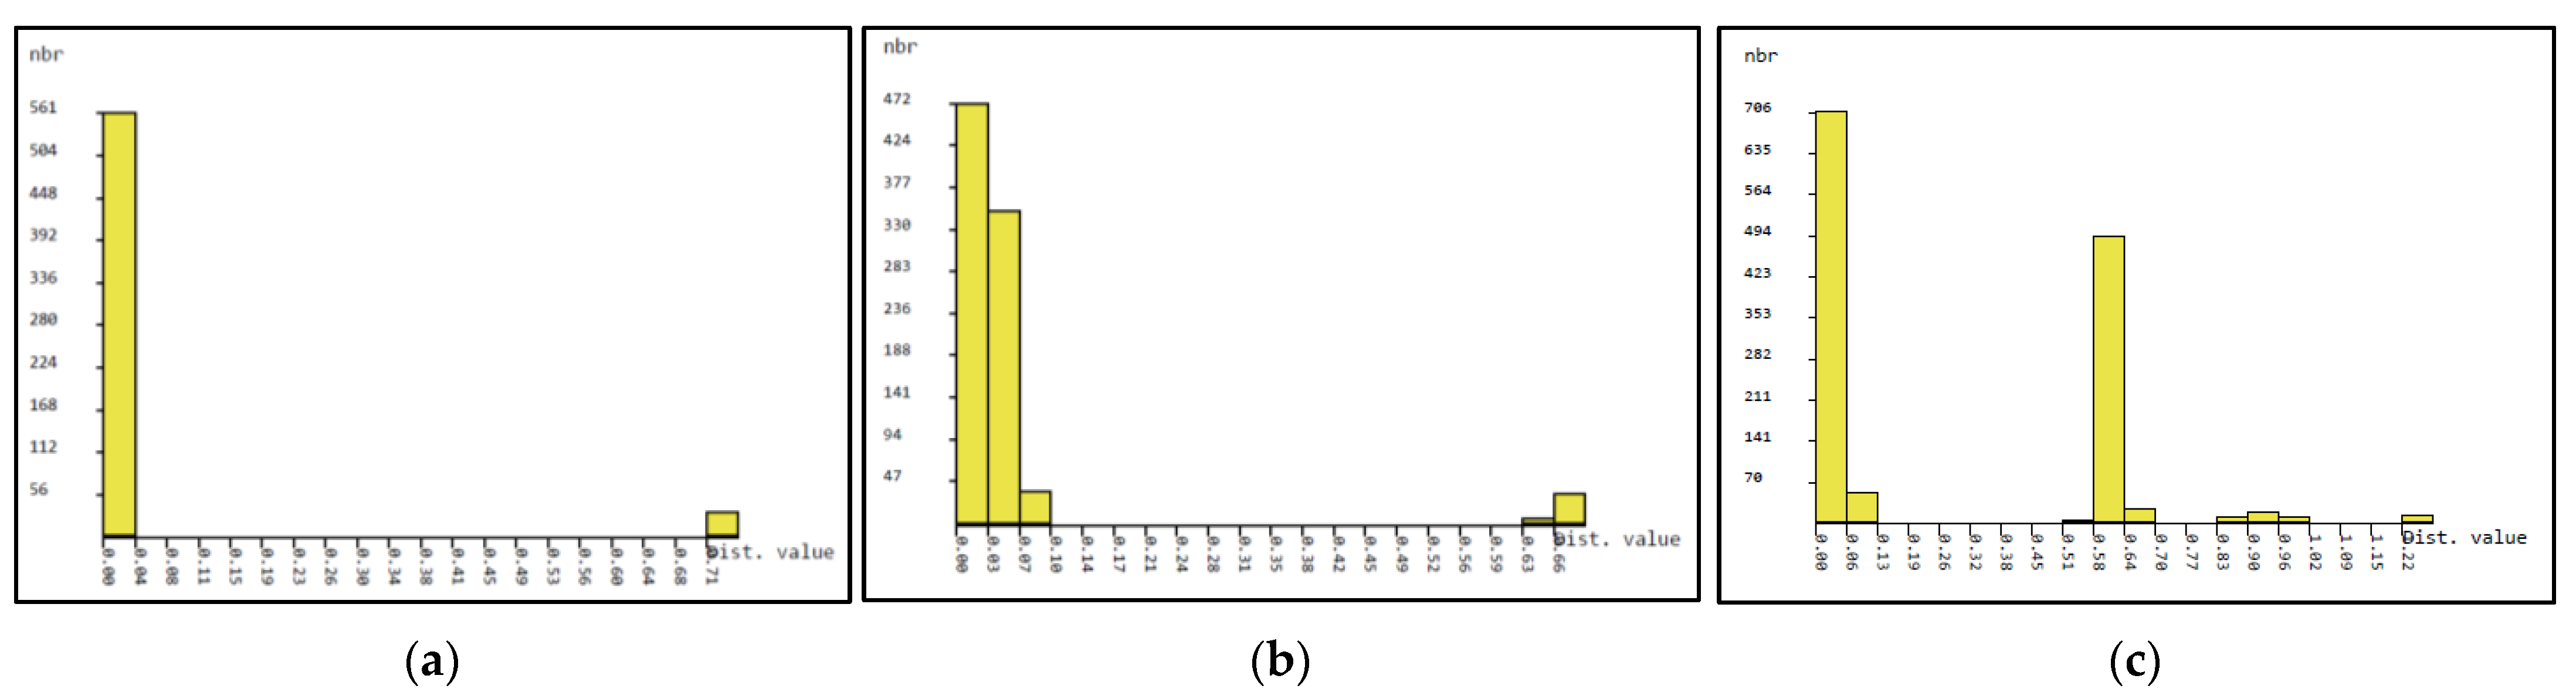
3.2. Phylogenetic Studies, Intraspecific Variation, Interspecific Divergence and DNA Barcoding Gap

Phylogenetic analysis using an NJ tree in the respective DNA best-fit substitution model, as shown in Table 3 with bootstrap-1000 of the three Nepenthes species, showed a high similarity in the BLAST search to the available sequences in the NCBI database (Figure 3). Although there was no significant variation between the generated barcode sequences from the three Nepenthes species when observed through multiple sequence alignment, phylogenetic analysis revealed further differences between the three Nepenthes under study (NA, NR and NG), especially when ITS1 and ITS2 were considered. The NJ tree of rbcL showed that the three species studied were in the same clade as the other species, N. mirabilis and N. alata (Figure 3a), with the same node scores of 26% for N. gracilis, N. ampullaria and N. rafflesiana, respectively. Meanwhile, NJ analysis of ITS1 sequences showed that the three species studied could be classified into different clades; NAits1 is in a clade with NRits1 with a node score of 78%, while NG was classified into an individual clade (Figure 3b). Further phylogenetic characterization using ITS2 revealed that NRits2 and NGits2 are related to N. rafflesiana (accession number: HM204904.1) since they were grouped into the same clade with node scores of 73% and 77%, respectively (Figure 3c). The NAits2 appeared individually at a clade near NRits2, NGits2 and a clade of another N. ampullaria species.
Previous reports on the intraspecific and interspecific divergence among species are useful for assessing the potential of DNA barcodes [25,26,27]. Based on the neighbor-joining (NJ) tree of K2P distances, taxa or groups were organized to calculate the intraspecific variations and interspecific divergences among them. The Nepenthes species under study showed unique clades and within-species sequence divergence between 0 and 4% in rbcL, 0 and 5.9% in ITS2, and 0 and 26.9% in ITS1, whereas divergence between species ranged from 0 to 1% in rbcL, 1 to 8% in ITS2, and 1.5 to 44% in ITS1 (Figure 4a–c). The results indicate that the interspecific divergence was distinctly higher for the interspecific divergence distance for ITS2 and ITS1, and that, consequently, a clear DNA barcode gap was present (Figure 4b,c). In addition, the results obtained with ABGD analysis are consistent with the results obtained with MEGAX, evidencing DNA barcode gaps.

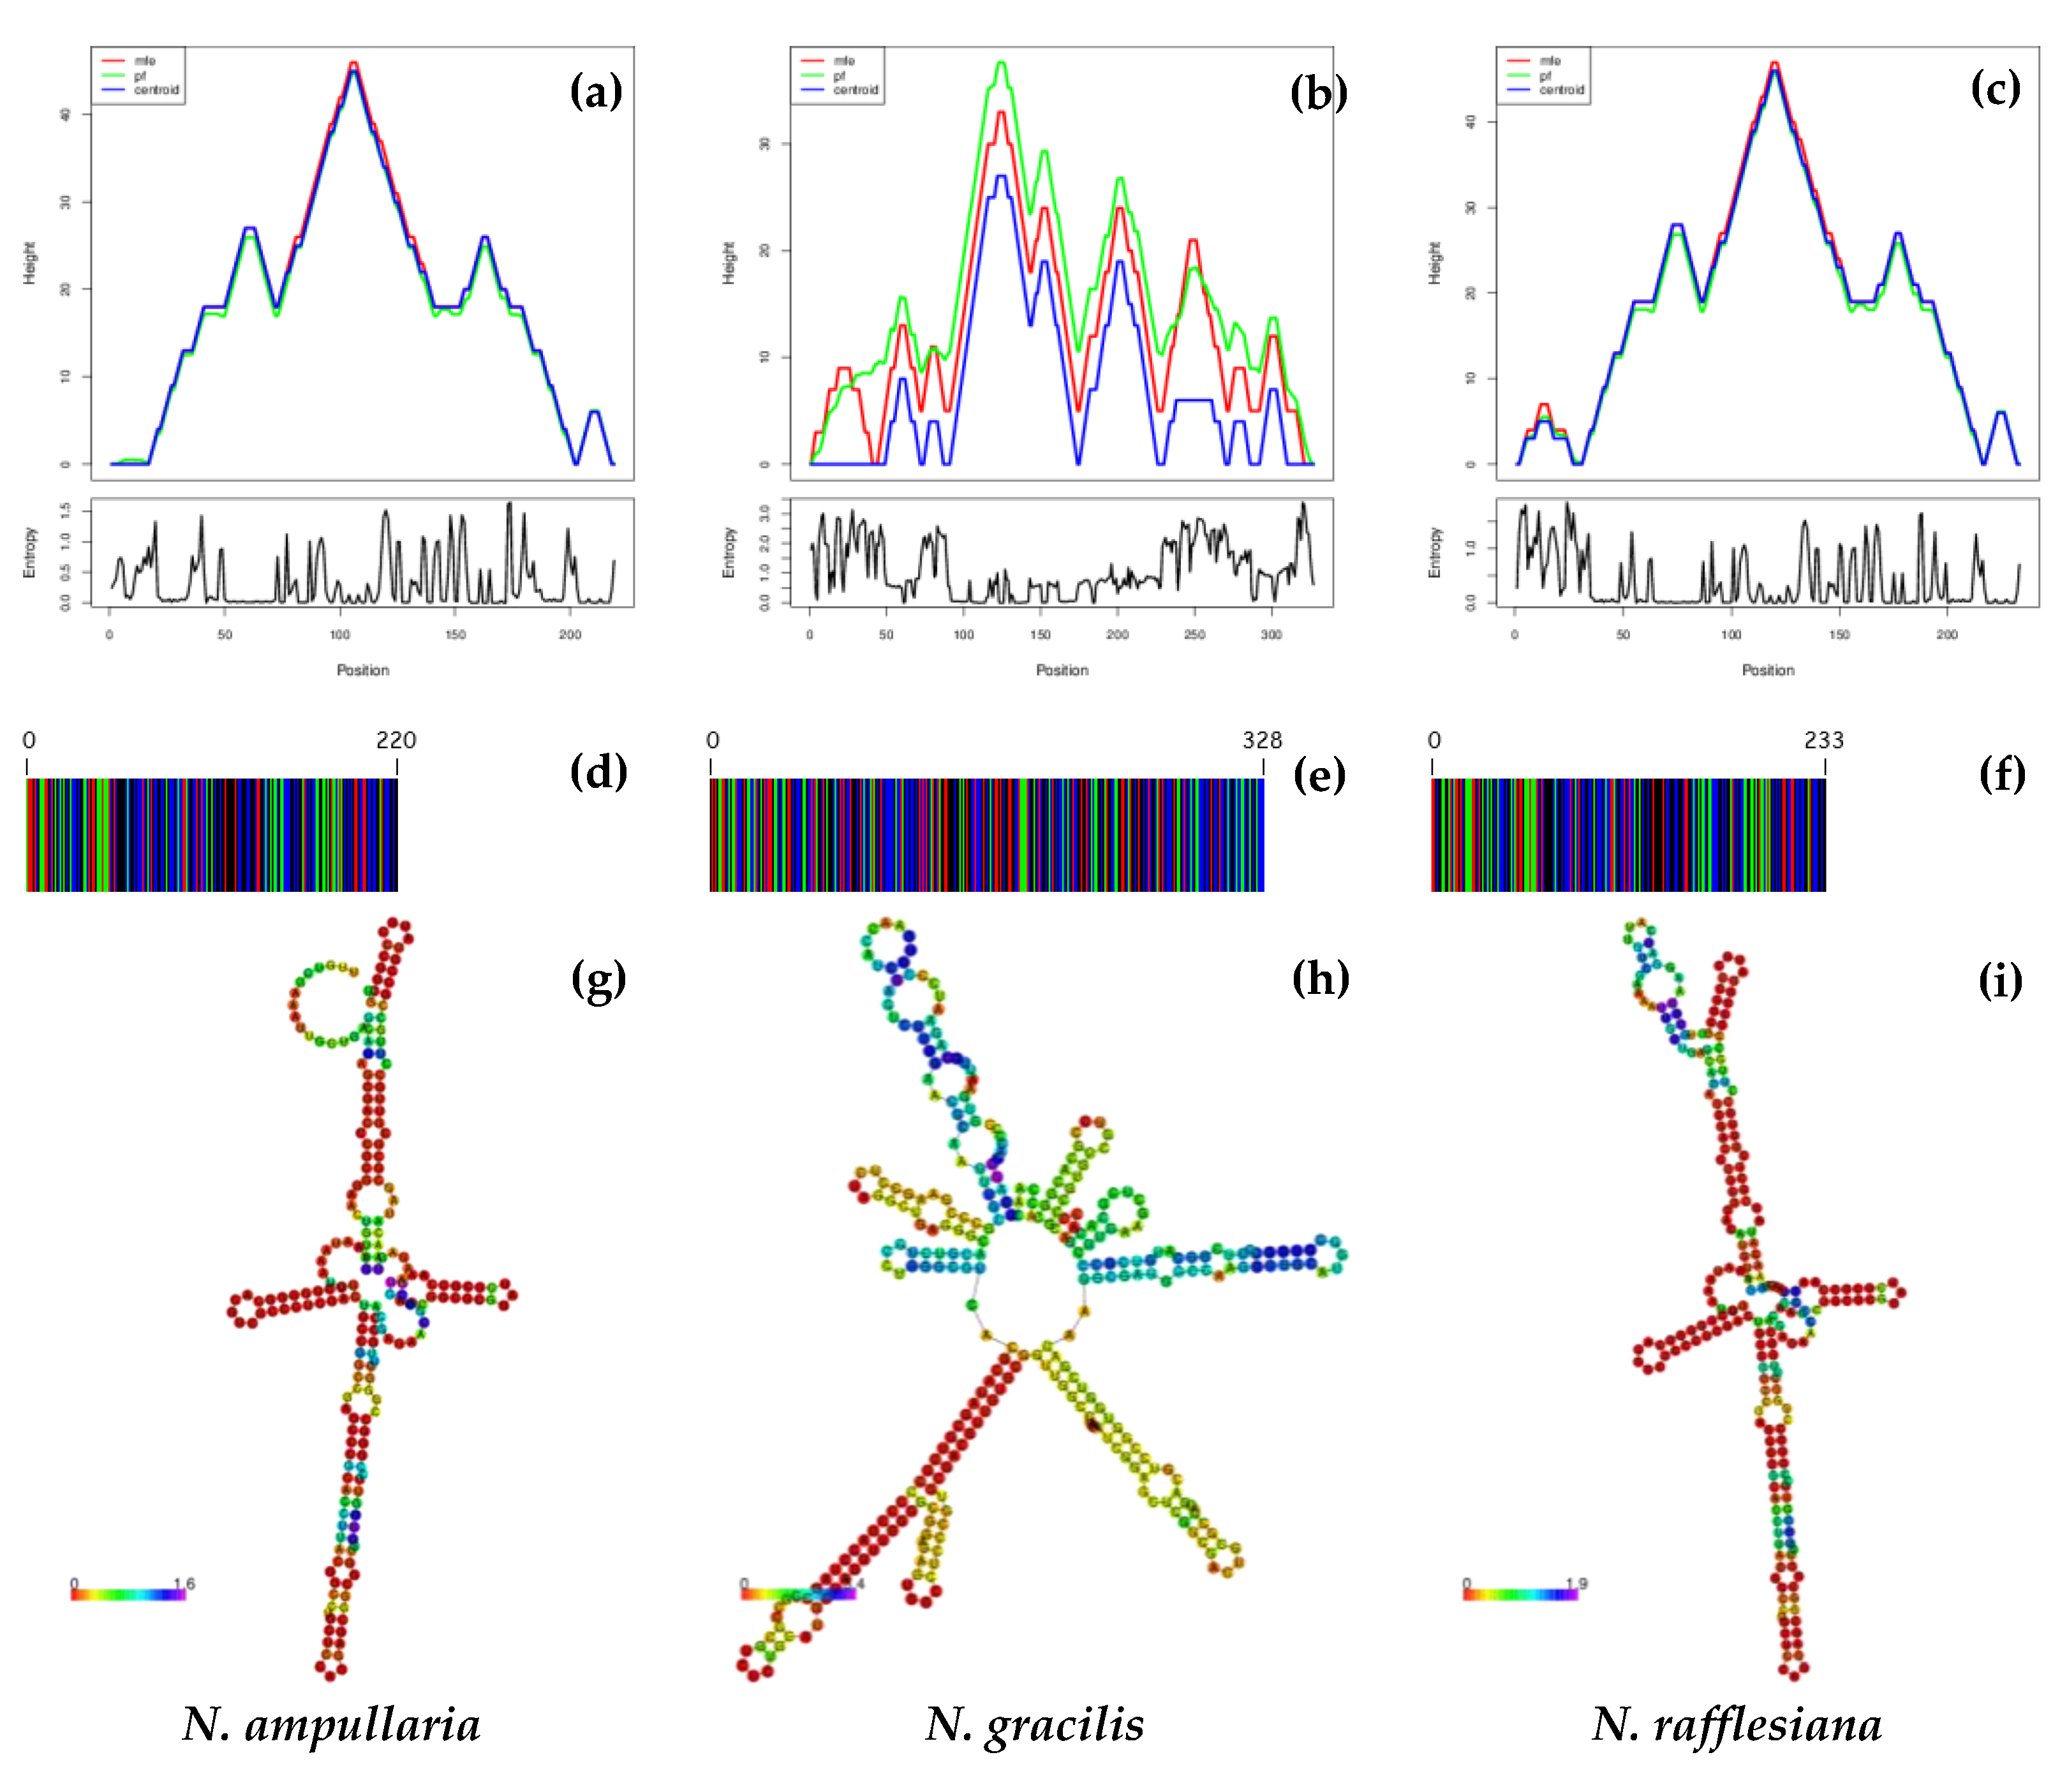
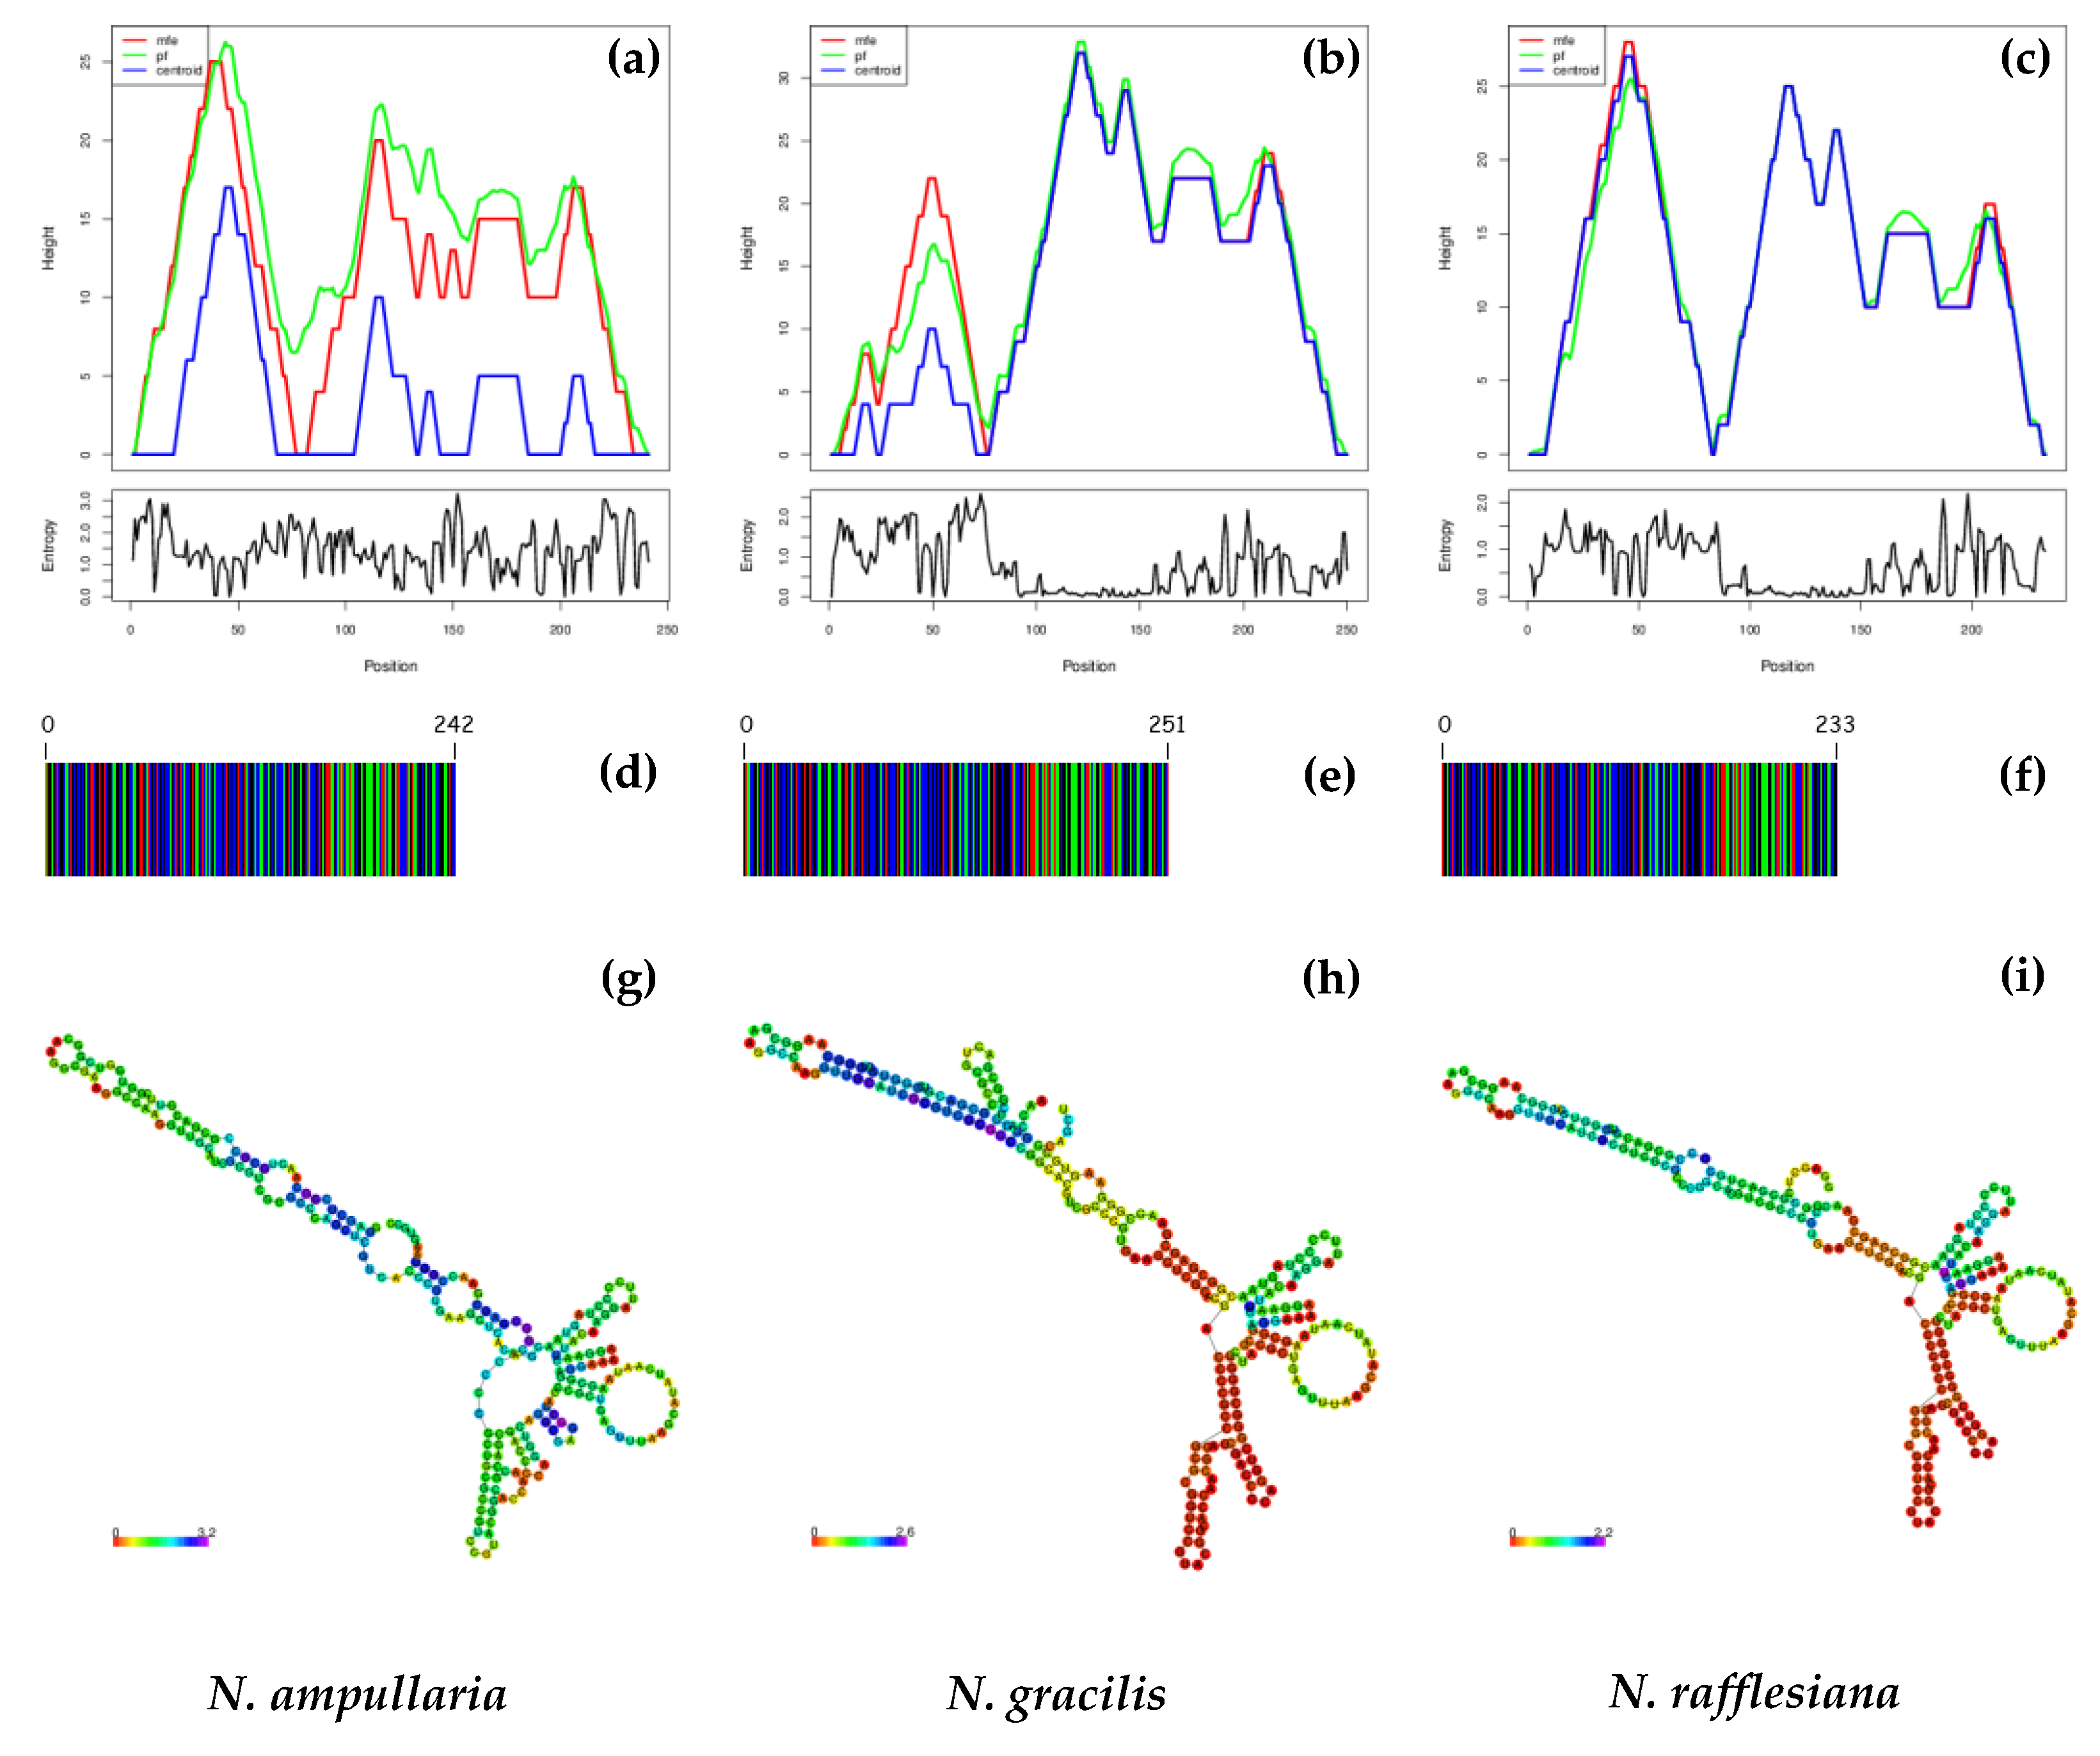
3.3. DNA Barcodes, ITS1 and ITS2 Secondary Structure Predictions

Figure 5 and Figure 6 show the DNA barcodes and ITS1 and ITS2 secondary structure predictions based on minimum free energy (MFE). The highest MFE for NAits1, NGits1 and NRits1 was observed at 100–105 bp (Figure 5a), 120–125 bp (Figure 5b) and 115–120 bp (Figure 5c), respectively. Meanwhile, the highest MFE for both NAits2 and NRits2 was observed at 45–50 bp (Figure 6a,c), while NGits2 recorded the highest MFE at 120–125 bp (Figure 6b). DNA barcode sequences derived from ITS1 showed variations among the three Nepenthes species (Figure 5d–f). NGits1 exhibited the highest barcode length (328 bp), followed by NRits1 (233 bp) and NAits1 (220 bp).
Similarly, ITS1 secondary structure predictions show further variation between the three Nepenthes species. The predicted ITS1 secondary structures of the three Nepenthes showed that each structure had a central ring with different helical orientations (Figure 4g–i). Generally, the secondary structures of NAits1 and NRits1 showed a tighter configuration and pattern similarity despite having a different number of loops on the central ring and along the helices. NGits1, on the other hand, exhibited a more complex structure compared to NAits1 and NRits1, with a bigger central ring, different helix orientations and lengths, varied loop numbers and variation in angles from the spiral. The loop number, position, size and angle from the centroid were distinguishable in all three Nepenthes species.
The predicted ITS2 secondary structure provides additional information on the differences between the three Nepenthes species by representing three slightly different structures with a central ring with different helical orientations (Figure 5g–i). In general, the predicted ITS2 secondary structures had a more uniform pattern compared to the predicted ITS1 secondary structures. All three predicted ITS2 secondary structures shared the same central and backbone pattern, but the loop number, position size and angle from the centroid were still distinguishable in all three Nepenthes species. Consequently, in ITS1′s secondary structure, NAits1 showed the most obvious pattern difference, with a larger central ring compared to NRits1 and NGits1. Based on the results, both ITS1 and ITS2 secondary structure predictions provide deeper insights into the differences between the three Nepenthes species, allowing each species to be identified as unique species and guiding comparative sequence analysis. In addition, the prediction of secondary structures can further assist in the design of species-specific RNA molecules.

4. Discussion

DNA barcoding is used in many plant biodiversity studies to identify species [28,29], discover new taxa, conserve species and enable studies of plant ecology by constructing phylogenetic trees [30]. In this study, ITS1 and ITS2 showed a greater ability for species discrimination than rbcL, especially with regard to secondary structure predictions. Given the universality of the rbcL gene, it has been proposed as a universal barcode fragment due to its ease of amplification and comparison [31]. It is widely used for phylogenetic analysis of families and subclasses in various seed plant groups [32]. However, the limitation of the rbcL barcode is its inability to discriminate between organisms up to the species level. Although Nepenthes does not belong to the seed plant group, the present study showed that rbcL could not classify the three Nepenthes up to the species level, indicating a poor ability to distinguish between species. This was also supported by nucleotide analysis and NJ, which only reached the genus level. This finding is consistent with earlier research showing that diversity in the rbcL sequence is scarce at the species level [26,33,34,35] and reduces its ability to be used to discriminate between species. The high universality and low resolution of rbcL indicates its inefficiency as a DNA barcode, which is also suggested for other plant species, such as Acacia [36].
The ITS region is one of the most commonly used barcodes in genus- and species-level phylogenetic analyses in eukaryotes [37,38]. A previous study had shown the application of DNA barcodes for three Nepenthes species (N. ampullaria, N. rafflesiana and N. gracilis), which enabled them to differentiate between them based on their geographical area of origin. The phylogenetic analysis was based on trnL and ITS barcodes but lacked information on the effectiveness of the two DNA barcodes in distinguishing the Nepenthes spp. from each other [17]. Additionally, a previous study reported that the trnL intron does not represent the best choice for characterizing plant species and for phylogenetic studies among closely related species [39]. The present study involved plant samples from very closely related species; thus, we made use of rbcL, ITS1 and ITS2 to evaluate the species variation. Our findings indicate that the Nepenthes species were grouped at different clades when using ITS1 (Figure 3b), with N. gracilis appearing individually in one clade while N. ampullaria and N. rafflesiana were grouped into another clade. These results show that ITS1 can be used to discriminate between the three Nepenthes species but did not effectively identify the plant samples up to the species level. In contrast, the ITS2 phylogenetic tree revealed that these three species were closely clustered together with the sequences of N. ampullaria, N. rafflesiana and N. gracilis chosen from the BLASTn search, although they did not appear in the same clade (Figure 3c).
Overall, NJ analysis showed that the phylogenetic tree method poorly distinguished between the Nepenthes species compared to distance-based analysis. A previous study showed that barcode gaps act as typical barcode data characterized by having differences between intraspecific diversity and interspecific diversity [25]. However, this was not a general feature in all groups. In this study, the histogram and ranked pairwise (K2P) distance analyzed using ABGD programs showed that the “barcoding gap” between levels of intraspecific variation and interspecific divergence did exist for the analysis of rbcL, ITS2 and ITS1 (Figure 4a–c). Compared to the ITS1 barcoding gap, ITS2 has a wider barcoding gap number. In the present study, phylogenetic analysis did not ambiguously identify the species, but the predicted ITS1 and ITS2 secondary structures revealed the uniqueness of the generated DNA barcode sequences. According to a previous study, the features of the ITS2 region are conserved, which in turn provides molecular and morphological features that could be used to improve the resolution of species identification [40]. The usefulness of ITS2 sequences and the ITS2 secondary structure as genetic markers has been reported for several medicinal plant species [20,41,42]. Regarding the ITS2 secondary structure, the conservative standard structural model contained the feature of a “loop” with four “helices.” Among the four “helices,” helix I and helix IV had the most variations, helix II and helix III were more conserved, helix II was shorter with a pyrimidine–pyrimidine mismatch “bridge,” while helix III was the longest with many branches [30,43,44].
In our study, prediction of secondary structures in all the Nepenthes species under study revealed diverse secondary structures with distinguishable loop numbers, positions and elevations from the centroid. This information can be applied to design species-specific primers for identifying genotypes. Prediction of secondary structure differentiation indicated variation among RNA molecules in all species when using either ITS1 or ITS2. The alignment of the primary nucleic acid sequences could be optimized and modified using the secondary ITS2 information, contributing to the accuracy and robustness of the phylogeny [45]. Previous research had shown that genetic structure uniqueness at the conserved nuclear region could be useful for developing species-specific primers, as reported in a previous study [18]. Meanwhile, little information was available on the function and secondary structure of ITS1, leaving a gap in the knowledge on whether ITS1 secondary structure prediction could enhance species identification. Consequently, the region of ITS1 may play an important role in 18SrRNA maturation [43]. A few reports suggest DNA barcodes can be used to efficiently discriminate between Nepenthes species [16,17,46]. However, until now, no study has reported ITS1 and ITS2 secondary structure predictions in relation to species discrimination in Nepenthes. Our study revealed significant variations in both ITS1 and ITS2 secondary structure predictions that enhanced species discrimination between the three Nepenthes species under study.

5. Conclusions

This study describes the efficiency of DNA barcode genes from rbcL, ITS1 and ITS2 in differentiating between three Nepenthes along with secondary structure predictions. Although the rbcL gene in the chloroplast–plastid region might be easily amplified, it has a poor species identification and discrimination ability. On the other hand, the incorporation of secondary structures in the nuclear ribosomal genes of ITS1 and ITS2 may serve as a trustworthy tool in species identification and designing species-specific primers. The findings of this investigation provide clarity on the scientific foundations for species identification, genetic preservation and the secure use of this significant species of medicinal plant. The employment of DNA barcode technologies for species delimitation in commercially and medicinally important plant species may be possible.

Author Contributions

Conceptualization, A.W., F.M.S. and F.M.; methodology, N.A.S.; software, J.J.; validation, J.J. and A.C.L.; formal analysis, N.A.S.; investigation, N.A.S.; resources, N.A.S., J.J. and A.C.L.; data curation, J.J.; writing—original draft preparation, N.A.S.; writing—review and editing, N.A.S., A.W. and F.M.S.; visualization, N.A.S.; supervision, A.W. and A.F.A.S.; project administration, A.W. and A.F.A.S.; and funding acquisition, A.W. and F.M.S. All authors have read and agreed to the published version of the manuscript.

Funding

This research was fully funded by the Ministry of Higher Education, Malaysia under UTM Transdisciplinary Research Grant (QJ130000.3554.06G59).

Institutional Review Board Statement

Not applicable.

Informed Consent Statement

Not applicable.

Data Availability Statement

Not applicable.

Acknowledgments

The staff of the lab facility, namely the Plant Biotechnology Laboratory, Faculty of Science, UTM, are gratefully acknowledged, the plant sampling assistance and approval of plant sample collection by the Johor National Johor Park Corporation, specifically at Endau-Rompin National Johor Park, Johor, Malaysia, as well as Kamarul Rahim Bin Kamarudin from UTHM for his assistance in plant sample collection and herbarium preparation.

Conflicts of Interest

The authors declare no conflict of interest.

References

  1. McPherson, S.; Robinson, A.S. Field Guide to the Pitcher Plants of Peninsular Malaysia and Indochina; Redfern Natural History: Poole, UK, 2012. [Google Scholar]
  2. Clarke, C. Nepenthes of Borneo; Natural History Publications (Borneo): Kota Kinabalu, Malaysia, 1997. [Google Scholar]
  3. Clarke, C. Nepenthes of Sumatra, and Peninsular Malaysia. In Nepenthes of Sumatra and Peninsular Malaysia; Natural History Publications (Borneo): Kota Kinabalu, Malaysia, 2001; p. 336. [Google Scholar]
  4. Cheek, M.; Jebb, M. Flora Malesiana, Series 1: Volume 15: Nepenthaceae. In Flora Malesiana; National Herbarium of the Netherlands: Wageningen, The Netherlands, 2001. [Google Scholar]
  5. Jebb, M.; Cheek, M. A skeletal revision of nepenthes (Nepenthaceae). Blumea J. Plant Taxon. Plant Geogr. 1997, 42, 1–106. [Google Scholar]
  6. Lestari, W.; Jumari, J.; Ferniah, R.S. Identification and Cluster Analysis of Pitcher Plant (Nepenthes spp.) from South Sumatera Indonesia. Biosaintifika J. Biol. Biol. Educ. 2018, 10, 245–251. [Google Scholar] [CrossRef]
  7. Phillipps, A.; Lamb, A. Pitcher-Plants of Borneo, 1st ed.; Royal Botanic Gardens: Sydney, Australia, 1996. [Google Scholar]
  8. Beveridge, N.G.P.; Rauch, C.; Ke, P.J.A.; van Vugt, R.R. A new way to identify living species of Nepenthes (Nepenthaceae ): More data needed ! Carniv. Plant Newsl. 2013, 42, 122–128. [Google Scholar] [CrossRef]
  9. Aung, H.H.; Chia, L.S.; Goh, N.K.; Chia, T.F.; Ahmed, A.A.; Pare, P.W.; Mabry, T.J. Phenolic constituents from the leaves of the carnivorous plant Nepenthes gracilis. Fitoterapia 2002, 73, 445–447. [Google Scholar] [CrossRef]
  10. Mainasara, M.M.; Fadzelly, M.; Bakar, A.; Mohamed, M.; Linatoc, A.C.; Sanusi, S.B. Ethnomedical Knowledge of Plants Used for the Treatment of Breast Cancer by Jakun community in Kampung Peta Endau Rompin Johor, Malaysia. J. Sci. Technol. 2017, 9, 42–49. [Google Scholar]
  11. Thao, N.P.; Luyen, B.T.T.; Koo, J.E.; Kim, S.; Koh, Y.S.; van Thanh, N.; Cuong, N.X.; van Kiem, P.; van Minh, C.; Kim, Y.H. In vitro anti-inflammatory components isolated from the carnivorous plant Nepenthes mirabilis (Lour.) Rafarin. Pharm. Biol. 2016, 54, 588–594. [Google Scholar] [CrossRef]
  12. Sabran, S.F.; Mohamed, M.; Abu Bakar, M.F. Ethnomedical Knowledge of Plants Used for the Treatment of Tuberculosis in Johor, Malaysia. Evid. -Based Complement. Altern. Med. 2016, 2016, 2850845. [Google Scholar] [CrossRef] [PubMed]
  13. Sanusi, S.B.; Abu Bakar, M.F.; Mohamed, M.; Sabran, S.F.; Mainasara, M.M. Ethnobotanical, phytochemical, and pharmacological properties of nepenthes species: A review. Asian J. Pharm. Clin. Res. 2017, 10, 16–19. [Google Scholar] [CrossRef]
  14. Schwallier, R.; de Boer, H.J.; Visser, N.; van Vugt, R.R.; Gravendeel, B. Traps as treats: A traditional sticky rice snack persisting in rapidly changing Asian kitchens. J. Ethnobiol. Ethnomed. 2015, 11, 24. [Google Scholar] [CrossRef]
  15. Liu, Y.; Zhang, M.; Chen, X.; Chen, X.; Hu, Y.; Gao, J.; Pan, W.; Xin, Y.; Wu, J.; Du, Y.; et al. Developing an efficient DNA barcoding system to differentiate between Lilium species. BMC Plant Biol. 2021, 21, 465. [Google Scholar] [CrossRef] [PubMed]
  16. Gogoi, B.; Bhau, B.S. DNA barcoding of the genus Nepenthes (Pitcher plant): A preliminary assessment towards its identification. BMC Plant Biol. 2018, 18, 153. [Google Scholar] [CrossRef]
  17. Bunawan, H.; Yen, C.C.; Yaakop, S.; Noor, N.M. Phylogenetic inferences of Nepenthes species in Peninsular Malaysia revealed by chloroplast (trnL intron) and nuclear (ITS) DNA sequences. BMC Res. Notes 2017, 10, 67. [Google Scholar] [CrossRef]
  18. Acharya, G.C.; Mohanty, S.; Dasgupta, M.; Sahu, S.; Singh, S.; Koundinya, A.V.V.; Kumari, M.; Naresh, P.; Sahoo, M.R. Molecular Phylogeny, DNA Barcoding, and ITS2 Secondary Structure Predictions in the Medicinally Important Eryngium Genotypes of East Coast Region of India. Genes 2022, 13, 1678. [Google Scholar] [CrossRef]
  19. Liu, Z.W.; Gao, Y.Z.; Zhou, J. Molecular authentication of the medicinal species of Ligusticum (ligustici rhizoma et radix, “gao-ben”) by integrating non-coding internal transcribed spacer 2 (ITS2) and its secondary structure. Front. Plant Sci. 2019, 10, 429. [Google Scholar] [CrossRef] [PubMed]
  20. Singh, D.P.; Kumar, A.; Rodrigues, V.; Prabhu, K.N.; Kaushik, A.; Mani, D.N.; Shukla, A.K.; Sundaresan, V. DNA barcoding coupled with secondary structure information enhances Achyranthes species resolution. J. Appl. Res. Med. Aromat. Plants 2020, 19, 100269. [Google Scholar] [CrossRef]
  21. Fadzil, N.F.; Wagiran, A.; Mohd Salleh, F.; Abdullah, S.; Izham, M.N.H. Authenticity and Detection of Eurycoma longifolia herbal products using Bar-High Resolution Melting Analysis. Genes 2018, 9, 408. [Google Scholar] [CrossRef] [PubMed]
  22. Omelchenko, D.O.; Speranskaya, A.S.; Ayginin, A.A.; Khafizov, K.; Krinitsina, A.A.; Fedotova, A.V.; Pozdyshev, D.V.; Shtratnikova, V.Y.; Kupriyanova, E.V.; Shipulin, G.A.; et al. Improved Protocols of ITS1-Based Metabarcoding and Their Application in the Analysis of Plant-Containing Products. Genes 2019, 10, 122. [Google Scholar] [CrossRef] [PubMed]
  23. Tamura, K.; Peterson, D.; Peterson, N.; Stecher, G.; Nei, M.; Kumar, S. MEGA5: Molecular evolutionary genetics analysis using maximum likelihood, evolutionary distance, and maximum parsimony methods. Mol. Biol. Evol. 2011, 28, 2731–2739. [Google Scholar] [CrossRef]
  24. Nei, M.; Kumar, S. Molecular Evolution and Phylogenetics; Oxford University Press: Oxford, UK, 2001. [Google Scholar]
  25. Puillandre, N.; Lambert, A.; Brouillet, S.; Achaz, G. ABGD, Automatic Barcode Gap Discovery for primary species delimitation. Mol. Ecol. 2012, 21, 1864–1877. [Google Scholar] [CrossRef] [PubMed]
  26. Newmaster, S.G.; Fazekas, A.J.; Steeves, R.A.D.; Janovec, J. Testing candidate plant barcode regions in the Myristicaceae. Mol. Ecol. Resour. 2008, 8, 480–490. [Google Scholar] [CrossRef]
  27. Yu, H.; Wu, K.; Song, J.; Zhu, Y.; Yao, H.; Luo, K.; Dai, Y.; Xu, S.; Lin, Y. Expedient identification of Magnoliaceae species by DNA barcoding. Plant OMICS 2014, 7, 47–53. [Google Scholar]
  28. Hollingsworth, P.M. DNA barcoding plants in biodiversity hot spots: Progress and outstanding questions. Heredity 2008, 101, 1–2. [Google Scholar] [CrossRef] [PubMed]
  29. Hollingsworth, P.M.; Graham, S.W.; Little, D.P. Choosing and Using a Plant DNA Barcode. PLoS ONE 2011, 6, e19254. [Google Scholar] [CrossRef] [PubMed]
  30. Schultz, J.; Müller, T.; Achtziger, M.; Seibel, P.N.; Dandekar, T.; Wolf, M. The internal transcribed spacer 2 database—A web server for (not only) low level phylogenetic analyses. Nucleic Acids Res. 2006, 34, 704–707. [Google Scholar] [CrossRef]
  31. Hollingsworth, P.M.; Li, D.Z.; van der Bank, M.; Twyford, A.D. Telling plant species apart with DNA: From barcodes to genomes. Philos. Trans. R. Soc. B Biol. Sci. 2016, 371, 20150338. [Google Scholar] [CrossRef]
  32. Hebert, P.D.N.; Ratnasingham, S.; DeWaard, J.R. Barcoding animal life: Cytochrome c oxidase subunit 1 divergences among closely related species. Proc. R. Soc. B Biol. Sci. 2003, 270 (suppl. 1), 96–99. [Google Scholar] [CrossRef]
  33. Fazekas, A.J.; Burgess, K.S.; Kesanakurti, P.R.; Graham, S.W.; Newmaster, S.G.; Husband, B.C.; Percy, D.M.; Hajibabaei, M.; Barrett, S.C.H. Multiple Multilocus DNA Barcodes from the Plastid Genome Discriminate Plant Species Equally Well. PLoS ONE 2008, 3, e2802. [Google Scholar] [CrossRef]
  34. Kress, W.J.; Erickson, D.L. A Two-Locus Global DNA Barcode for Land Plants: The Coding rbcL Gene Complements the Non-Coding trnH-psbA Spacer Region. PLoS ONE 2007, 2, e508. [Google Scholar] [CrossRef] [PubMed]
  35. Sass, C.; Little, D.P.; Stevenson, D.W.; Specht, C.D. DNA barcoding in the Cycadales: Testing the potential of proposed barcoding markers for species identification of Cycads. PLoS ONE 2007, 2, e1154. [Google Scholar] [CrossRef]
  36. Ismail, M.; Ahmad, A.; Nadeem, M.; Javed, M.A.; Khan, S.H.; Khawaish, I.; Sthanadar, A.A.; Qari, S.H.; Alghanem, S.M.; Khan, K.A.; et al. Development of DNA barcodes for selected Acacia species by using rbcL and matK DNA markers. Saudi J. Biol. Sci. 2020, 27, 3735–3742. [Google Scholar] [CrossRef] [PubMed]
  37. Coleman, A.W. ITS2 is a double-edged tool for eukaryote evolutionary comparisons. Trends Genet. 2003, 19, 370–375. [Google Scholar] [CrossRef] [PubMed]
  38. Edinburgh, R.B.G.; Group, C.P.W.; Hollingsworth, P.M.; Forrest, L.L.; Spouge, J.L.; Hajibabaei, M.; Ratnasingham, S.; van der Bank, M.; Chase, M.W.; Cowan, R.S.; et al. A DNA barcode for land plants. Proc. Natl. Acad. Sci. USA 2009, 106, 12794–12797. [Google Scholar]
  39. Taberlet, P.; Coissac, E.; Pompanon, F.; Gielly, L.; Miquel, C.; Valentini, A.; Vermat, T.; Corthier, G.; Brochmann, C.; Willerslev, E. Power and limitations of the chloroplast trnL (UAA) intron for plant DNA barcoding. Nucleic Acids Res. 2007, 35, e14. [Google Scholar] [CrossRef] [PubMed]
  40. Feng, S.; Jiang, M.; Shi, Y.; Jiao, K.; Shen, C.; Lu, J.; Ying, Q.; Wang, H. Application of the ribosomal DNA ITS2 region of physalis (Solanaceae): DNA barcoding and phylogenetic study. Front. Plant Sci. 2016, 7, 1047. [Google Scholar] [CrossRef]
  41. Anaz, M.; Sasidharan, N.; Remakanthan, A.; Dilsha, M.V. ITS2 and RNA secondary structure-based analysis reveals a clear picture on phylogeny of South Indian Salacia spp. Comput. Biol. Chem. 2021, 91, 107438. [Google Scholar] [CrossRef]
  42. Selvaraj, D.; Ramalingam, S. Identification of morphologically similar species of Tribulus (Zygophyllaceae) by employing DNA barcodes and rRNA secondary structures. Ecol. Genet. Genom. 2021, 18, 100072. [Google Scholar] [CrossRef]
  43. Coleman, A.W. Pan-eukaryote ITS2 homologies revealed by RNA secondary structure. Nucleic Acids Res. 2007, 35, 3322–3329. [Google Scholar] [CrossRef]
  44. Wolf, M.; Achtziger, M.; Schultz, J.; Dandekar, T.; Müller, T. Homology modeling revealed more than 20,000 rRNA internal transcribed spacer 2 (ITS2) secondary structures. RNA 2005, 11, 1616–1623. [Google Scholar] [CrossRef] [PubMed]
  45. Zheng, M.; Liu, D.; Zhang, H.; Zhang, Y. Molecular authentication of medicinal and edible plant Gnaphalium affine (cudweed herb, “Shu-qu-cao”) based on DNA barcode marker ITS2. Acta Physiol. Plant. 2021, 43, 119. [Google Scholar] [CrossRef]
  46. Biswal, D.K.; Debnath, M.; Konhar, R.; Yanthan, S.; Tandon, P. Phylogeny and Biogeography of Carnivorous Plant Family Nepenthaceae with Reference to the Indian Pitcher Plant Kepenthes Khasiana Reveals an Indian Subcontinent Origin of Nepenthes Colonization in Southeast Asia During the Miocene Epoch. Front. Ecol. Evol. 2018, 6, 108. [Google Scholar] [CrossRef]
Figure 1. The geographical location (a) of the Nepenthes collected from Bukit Janing, Kampung Peta, Endau-Rompin National Park, Johor, Malaysia (GPS location; 2.529908870220549, 103.41185691378324). Nepenthes species collected: (b) Nepenthes ampullaria, (c) Nepenthes gracilis and (d) Nepenthes rafflesiana.
Genes 14 00697 g001
Figure 2. Multiple sequence alignment of rbcL (a), ITS1 (b) and ITS2 (c) barcodes.
Genes 14 00697 g002
Figure 3. Neighbor joining tree of rbcL (a), ITS1 (b) and ITS2 (c) barcode primers depicting the phylogenetic analysis among N. ampullaria, N. gracilis, and N. rafflesiana (indicated in the red boxes).
Genes 14 00697 g003aGenes 14 00697 g003b
Figure 4. Barcode gap analysis of N. gracilis, N. ampullaria, and N. rafflesiana generated by Automatic Barcode Discovery Gap Discovery (https://bioinfo.mnhn.fr/abi/public/abgd/abgdweb.html, accessed on 23 January 2023) [25] for (a) rbcL, (b) ITS2 and (c) ITS1. Distributions of K2P distances and between each pair of specimens for the histogram of distance.
Genes 14 00697 g004
Figure 5. The variations observed in the predicted minimum free energy (MFE) (ac), DNA barcodes (df), and secondary structures of the ITS1 region for the three Nepenthes species (g–i).
Genes 14 00697 g005
Figure 6. The variations observed in the predicted minimum free energy (MFE) (ac), DNA barcodes (df), and secondary structures of the ITS2 region for the three Nepenthes species (g–i).
Genes 14 00697 g006
Table 1. Polymerase Chain Reaction (PCR) profiles used in this study.
StepsNo. of CyclesrbcL 1 ITS1 2 ITS2 3
Temperature (°C)Duration (s)Temperature (°C)Duration (s)Temperature (°C)Duration (s)
Denaturation35981098109810
Annealing531555155510
Elongation722072407230
Hold1444
1 ribulose-bisphosphate carboxylase (rbcL). 2 intergenic spacer 1 (ITS1).3 intergenic spacer 2 (ITS2)
Table 2. List of primers used in this study.
RegionPrimer NamePrimer Sequence (5′ to 3′)Primer Length (bp)Reference
rbcLRbcla_fwdATGTCACCACAAACAGAGACTAAAGC26[21]
Rbclb_rvsGTAAAATCAAGTCCACCRCG20
ITS1ITS1_fwdGGAAGGAGAAGTCGTAACAAGG22[21]
ITS1_rvsAGATATCCGTTGCCGAGAGT20
ITS2ITS2_fwdGGGGCGGATATTGGCCTCCCCTTG24[22]
ITS2_rvsGACGCTTCTCCAGACTACAAT21
Table 3. DNA best-fit substitution model depicted from MEGAX software for the three DNA barcodes.
Barcode GenesDNA Best-Fit Substitution Model
rbcLKimura-2-parameter
ITS1Tamura-3-parameter
ITS2Kimura-2-parameter + γ distribution
Table 4. Molecular identification of Nepenthes species using rbcL, ITS1 and ITS2 barcode genes.
Barcode GenesSample IDScientific NameAccession NumberE ValueQuery
Coverage (%)
Percent
Identity (%)
rbcLNArbcLN. mirabilisNC_041271.10.0100100
NGrbcLN. mirabilisNC_041271.10.0100100
NRrbcLN. mirabilisNC_041271.10.0100100
ITS1NAits1Nepenthes x intermediaHM204899.11e-10310098.64
NGits1N. ventricosaAB675910.12e-168100100
NRits1Nepenthes x intermediaHM204899.12e-116100100
ITS2NAits2N. gracilisAB675882.14e-10410095.85
NGits2N. gracilisAB675882.12e-12210099.20
NRits2N. gracilisAB675882.15e-11310099.14
Table 5. The average AT and GC percentage nucleotide composition of N. gracilis, N. ampullaria and N. rafflesiana based on rbcL, ITS2 and ITS1 DNA barcodes.
DNA BarcodeSpeciesAT (bp)GC (bp)Total (bp)AT (%)GC (%)
rbcLN. gracilis2802295095545
N. ampullaria27822450255.444.6
N. rafflesiana27822450255.444.6
ITS2N. gracilis8511425034.066.0
N. ampullaria8915224136.963.1
N. rafflesiana7815523333.566.5
ITS1N. gracilis11121632733.966.1
N. ampullaria6915021931.568.5
N. rafflesiana7615723332.667.4
Disclaimer/Publisher’s Note: The statements, opinions and data contained in all publications are solely those of the individual author(s) and contributor(s) and not of MDPI and/or the editor(s). MDPI and/or the editor(s) disclaim responsibility for any injury to people or property resulting from any ideas, methods, instructions or products referred to in the content.

