Article

The Complete Mitochondrial Genome of Dendrogale murina (Tupaiidae) and Phylogeny of Scandentia

1
Zoological Institute RAS, 199034 Saint-Petersburg, Russia
2
Joint Vietnamese-Russian Tropical Research and Technological Centre, Nguyen Van Huyen, Nghia Do, Cau Giay, Hanoi 650000, Vietnam
*
Author to whom correspondence should be addressed.
Genes 2023, 14(3), 624; https://doi.org/10.3390/genes14030624
Submission received: 4 February 2023 / Revised: 19 February 2023 / Accepted: 26 February 2023 / Published: 1 March 2023
(This article belongs to the Special Issue Phylogenomics and Molecular Evolution)

Abstract

:
In this paper, we report the complete mitochondrial genome of the northern smooth-tailed treeshrew Dendrogale murina, which was sequenced for the first time using the Illumina next-generation sequencing (NGS) technology. The total length of the mitochondrial genome is 16,844–16,850 bp and encodes 37 genes, including two ribosomal RNAs (rRNAs) 12S and 16S, 22 transfer RNAs (tRNAs), 13 protein-coding genes (PCGs), and a D-loop in the characteristic arrangement of family Tupaiidae (Mammalia: Scandentia). The overall base composition of the complete mitochondrial DNA is A (33.5%), C (25.5%), G (13.9%), and T (27.1%). Phylogenetic analysis of Scandentia mitochondrial genomes showed a classic pattern, which was revealed previously while using individual phylogenetic markers. The result of the current study is consistent with one based on the latest morphological studies, with the basal position of Ptilocercus and Dendrogale sister to the rest of the Tupaiidae genera. The divergence time of the Dendrogale genus is estimated as Eocene–Oligocene, with the mean value of 35.8 MYA, and the Ptilocercus genus probably separated at about 46.3 MYA. We observe an increase in the age of all nodes within the Scandentia, except for a decrease in the age of separation of Ptilocercus. This result can be explained both by the addition of new mitochondrial genome data in the analysis and the usage of new calibration points from recently published data.

Graphical Abstract

1. Introduction

The order Scandentia (treeshrews), for a long time, has been the focus of evolutionary and phylogenetic studies with emphasis on the position of the order among other eutherian mammals and on the origin of primates. These studies were performed using both morphological and molecular tools [1,2,3,4,5]. Usually in these comparative studies, one or two species of the genus Tupaia Raffles, 1821, were used as a typical representative of the order, although the diversity of the order Scandentia is not limited to the family Tupaiidae Gray, 1825. Thus, until recently, the interrelationships of taxa within the order received less attention. Meanwhile, the various studies with the use of both molecular and morphological analyses performed in the first decade of the 21th century showed the high heterogeneity of taxa within the order [6,7,8,9,10,11]. Hence, the evolutionary history and phylogenetic relationships of the taxa within this very ancient and enigmatic group, the recent species of which represent only a small portion of past diversity, largely remained obscure. According to the latest systematic account [12], the order is represented with two families: Tupaiidae and Ptilocercidae Lyon, 1913. The latter is monotypic and includes the only genus, Ptilocercus Gray, 1848, with one species, Ptilocercus lowii Gray, 1848, distributed in the western part of Southeast Asia [12]. The latter species is remarkable, being a “living fossil”, as it still retains many plesiomorphic morphological features very similar to the extinct representative of this genus, Ptilocercus kylin Li and Ni, 2016, aged as the early Oligocene at 34 MYA [13]. Family Tupaiidae unites the majority of order representatives and includes four genera: Tupaia and Anathana Lyon, 1913; Dendrogale Gray, 1848; and Urogale Mearns, 1905. The most speciose, widespread, and best-studied is the Tupaia, which includes not less than 15 species, while genera Anathana (Madras treeshrews) and Urogale (Mindanao treeshrews) are monotypic and narrow-ranged, inhabiting the southern part of the Peninsular India and southern Philippines, respectively.
The genus Dendrogale is represented by two species: northern smooth-tailed treeshrew D. murina Schlegel and Müller, 1843, and Bornean smooth-tailed treeshrew D. melanura Thomas, 1892, both of which are extremely poorly studied species. D. murina is distributed from Eastern Thailand through Cambodia and southeast Laos to Southern and Central Vietnam [14,15]. The species everywhere is rare or is highly localized in occurrences that are reflected in the scarcity of both ecological and genetic information on the species. Limited biological sampling of the species might be interpreted as evidence of genuine rarity [14]. Hawkins [16] and Francis [17] summarized some data on the ecology and natural history of D. murina, whereas the genetic data is still scarce.
The position of genus Dendrogale within the family Tupaiidae was long debatable. Butler [18], on the basis of thorough analysis of dental features of all Scandentia species, suggested one of several possible interpretations with respect to the position of Dendrogale, which he, as well as Steele [19], chose to depict as nested within the subfamily Tupaiidae rather than as its basal-most member. Later on, reassessment of all characters previously considered in morphological studies [10,20] showed the sister position of Dendrogale to be the clade uniting all other treeshrew species and the basal position of Ptilocercus within the order. This hypothesis was later supported by a few molecular studies [11,21]. Phylogeny of Scandentia was reconstructed using mitochondrial 12S and 16S rRNA genes and several nuclear genes [11,21,22].
Complete mitochondrial genomes have been effectively used to understand the evolutionary relationships among numerous taxa of vertebrate and invertebrate animals. The mitochondrial genomes provided robust phylogenetic signals that were much more informative than the signals obtained using single mitochondrial genes. Several seminal studies have proven that phylogenetic reconstructions based on complete mitochondrial genomes showed better resolution than the trees based upon a few single loci [23,24,25]. Meanwhile, the genetic information and structural motifs of the Dendrogale mitochondrial genome are still unknown. The complete mitochondrial genomes based on phylogenetic reconstruction [26] analyzed only the Tupaia species and did not include both the basal Scandentia genera Dendrogale and Ptilocercus. To fill this gap of knowledge, the present study first aims to determine the complete mitochondrial genome of Dendrogale murina from Southern Vietnam. Second, we aim to test which alternative hypothesis of the Dendrogale position is supported by mitochondrial genome-based phylogeny. To this end, we additionally partly assemble the mitochondrial genome of the pen-tailed treeshrew P. lowii (from the previously published Sequence Read Archive (SRA) datasets and partial mitochondrial cytochrome b gene) and conduct phylogenetic analyses and divergence time estimation to infer the evolutionary relationship of the genera Dendrogale, Tupaia, and Ptilocercus within the order Scandentia.

2. Materials and Methods

2.1. Material

Two specimens of Dendrogale murina were collected in Southern Vietnam, Dong Nai Province, Vinh Cuu District, 6 km north of Ba Hao Village, 11.309° N, 107.079° E (Figure 1). Muscle tissues were fixed in 96% ethanol. Voucher specimens were deposited under the numbers ZIN 100298 and ZIN 100299 in the collection of the Laboratory of Theriology of the Zoological Institute of Russian Academy of Sciences (ZIN), Saint Petersburg, Russia; the tissue and DNA of the specimens were deposited under the numbers 5842 and 5843 in the tissue collection of the Laboratory of Evolutionary Genomics and Paleogenomics of the ZIN. In addition, data were downloaded from the NCBI SRA and Nucleotide databases (https://www.ncbi.nlm.nih.gov/, accessed on 20 June 2022): Tupaia belangeri Wagner, 1841 (NC_002521); T. minor Günther, 1876 (MT442050); T. montana Thomas, 1892 (NC_054191); T. nicobarica Zelebor, 1869 (MW751815); T. splendidula Gray, 1865 (NC_050994); T. tana Raffles, 1821 (NC_050992); P. lowii (SRR2577514, SRR6053052, and MK111982); and Galeopterus variegatus Audebert, 1799 (JN800721).

2.2. DNA Extraction, Library Preparation, and Sequencing

Total genomic DNA was isolated from the tissue fragment dissected from the femoral muscle. Homogenization was performed using the mill TissueLyser LT (Qiagen, Hilden, Germany) according to the original protocol for animal and human tissues. Genomic DNA was extracted using the DNeasy Blood & Tissue Kit (Qiagen, Hilden, Germany) according to the original protocol and stored at −20 °C.
NGS libraries were prepared using the NEBNext Ultra II DNA Library Prep Kit for Illumina (New England Biolabs, Beijing, China). The resulting PCR products were purified and concentrated using AMPure XP beads (Beckman Coulter, Beverly, MA, USA). The concentration of samples was measured using a Qubit 4 fluorometer (Thermo Fisher Scientific, Waltham, MA, USA), while the final quality control of the libraries was implemented using the Bioanalyzer 2100 instrument and the DNA High Sensitivity Kit (Agilent, Boulder, CO, USA).
Sequencing was performed on an Illumina HiSeq 4000 system, resulting in raw pair-end reads of 75 bp. DNA quality was checked with a Qubit 4 fluorometer, and the final distribution of lengths of the libraries’ adapter content checking was conducted using Bioanalyzer 2100 (Agilent, Boulder, CO, USA). DNA extraction, library preparation, and sequencing were performed in the Core Sequencing Centre of Kurchatov Centre for Genome Research (National Research Centre “Kurchatov Institute”, Russia).

2.3. Mitochondrial Genome Assembly, Annotation, and Sequence Analyses

The quality of raw reads was evaluated using FastQC ver. 0.11.9 [27], reads were cleaned from Illumina adapters, and overrepresented sequences and low-quality reads (< Q20) were cleaned using the Trimmomatic v0.39 [28] and FASTP software [29]. Two mitochondrial genomes were assembled from clean reads of two D. murina specimens using plasmidSPAdes version 3.10.1 [30,31]. P. lowii mitochondrial genome assembly was conducted by mapping to a reference from a consensus mitochondrial genome of six Tupaia species in Geneious Prime 2019.1 (Biomatters Ltd., Auckland, New Zealand, https://www.geneious.com, accessed on 26 November 2021) using the Geneious mapper with default settings. Fragments with a minimum of 10× coverage were used to generate the consensus sequence. The partially assembled sequence of mitochondrial cytochrome b gene (mt CYTB) was verified and complemented with the CYTB sequence downloaded from the NCBI Nucleotide database (MK111982).
The assembled mitochondrial genomes were annotated using the MITOS web server [32] with the default settings. Gene boundaries were checked and refined by alignment against published mitochondrial genome sequences of the Tupaia species.
Nucleotide composition and codon usage were calculated using Geneious Prime 2019.1 (Biomatters Ltd., Auckland, New Zealand). To calculate the base composition skew, we used previously known formulas: AT skew = (A − T) / (A + T) and GC skew = (G − C) / (G + C) [33]. Both analyses were calculated using full-length mitochondrial genomes.

2.4. Phylogenetic Reconstruction and Divergence Time Estimation

Phylogenetic reconstruction of order Scandentia was conducted based on the alignment of complete mitochondrial genomes of six Tupaia species, two complete mitochondrial genomes of D. murina, and a partial mitochondrial genome of P. lowii. The Sunda flying lemur G. variegatus was used as an outgroup. The D-loop fragment was excluded from the alignment due to its high variability. In total, 36 genes (13 PCGs, two rRNAs, and 22 tRNAs) were included in the phylogenetic reconstruction. Mitochondrial genomes (except D-loop) were aligned with Mauve 1.1.1 [34] implemented as a plugin for Geneious Prime 2019.1.
The best-fit model (GTR + F + I + G4) was estimated in ModelFinder [35] using the Bayesian information criterion (BIC). The maximum-likelihood (ML) tree was constructed using the IQ-TREE web server http://iqtree.cibiv.univie.ac.at/ [36] with 1000 bootstrap support.
The estimation of divergence times among Scandentia species was calculated using the Bayesian relaxed-clock method in the BEAST v2.6.7 software [37]. The GTR + I + G substitution model, empirical base frequencies, and relaxed uncorrelated log-normal clock with the Yule speciation model was applied as Tree prior. Three fossil calibration points were applied to constrain the analysis. The total tree height (node A) was considered a log-normal prior (with the offset = 65.79 MYA and 95 % HPD of 126-67 MYA), as was done in Vries and Beck [38], according to the fossil Purgatorius mckeeveri Wilson Mantilla et al., 2021, from the early Palaeocene [39]. The most recent common ancestor (MRCA) of Scandentia representatives (node B) was calibrated with a log-normal distribution (with the offset = 34 MYA and 95 % HPD of 65-34 MYA), based on the fossil of P. kylin from the early Oligocene [13]. The MRCA of Tupaia (node C) was calibrated with a log-normal distribution (with the offset = 18 MYA and 95 % HPD of 28-18 MYA), based on the fossil of Tupaia miocenica Mein and Ginsburg, 1997 [40].
Two replicate runs of 100 million Markov chain Monte Carlo (MCMC) generations each were performed, sampling trees and parameter estimators every 1000 generations. The convergence of run parameters was examined using the effective-sample-size (ESS) statistics in Tracer v1.7 [41]. To combine these runs, log files were summarized in LogCombiner of the BEAST package, and the first 25 million generations were discarded as burn-in. The final time tree was summarized using TreeAnnotator v2.6.7, using the maximum clade credibility tree option and fixing node heights as mean heights. The consensus tree was further visualized using FigTree v1.6 (http://tree.bio.ed.ac.uk/software/figtree/, accessed on 26 November 2021), and divergence time bars were obtained automatically from the output using the 95% highest posterior density (HPD) of the ages for each node.

3. Results

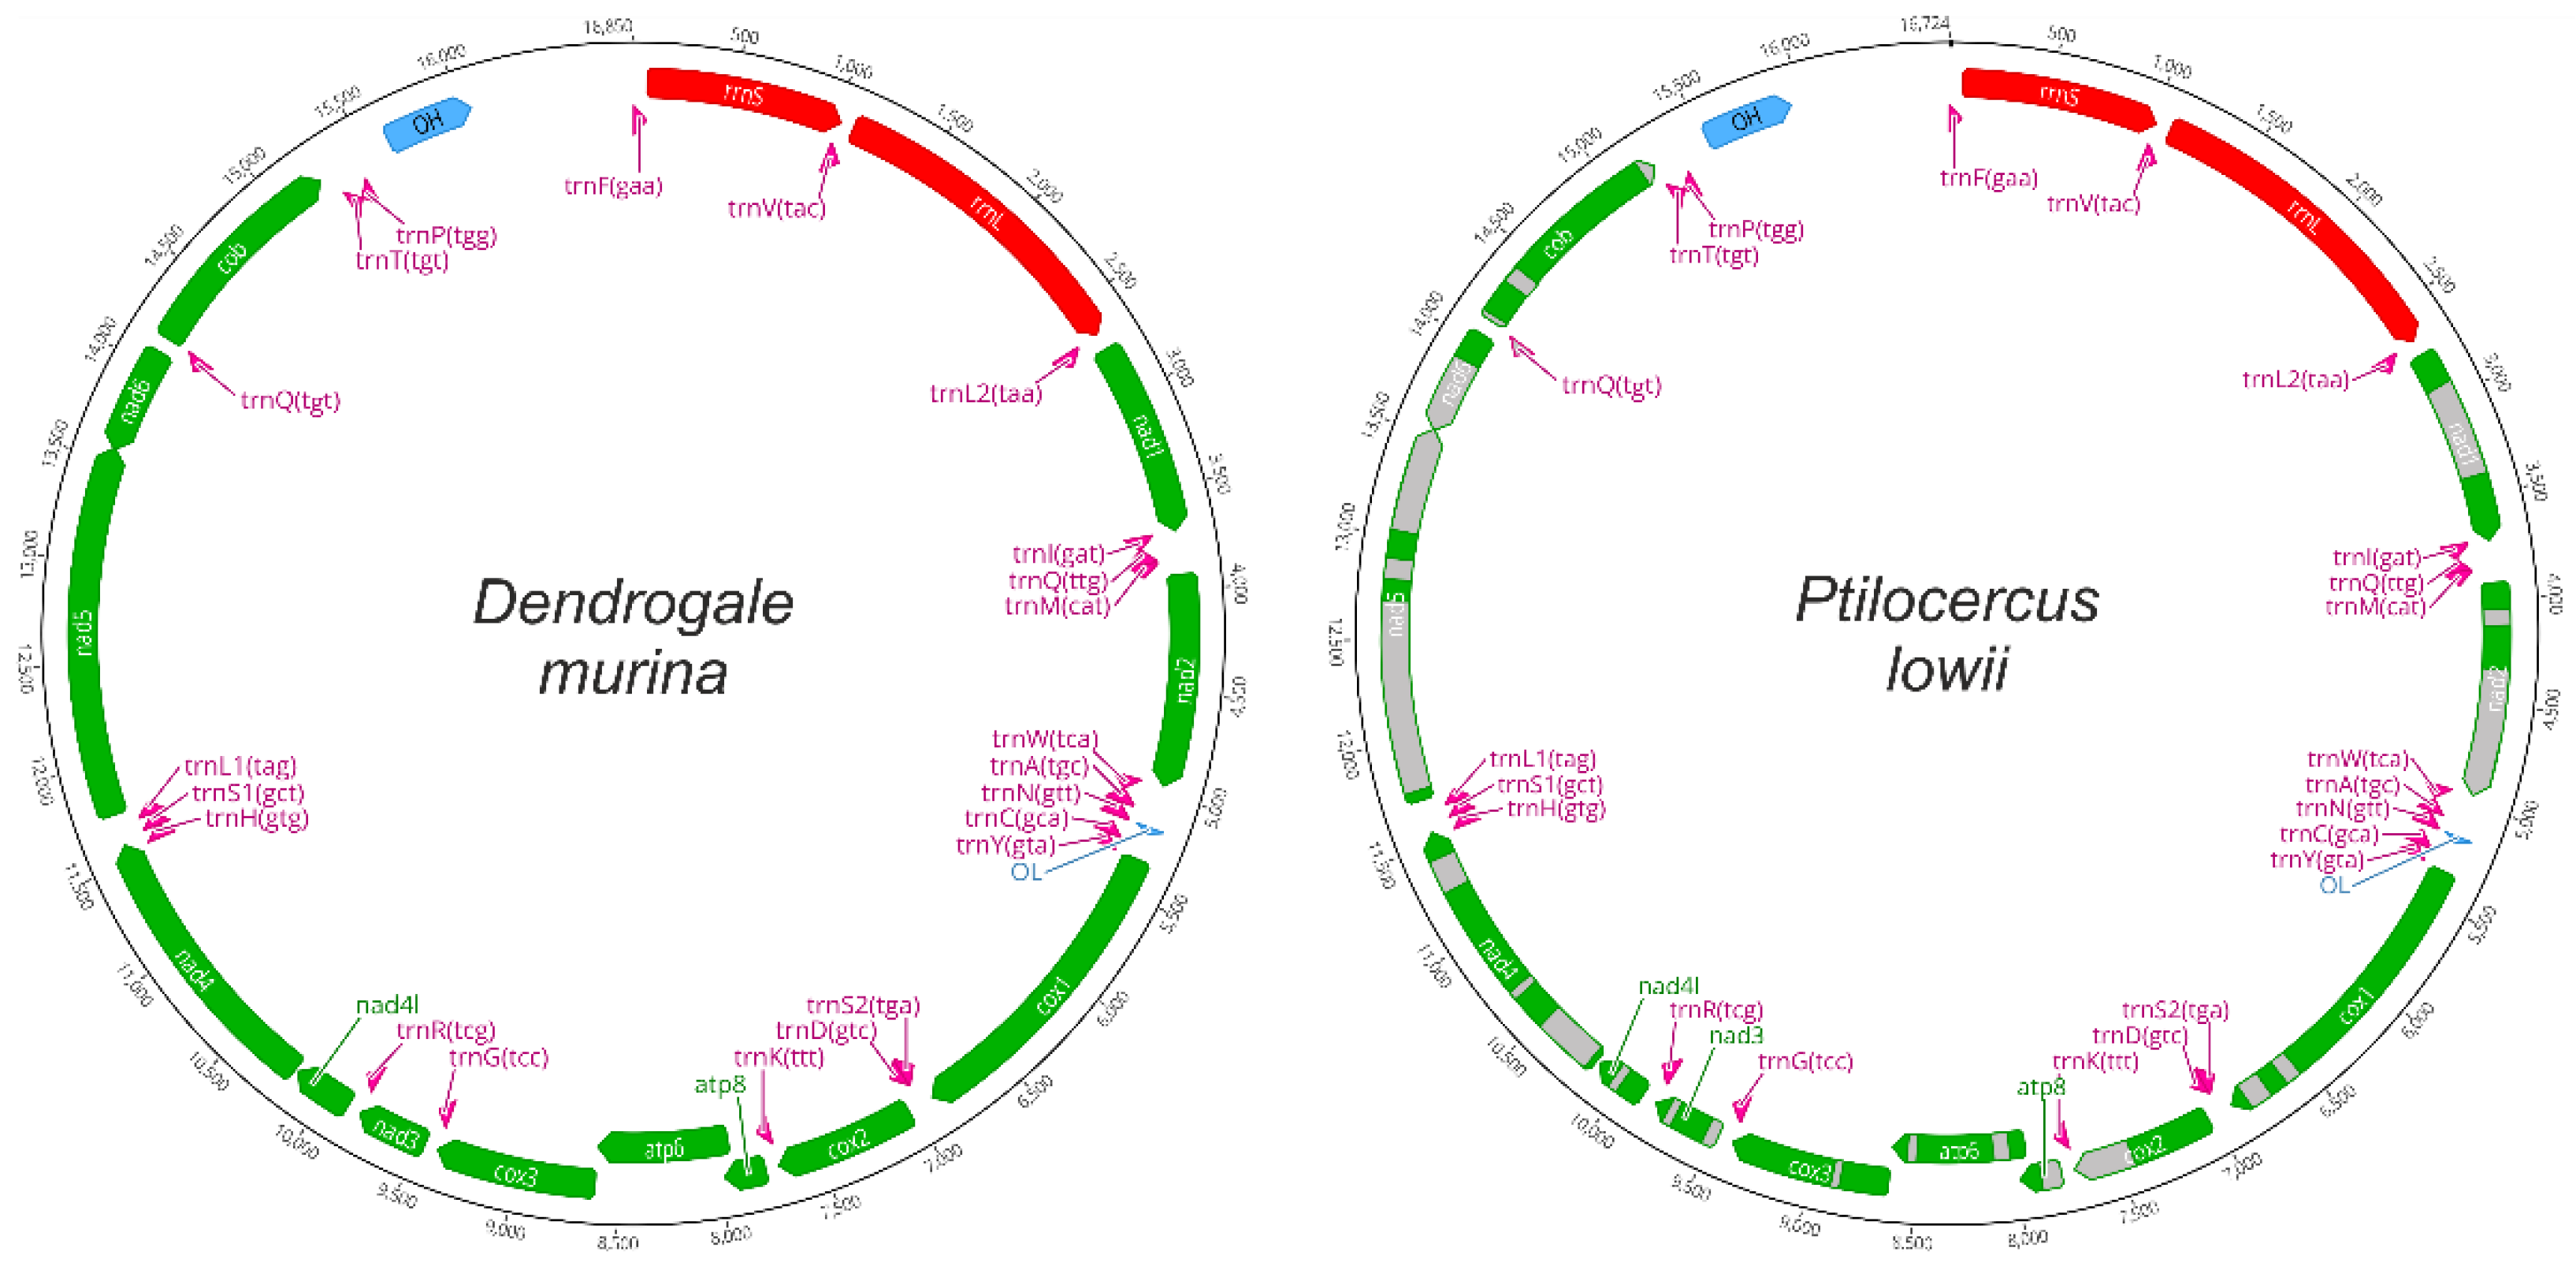
3.1. Mitochondrial Genome Structure and Composition

In total, for two samples of D. murina, we obtained 37,517,290 and 16,452,636 raw pair-end reads of 75 bp in length. The average quality level was 36 on the Phred 33 scale. After filtering and cleaning from adapters, the total numbers of reads were 35,624,387 and 15,046,431, respectively, and of the same quality value.
The average coverage of the reference mitochondrial genome (a consensus of six Tupaia mitochondrial genomes) was 79.5% (13,361 of 16,807 bp), and the mean coverage depth comprised ~180× in the case for the P. lowii raw-reads alignment.
The complete mitochondrial genome of the northern smooth-tailed treeshrew D. murina was assembled and annotated in the current study. Data were submitted to the NCBI Nucleotide database with the accession numbers OP006204 and OP006205. It is a closed circular molecule of 16,844–16,850 bp in length and contains 37 genes—the typical set of 13 protein-coding genes (PCGs), 2 ribosomal RNA (rRNAs) genes (rrnL and rrnS), 22 transfer RNA genes (tRNAs), and a putative control region (Figure 2). The percentage of GC pairs is about 39.4%. The nucleotide composition is A, C, G, and T of approximately 33.5%, 25.5%, 13.9%, and 27.1%, respectively. The AT skew and GC skew values composed 0.11 and −0.29–−0.30, respectively, in the two assembled mitochondrial genomes of D. murina. Nine genes (ND6 and eight tRNAs) were oriented in the reverse direction, whereas the others were transcribed in the forward direction. A total of 11 overlapping regions with a total length of 71 bp were identified in the D. murina mitochondrial genomes. The longest overlap of 43 bp in length is located between ATP synthase F0 subunits ATP8 and ATP6.
The initial codons for 13 PCGs of D. murina were the canonical putative start codons (ATG for ND1, COX1, COX2, ATP8, ATP6, COX3, ND4L, ND4, ND6, and CYTB and ATT for ND2, ND3, and ND5). The typical termination codon (TAA or TAG) occurs in nine PCGs (ND1, ND2, COX2, ATP8, ATP6, COX3, ND4L, ND5, and CYTB); COX1 and ND6 terminated with AGA, ND3, and ND4; and TAA stop codon is completed by the addition of 3’ A residues to the mRNA. Detailed information about the completeness and lengths of 13 mitochondrial protein-coding genes of D. murina and P. lowii is given in Table 1.
In protein-coding genes, all the amino acids, except Tyr, are varied in codons. Amino acids Leu and Ser turned out to be the most diverse, with the frequency of CTA (31.4%), CTC (12.9%), CTG (7.8%), CTT (15.0%), TTA (25.3%), and TTG (7.5%) for Leu and AGC (18.3%), AGT (12.1%), TCA (26.6%), TCC (17.0%), TCG (4.5%), and TCT (21.5%) for Ser.
For the P. lowii, we succeeded in assembling a fragmented mitochondrial genome (Figure 2 and Table 1). Two ribosomal RNA genes 12S and 16S were complete. From the protein-coding genes, we assembled a total length of 6856 bp (approximately 61% of 13 PCGs’ length when mapping to a Tupaia consensus sequence as a reference). The best assembled were COX1, COX3, and ND4L, as they have collected more than 90% of the protein-coding-gene length. The assemblage of genes ND5 and ND6 was the worst of all, for which the length was 16% and 27% of the length of the whole gene, respectively. For the remaining protein-coding genes, 39 to 86% of the length was assembled. The partial mitochondrial genome of P. lowii was uploaded to GitHub: https://github.com/ZaTaxon/Ptilocercus_lowii.

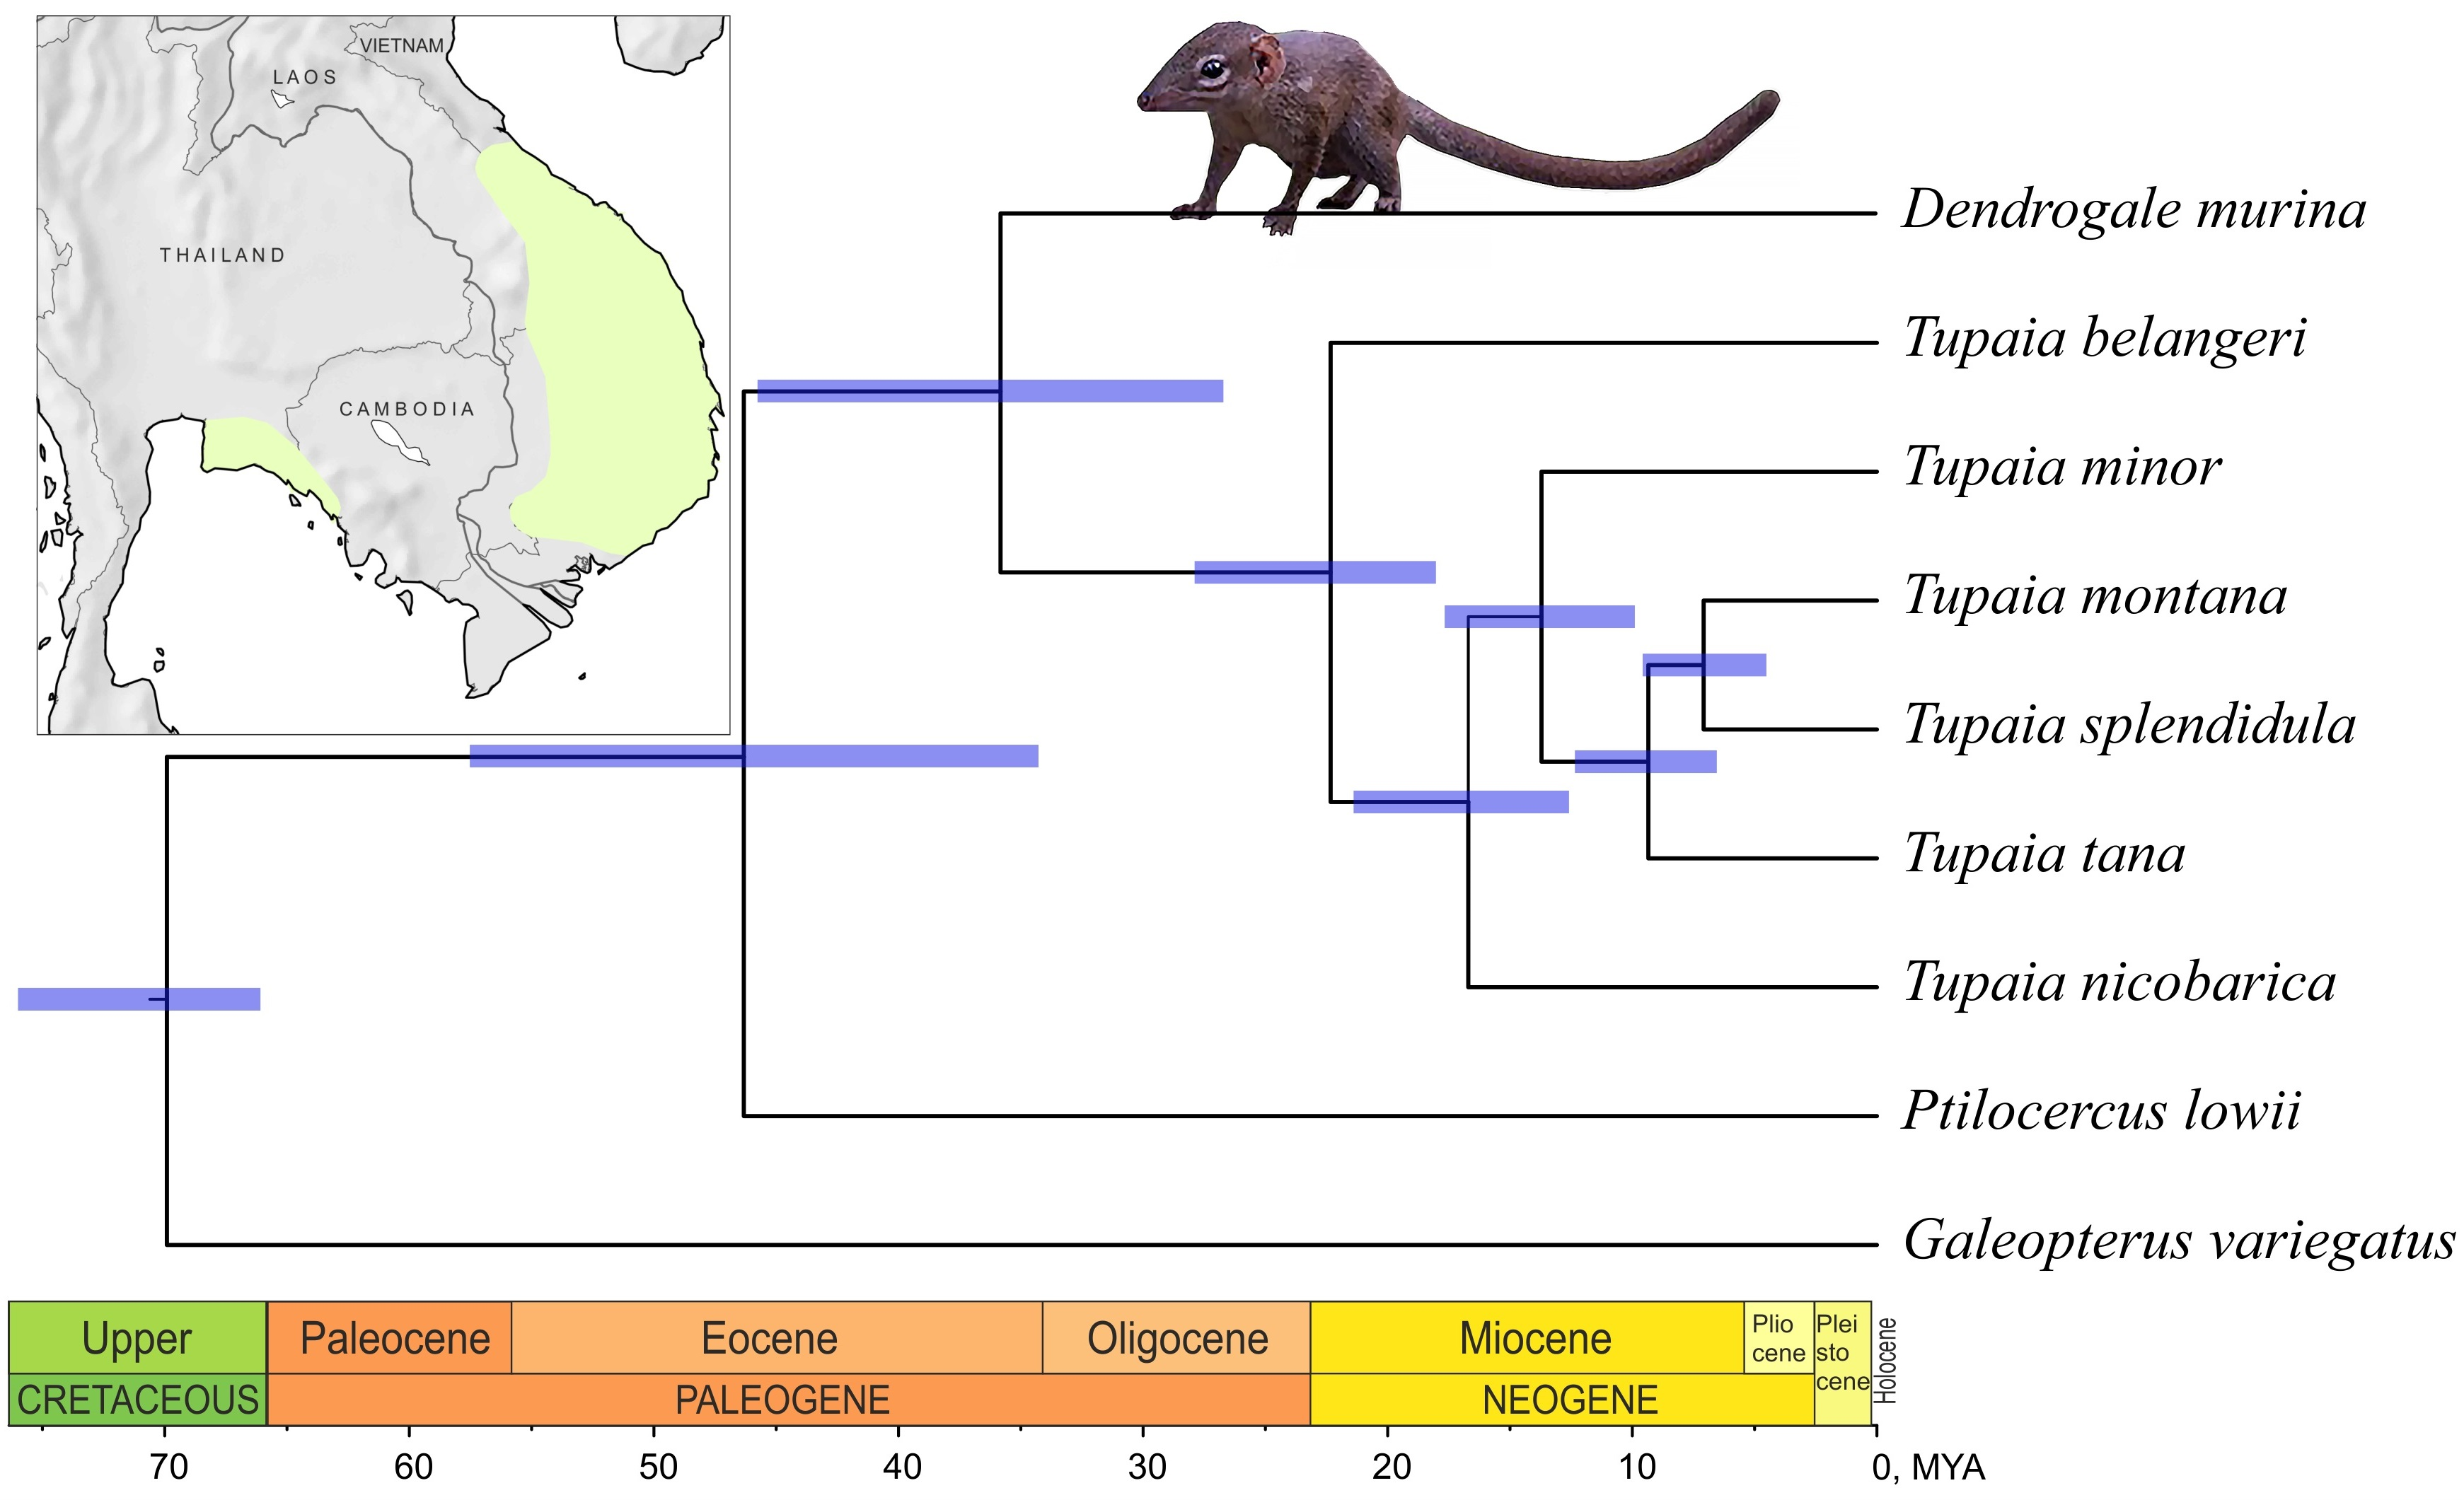
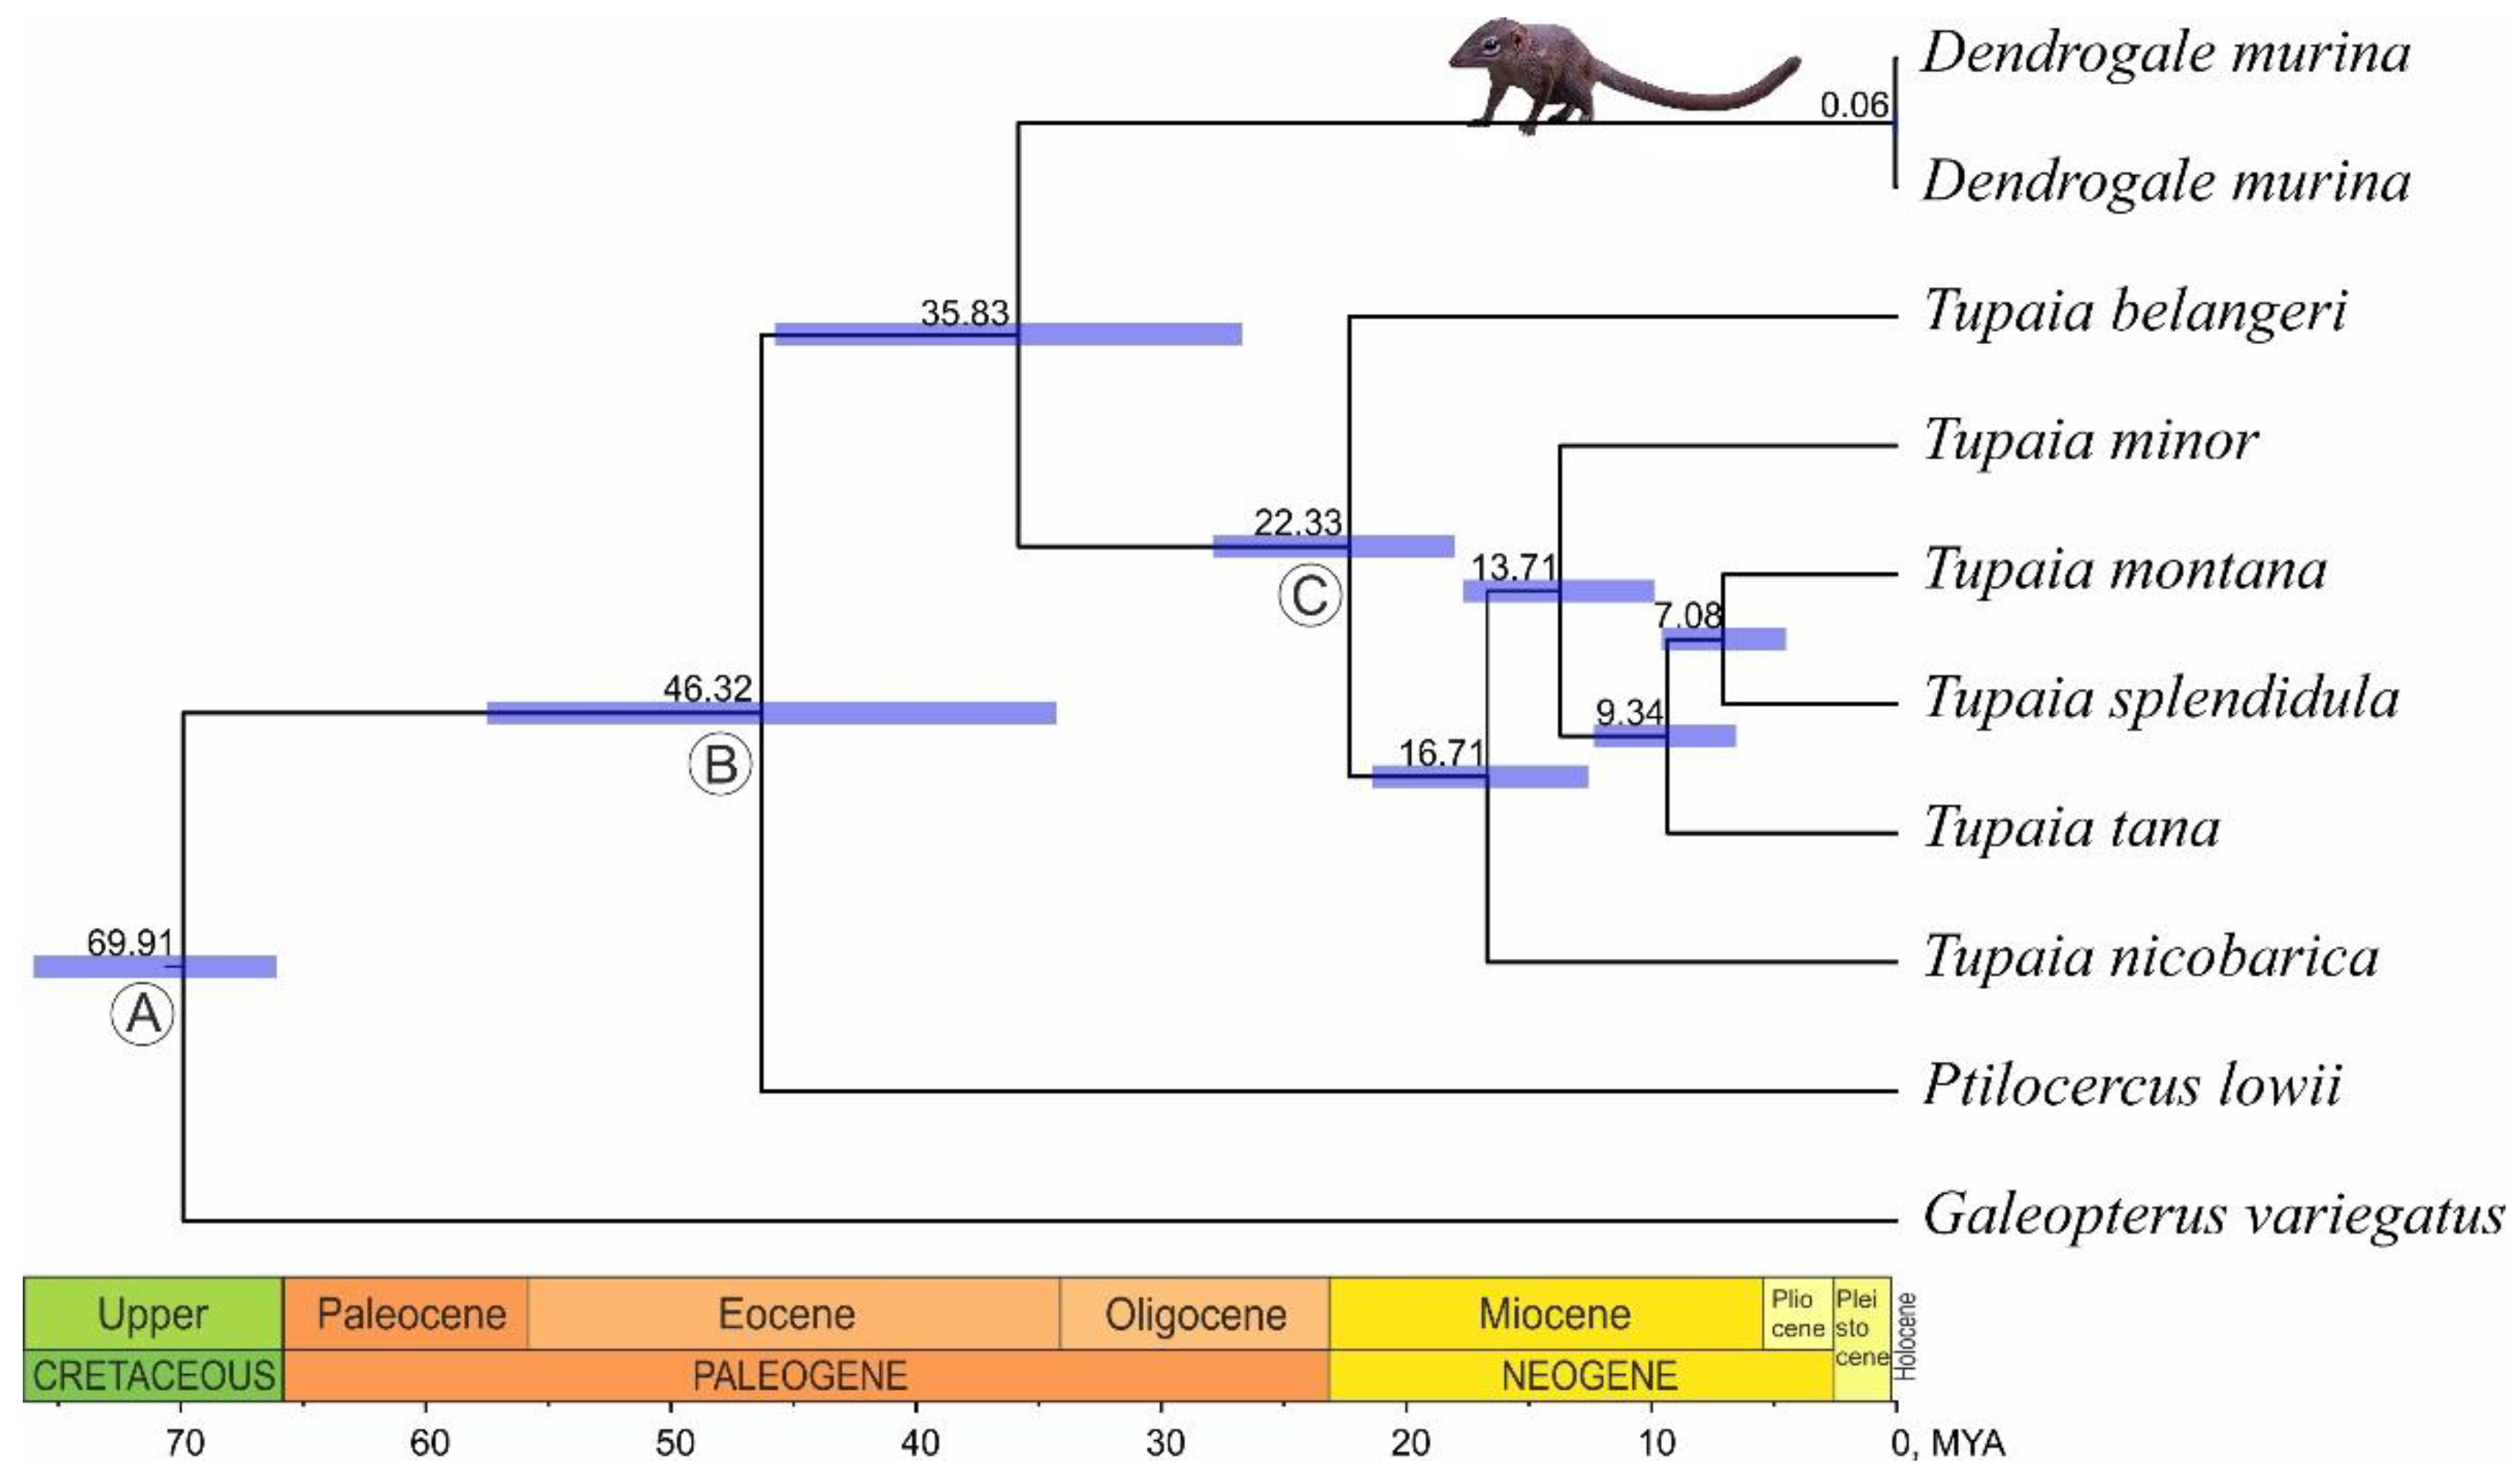
3.2. Phylogenetic Reconstruction and Divergence Time Estimation

Bayesian inference (BI) and maximum-likelihood (ML) analyses for the order Scandentia based on mitochondrial genomes showed the absolutely resolved phylogenetic tree with 1.0 Bayesian posterior probabilities and 100% ML bootstrap support values for all nodes. Phylogenetic reconstruction showed the earlier derivation of Ptilocercus and its sister position to the rest of the group uniting Dendrogale and Tupaia genera clades (Figure 3). In turn within the latter, all studied Tupaia species form the monophyletic group sister to the Dendrogale clade.
The separation time of the Dendrogale genus is estimated as an average of 35.8 MYA and 95% HPD of 45.76-26.72 MYA. P. lowii separation is about 46.3 MYA (95% HPD of 57.53-34.28 MYA). Tupaia first divergence is estimated as an average 22.3 MYA (95% HPD of 27.89-18.03 MYA) (Table 2).

4. Discussion

4.1. New Mitochondrial Genomes Assembled

In the current study, we, for the first time, sequenced and de novo assembled the complete mitochondrial genome of the northern smooth-tailed treeshrew D. murina. In addition, we partially assembled the mitochondrial genome of the most primitive, basal representative of the order, the pen-tailed treeshrew P. lowii, from the SRA data available in the NCBI SRA database. The gene order and organization of the mitochondrial genome of D. murina, along with mitochondrial genomes of other representatives of the family Tupaiidae, showed a structure typical for other vertebrates [42]. The nucleotide composition, AT and GC skew values of two D. murina specimens, are highly similar. Mitochondrial genomes of D. murina are relatively GC-poor (39.4%) compared with Tupaia mitochondrial genomes (where it was above 40%).

4.2. The Phylogenetic Relationships of Genera within the Order and Time Estimates

We present the first phylogenetic reconstruction for the order Scandentia, including two basal genera Dendrogale and Ptilocercus, based on mitochondrial genomes.
Bayesian inference analysis showed the robustly supported phylogenetic tree with a conventional taxon pattern, revealed previously using individual molecular markers [11]. Thus, the mitochondrial genome-based phylogeny finally resolved the issue on the position of Dendrogale among the treeshrews, placing the Dendrogale as sister to the rest of the Tupaiidae. Among the hypotheses based on the morphological evidence, complete mitochondrial genome analysis supports the hypotheses of Luckett [20] and Olson et al. [10] and disagrees with the hypotheses proposed by Butler [18] and Steele [19]. The topology obtained on the base of mitochondrial genomes is also in agreement with one received in the analysis of a single 12S rRNA gene by Olson et al. [21]. The family Ptilocercidae, which is represented with the only species, P. lowii, holds the sister position to D. murina and six analyzed species of the Tupaia genus (Tupaiidae family) within the order Scandentia (Figure 3). The latter arrangement is also in good agreement with phylogenetic hypotheses based both on morphological and molecular evidence [10,20,21]. Therefore, obtained results in a given case demonstrate a very good consistency in phylogenetic inference between molecular and morphological data in the case where morphological characters are thoroughly treated. A clear example of this is demonstrated in the results of three independent morphological studies of Scandentia [18,19,20]. The detailed study of quantitative and qualitative variations of exclusively dental features [19] both in a distance-based (UPGMA) analysis [19] and in further reanalysis of the same data set under the criterion of maximum parsimony [10] failed to provide phylogenetic resolution, and Dendrogale was placed within the genus Tupaia. The other study also considered exclusively dental characters [18] but, with greater attention to evaluation of character states, resulted in an equally parsimonious hypothesis of the position of Dendrogale either as nested within Tupaiidae or its basal-most member. Finally, the integrative analysis of dental, cranial, postcranial, and soft anatomical features unambiguously proposed phylogeny, supporting a sister relationship between Dendrogale and the remaining tupaiine genera [20], the one supported here by mitochondrial genome data. This case highlights the significant role of rigorous morphological studies in phylogenetics systematics. However, it should be underlined that such a good consistency in topology was achieved only with the long branches of the tree leading to taxa of the generic rank. We speculate that in the case of long evolutionary history, such consistency is not surprising, and it should be remembered here that Scandentia are often considered to be “living fossils”. However, in the case of fast explosive evolution, the unresolved phylogenies representing hard polytomies are more often and discordance between morphological and molecular trees, which is commonplace.
The branching order within the Scandentia is stable, but the dates of individual nodes differ depending on the data included in the analysis and the fossil calibrations used. The separation time of the Dendrogale genus is estimated as Late Eocene with an average of 35.8 MYA. Due to the use of a younger calibration point at the root [38,39] and the addition of a calibration point to the node B, the common ancestor of Tupaia, Dendrogale, and Ptilocercus genera, we observe an increase in the age of basal nodes within the genus Tupaia compared to the results of Kundu et al. [26]. Our result of dating the divergence of Dendrogale and Tupaia genera is slightly older than shown in Roberts et al. [11], who dated this split approximately to the Eocene–Oligocene boundary based on the analysis of mitochondrial ribosomal genes 12S, tRNA-Val, and 16S. The estimated separation time of Ptilocercus, on the contrary, is younger—about 46 MYA compared to the estimate of about 60 MYA made by Roberts et al. [11].
The mitochondrial genome sequencing data of the two earliest diverged genera within order Scandentia presented here may serve as an essential genetic resource for conservation purposes and for future studies of adaptive evolution of this ancient group. To better understand the overall phylogeny of this group, additional mitogenome sequences from genera Anathana and Urogale should be analyzed. However, further detailing of evolutionary history at the species level and beyond will necessarily require nuclear genes and transcriptomic data to provide better phylogenetic resolution at the tip nodes.

5. Conclusions

The complete mitochondrial genome of the northern smooth-tailed treeshrew D. murina was sequenced for the first time, and the partial mitochondrial genome of P. lowii was assembled from previously published SRA data. Phylogenetic analysis of Scandentia mitochondrial genomes showed a consistency with results of morphological studies, thus highlighting the significant role of rigorous morphological studies in phylogenetics systematics. The whole mitochondrial genome sequencing of D. murina is essential as a genetic resource for conservation purposes and for future studies of adaptive evolution within the Scandentia. For the final analysis of the phylogeny of the order Scandentia at the generic level, mitogenomic data for two monotypic genera, Anathana and Urogale within the Family Tupaiidae, are still lacking. For species-level phylogeny and taxonomy, nuclear genes and transcriptomic data should be used to provide better resolution.

Author Contributions

T.P., Methodology, Software, Investigation, Formal analysis, Writing—original draft, Writing—review and editing; O.B., Methodology, Software, Investigation, Writing—review and editing; S.B., Data curation, Methodology, Software, Writing—review and editing; A.A., Data curation, Resources, Writing—original draft, Writing—review and editing, Project administration, Funding acquisition; N.A., Data curation, Resources, Writing—original draft, Writing—review and editing, Project administration. All authors have read and agreed to the published version of the manuscript.

Funding

Funding for this study was provided by the Ministry of Science and Higher Education of the Russian Federation, project 075-15-2021-1069.

Institutional Review Board Statement

Not applicable.

Data Availability Statement

Mitochondrial genomes of D. murina were submitted to the NCBI GenBank database under the accession numbers OP006204 and OP006205. The partial mitochondrial genome of P. lowii was uploaded to github: https://github.com/ZaTaxon/Ptilocercus_lowii.

Acknowledgments

Field studies in Vietnam were possible due to the support of the Joint Vietnamese-Russian Tropical Research and Technological Centre, Hanoi, Vietnam. We would like to express our thanks to A.N. Kuznetsov, Nguyen Dang Hoi, and A.V. Shchinov for their great help and scientific expertise during the field work. The mitochondrial genome was sequenced in the Core Sequencing Center of Kurchatov Center for Genome Research (National Research Center “Kurchatov Institute”, Russia).

Conflicts of Interest

The authors declare no conflict of interest.

References

  1. Martin, R.D. Primate Origins and Evolution; Princeton University Press: Princeton, NJ, USA, 1990. [Google Scholar]
  2. MacPhee, R.D.E. (Ed.) Primates and Their Relatives in Phylogenetic Perspective; Plenum Press: New York, NY, USA, 1993. [Google Scholar]
  3. Murphy, W.J.; Eizirik, E.; Johnson, W.E.; Zhang, Y.P.; Ryder, O.A.; O’Brien, S.J. Molecular Phylogenetics and the Origins of Placental Mammals. Nature 2001, 409, 614–618. [Google Scholar] [CrossRef] [PubMed]
  4. Silcox, M.T. A Phylogenetic Analysis of Plesiadapiformes and Their Relationship to Euprimates and Other Archontans. Ph.D. Thesis, Johns Hopkins University School of Medicine, Baltimore, MD, USA, 2001. [Google Scholar]
  5. Bloch, J.I.; Boyer, D.M. Grasping Primate Origins. Science 2002, 298, 1606–1610. [Google Scholar] [CrossRef] [Green Version]
  6. Sargis, E.J. A Preliminary Qualitative Analysis of the Axial Skeleton of Tupaiids (Mammalia, Scandentia): Functional Morphology and Phylogenetic Implications. J. Zool. 2001, 253, 473–483. [Google Scholar] [CrossRef]
  7. Sargis, E.J. Functional Morphology of the Forelimb of Tupaiids (Mammalia, Scandentia) and Its Phylogenetic Implications. J. Morphol. 2002, 253, 10–42. [Google Scholar] [CrossRef]
  8. Sargis, E.J. Functional Morphology of the Hindlimb of Tupaiids (Mammalia, Scandentia) and Its Phylogenetic Implications. J. Morphol. 2002, 254, 149–185. [Google Scholar] [CrossRef]
  9. Sargis, E.J. The Postcranial Morphology of Ptilocercus Lowii (Scandentia, Tupaiidae): An Analysis of Primatomorphan and Volitantian Characters. J. Mamm. Evol. 2002, 9, 137–160. [Google Scholar] [CrossRef]
  10. Olson, L.E.; Sargis, E.J.; Martin, R.D. Phylogenetic Relationships among Treeshrews (Scandentia): A Review and Critique of the Morphological Evidence. J. Mamm. Evol. 2004, 11, 49–71. [Google Scholar] [CrossRef]
  11. Roberts, T.E.; Lanier, H.C.; Sargis, E.J.; Olson, L.E. Molecular Phylogeny of Treeshrews (Mammalia: Scandentia) and the Timescale of Diversification in Southeast Asia. Mol. Phylogenet. Evol. 2011, 60, 358–372. [Google Scholar] [CrossRef]
  12. Helgen, K.M. Order Scandentia. In Mammal Species of the World, 3rd ed.; Wilson, D.E., Reeder, D.M., Eds.; The Johns Hopkins University Press: Baltimore, MD, USA, 2005; pp. 104–109. [Google Scholar]
  13. Li, Q.; Ni, X. An Early Oligocene Fossil Demonstrates Treeshrews Are Slowly Evolving “Living Fossils”. Sci. Rep. 2016, 6, 18627. [Google Scholar] [CrossRef] [PubMed] [Green Version]
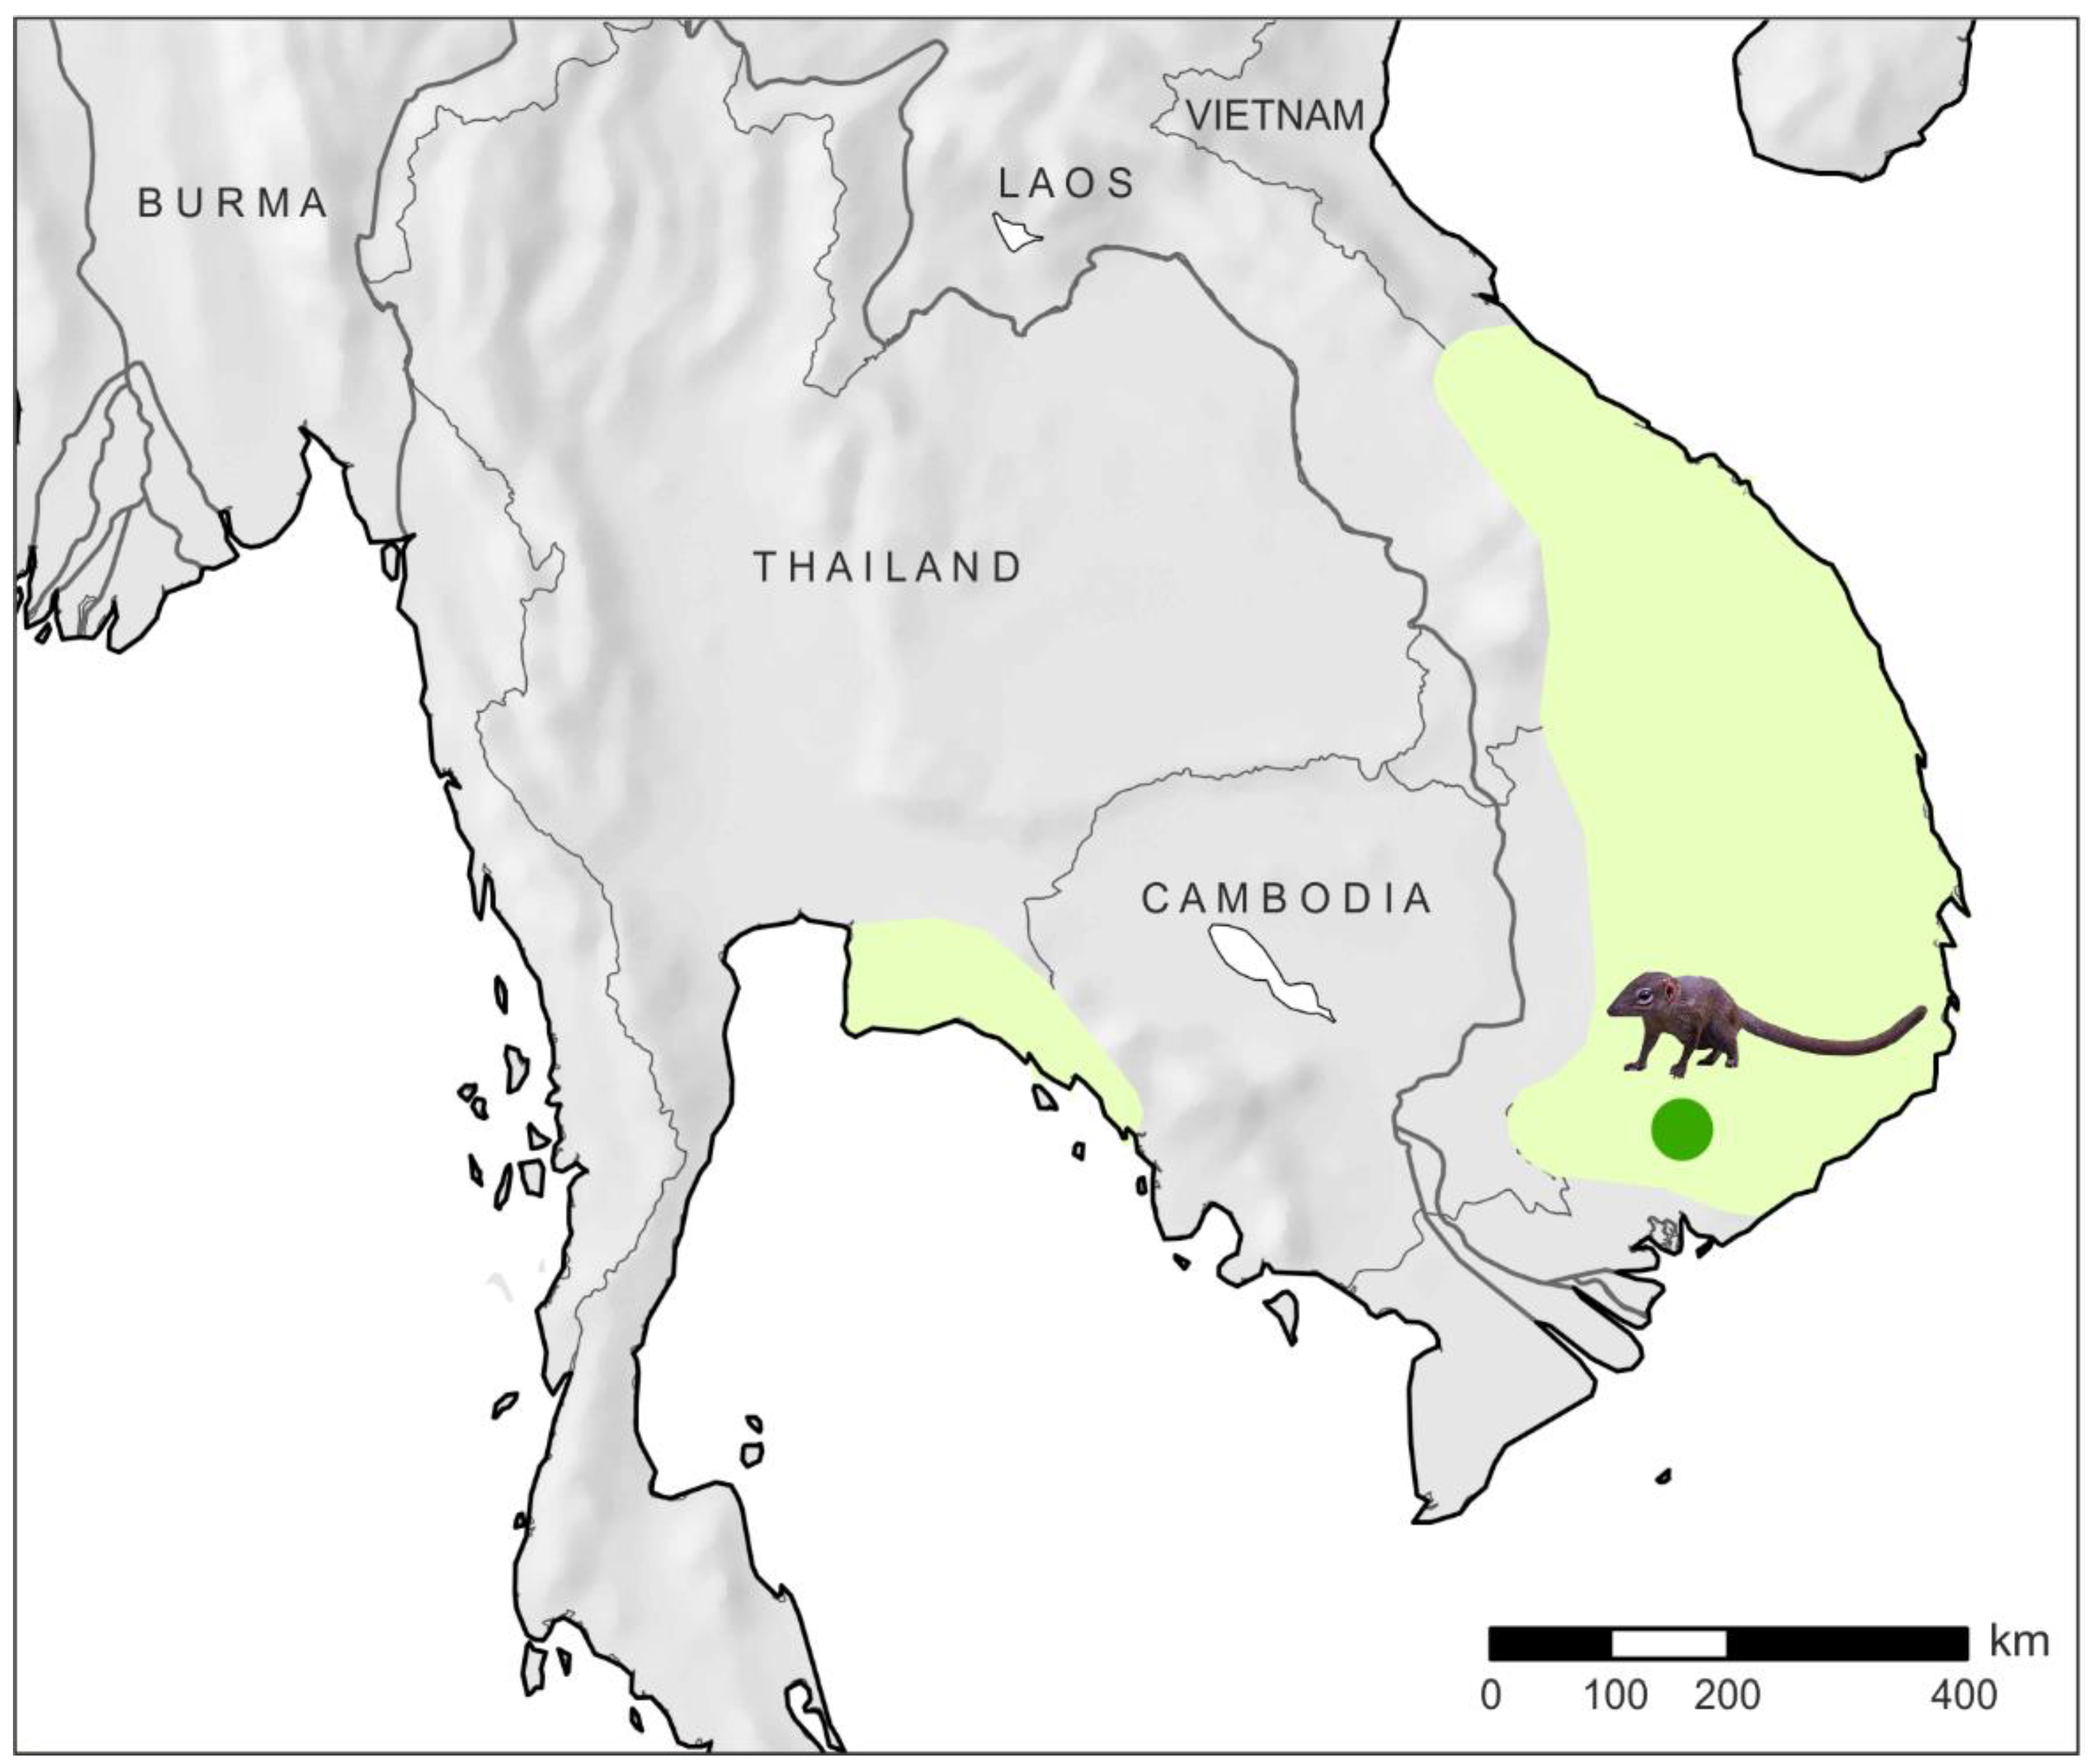
  14. Timmins, R.J.; Duckworth, J.W.; Robson, C.R.; Walston, J.L. Distribution, Status and Ecology of the Mainland Slender-Tailed Treeshrew Dendrogale murina: Status of Dendrogale murina. Mammal Rev. 2003, 33, 272–283. [Google Scholar] [CrossRef]
  15. Timmins, R.J. IUCN Red List of Threatened Species: Dendrogale murina. IUCN Red List Threat. Species 2016, e.T41490A22278606. [Google Scholar] [CrossRef]
  16. Hawkins, M.T.R. Family Tupaiidae (Treeshrews). In Insectivores, Sloths and Colugos; Handbook of the Mammals of the World; Lynx Edicions: Barcelona, Spain, 2018; pp. 242–269. [Google Scholar]
  17. Francis, C. Field Guide to the Mammals of South-East Asia, 2nd ed.; Bloomsbury Publishing: London, UK, 2019. [Google Scholar]
  18. Butler, P.M. The Tupaiid Dentition. In Comparative Biology and Evolutionary Relationships of Tree Shrews; Luckett, W.P., Ed.; Springer US: Boston, MA, USA, 1980; pp. 171–204. ISBN 978-1-4684-1053-2. [Google Scholar]
  19. Steele, D.G. Dental Variability in the Tree Shrews (Tupaiidae). In Craniofacial Biology of Primates: Symposium of the 4th International Congress of Primatology; Zingeser, M.R., Ed.; Karger: Basel, Switzerland, 1973; pp. 154–179. [Google Scholar]
  20. Luckett, W.P. The Suggested Evolutionary Relationships and Classification of Tree Shrews. In Comparative Biology and Evolutionary Relationships of Tree Shrews; Luckett, W.P., Ed.; Springer US: Boston, MA, USA, 1980; pp. 3–31. ISBN 978-1-4684-1053-2. [Google Scholar]
  21. Olson, L.E.; Sargis, E.J.; Martin, R.D. Intraordinal Phylogenetics of Treeshrews (Mammalia: Scandentia) Based on Evidence from the Mitochondrial 12S RRNA Gene. Mol. Phylogenet. Evol. 2005, 35, 656–673. [Google Scholar] [CrossRef] [PubMed]
  22. Roberts, T.E.; Sargis, E.J.; Olson, L.E. Networks, Trees, and Treeshrews: Assessing Support and Identifying Conflict with Multiple Loci and a Problematic Root. Syst. Biol. 2009, 58, 257–270. [Google Scholar] [CrossRef] [PubMed]
  23. Zhang, L.; Sun, K.; Csorba, G.; Hughes, A.C.; Jin, L.; Xiao, Y.; Feng, J. Complete Mitochondrial Genomes Reveal Robust Phylogenetic Signals and Evidence of Positive Selection in Horseshoe Bats. BMC Ecol. Evol. 2021, 21, 199. [Google Scholar] [CrossRef] [PubMed]
  24. Abramson, N.I.; Bodrov, S.Y.; Bondareva, O.V.; Genelt-Yanovskiy, E.A.; Petrova, T.V. A Mitochondrial Genome Phylogeny of Voles and Lemmings (Rodentia: Arvicolinae): Evolutionary and Taxonomic Implications. PLoS ONE 2021, 16, e0248198. [Google Scholar] [CrossRef] [PubMed]
  25. Hassanin, A.; Veron, G.; Ropiquet, A.; Jansen van Vuuren, B.; Lécu, A.; Goodman, S.M.; Haider, J.; Nguyen, T.T. Evolutionary History of Carnivora (Mammalia, Laurasiatheria) Inferred from Mitochondrial Genomes. PLoS ONE 2021, 16, e0240770. [Google Scholar] [CrossRef]
  26. Kundu, S.; Pakrashi, A.; Kamalakannan, M.; Singha, D.; Tyagi, K.; Banerjee, D.; Venkatraman, C.; Kumar, V. Complete Mitogenome of the Endangered and Endemic Nicobar Treeshrew (Tupaia Nicobarica) and Comparison with Other Scandentians. Sci. Rep. 2022, 12, 877. [Google Scholar] [CrossRef] [PubMed]
  27. Andrews, S. FastQC: A Quality Control Tool for High Throughput Sequence Data. 2010. Available online: https://www.bioinformatics.babraham.ac.uk/projects/fastqc/ (accessed on 1 September 2019).
  28. Bolger, A.M.; Lohse, M.; Usadel, B. Trimmomatic: A Flexible Trimmer for Illumina Sequence Data. Bioinformatics 2014, 30, 2114–2120. [Google Scholar] [CrossRef] [PubMed] [Green Version]
  29. Chen, S.; Zhou, Y.; Chen, Y.; Gu, J. Fastp: An Ultra-Fast All-in-One FASTQ Preprocessor. Bioinformatics 2018, 34, i884–i890. [Google Scholar] [CrossRef] [PubMed]
  30. Bankevich, A.; Nurk, S.; Antipov, D.; Gurevich, A.A.; Dvorkin, M.; Kulikov, A.S.; Lesin, V.M.; Nikolenko, S.I.; Pham, S.; Prjibelski, A.D.; et al. SPAdes: A New Genome Assembly Algorithm and Its Applications to Single-Cell Sequencing. J. Comput. Biol. 2012, 19, 455–477. [Google Scholar] [CrossRef] [PubMed] [Green Version]
  31. Antipov, D.; Hartwick, N.; Shen, M.; Raiko, M.; Lapidus, A.; Pevzner, P.A. PlasmidSPAdes: Assembling Plasmids from Whole Genome Sequencing Data. Bioinformatics 2016, 32, btw493. [Google Scholar] [CrossRef] [PubMed] [Green Version]
  32. Bernt, M.; Donath, A.; Jühling, F.; Externbrink, F.; Florentz, C.; Fritzsch, G.; Pütz, J.; Middendorf, M.; Stadler, P.F. MITOS: Improved de Novo Metazoan Mitochondrial Genome Annotation. Mol. Phylogenet. Evol. 2013, 69, 313–319. [Google Scholar] [CrossRef] [PubMed]
  33. Perna, N.T.; Kocher, T.D. Patterns of Nucleotide Composition at Fourfold Degenerate Sites of Animal Mitochondrial Genomes. J. Mol. Evol. 1995, 41, 353–358. [Google Scholar] [CrossRef] [PubMed]
  34. Darling, A.C.E.; Mau, B.; Blattner, F.R.; Perna, N.T. Mauve: Multiple Alignment of Conserved Genomic Sequence with Rearrangements. Genome Res. 2004, 14, 1394–1403. [Google Scholar] [CrossRef] [Green Version]
  35. Kalyaanamoorthy, S.; Minh, B.Q.; Wong, T.K.F.; von Haeseler, A.; Jermiin, L.S. ModelFinder: Fast Model Selection for Accurate Phylogenetic Estimates. Nat. Methods 2017, 14, 587–589. [Google Scholar] [CrossRef] [Green Version]
  36. Trifinopoulos, J.; Nguyen, L.-T.; von Haeseler, A.; Minh, B.Q. W-IQ-TREE: A Fast Online Phylogenetic Tool for Maximum Likelihood Analysis. Nucleic Acids Res. 2016, 44, W232–W235. [Google Scholar] [CrossRef] [Green Version]
  37. Bouckaert, R.; Heled, J.; Kühnert, D.; Vaughan, T.; Wu, C.-H.; Xie, D.; Suchard, M.A.; Rambaut, A.; Drummond, A.J. BEAST 2: A Software Platform for Bayesian Evolutionary Analysis. PLoS Comput. Biol. 2014, 10, e1003537. [Google Scholar] [CrossRef] [Green Version]
  38. De Vries, D.; Beck, R.M.D. Total Evidence Tip-Dating Phylogeny of Platyrrhine Primates and 27 Well-Justified Fossil Calibrations for Primate Divergences. Evol. Biol. 2021. [Google Scholar] [CrossRef]
  39. Wilson Mantilla, G.P.; Chester, S.G.B.; Clemens, W.A.; Moore, J.R.; Sprain, C.J.; Hovatter, B.T.; Mitchell, W.S.; Mans, W.W.; Mundil, R.; Renne, P.R. Earliest Palaeocene Purgatoriids and the Initial Radiation of Stem Primates. R. Soc. Open Sci. 2021, 8, 210050. [Google Scholar] [CrossRef] [PubMed]
  40. Mein, P.; Ginsburg, L. Les Mammifères Du Gisement Miocène Inférieur de Li Mae Long, Thaïlande: Systématique, Biostratigraphie et Paléoenvironnement. Geodiversitas 1997, 19, 783–844. [Google Scholar]
  41. Rambaut, A.; Drummond, A.J.; Xie, D.; Baele, G.; Suchard, M.A. Posterior Summarization in Bayesian Phylogenetics Using Tracer 1.7. Syst. Biol. 2018, 67, 901–904. [Google Scholar] [CrossRef] [Green Version]
  42. Anderson, S.; de Bruijn, M.H.L.; Coulson, A.R.; Eperon, I.C.; Sanger, F.; Young, I.G. Complete Sequence of Bovine Mitochondrial DNA Conserved Features of the Mammalian Mitochondrial Genome. J. Mol. Biol. 1982, 156, 683–717. [Google Scholar] [CrossRef] [PubMed]
Figure 1. Dendrogale murina distribution range and collection locality. Distribution range is given according to Timmins [15].
Genes 14 00624 g001
Figure 2. Map of the mitochondrial genomes of Dendrogale murina and Ptilocercus lowii. Green pointed bands mark annotations of protein-coding genes (CDs); rRNAs are marked in red, tRNAs in violet, and OH and OL (origins of heavy and light strand replication, respectively) colored with blue. Non-sequenced areas of P. lowii (SRR2577514, SRR6053052, and CYTB MK111982) mapped to Tupaia consensus sequence are marked in grey. Map of mitochondrial genomes was visualized in Geneious Prime 2019.1 and edited manually in CorelDRAW X8.
Genes 14 00624 g002
Figure 3. Bayesian phylogenetic reconstruction of Scandentia inferred from mitochondrial genomes. Posterior probabilities are 1.0 at each node. The divergence times (in MYA) were estimated by three calibration points (A, B, and C). Node labels represent mean node ages, and blue bars represent 95% highest posterior density (HPD) around mean estimates of divergence times. Tree topology and node bars were visualized in FigTree v1.6 and edited manually in CorelDRAW X8.
Genes 14 00624 g003
Table 1. List of the 13 protein-coding genes in the mitochondrial genomes of Dendrogale murina and Ptilocercus lowii.
GeneStartStopLengthDirectionfcdscdCompletenessAbsent Fragments, aa
Dendrogale murina OP006204
ND127543710957forwardATGTAGcomplete-
ND2391949621044forwardATTTAGcomplete-
COX1534468911548forwardATGAGAcomplete-
COX270287711684forwardATGTAGcomplete-
ATP877777980204forwardATGTAAcomplete-
ATP679388618681forwardATGTAAcomplete-
COX386189403786forwardATGTAAcomplete-
ND394729818347forwardATTTAA*complete-
ND4L988610,182297forwardATGTAAcomplete-
ND410,17611,5531378forwardATGTAA*complete-
ND511,75113,5621812forwardATTTAAcomplete-
ND614,07913,558522reverseATGAGAcomplete-
CYTB14,15215,2911140forwardATGTAGcomplete-
Dendrogale murina OP006205
ND127543710957forwardATGTAGcomplete-
ND2391949621044forwardATTTAGcomplete-
COX1534468911548forwardATGAGAcomplete-
COX270287711684forwardATGTAGcomplete-
ATP877777980204forwardATGTAAcomplete-
ATP679388618681forwardATGTAAcomplete-
COX386189403786forwardATGTAAcomplete-
ND394729818347forwardATTTAA*complete-
ND4L988610,182297forwardATGTAAcomplete-
ND410,17611,5531378forwardATGTAA*complete-
ND511,75213,5631812forwardATTTAAcomplete-
ND614,08013,559522reverseATGAGAcomplete-
CYTB14,15315,2921140forwardATGTAGcomplete-
Ptilocercus lowii
ND127553711957forwardATGTAGpartial2914–3418;
ND2391649571042forwardATA-partial4074–4134; 4321–4957
COX1534868891542forwardATGTAApartial6565–6619; 6751–6836
COX270327715684forwardATG-partial7421–7715
ATP877837989207forward-TAGpartial7783–7896
ATP679448624681forwardATGTAApartial8030–8106; 8496–8516
COX386249408785forwardATGTAA*partial8880–8898
ND394779823347forward-TAA*partial9477–9530; 9711–9757
ND4L989710,151255forwardATGTAApartial10,023–10,043
ND410,14511,5211377forwardATGTAApartial10,235–10,477; 10,640–10,658; 11,275–11,459
ND511,72213,5341813forwardATT-partial11,791–12,704; 12,805–12,918; 13,031–13,534
ND614,05713,537521reverseATG-partial13,537–13,918;
CYTB14,13115,2701140forward--partial14,131–14,148; 14,869–14,947; 15,203–15,270
Start—the first position along α strand; Stop—the last position along α strand; Length—the size of the sequence; fcd—first codon; scd—stop codon. For partial gene sequences, missing fragments are indicated in the last column. Cases where TAA stop codon is completed by the addition of 3’ A residues to the mRNA are marked with an asterisk.
Table 2. Divergence time estimates for the major lineages within Scandentia.
Taxon SeparatedMean95% HPD
Ptilocercus lowii 46.32 57.53–34.28
Dendrogale murina 35.83 45.76–26.72
Tupaia belangeri 22.33 27.89–18.03
Tupaia nicobarica 16.71 21.4–12.59
Tupaia minor 13.71 17.67–9.89
Tupaia tana 9.34 12.35–6.54
Tupaia montana / T. splendidula 7.08 9.58–4.52
Mean node ages 95% highest posterior density intervals are given in million years ago.
Disclaimer/Publisher’s Note: The statements, opinions and data contained in all publications are solely those of the individual author(s) and contributor(s) and not of MDPI and/or the editor(s). MDPI and/or the editor(s) disclaim responsibility for any injury to people or property resulting from any ideas, methods, instructions or products referred to in the content.

