Article

Evaluation of Candidate Reference Genes for Gene Expression Analysis in Wild Lamiophlomis rotata

1
School of Life Sciences, Qinghai Normal University, Xining 810008, China
2
Academy of Plateau Science and Sustainability, Qinghai Normal University, Xining 810008, China
3
Key Laboratory of Tibetan Plateau Medicinal Plant and Animal Resources, Qinghai Normal University, Xining 810008, China
4
Academy of Agricultural and Forestry Sciences, Qinghai University, Xining 810016, China
*
Author to whom correspondence should be addressed.
Genes 2023, 14(3), 573; https://doi.org/10.3390/genes14030573
Submission received: 19 January 2023 / Revised: 10 February 2023 / Accepted: 22 February 2023 / Published: 24 February 2023
(This article belongs to the Special Issue Feature Papers in Technologies and Resources for Genetics)

Abstract

:
Lamiophlomis rotata (Benth.) Kudo is a perennial and unique medicinal plant of the Qinghai–Tibet Plateau. It has the effects of diminishing inflammation, activating blood circulation, removing blood stasis, reducing swelling, and relieving pain. However, thus far, reliable reference gene identifications have not been reported in wild L. rotata. In this study, we identified suitable reference genes for the analysis of gene expression related to the medicinal compound synthesis in wild L. rotata subjected to five different-altitude habitats. Based on the RNA-Seq data of wild L. rotata from five different regions, the stability of 15 candidate internal reference genes was analyzed using geNorm, NormFinder, BestKeeper, and RefFinder. TFIIS, EF-1α, and CYP22 were the most suitable internal reference genes in the leaves of L. rotata from different regions, while OBP, TFIIS, and CYP22 were the optimal reference genes in the roots of L. rotata. The reference genes identified here would be very useful for gene expression studies with different tissues in L. rotata from different habitats.

1. Introduction

Real-time quantitative PCR (RT-qPCR) is an important technology for studying the gene expression pattern in the processes of plant growth and development and secondary metabolite synthesis [1,2,3,4]. It is characterized by high accuracy, strong specificity, and good repeatability [5]. In the process of DNA amplification, RT-qPCR can monitor the change in product content in real time and conduct a quantitative analysis through the change in fluorescence signal intensity, so it is often used for the study of gene expression [6]. However, the accuracy of the results of this technique is affected by various factors, such as the specificity of primers, the integrity of RNA, and the quality of cDNA. Among them, the stability of reference genes has the greatest impact [7]. The selection of appropriate internal reference genes for calibration can reduce the differences between samples and ensure the accuracy of RT-qPCR results [8]. Housekeeping genes have a stable expression and are not easily affected by environment, therefore, they are frequently used as internal reference genes for RT-qPCR analysis. Common housekeeping genes in plants include actin (ACT), 18S ribosomal RNA (18S rRNA), glyceraldehyde-3-phosphate dehydrogenase (GAPDH), elongation factor 1α (EF-1α), and polyubiquitin (UBQ) genes [9]. Given different species, tissues, and experimental conditions, the expression stability of internal reference genes will also be different [10]. For example, the stable expression of GAPDH in grape berries is the worst in wheat (Triticum aestivum) [11,12]. In the stems of Psamochloa villosa, the ACT gene is the most suitable internal reference gene for gene expression research under drought conditions, while tubulin alfa chain (TUA) is the most stable and the best internal reference gene under cold conditions [13]. Therefore, screening internal reference genes in accordance with different species, tissues, and experimental conditions is necessary to ensure the accuracy of RT-qPCR results [14].
L. rotata (Benth.) Kudo (L. rotata) is a perennial wild herb of the Lamiaceae family, which is widely distributed in the Qinghai, Tibet, Sichuan, and Gansu provinces of China. It grows in meadow, grassland, and sand gravel regions at altitudes between 3100 and 5100 m. It is a commonly used Chinese herbal medicine of Tibetan, Naxi, Mongolian, and other ethnic groups in China [15,16]. The roots and leaves of L. rotata contain various active ingredients, such as iridoids, flavonoids, and phenylethanol glycosides [17,18,19]. In clinical practice, this herbal medicine is mainly used to treat traumatic bleeding, bruises, and other diseases [20,21,22]. The iridoid compounds, represented by gardenoside methyl ester and 8-O-acetyl gardenoside methyl ester, which have good hemostatic and procoagulant effects, are the main medicinal components of L. rotata [22]. Present research on L. rotata mainly focuses on the distribution of germplasm resources [15], the extraction, separation, and identification of chemical components [19], the pharmacological effects [23], and other aspects. However, research on the biosynthetic pathway of iridoid, flavonoid, and phenylethanol glycoside compounds in L. rotata has not been reported. It is very important to study the expression pattern of key genes in the biosynthetic pathway of secondary metabolism in wild L. rotata, and the research results could provide clues for the molecular mechanism of pharmaceutical ingredient accumulation in L. rotata. At present, no research has been conducted on the screening of the internal reference genes of L. rotata. Thus, screening the best internal reference gene in the RT-qPCR analysis of L. rotata is of great significance for the subsequent study and analysis of the gene expression pattern of L. rotata.
With the development of high-throughput sequencing technology, plant RNA-seq datasets can be obtained rapidly and comprehensively [24,25]. This technology is now widely used in transcriptome gene expression analysis [26], secondary metabolism studies of plants [27,28], disease resistance mechanisms [29], biocontrol [30,31], and so on. RNA-seq datasets can also be used to study the molecular function of specific genes and to screen for internal reference genes [32,33]. Therefore, in this study, based on the transcriptome data of leaves and roots in L. rotata from five regions (GL, XW, YS, ZD, and CD regions, Figure 1 and Table 1) through the Illumina high-throughput sequencing platform (Biomaker Technologies Co., Ltd., Beijing, China), 15 candidate internal reference genes were finally screened based on the expression of FPKM >10 and difference ploidy < 2 [34], and included actin 8 (ACT8), cyclophilin 22 (CYP22), cyclophilin 95 (CYP95), TIP 41-like protein (TIP41), translation elongation factor (TFIIS), EF-1 α, actin 7 (ACT7), protein phosphatase 2A (PP2A), oxysterol-binding protein (OBP), tubulin β chain (TUB), cyclophilin23 (CYP23), ribochemical protein large subunit (RPL), anthranilate phosphoribosyltransferase (TrpD), acetylcholine deacetylase (AO), and α colloid NSF attachment protein (SNAP). The GeNorm, NormFinder, BestKeeper, and RefFinder algorithms were used to evaluate the expression stability of these candidate genes in the root and leaf tissues of L. rotata from different regions. Then, the selected best housekeeping gene could be used to analyze the expression pattern of the genes involved in the biosynthesis pathway of iridoid, flavonoid, and phenylethanol glycoside components of L. rotata. The objectives were to further verify the accuracy of the housekeeping gene and lay the foundation for the subsequent research on the functional verification of the genes involved in the biosynthesis pathway of these second metabolism components of L. rotata.

2. Materials and Methods

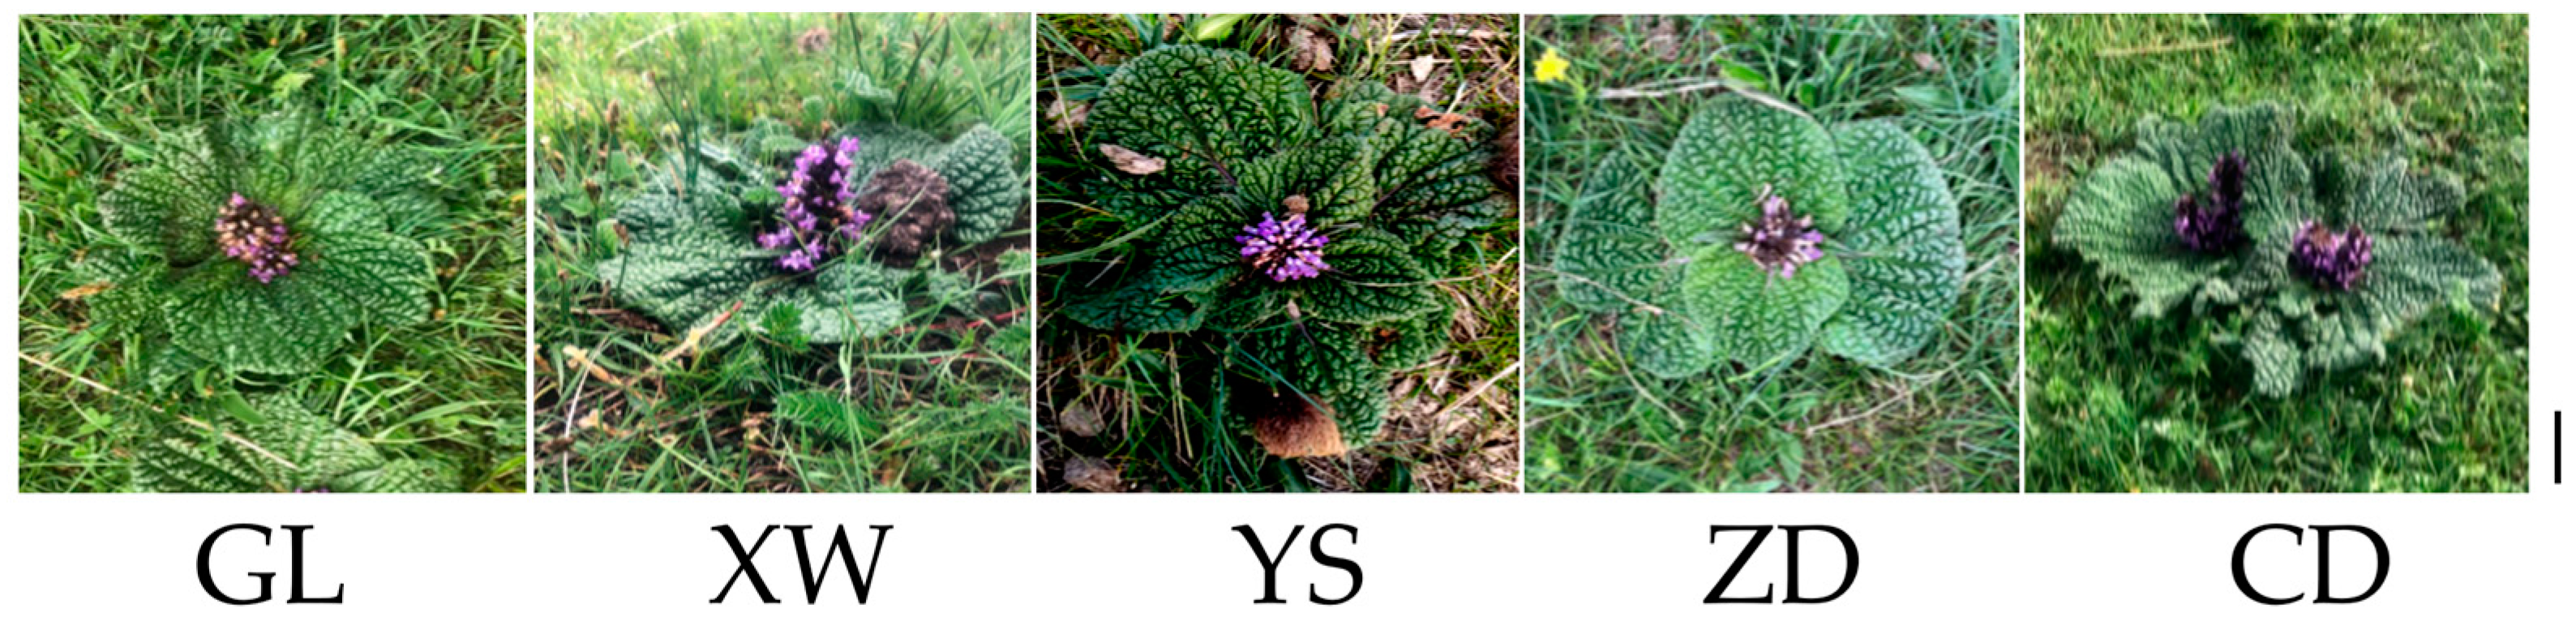
2.1. Experimental Materials

The wild materials of L. rotata used in this research were collected in Guoluo, Xiewu, Yushu, Zaduo, and Chengduo counties in Qinghai Province at different altitudes from 3750 m to 4270 m (Figure 1, Table 1). The root and leaf organs of L. rotata from the five areas were analyzed as experimental samples. The samples were placed in liquid nitrogen for rapid freezing and stored in a −80 °C ultra-low-temperature freezer for the following experiments.

2.2. Total RNA Extraction and cDNA Synthesis

The total RNA was extracted from the roots and leaves of L. rotata from different regions by using a polysaccharide polyphenol plant RNA extraction kit (Nanjing Novozan Biotechnology Co., Ltd., Nanjing, China). The quality of RNA was assessed by 1% agarose gel electrophoresis. RNA was treated with DNase I (New England Biolabs) to remove DNA contamination as per the prescribed protocol.
The integrity of RNA was determined by observing the brightness of 18S rRNA and 28S rRNA bands through 1.2% agarose gel electrophoresis. The concentration of RNA was detected using a GeneQuant 100 ultraviolet spectrophotometer (Guangzhou Gangran Electromechanical Equipment Co., Ltd., Guangzhou, China), and its purity was determined with OD260/280. Each product used 1000 ng of RNA to synthesize the first strand of cDNA in accordance with the HiScript ® II Q RT SuperMix for qPCR (+gDNA wiper) kit (Nanjing Novozan Biotechnology Co., Ltd., Nanjing, China), and the cDNA was stored in a −20 °C low-temperature freezer for standby.

2.3. Screening of Candidate Internal Reference Genes and Designing of Primers

Based on the transcriptome data of the roots and leaves of L. rotata from different regions, 15 candidate internal reference genes, including ACT8, CYP22, CYP95, TIP41, TFIIS, EF-1α, ACT7, PP2A, OBP, TUB, CYP23, RPL, TrpD, AO, and SNAP, were finally screened. In accordance with the nucleotide sequence of candidate internal reference genes, primers were designed using Primer Premier 5.0 software (Table 2). The parameters were set as follows: GC content of 45–65%, primer length of 21–27 bp, primer annealing temperature of 60–67 °C, and amplification length of 80–200 bp. The primer was synthesized by Beijing Aoke Dingsheng Biotechnology Co., Ltd. (Beijing, China).

2.4. RT-qPCR Analysis of the Candidate Internal Reference Genes

The original solution of cDNA extracted from the root and leaf organs of L. rotata from different regions and diluted 5 times was taken as the template. The QuantStudio™ 6 Flex System (Thermo Fisher Scientific, Waltham, MA, USA) was used to conduct RT-qPCR detection. The reaction system had the following components: 10 μL of 2 × ChamQ Universal SYBR qPCR Master Mix, 7.2 μL of ddH2O, 2 μL of cDNA, and 0.4 μL of upstream and downstream primers (10 μM) each. The reaction conditions were as follows: predenaturation at 95 °C for 30 s, 95 °C for 10 s, and 60 °C for 30 s; 40 cycles. After amplification, the 60–95 °C dissolution curve was analyzed to detect the specificity of the primers.

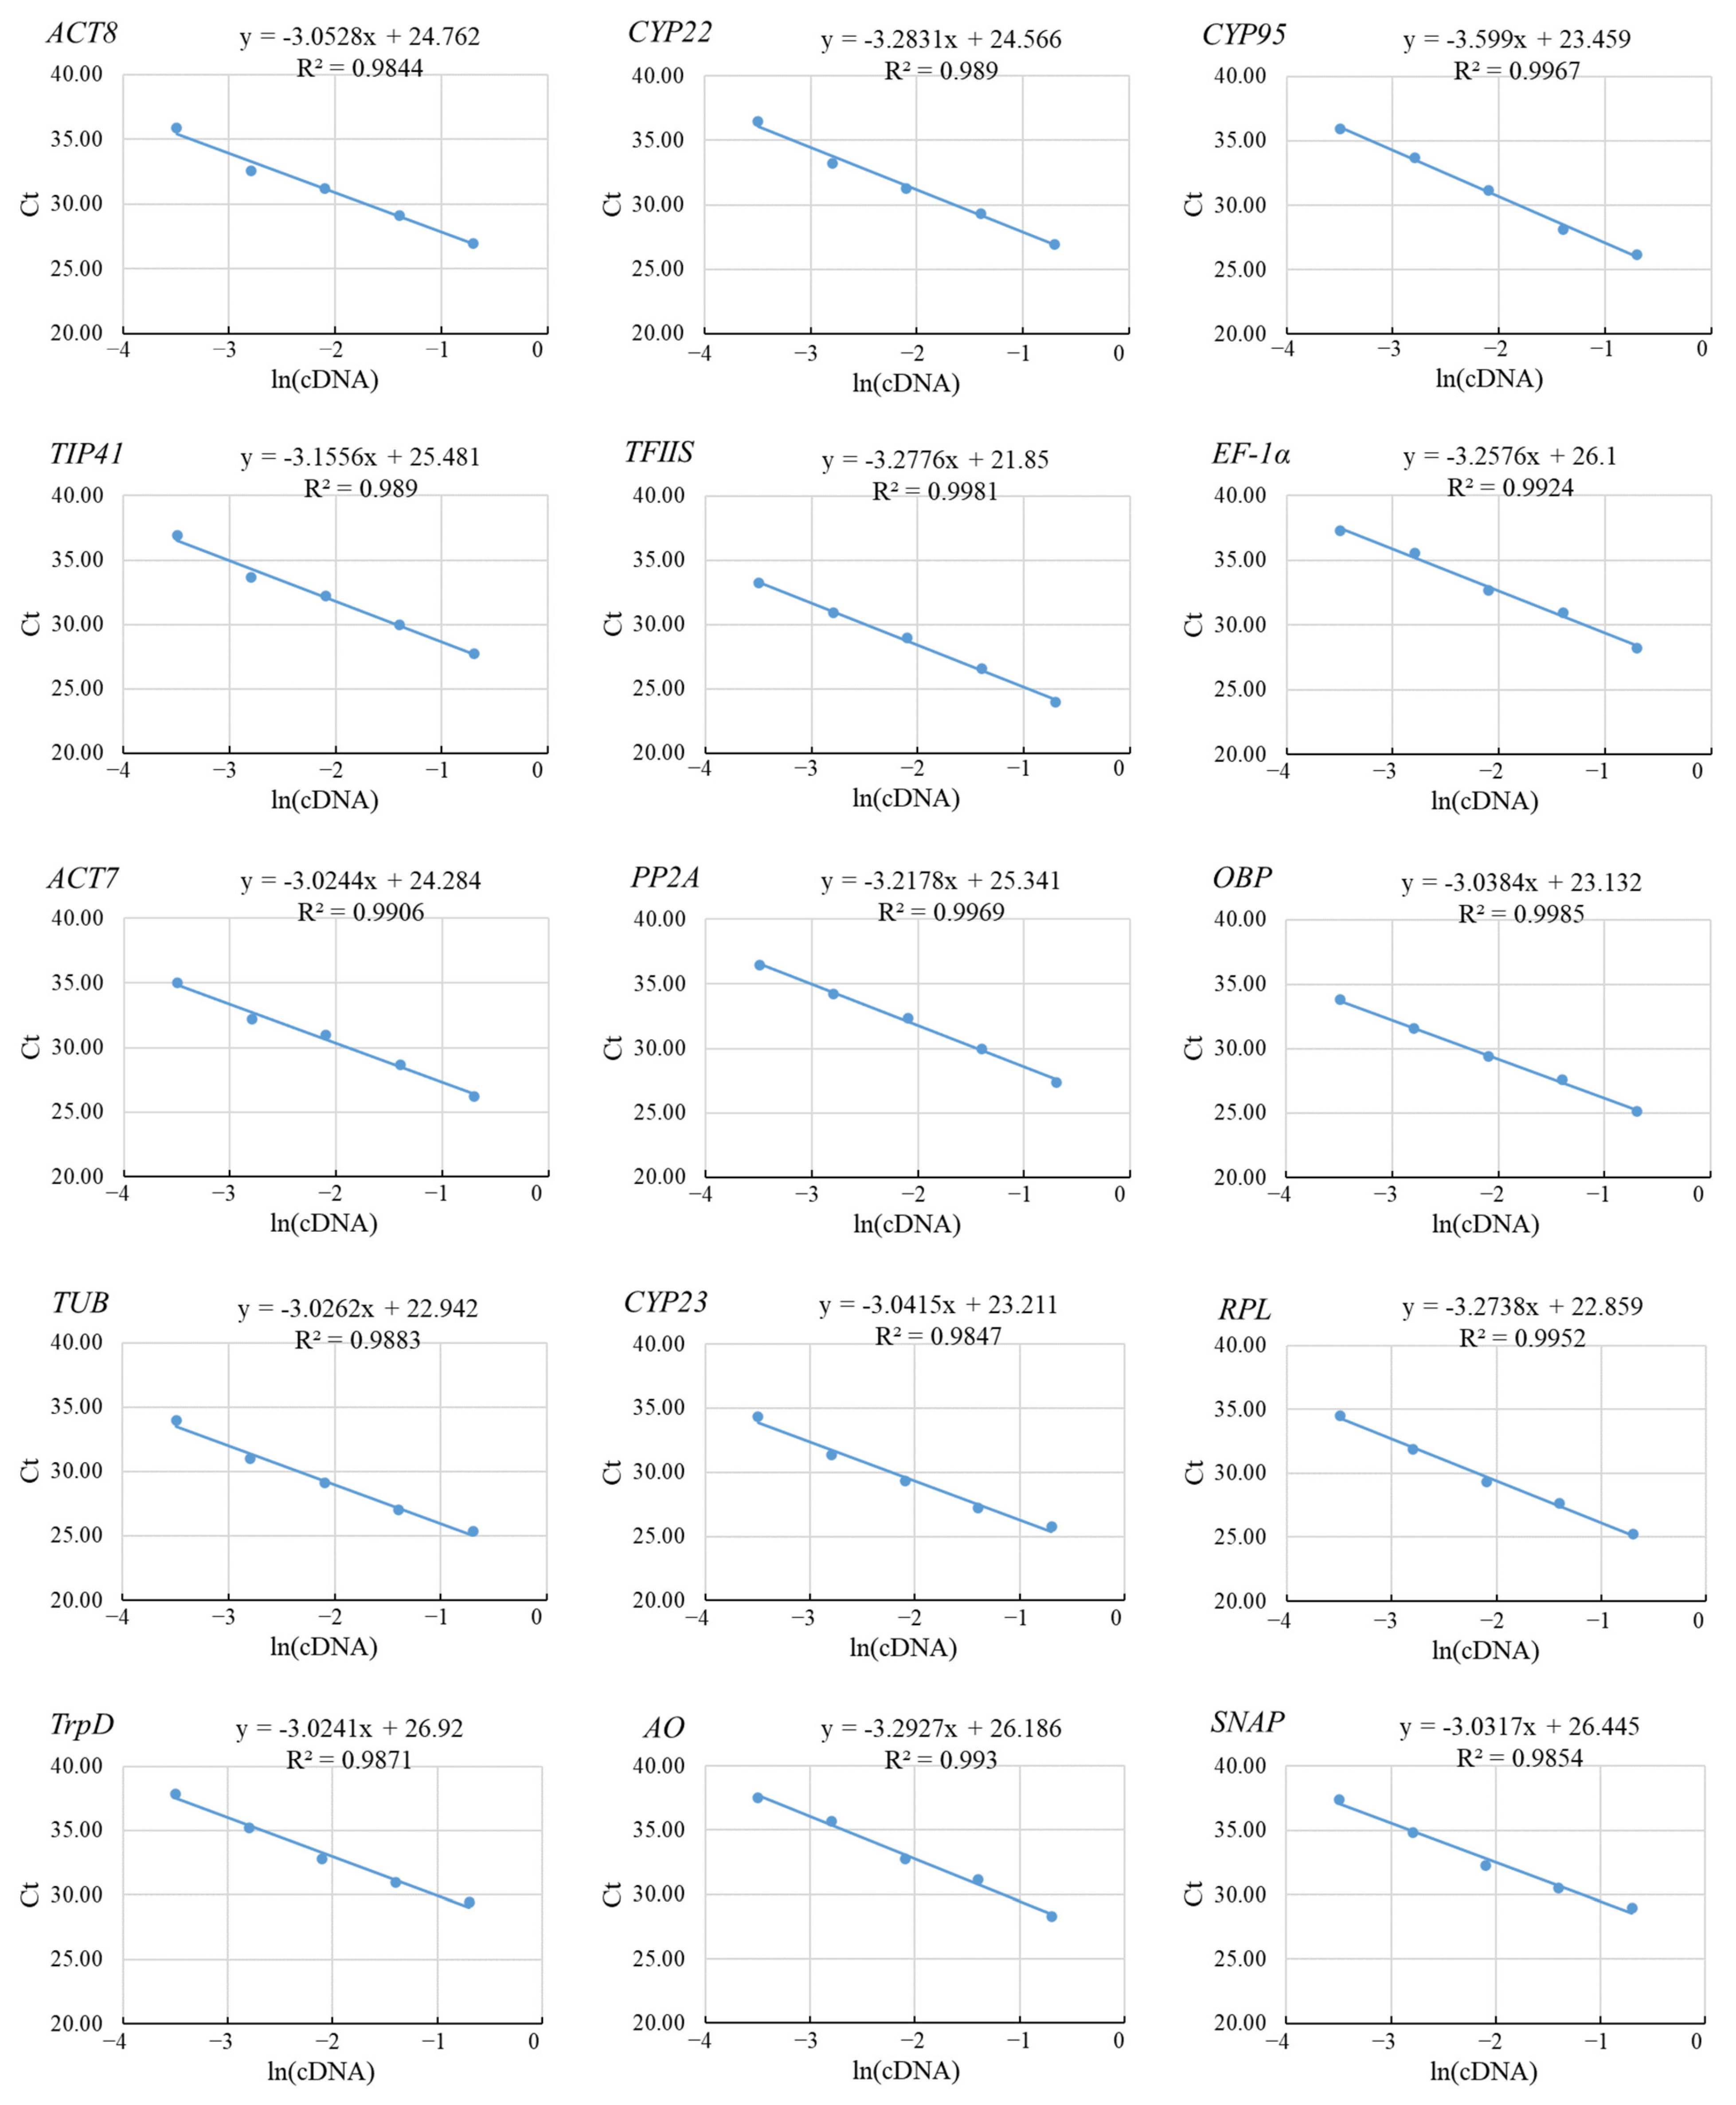
2.5. Determination of the Correlation Coefficient of Primer Pairs

The same amount of cDNA template stock solution of samples from different parts was mixed and diluted 5 times in turn. Five concentration gradients of the template stock solution were set, which were 5, 5−1, 5−2, 5−3, and 5−4. Each serial dilution was used separately in RT-qPCR to determine the threshold cycle (Ct) values of the candidate reference genes.
The primer specificity was verified by the presence of a single peak in the melt curve analysis during the RT-qPCR process. Three independent biological replicates and three technical repetitions were performed for each of the quantitative PCR experiments. The threshold cycle (Ct) was measured automatically, and correlation coefficients (R2), together with slope, were calculated from the standard curve based on a five-fold series dilution of the cDNA templates. The corresponding RT-qPCR efficiencies (E) for each gene were determined from the given slope.

2.6. Stability Analysis of the Candidate Internal Reference Genes

GeNorm [35], NormFinder [36], BestKeeper [37], and RefFinder [38], four conventional software tools, were used for evaluating the stability of the candidate reference genes under various altitude habitats. The Ct values were changed to relative quantities (Q) with the formula Q = 2−△Ct, where △Ct = each corresponding Ct − minimum Ct. Then, the Q-values were input into GeNorm and NormFinder to calculate stability values (SVs). GeNorm uses the average stability value (M value) to evaluate the expression stability, which involves the average pairwise variation between each reference gene and others. Genes with M < 1.5 are generally regarded as stable. Moreover, the GeNorm pairwise variation (V) values (Vn/Vn + 1) were applied to define the most appropriate reference gene number. The recommended value is ≤0.15 when opting for an appropriate number of genes. The NormFinder software evaluates expression stability by calculating the SV (lower SV indicates higher stability) when applying reference genes for standardization. In BestKeeper, the most stable reference gene was evaluated by the coefficient of variance (CV) and standard deviation (SD), with lower CV and SD values meaning higher stability. The RefFinder tool (http://blooge.cn/RefFinder/ accessed on 1–2 November 2022), integrating the outcomes of BestKeeper, Delta Ct, GeNorm, and NormFinder analysis, was applied to perform the most stable reference genes.

2.7. Validation of the Validity of the Candidate Reference Genes

When the selected reference gene was used as internal reference, the CT values of three genes encoding key enzymes (deoxyxylulose 5-phosphate synthase (DXS, EC 2.2.1.7), deoxyxylulose 5-phosphate reductoisomerase (DXR, EC1.1.1.267), and 4-Hydroxy-3-methylbut-2-en-1-yl diphosphate reductase (HDR, EC 1.17.1.2)) related to the biosynthesis of terpenoids were determined by RT-qPCR. The obtained Ct values were sorted out and analyzed quantitatively with 2−△△Ct to verify the reliability of the candidate reference gene [39]. The primers of each target gene were designed by Primer Premier 5.0 software and shown in Table 3.

3. Results

3.1. Primer Specificity and Correlation Coefficient of Primer Sets

Fifteen candidate reference genes were selected from the transcriptome of L. rotata. The specificity of each primer pair was assessed by agarose gel electrophoresis and melting curve analysis (Figure S1). For each candidate reference gene, the length of a single amplicon ranged from 86 bp to 197 bp (Table 2).
To check the efficiency of PCR amplification using these primers, the correlation coefficient (R2) of each primer set was determined using the slopes of the curves obtained by serial dilutions. For this purpose, a dilution series of template samples containing cDNA and water in the ratio of 1:1, 1:5, 1:25, 1:125, and 1:625 was prepared, and RT-qPCR was performed (Figure 2). The plot of the Ct values versus the natural logarithm (ln) of cDNA dilutions demonstrated a linear distribution for all primer sets (Figure 2). The calculation of R2 indicated that all primer sets had R2 values more than 0.95 (Figure 2). R2 values between 0.80 and 1.00 are considered very good for any primer set. The amplification efficiency (E) of the primers was between 90% and 114% (Table 2). Based on the values of E and R2, we concluded that the primer specificity of each candidate reference gene was strong and thus can be used for screening candidate reference genes.

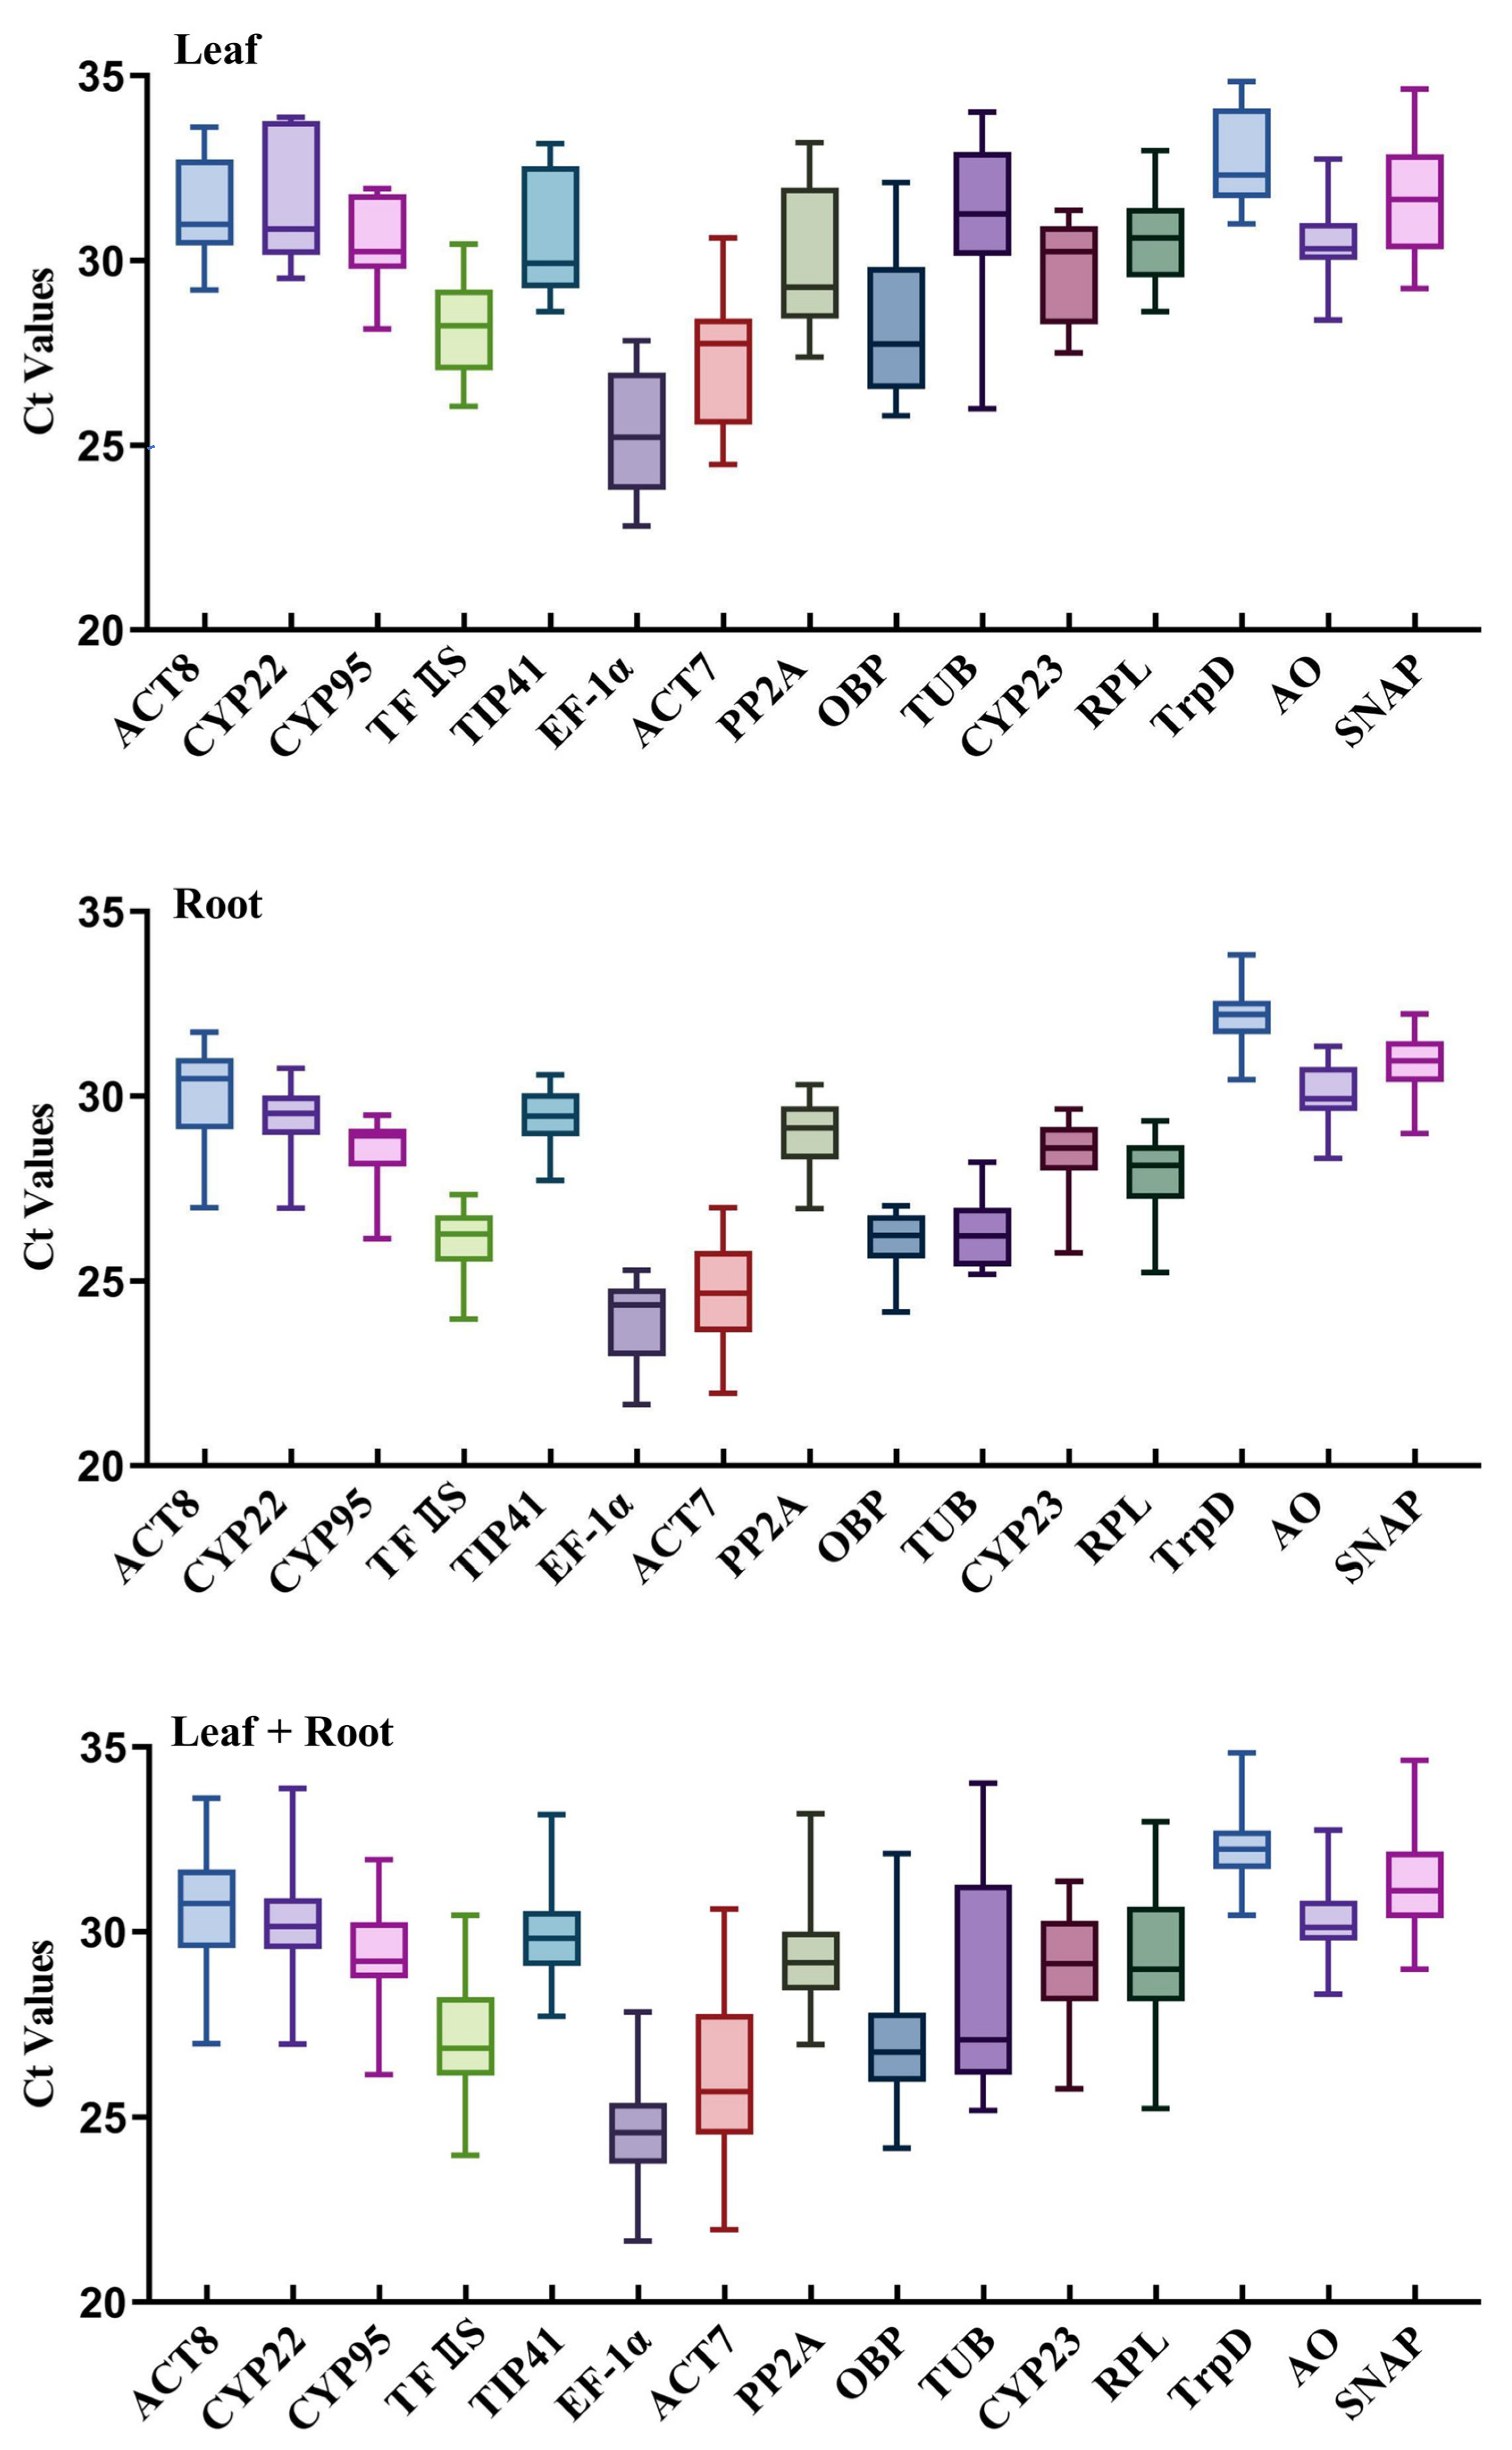
3.2. Ct Values of the Candidate Reference Genes

Ct value can reflect the expression abundance of candidate internal reference genes in different samples. The Ct value of the 15 candidate internal reference genes in all samples was between 21 and 34. The Ct value across all the samples was shown in the form of a box and whisker plot (Figure 3). The median of the Ct values of the candidate reference genes ranged from 24.57 (for EF-) to 32.33 (for TrpD). Lower Ct values implied higher expression levels and vice versa. The box and whisker plot indicated that EF- and ACT7 had the highest levels among all the candidate reference genes examined. With the median of the Ct value as the evaluation standard, EF-1α had the highest expression level with a median of 24.57. The expression levels of ACT7 and OBP were also relatively high, with median values of 25.69 and 26.75, respectively. Interestingly, genes with the lowest expression levels (TrpD and SNAP) showed smaller variability in their Ct values across different regions with median values of 32.23 and 32.11.
Similarly, Figure 3 shows that the upper and lower box lines and the maximum and minimum values of CYP95 and TFIIS varied minimally in all samples. The expression of these two genes was preliminarily believed to be relatively stable in all samples. On the contrary, the difference between the upper and lower quartiles and the maximum and minimum values of TUB was relatively large. The expression stability of this gene was speculated to be poor in all samples. Meanwhile, the difference of RPL and ACT8 was small in leaves from different regions, which suggested that these two genes were relatively stable. In the root of L. rotata from different regions, the difference of OBP and PP2A was small, and these two genes were considered to be relatively stable.

3.3. Stability Analysis of the Candidate Reference Genes

To systematically evaluate the stability of the 15 candidate reference genes, this study used GeNorm, NormFinder, BestKeeper software, and the RefFinder online analysis tool to analyze the results of RT-qPCR.

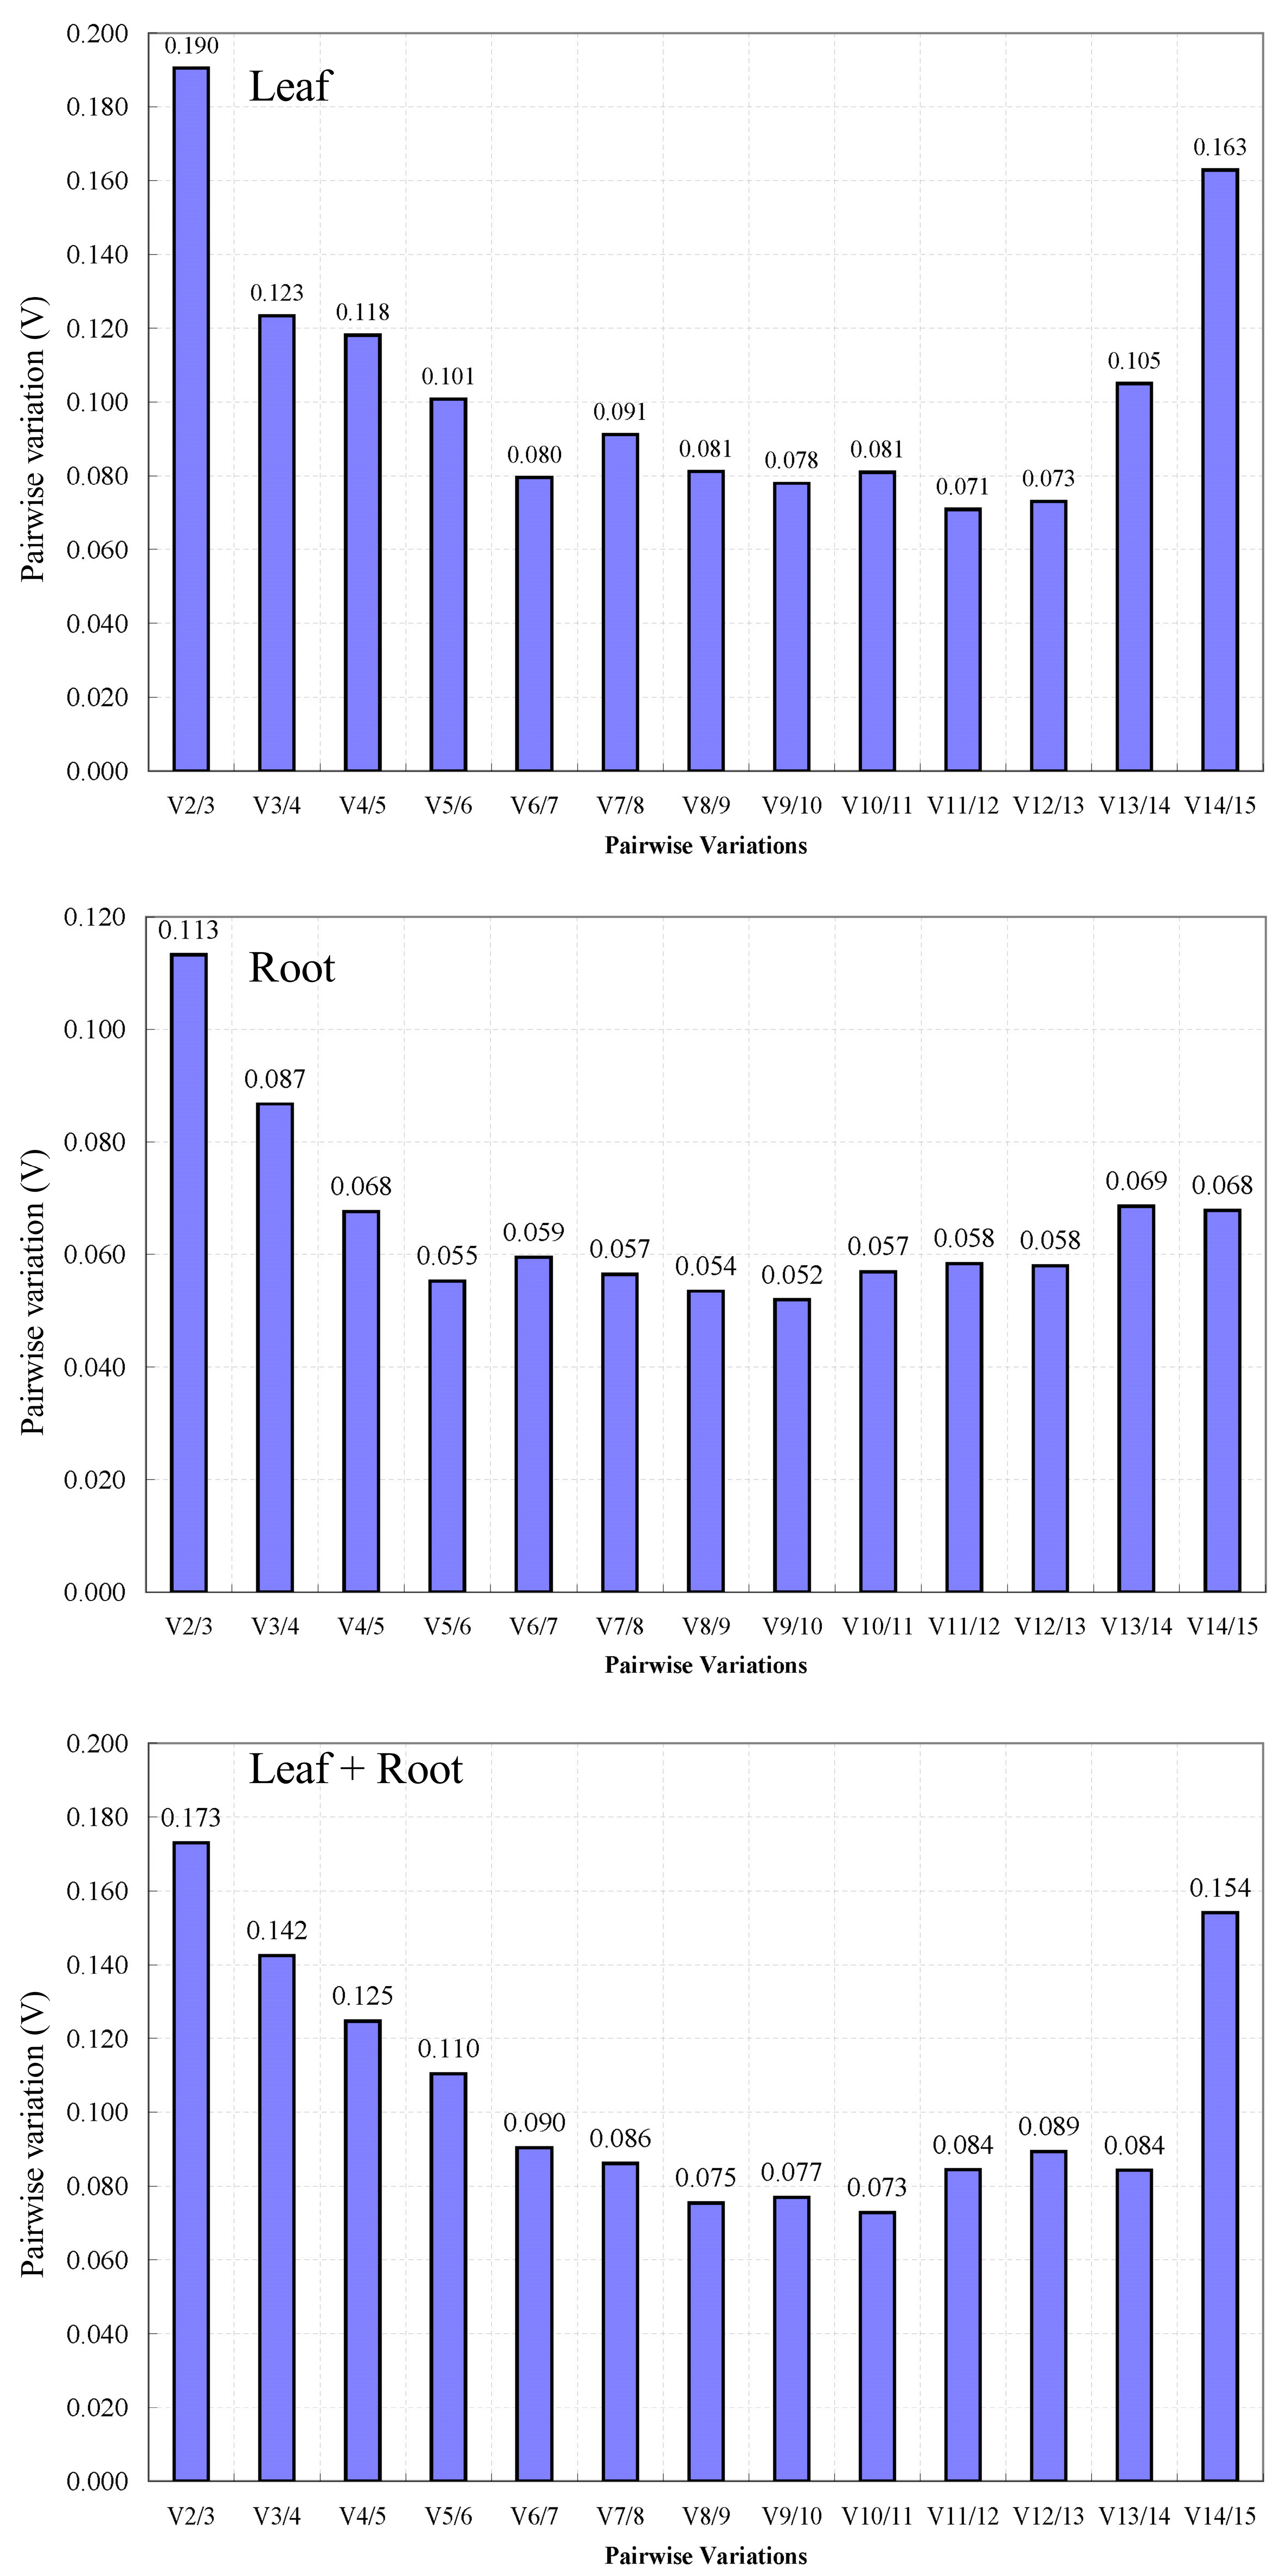
3.3.1. GeNorm Analysis of the Stability of the Candidate Reference Genes

The stability of the 15 candidate reference genes was analyzed using GeNorm software. The stability was expressed by M value: the smaller the M value, the stronger the stability. The M value of the 15 candidate reference genes in each group was less than 1.5 (Figure 4), which indicated that the candidate reference genes had good stability. In all samples, the M value of CYP22/TFIIS was the smallest (0.54), whereas the M value of TUB was the largest (1.18). Accordingly, the expression stability of CYP22/TFIIS was the best in all samples, and it was the most suitable to be used as an internal reference gene. For the leaves with unique characteristics from different regions, the M values of the 15 candidate reference genes were ranked from largest to smallest as TUB > AO > TrpD > OBP > ACT7 > CYP23 > SNAP > TIP41 > CYP95 > ACT8 > RPL > PP2A > CYP22 > TFIIS/EF-1α. However, in the roots of L. rotata from different regions, the M value of TFIIS/OBP was the smallest (0.25), which was greatly different from the stability evaluation results of all samples. The M value of OBP in all samples was speculated to be higher because of the poor expression stability in the leaves of L. rotata from different regions.
Through the GeNorm software, the 15 candidate reference genes were analyzed for the difference in candidate reference gene standardization factor pairs. The results (Figure 5) showed that V2/V3 was greater than 0.15 and V3/V4 was less than 0.15 in all samples and leaves from different regions. Therefore, three reference genes should be introduced in the RT-qPCR analysis of these two groups to make the results accurate and reliable. However, in the roots of L. rotata from different regions, V2/V3 (0.113) < 0.15, which indicated that the two internal reference genes can make the analysis accurate and reliable when RT-qPCR analysis was carried out in this group.

3.3.2. NormFinder Analysis of the Stability of the Candidate Reference Genes

The stability of the 15 candidate reference genes was analyzed using NormFinder software. Similar to GeNorm, the lower the value is, the stronger the stability of genes is. In Figure 6, the stability sequencing results of different candidate reference genes in three different tissues were listed from left to right. In leaves from different regions, TFIIS had the best stability (0.22), whereas TUB had the worst stability (1.43). In the roots of L. rotata from different regions, the stability of OBP was the best (0.13), whereas the stability of TrpD was the worst (0.67). CYP22 and TFIIS were stable in the top four in all experimental conditions and could be considered the best candidate reference genes. By contrast, TUB and TrpD had poor stability under all experimental conditions.

3.3.3. BestKeeper Analysis of the Stability of the Candidate Reference Genes

BestKeeper is an Excel-based algorithm, which directly uses the Ct value obtained from RT-qPCR analysis for further analysis. BestKeeper evaluates the stability of the candidate reference gene by calculating its CV and SD. Smaller CV and SD values represent better stability. From Table 4, in the leaves the stability of OBP (6.57 ± 1.86) was the worst, whereas that of TrpD (2.84 ± 0.92) and CYP95 (3.51 ± 1.07) was the best In the roots from different regions, the stability of ACT7 (4.39 ± 1.08) was the worst, whereas that of TrpD (1.58 ± 0.51) and AO (1.65 ± 0.50) was the best. Under all experimental conditions, the stability of TrpD ranked first, and it was considered the most suitable reference gene.

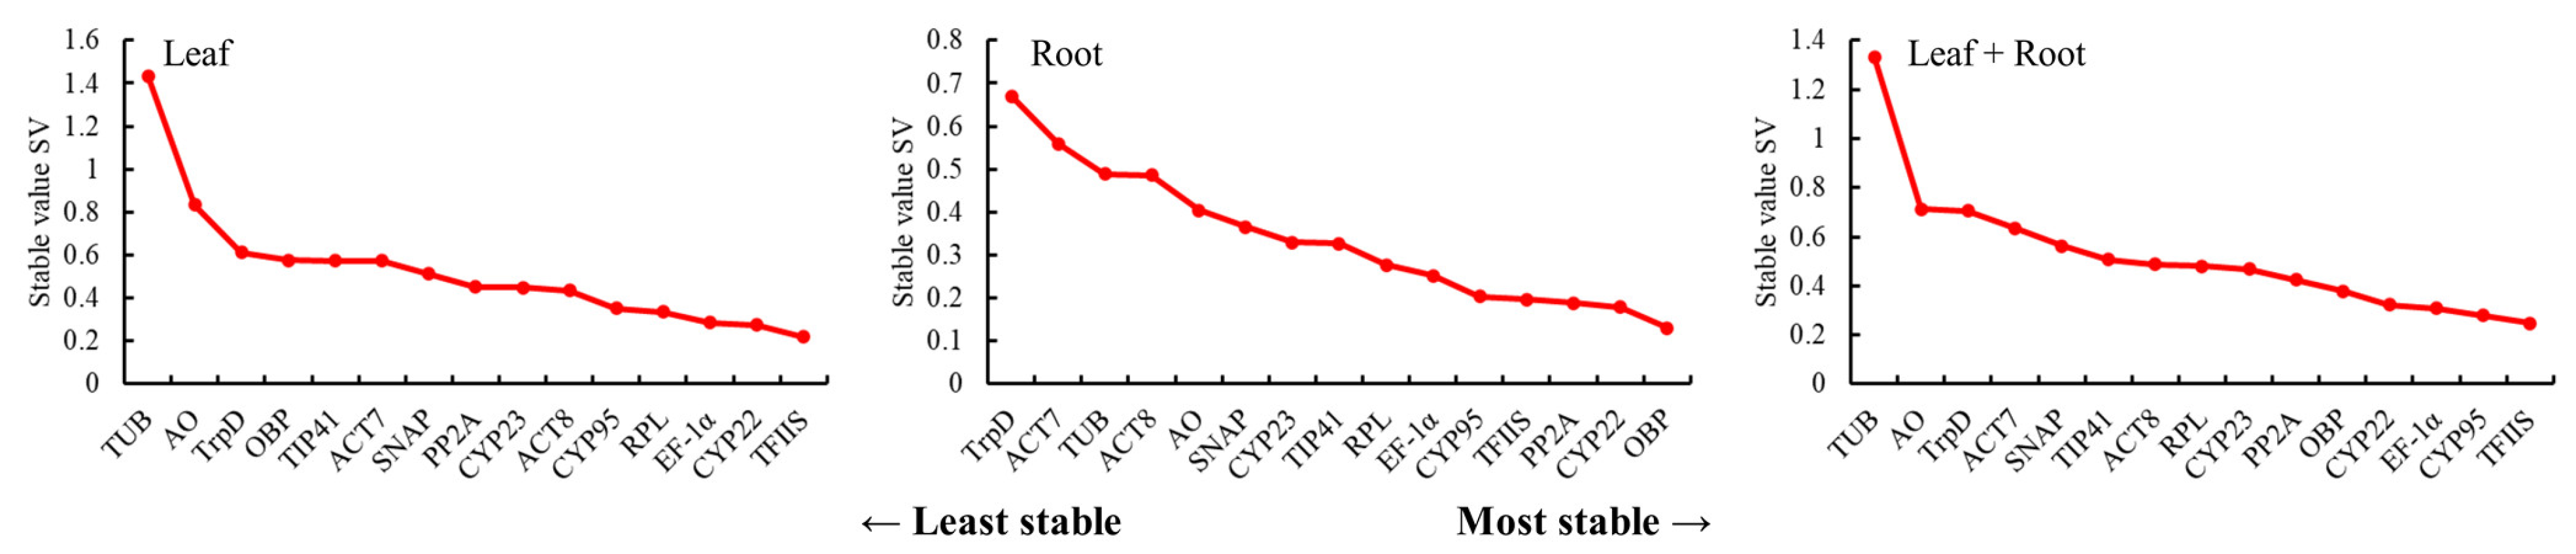
3.3.4. RefFinder Analysis of the Stability of the Candidate Reference Genes

The RefFinder online analysis tool can take appropriate weight to comprehensively evaluate the analysis results of GeNorm, NormFinder, and BestKeeper, avoid the one-sidedness of single program analysis, and better analyze candidate internal reference genes [23]. In this study, 15 candidate internal reference genes were analyzed by RefFinder (Figure 7), and the results showed that the most suitable internal reference genes were TFIIS, EF-1α, and CYP22 in the leaves of L. rotata from different regions. The most suitable internal reference group in the roots of L. rotata from different regions included OBP, TFIIS, and CYP22. In all samples, the most suitable internal reference group was TFIIS, CYP95, and CYP22 based on the analysis of RefFinder software.

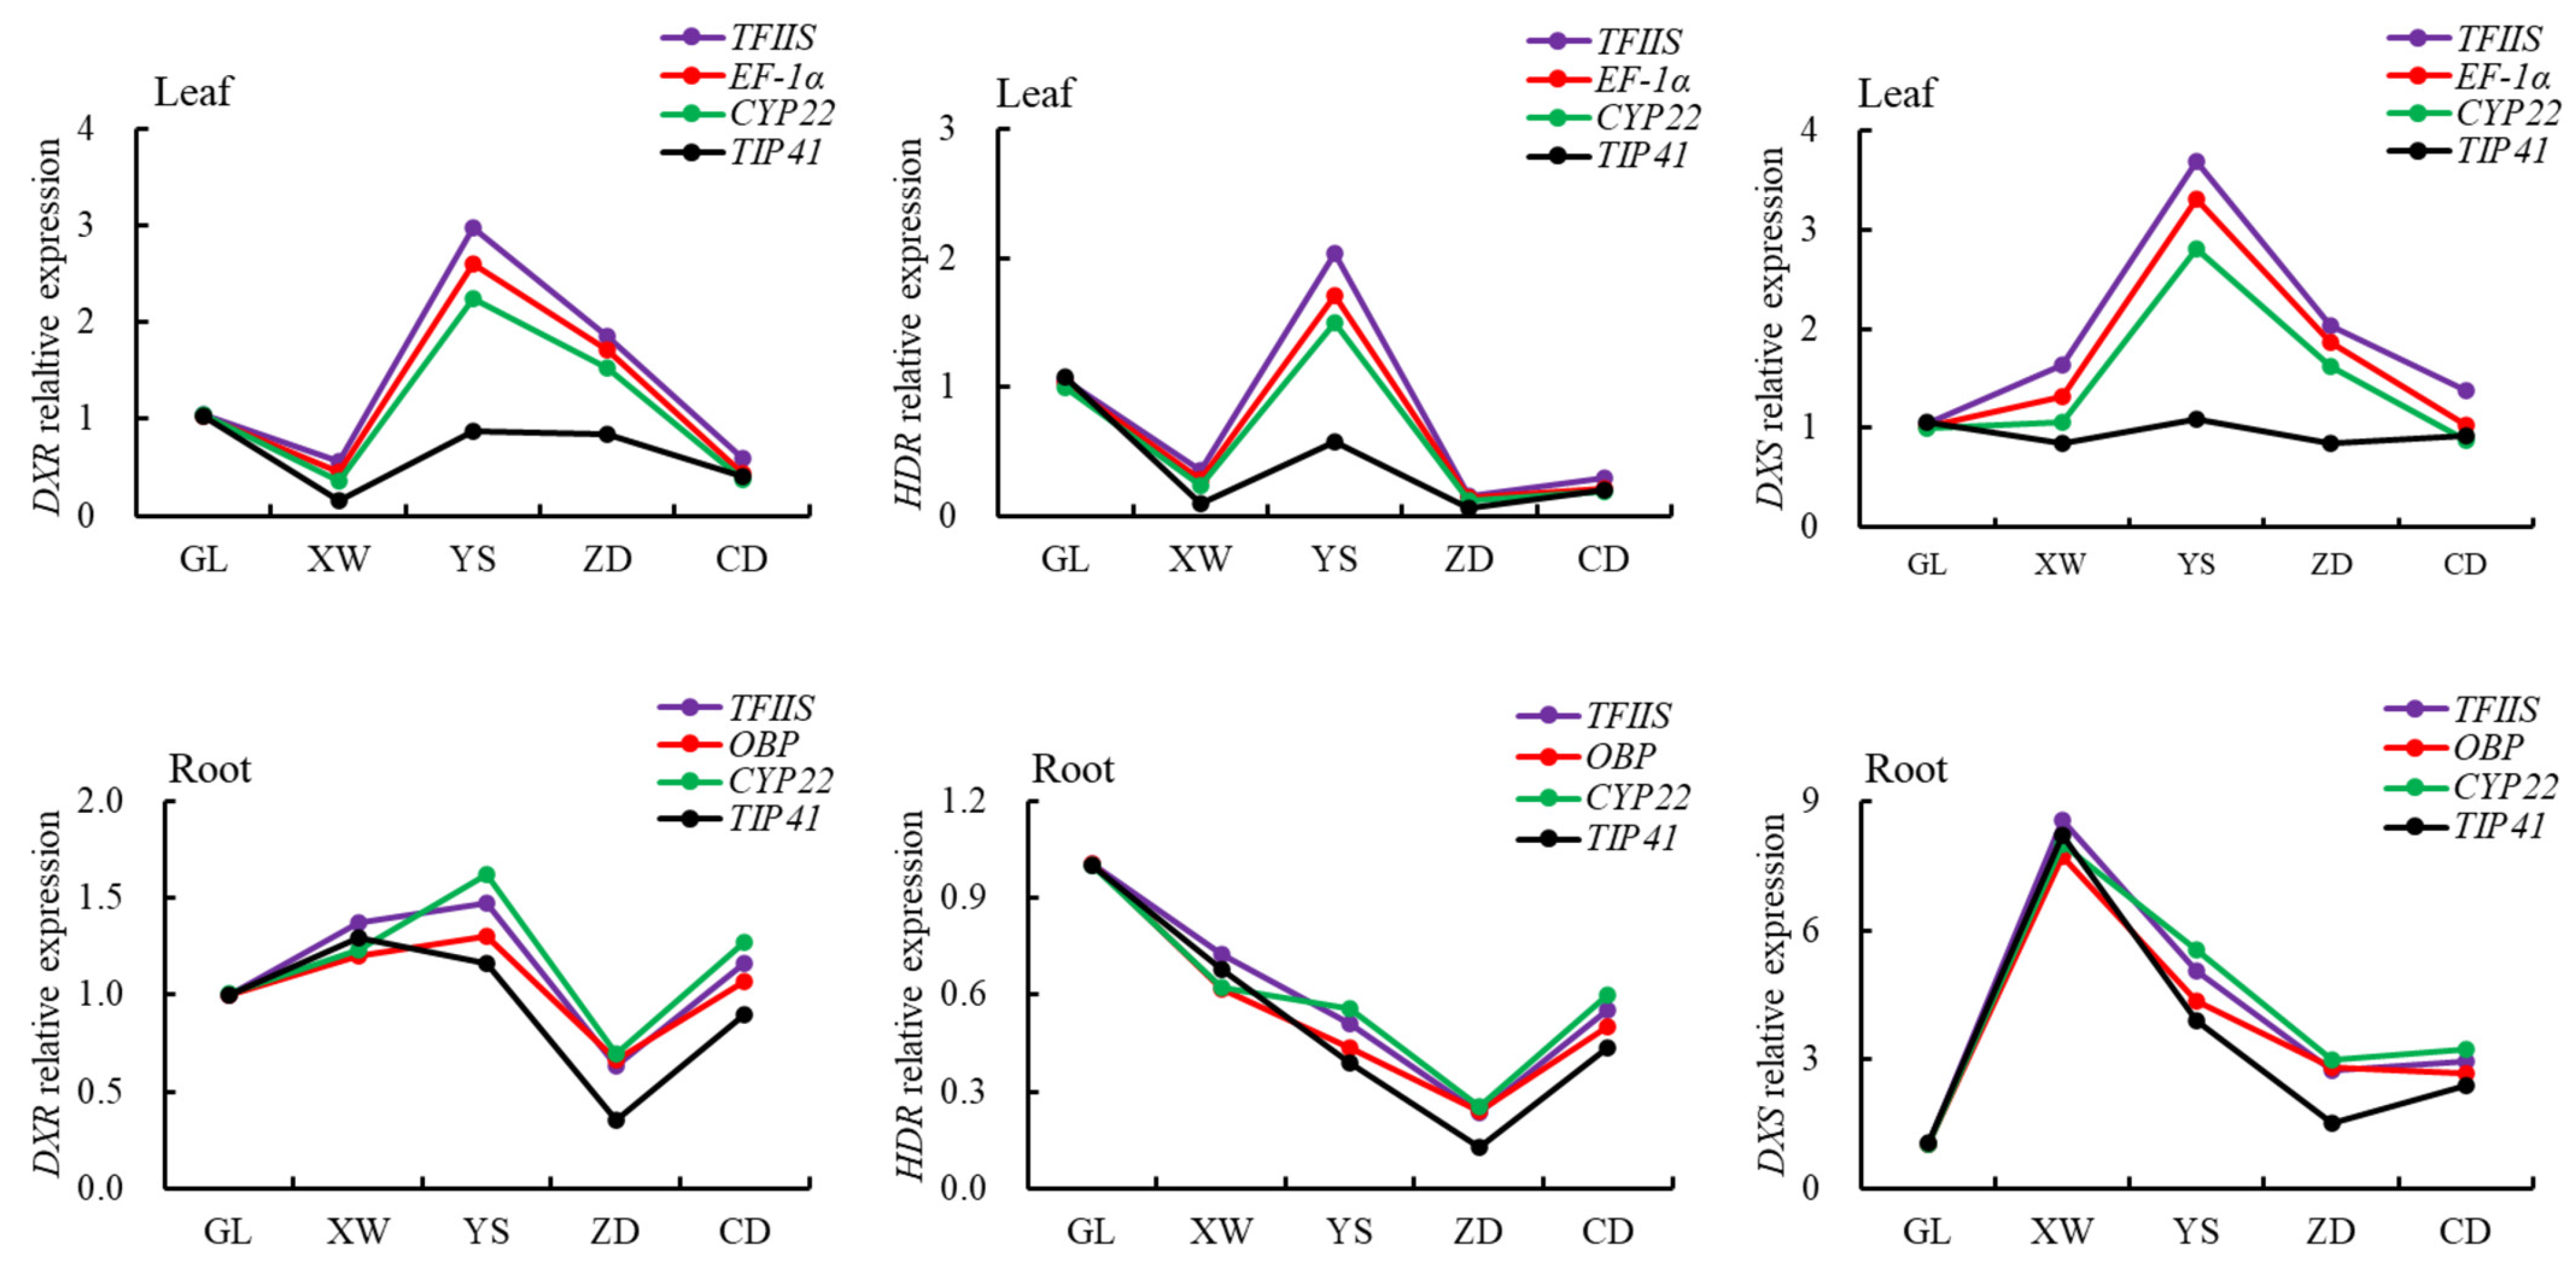
3.4. Verification of the Stability of Internal Reference Genes

Three relatively stable internal reference genes (TFIIS, EF-1α, and CYP22), and a poorly stable internal reference gene (TIP41) from the leaf, were used as the internal reference to study the expression of three genes (DXR, HDR, and DXS) related to the synthesis of iridoid compounds in the leaves of L. rotata from different regions. As shown in Figure 8, the three genes DXR, HDR, and DXS all showed the same expression change trend in the leaves of L. rotata.
Three stable internal reference genes (TFIIS, OBP, and CYP22) were also used to study the expression of the three genes DXR, HDR, and DXS in roots (Figure 8). Based on the two internal reference genes of TFIIS and OBP, the specific genes DXR, HDR, and DXS all showed the same expression change trend in the roots of L. rotata from five habitats.
Meanwhile, in the different tissues of L. rotata from different regions, different reference genes were screened as the most optimal internal reference genes. The three genes TFIIS, EF-1α, and CYP22 were found to be the three most stable reference genes in leaves (Table 4 and Figure 6, Figure 7 and Figure 8). In roots, the three genes TFIIS, OBP, and CYP22 were the most stable reference genes (Table 4 and Figure 6, Figure 7 and Figure 8).

4. Discussion

RT-qPCR is a common technical means for studying gene expression patterns and analyzing gene functions and molecular mechanisms in molecular biology research. Appropriate reference genes are the prerequisite to ensure the accuracy of RT-qPCR data. In recent years, many scholars have analyzed the reference genes of different kinds of plants based on the RT-qPCR technology and found that the internal reference genes are not universal under the conditions of different plants, the same plant from different sources, and different parts of the same plant, and that the most suitable reference genes are different [40]. For example, in different tissues of Isatis indigotica, CYP was the most stable reference gene [41], but in all samples of Lycoris aurea, the stability of the CYP gene was poor [42]. The most stably expressed reference genes in the roots, stems, and leaves under high-light stress were PSKS1, UBC2, and PSKS1, respectively [43]. The EF-1α gene was identified as an unstable reference gene in response to herbicide stress in wild oat [44]. In all samples or different tissues of jute, the stability of PP2A gene expression was the best. On the contrary, in jute under drought stress, the stability of PP2A was poor, and the stability of the ACT7 gene was the strongest [45]. The ACT, RIB, and TUA genes were the most stable reference genes expressed in different tissues of Schima superba [46]. Therefore, studying candidate reference genes from different sources and different parts is of great significance for improving the reliability of RT-qPCR results.
The identification of the optimal reference genes for specific conditions in a given species is imperative. Furthermore, our study revealed that the stability ranking of reference genes varied in certain circumstances due to the different algorithms used in the three analytical tools. In this study, the stability of candidate reference genes was evaluated for the first time for different regions and different parts of wild L. rotata. A total of 15 candidate reference genes were selected, and the expression stability of these 15 candidate reference genes in the roots and leaves of L. rotata from different regions was analyzed through GeNorm, NormFinder, and BestKeeper software. The results of the different software were generally consistent, but there were still differences. For example, based on the analysis of GeNorm, TFIIS and EF-1α were the best (Figure 4). The NormFinder analysis showed that the expression level of TFIIS was the most stable (Figure 6). Under the analysis of BestKeeper, CYP95 and TrpD had the lowest degree of variation and the best stability. The differences were due to the fact that the algorithms of the three software are different; similar findings have been obtained in previous studies [46,47].
In order to screen the most suitable reference genes, the results obtained from the above three software programs were comprehensively analyzed using the online analysis tool RefFinder. The results showed that TFIIS and EF-1α were the most stable genes in the leaves of L. rotata in different regions based on the RefFinder method. The TFIIS gene is an important multifunctional protein, which can participate in gene translation regulation, cell signal pathway, and skeleton composition in organisms, and plays an important role in cell life activities. It is a common reference gene in plants at present [48]. EF-1α is a ubiquitous and conserved cytosolic protein among eukaryotic organisms and is responsible for catalyzing the binding of aminoacyl-transfer RNAs to ribosomes [49,50]. The expression of OBP and TFIIS was most stable in the roots of L. rotata in different regions based on the RefFinder method. The oxysterol-binding protein (OBP) is a storied protein in organelle biology and in sterol signaling and/or sterol transport functions [51]. Its major roles include acting as a membrane contact site tether, as well as a lipid antiporter [52]. Under Fe-deficient conditions, OsOBP and OsLUG were found to be the two most stable reference genes in any type of tissue taken in the study [53]. Among all the samples from different regions of L. rotata, TFIIS and CYP95 were the most stable reference genes based on the RefFinder method. Plant cyclophilins (CYPs) are widely involved in a range of biological processes, including stress response, metabolic regulation, and growth and development [54,55]. CYP belongs to the immunophilin family and has peptidyl-prolyl cis-trans isomerase (PPIase) activity, which catalyzes the cis-trans isomerization process of proline residues. CypA demonstrated the most consistent expression irrespective of disease severity and emerged as the most suitable reference gene in COVID−19 and CAM [56].
In order to further verify the selected internal reference genes from the screen, we selected DXR, DXS, and HDR as the target genes. DXR, DXS, and HDR are key functional genes in the biosynthetic pathway of iridoid compounds and play roles in regulating the accumulation of downstream products and influencing the biosynthesis of iridoid compounds [57,58,59]. For example, the overexpression of the DXR gene induced by MeJ in Tripterygium wilfordii can increase the accumulation of triptophenolide [60]. Overexpression of the DXS2 gene in the hairy root of Salvia miltiorrhiza will increase the content of tanshinone, while down-regulation of the DXS2 gene will significantly reduce the content of tanshinone [61]. Overexpression of the HDR gene in Nicotiana tabacum will cause the expression of downstream genes related to terpene biosynthesis to be up-regulated, thus causing a significant increase in the accumulation of terpene compounds [62]. In this study, the expression levels of three target genes mentioned above were analyzed using the three most stable internal reference genes and one less stable internal reference gene. The results showed that the expression pattern of a same target gene (DXR, DXS, or HDR) was very similar although using the three most stable reference genes (TFIIS, EF-1α, or CYP22 in leaves) (Figure 8), while the expression pattern of a same target gene (DXR, DXS, or HDR) changed more or less using a less internal reference gene (TIP41) (Figure 8). The validation results further illustrated the reliability of the ReFinder analysis results, and our study results also showed the importance of selecting the appropriate internal reference genes to ensure the reliability of RT-qPCR results.

5. Conclusions and Future Perspectives

The best genes for normalization of RT-qPCR in different tissues of L. rotata from different habitats are different. The three genes TFIIS, EF-1α, and CYP22 are stable, viable alternatives for data normalization in the leaves of L. rotata. Meanwhile, the genes TFII, OBP, and CYP22 are the most stable reference genes in the roots of L. rotata. Our results reinforce the importance of the determination of the transcription stability of different candidate genes considering each experimental condition of interest. Our findings establish a solid foundation for further study of the gene regulatory network of L. rotata in response to different-altitude habitats. What is more, we can use the best reference genes screened from the leaves and roots of the wild L. rotata herb to analyze the expression changes of the genes related to the accumulation of the main medicinal compounds (iridoids, flavonoids, and phenylethanosides) of L. rotata and further explore the molecular regulation mechanism of the accumulation of the medicinal components of L. rotata at different altitudes.

Supplementary Materials

The following supporting information can be downloaded at https://www.mdpi.com/article/10.3390/genes14030573/s1, Figure S1, Melting peaks of candidate reference genes. The melting curve of every reference gene by RT-qPCR is a single peak, which indicates the specificity and reliability of the primer pair used for the further analysis of gene expression.

Author Contributions

L.W.: contributed to the most experiments and analysis. F.Q.: designed the study, contributed to the experiments, and revised the manuscript. G.G.: field investigating and sampling, and formal analysis. Y.L.: field sampling and contributed to part of the experiments. All authors have read and agreed to the published version of the manuscript.

Funding

This study was supported by Science and Technology Department of Qinghai Province (2021-ZJ-729), Key Laboratory of Medicinal Animal and Plant Resources of Qinghai-Tibetan Plateau in Qinghai Province (2020-ZJ-Y04), Agricultural Resources and Environmental Protection Project of the Ministry of Agriculture and Rural Areas (125C0505).

Institutional Review Board Statement

Not applicable.

Informed Consent Statement

Not applicable.

Data Availability Statement

The data are available at https://www.ncbi.nlm.nih.gov/Genbank/update.html, GenBank accession numbers OQ471970; OQ471971; OQ471972; OQ471973; OQ471974; OQ471975; OQ471976; OQ471977; OQ471978; OQ471979; OQ471980; OQ471981; OQ471982; Q471983; OQ471984; OQ471985; OQ471986; OQ471987.

Conflicts of Interest

The authors declare no conflict of interest.

Abbreviations

ACT7: actin 7, ACT 8: actin8, AO: acetylornithine deacetylase, CYP22: cyclophilin 22, CYP95: cyclophilin 95, TIP 41: TIP 41-like protein, TFIIS: transcription elongation factor, EF-1α: elongation factor 1α, PP2A: protein phosphatase 2A, OBP: oxysterol-binding protein, TUB: tubulin β chain, CYP 23: cyclophilin 23, RPL: ribosomal protein large subunit, TrpD: anthranilate phosphoribosyltransferase in tryptophan biosynthesis, SNAP: α-soluble NSF attachment protein, DXR: 1-deoxy-D-xylulose-5-phosphate reductoisomerase, DXS: 1-deoxy-D-xylulose-5-phosphate synthase, HDR: 4-hydroxy-3-methylbut-2-enyl diphosphate reductase, GAPDH: glyceraldehyde-3-phosphate dehydrogenase, PP2Ac: catalytic subunit of protein phosphatase 2A, TUA: tubulin alfa chain, RIB: 60S ribosomal protein.

References

  1. Li, Y.; Liang, X.; Zhou, X.; Wu, Z.; Yuan, L.; Wang, Y.; Li, Y. Selection of reference genes for qRT-PCR analysis in medicinal plant Glycyrrhiza under abiotic stresses and hormonal treatments. Plants 2020, 9, 1441. [Google Scholar] [CrossRef] [PubMed]
  2. Wang, W.; Hu, S.; Cao, Y.; Chen, R.; Wang, Z.; Cao, X. Selection and evaluation of reference genes for qRT-PCR of Scutellaria baicalensis Georgi under different experimental conditions. Mol. Biol. Rep. 2021, 48, 1115–1126. [Google Scholar] [CrossRef] [PubMed]
  3. Lian, C.; Zhang, B.; Yang, J.; Lan, J.; Yang, H.; Guo, K.; Li, J.; Chen, S. Validation of suitable reference genes by various algorithms for gene expression analysis in Isodon rubescens under different abiotic stresses. Sci. Rep. 2022, 12, 19599. [Google Scholar] [CrossRef] [PubMed]
  4. Wang, X.; Wu, Z.; Bao, W.; Hu, H.; Chen, M.; Chai, T.; Wang, H. Identification and evaluation of reference genes for quantitative real-time PCR analysis in Polygonum cuspidatum based on transcriptome data. BMC Plant Biol. 2019, 19, 498. [Google Scholar] [CrossRef]
  5. Kou, X.Y.; Zhang, L.; Yang, S.Z.; Li, G.H.; Ye, J.L. Selection and validation of reference genes for quantitative RT-PCR analysis in peach fruit under different experimental conditions. Sci. Hortic. 2017, 225, 195–203. [Google Scholar] [CrossRef]
  6. Bustin, S.A.; Benes, V.; Garson, J.A.; Hellemans, J.; Huggett, J.; Kubista, M.; Mueller, R.; Nolan, T.; Pfaffl, M.W.; Shipley, G.L.; et al. The MIQE guidelines: Minimum information for publication of quantitative real-time PCR experiments. Clin. Chem. 2009, 55, 611–622. [Google Scholar] [CrossRef]
  7. Nolan, T.; Hands, R.E.; Bustin, S.A. Quantification of mRNA using real-time RT-PCR. Nat. Protoc. 2006, 1, 1559–1582. [Google Scholar] [CrossRef]
  8. Xu, L.; Xu, H.; Cao, Y.; Yang, P.; Feng, Y.; Tang, Y.; Yuan, S.; Ming, J. Validation of reference genes for quantitative real-time PCR during bicolor Tepal development in Asiatic hybrid lilies (Lilium spp.). Front. Plant Sci. 2017, 8, 669. [Google Scholar] [CrossRef]
  9. Yuan, W.; Wan, H.J.; Yang, Y.J. Characterization and selection of reference genes for real-time quantitative RT-PCR of plants. Chin. Bull. Bot. 2012, 47, 427–436. [Google Scholar] [CrossRef]
  10. Sun, H.; Jiang, X.; Sun, M.; Cong, H.; Qiao, F. Evaluation of reference genes for normalizing RT-qPCR in leaves and suspension cells of Cephalotaxus hainanensis under various stimuli. Plant Methods 2019, 15, 31. [Google Scholar] [CrossRef]
  11. Long, X.Y.; Wang, J.R.; Ouellet, T.; Rocheleau, H.; Wei, Y.M.; Pu, Z.E.; Jiang, Q.T.; Lan, X.J.; Zheng, Y.L. Genome-wide identification and evaluation of novel internal control genes for Q-PCR based transcript normalization in wheat. Plant Mol. Biol. 2010, 74, 307–311. [Google Scholar] [CrossRef]
  12. Reid, K.E.; Olsson, N.; Schlosser, J.; Peng, F.; Lund, S.T. An optimized grapevine RNA isolation procedure and statistical de-termination of reference genes for real-time RT-PCR during berry development. BMC Plant Biol. 2006, 6, 27. [Google Scholar] [CrossRef]
  13. Liu, Y.P.; Zhang, Y.; Liu, F.; Liu, T.; Chen, J.Y.; Fu, G.; Zheng, C.Y.; Su, D.D.; Wang, Y.N.; Zhou, H.K. Establishment of reference (housekeeping) genes via quantitative real-time PCR for investigation of the genomic basis of abiotic stress resistance in Psammochloa villosa (Poaceae). J. Plant Physiol. 2022, 268, 153575. [Google Scholar] [CrossRef]
  14. Nicot, N.; Hausman, J.F.; Hoffmann, L.; Evers, D. Housekeeping gene selection for real-time RT-PCR normalization in potato during biotic and abiotic stress. J. Exp. Bot. 2005, 56, 2907–2914. [Google Scholar] [CrossRef]
  15. Li, Y.; Li, F.; Zheng, T.T.; Shi, L.; Zhang, Z.G.; Niu, T.M.; Wang, Q.Y.; Zhao, D.S.; Li, W.; Zhao, P. Lamiophlomis herba: A comprehensive overview of its chemical constituents, pharmacology, clinical applications, and quality control. Biomed. Pharmacother. 2021, 144, 112299. [Google Scholar] [CrossRef]
  16. Huang, X.J.; Wang, J.; Muhammad, A.; Tong, H.Y.; Wang, D.G.; Li, J.; Ihsan, A.; Yang, G.Z. Systems pharmacology-based dissection of mechanisms of Tibetan medicinal compound Ruteng as an effective treatment for collagen-induced arthritis rats. J. Ethnopharmacol. 2021, 272, 113953. [Google Scholar] [CrossRef]
  17. Xia, M.; Zhang, Y.; Wu, H.; Zhang, Q.; Liu, Q.; Li, G.; Zhao, T.; Liu, X.; Zheng, S.; Qian, Z.; et al. Forsythoside B attenuates neuro-inflammation and neuronal apoptosis by inhibition of NF-κB and p38-MAPK signaling pathways through activating Nrf2 post spinal cord injury. Int. Immunopharmacol. 2022, 111, 109120. [Google Scholar] [CrossRef]
  18. Ma, L.; Zhong, M.; Jiang, G.; Long, F.; Wu, W.; Jiang, Y. Elucidation of the active ingredients of Lamiophlomis herba against hemorrhage based on network pharmacology and tail snipping model in mice. Pharmazie 2020, 8, 381–384. [Google Scholar] [CrossRef]
  19. La, M.; Zhang, F.; Gao, S.; Liu, X.; Wu, Z.; Sun, L.; Tao, X.; Chen, W. Constituent analysis and quality control of Lamiophlomis rotata by LC-TOF/MS and HPLC-UV. J. Pharm. Biomed. Anal. 2015, 102, 366–376. [Google Scholar] [CrossRef] [PubMed]
  20. Zhao, X.; Jiang, S.; Dong, Q.; Dang, J.; Liu, Z.; Han, H.; Tao, Y.; Yue, H. Anti-rheumatoid arthritis effects of iridoid glucosides from Lamiophlomis rotata (Benth.) kudo on adjuvant-induced arthritis in rats by OPG/RANKL/NF-κB signaling pathways. J. Ethnopharmacol. 2021, 266, 13402. [Google Scholar] [CrossRef] [PubMed]
  21. Fan, P.C.; Ma, H.P.; Hao, Y.; He, X.R.; Sun, A.J.; Jiang, W.; Li, M.X.; Jing, L.L.; He, L.; Ma, J.; et al. A new anti-fibrinolytic hemostatic com-pound 8-O-acetyl shanzhiside methylester extracted from Lamiophlomis rotata. J. Ethnopharmacol. 2016, 187, 232–238. [Google Scholar] [CrossRef]
  22. Zhu, B.; Gong, N.; Fan, H.; Peng, C.S.; Ding, X.J.; Jiang, Y.; Wang, Y.X. Lamiophlomis rotata, an orally available Tibetan herbal painkiller, specifically reduces pain hypersensitivity states through the activation of spinal glucagon-like peptide-1 receptors. Anesthesiology 2014, 121, 835–851. [Google Scholar] [CrossRef]
  23. Cui, Z.H.; Qin, S.S.; Zang, E.H.; Li, C.; Gao, L.; Li, Q.C.; Wang, Y.L.; Huang, X.Z.; Zhang, Z.Y.; Li, M.H. Traditional uses, phytochemistry, pharmacology and toxicology of Lamiophlomis rotata (Benth.) Kudo: A review. RSC Adv. 2020, 10, 11463–11474. [Google Scholar] [CrossRef] [PubMed]
  24. Guan, X.; Li, Z.; Zhou, Y.; Shao, W.; Zhang, D. Active learning for efficient analysis of high-throughput nanopore data. Bioinformatics 2023, 39, 764. [Google Scholar] [CrossRef] [PubMed]
  25. Mursyidah, A.K.; Hafizzudin-Fedeli, M.; Nor Muhammad, N.A.; Latiff, A.; Firdaus-Raih, M.; Wan, K.L. Dissecting the biology of Rafflesia species: Current progress and future directions made possible with high-throughput sequencing data. Plant Cell Physiol. 2023, 6, 4. [Google Scholar] [CrossRef]
  26. Julca, I.; Tan, Q.W.; Mutwil, M. Toward kingdom-wide analyses of gene expression. Trends Plant Sci. 2023, 28, 235–249. [Google Scholar] [CrossRef]
  27. Kapoor, B.; Kumar, A.; Kumar, P. Transcriptome repository of north-western himalayan endangered medicinal herbs: A paramount approach illuminating molecular perspective of phytoactive molecules and secondary metabolism. Mol. Genet. Genom. 2021, 296, 1177–1202. [Google Scholar] [CrossRef] [PubMed]
  28. Tang, X.; Li, J.; Liu, L.; Jing, H.; Zuo, W.; Zeng, Y. Transcriptome analysis provides insights into Potentilla bifurca adaptation to high altitude. Life 2022, 12, 1337. [Google Scholar] [CrossRef] [PubMed]
  29. Xiao, X.O.; Lin, W.; Feng, E.; Ou, X. Transcriptome and metabolome response of eggplant against Ralstonia solanacearum infection. PeerJ 2023, 11, 14658. [Google Scholar] [CrossRef] [PubMed]
  30. Liang, N.; Charron, J.B.; Jabaji, S. Comparative transcriptome analysis reveals the biocontrol mechanism of Bacillus velezensis E68 against Fusarium graminearum DAOMC 180378, the causal agent of Fusarium head blight. PLoS ONE 2023, 18, 0277983. [Google Scholar] [CrossRef]
  31. Saberi Riseh, R.; Skorik, Y.A.; Thakur, V.K.; Moradi Pour, M.; Tamanadar, E.; Noghabi, S.S. Encapsulation of plant biocontrol bacteria with alginate as a main polymer material. Int. J. Mol. Sci. 2021, 22, 11165. [Google Scholar] [CrossRef] [PubMed]
  32. Zhao, Z.; Zhang, Z.; Ding, Z.; Meng, H.; Shen, R.; Tang, H.; Liu, Y.G.; Chen, L. Public-transcriptome-database-assisted selection and validation of reliable reference genes for qRT-PCR in rice. Sci. China Life Sci. 2020, 63, 92–101. [Google Scholar] [CrossRef]
  33. Bai, X.; Chen, T.; Wu, Y.; Tang, M.; Xu, Z.-F. Selection and validation of reference genes for qRT-PCR analysis in the oil-rich tuber crop tiger nut (Cyperus esculentus) based on transcriptome data. Int. J. Mol. Sci. 2021, 22, 2569. [Google Scholar] [CrossRef] [PubMed]
  34. Dos Santos, K.C.G.; Desgagné-Penix, I.; Germain, H. Custom selected reference genes outperform pre-defined reference genes in transcriptomic analysis. BMC Genom. 2020, 21, 35. [Google Scholar] [CrossRef] [PubMed]
  35. St-Pierre, J.; Grégoire, J.C.; Vaillancourt, C. A simple method to assess group difference in RT-qPCR reference gene selection using GeNorm: The case of the placental sex. Sci. Rep. 2017, 7, 16923. [Google Scholar] [CrossRef] [PubMed]
  36. Andersen, C.L.; Jensen, J.L.; Ørntoft, T.F. Normalization of real-time quantitative reverse transcription-PCR data: A model-based variance estimation approach to identify genes suited for normalization, applied to bladder and colon cancer data sets. Cancer Res. 2004, 64, 5245–5250. [Google Scholar] [CrossRef] [PubMed]
  37. Pfaffl, M.W.; Tichopad, A.; Prgomet, C.; Neuvians, T.P. Determination of stable housekeeping genes, differentially regulated target genes and sample integrity: BestKeeper—Excel-based tool using pair-wise correlations. Biotechnol. Lett. 2004, 26, 509–515. [Google Scholar] [CrossRef] [PubMed]
  38. Xie, F.; Xiao, P.; Chen, D.; Xu, L.; Zhang, B. miRDeepFinder: A miRNA analysis tool for deep sequencing of plant small RNAs. Plant Mol. Biol. 2012, 31, 75–84. [Google Scholar] [CrossRef]
  39. Pfaffl, M.W. A new mathematical model for relative quantification in real-time RT–PCR. Nucleic Acids Res. 2001, 29, e45. [Google Scholar] [CrossRef] [PubMed]
  40. Yao, J.; Zhu, G.; Liang, D.; He, B.; Wang, Y.; Cai, Y.; Zhang, Q. Reference gene selection for qPCR analysis in Schima superba under abiotic stress. Genes 2022, 13, 1887. [Google Scholar] [CrossRef]
  41. Qu, R.; Miao, Y.; Cui, Y.; Cao, Y.; Zhou, Y.; Tang, X.; Yang, J.; Wang, F. Selection of reference genes for the quantitative real-time PCR normalization of gene expression in Isatis indigotica fortune. BMC Mol. Biol. 2019, 20, 9. [Google Scholar] [CrossRef] [PubMed]
  42. Ma, R.; Xu, S.; Zhao, Y.; Xia, B.; Wang, R. Selection and validation of appropriate reference genes for quantitative real-time PCR analysis of gene expression in Lycoris aurea. Front. Plant Sci. 2016, 7, 536. [Google Scholar] [CrossRef] [PubMed]
  43. Yin, H.; Yin, D.; Zhang, M.; Gao, Z.; Tuluhong, M.; Li, X.; Li, J.; Li, B.; Cui, G. Validation of appropriate reference genes for qRT–PCR normalization in oat (Avena sativa L.) under UV-B and high-light stresses. Int. J. Mol. Sci. 2022, 23, 11187. [Google Scholar] [CrossRef]
  44. Akbarabadi, A.; Ismaili, A.; Kahrizi, D.; Nazarian Firouzabadi, F. Validation of expression stability of reference genes in response to herbicide stress in wild oat (Avena ludoviciana). Cell Mol. Biol. 2018, 4, 113–118. [Google Scholar] [CrossRef]
  45. Hossain, M.S.; Ahmed, R.; Haque, M.S.; Alam, M.M.; Islam, M.S. Identification and validation of reference genes for real-time quantitative RT-PCR analysis in jute. BMC Mol. Biol. 2019, 20, 13. [Google Scholar] [CrossRef] [PubMed]
  46. Yang, Z.; Zhang, R.; Zhou, Z. Identification and validation of reference genes for gene expression analysis in Schima superba. Genes 2021, 12, 732. [Google Scholar] [CrossRef] [PubMed]
  47. Zhang, Z.; Li, C.; Zhang, J.; Chen, F.; Gong, Y.; Li, Y.; Su, Y.; Wei, Y.; Zhao, Y. Selection of the reference gene for expression normalization in Papaver somniferum, L. under abiotic stress and hormone treatment. Genes 2020, 11, 124. [Google Scholar] [CrossRef]
  48. Liu, C.; Wang, L.; Sun, Y.; Zhao, X.; Chen, T.; Su, X.; Guo, H.; Wang, Q.; Xi, X.; Ding, Y.; et al. Probe synthesis reveals eukaryotic translation elongation factor[1-Alpha]1 as the anti-pancreatic cancer target of BE-43547A. Angew. Chem. Int. Ed. Engl. 2022, 61, e202206953. [Google Scholar] [CrossRef]
  49. Kristensen, R.; Torp, M.; Kosiak, B.; Holst-Jensen, A. Phylogeny and toxigenic potential is correlated in Fusarium species as revealed by partial translation elongation factor 1 alpha gene sequences. Mycol. Res. 2005, 109, 173–186. [Google Scholar] [CrossRef]
  50. Tatsuka, M.; Mitsui, H.; Wada, M.; Nagata, A.; Nojima, H.; Okayama, H. Elongation factor-1α gene determines susceptibility to transformation. Nature 1992, 359, 333–336. [Google Scholar] [CrossRef]
  51. Hammond, G.R.V.; Pacheco, J. Oxysterol binding protein: Tether, transporter... and Flux Capacitor? Trends Cell Biol. 2019, 29, 531–533. [Google Scholar] [CrossRef] [PubMed]
  52. Zhang, S.; Zhou, F.; Liu, Z.; Feng, X.; Li, Y.; Zhu, P. Inactivation of BoORP3a, an oxysterol-binding protein, causes a low wax phenotype in ornamental kale. Hortic. Res. 2022, 9, 219. [Google Scholar] [CrossRef] [PubMed]
  53. Soni, P.; Shivhare, R.; Kaur, A.; Bansal, S.; Sonah, H.; Deshmukh, R.; Giri, J.; Lata, C.; Ram, H. Reference gene identification for gene expression analysis in rice under different metal stress. J. Biotechnol. 2021, 332, 83–93. [Google Scholar] [CrossRef] [PubMed]
  54. Qiao, Z.W.; Wang, D.R.; Wang, X.; You, C.X.; Wang, X.F. Genome-wide identification and stress response analysis of cyclophilin gene family in apple (Malus × domestica). BMC Genom. 2022, 23, 806. [Google Scholar] [CrossRef]
  55. Chen, Q.; Chen, Q.-J.; Sun, G.-Q.; Zheng, K.; Yao, Z.-P.; Han, Y.-H.; Wang, L.-P.; Duan, Y.-J.; Yu, D.-Q.; Qu, Y.-Y. Genome-wide identification of cyclophilin gene family in cotton and expression analysis of the fibre development in Gossypium barbadense. Int. J. Mol. Sci. 2019, 20, 349. [Google Scholar] [CrossRef] [PubMed]
  56. Kumar, S.; Ahmad, A.; Kushwaha, N.; Shokeen, N.; Negi, S.; Gautam, K.; Singh, A.; Tiwari, P.; Garg, R.; Agarwal, R.; et al. Selection of ideal reference genes for gene expression analysis in COVID-19 and Mucormycosis. Microbiol. Spectr. 2022, 10, e0165622. [Google Scholar] [CrossRef] [PubMed]
  57. Zhang, Y.; Zhao, Y.; Wang, J.; Hu, T.; Tong, Y.; Zhou, J.; Song, Y.; Gao, W.; Huang, L. Overexpression and RNA interference of TwDXR regulate the accumulation of terpenoid active ingredients in Tripterygium wilfordii. Biotechnol. Lett. 2018, 40, 419–425. [Google Scholar] [CrossRef] [PubMed]
  58. Henriquez, M.A.; Soliman, A.; Li, G.; Hannoufa, A.; Ayele, B.T.; Daayf, F. Molecular cloning, functional characterization and expression of potato (Solanum tuberosum) 1-deoxy-d-xylulose 5-phosphate synthase 1 (StDXS1) in response to Phytophthora infestans. Plant Sci. 2016, 243, 71–83. [Google Scholar] [CrossRef]
  59. Hao, G.; Shi, R.; Tao, R.; Fang, Q.; Jiang, X.; Ji, H.; Feng, L.; Huang, L. Cloning, molecular characterization and functional analysis of 1-hydroxy-2-methyl-2-(E)-butenyl-4-diphosphate reductase (HDR) gene for diterpenoid tanshinone biosynthesis in Salvia miltiorrhiza Bge. f. alba. Plant Physiol. Biochem. 2013, 70, 21–32. [Google Scholar] [CrossRef]
  60. Tong, Y.; Su, P.; Zhao, Y.; Zhang, M.; Wang, X.; Liu, Y.; Zhang, X.; Gao, W.; Huang, L. Molecular cloning and characterization of DXS and DXR genes in the terpenoid biosynthetic pathway of Tripterygium wilfordii. Int. J. Mol. Sci. 2015, 16, 25516–25535. [Google Scholar] [CrossRef]
  61. Zhou, W.; Huang, F.; Li, S.; Wang, Y.; Zhou, C.; Shi, M.; Wang, J.; Chen, Y.; Wang, Y.; Wang, H.; et al. Molecular cloning and characterization of two 1-deoxy-D-xylulose-5-phosphate synthase genes involved in tanshinone biosynthesis in Salvia miltiorrhiza. Mol. Breed. 2016, 36, 124. [Google Scholar] [CrossRef]
  62. Kim, Y.B.; Kim, S.M.; Sathasivam, R.; Kim, Y.K.; Park, S.U.; Kim, S.U. Overexpression of Ginkgo biloba Hydroxy-2-methyl-2-(E)-butenyl 4-diphosphate reductase 2 gene (GbHDR2) in Nicotiana tabacum cv. Xanthi. 3 Biotech. 2021, 11, 337. [Google Scholar] [CrossRef] [PubMed]
Figure 1. L. rotata in five different habitats. GL: Guoluo county in Qinghai province; XW: Xiewu county in Qinghai province; YS: Yushu county in Qinghai province; ZD: Zaduo county in Qinghai province; CD: Chengduo county in Qinghai province. Bar = 2 cm.
Genes 14 00573 g001
Figure 2. The correlation coefficient of each primer pair used for RT-qPCR. A graph of Ct value vs. the serial dilution factor of cDNA was drawn to determine the correlation coefficient (R2). Its value for each reference gene has been mentioned within the respective graph.
Genes 14 00573 g002
Figure 3. Gene expression levels of the candidate reference genes displayed as Ct values across leaf, root, and leaf + root samples of L. rotata from five habitats. The graph also shows the variation in Ct values for each reference gene. Whiskers across the box depict the highest and lowest values.
Genes 14 00573 g003
Figure 4. Average expression stability (M value) of fifteen candidate reference genes based on geNorm analyses. The most stably expressed reference genes have the lowest M values. M values were calculated for leaf, root, and leaf + root tissues of L. rotata from five habitats. Genes with M values lower than 1.5 may be used as candidate reference genes.
Genes 14 00573 g004
Figure 5. Determination of the optimal number of reference genes for each type of different habitat through geNorm analysis. Pairwise variation (V) was calculated by geNorm to determine the required number of reference genes for accurate normalization under different habitats. geNorm calculates pairwise variation (Vn/Vn + 1) for the normalization factors NFn and NFn + 1 to determine (V < 0.15) the optimal number of reference genes.
Genes 14 00573 g005
Figure 6. Expression stability values for 15 candidate reference genes calculated by NormFinder.
Genes 14 00573 g006
Figure 7. Ranking of candidate reference gene stability by RefFinder analysis.
Genes 14 00573 g007
Figure 8. The relative expression of DXR, HDR, and DXS of L. rotata roots and leaves in different regions. TFIIS, EF-1α, CYP22, OBP, and TIP41 all were reference genes. DXR, HDR, and DXR all were target genes related to the biosynthetic pathway of iridoid compounds in L. rotata. The purple curve was based on the TFIIS reference gene, the red curve was based on the EF-1α reference gene in leaves or OBP reference gene in roots, the green curve was based on the CYP22 reference gene, and the black curve was based on the TIP41 reference gene.
Genes 14 00573 g008
Table 1. The habitat and site of L. rotata from five regions.
Sample NameSampling LocationAltitudeEast LongitudeNorth Latitude
GLGuoluo county, Qinghai, China3750 m100°14′38″34°29′10″
XWXiewu county, Qinghai, China3860 m97°21′3″33°7′46″
YSYushu county, Qinghai, China3880 m97°1′23″32°51′4″
ZDZaduo county, Qinghai, China4208 m95°10′48″32°52′12″
CDChengduo county, Qinghai, China4270 m97°27′16″33°18′2″
Table 2. Primer sequence information for reference genes in RT-qPCR analyses.
Gene NameGene Transcript Genbank No.Primer Sequence Product Length (bp)Primer Efficiency
ACT8OQ471970F: ACTCACTTGCGGTCCAGTTATCC
R: ATAACAGCTCCAGGGACTTCCAC
1071.13
CYP22OQ471972F: CTTCGACATCACCATCGGAAAC
R: TTCCTGTATTCGCCTGTGCAGT
1171.02
CYP95OQ471971F: GCAACGGTCTCTCCTCCAAGA
R: CTCACAGGGCTTCGACTTGGT
860.90
TIP41OQ471973F: GGGAAGACTGCCAGGATCAAAT
R: AGCCAGAAGCGCAAGAGAAGAT
1751.07
TFIISOQ471974F: GAGTTTGAGCCACGCTCGATT
R: TCTTGCACCTCCCACAAGTGA
1631.02
EF-1αOQ471975F: ACTGGGACTTCTCAGGCTGATTG
R: CTGGCCTTGGAGTACTTTGGTGT
1881.03
ACT7OQ471976F: CACCACCCGAAAGAAAGTACAGTG
R: AGGACCCGATTCATCATACTCTCC
1101.14
PP2AOQ471977F: GCTCATGTGTTGCTCCCTCCT
R: GCTGCCAGCCTCTTCACAAGT
1551.05
OBPOQ471978F: GGAACCTCTTCCTGGCACAGA
R: AACCAGACTTGGCGAGGTCAC
1971.13
TUBOQ471979F: CAAACTCGCCGTGAACCTCAT
R: CGTCCCACATTTGCTGGGTAA
1341.14
CYP23OQ471980F: TGCGCCCTGTGCAATTCTATC
R: AACTGTCTTTGGCGCGACACT
1321.13
RPLOQ471981F: GAAACCCGCTGTCGTTAAACC
R: CTATCATCGCGCTTTCCTTCC
1511.02
TrpDOQ471982F: CTGAGGCTGAGGCTTCTCTTGA
R: CACCACCAGTCCCAACAATGTC
1921.14
AOOQ471983F: GTCGCCTACAAGCCAAATAGGG
R: GACGACATCCATGTGCATACCA
991.01
SNAPOQ471984F: GTATGAAGACGCTGCCGATTTG
R: GCATTAGCTGCTTCATGCTTGC
1411.14
Table 3. Primer sequence information for target genes in L. rotata.
Gene NameGene Transcript
Genbank No.
Primer Sequence (5′–3′) (Forward/Reverse)Amplicon Length (bp)
DXSOQ471985F: GAAGGGGAGAGGGTGGCTCTAT
R: GAGCACCATCCAACGGCTTAC
136
HDROQ471986F: CTTGCCGGAGACCAGAATATC
R: GCCTTGGCGTTAAACTCAGAC
111
DXROQ471987F: CGAGCAGAACTTGTCACATCG
R: CTGCAAACTAGCCGCGTAATC
84
Table 4. Ranking of candidate reference gene stability by BestKeeper analysis.
Reference GeneLeafRootLeaf + Root
CV
Value
SD ValueRankCV
Value
SD
Value
RankCV ValueSD ValueRank
TrpD2.840.9211.580.5112.280.741
AO4.091.2761.650.5022.790.852
SNAP4.161.3272.190.6883.351.053
CYP953.511.0722.390.68103.391.004
ACT83.521.1033.871.16143.541.095
CYP233.861.1552.900.82123.581.046
TIP414.811.4892.060.6163.591.087
PP2A5.401.62111.880.5533.731.108
CYP224.881.55102.120.6274.351.339
EF-1α5.781.47133.050.74134.451.1010
TFIIS4.441.2582.240.5894.481.2211
RPL3.581.1042.780.77115.151.5112
OBP6.571.86152.050.5355.241.4313
ACT75.511.51124.391.08156.461.6814
TUB6.021.86142.010.5349.352.6815
Disclaimer/Publisher’s Note: The statements, opinions and data contained in all publications are solely those of the individual author(s) and contributor(s) and not of MDPI and/or the editor(s). MDPI and/or the editor(s) disclaim responsibility for any injury to people or property resulting from any ideas, methods, instructions or products referred to in the content.

