
NIPAT as Non-Invasive Prenatal Paternity Testing Using a Panel of 861 SNVs
 , , and
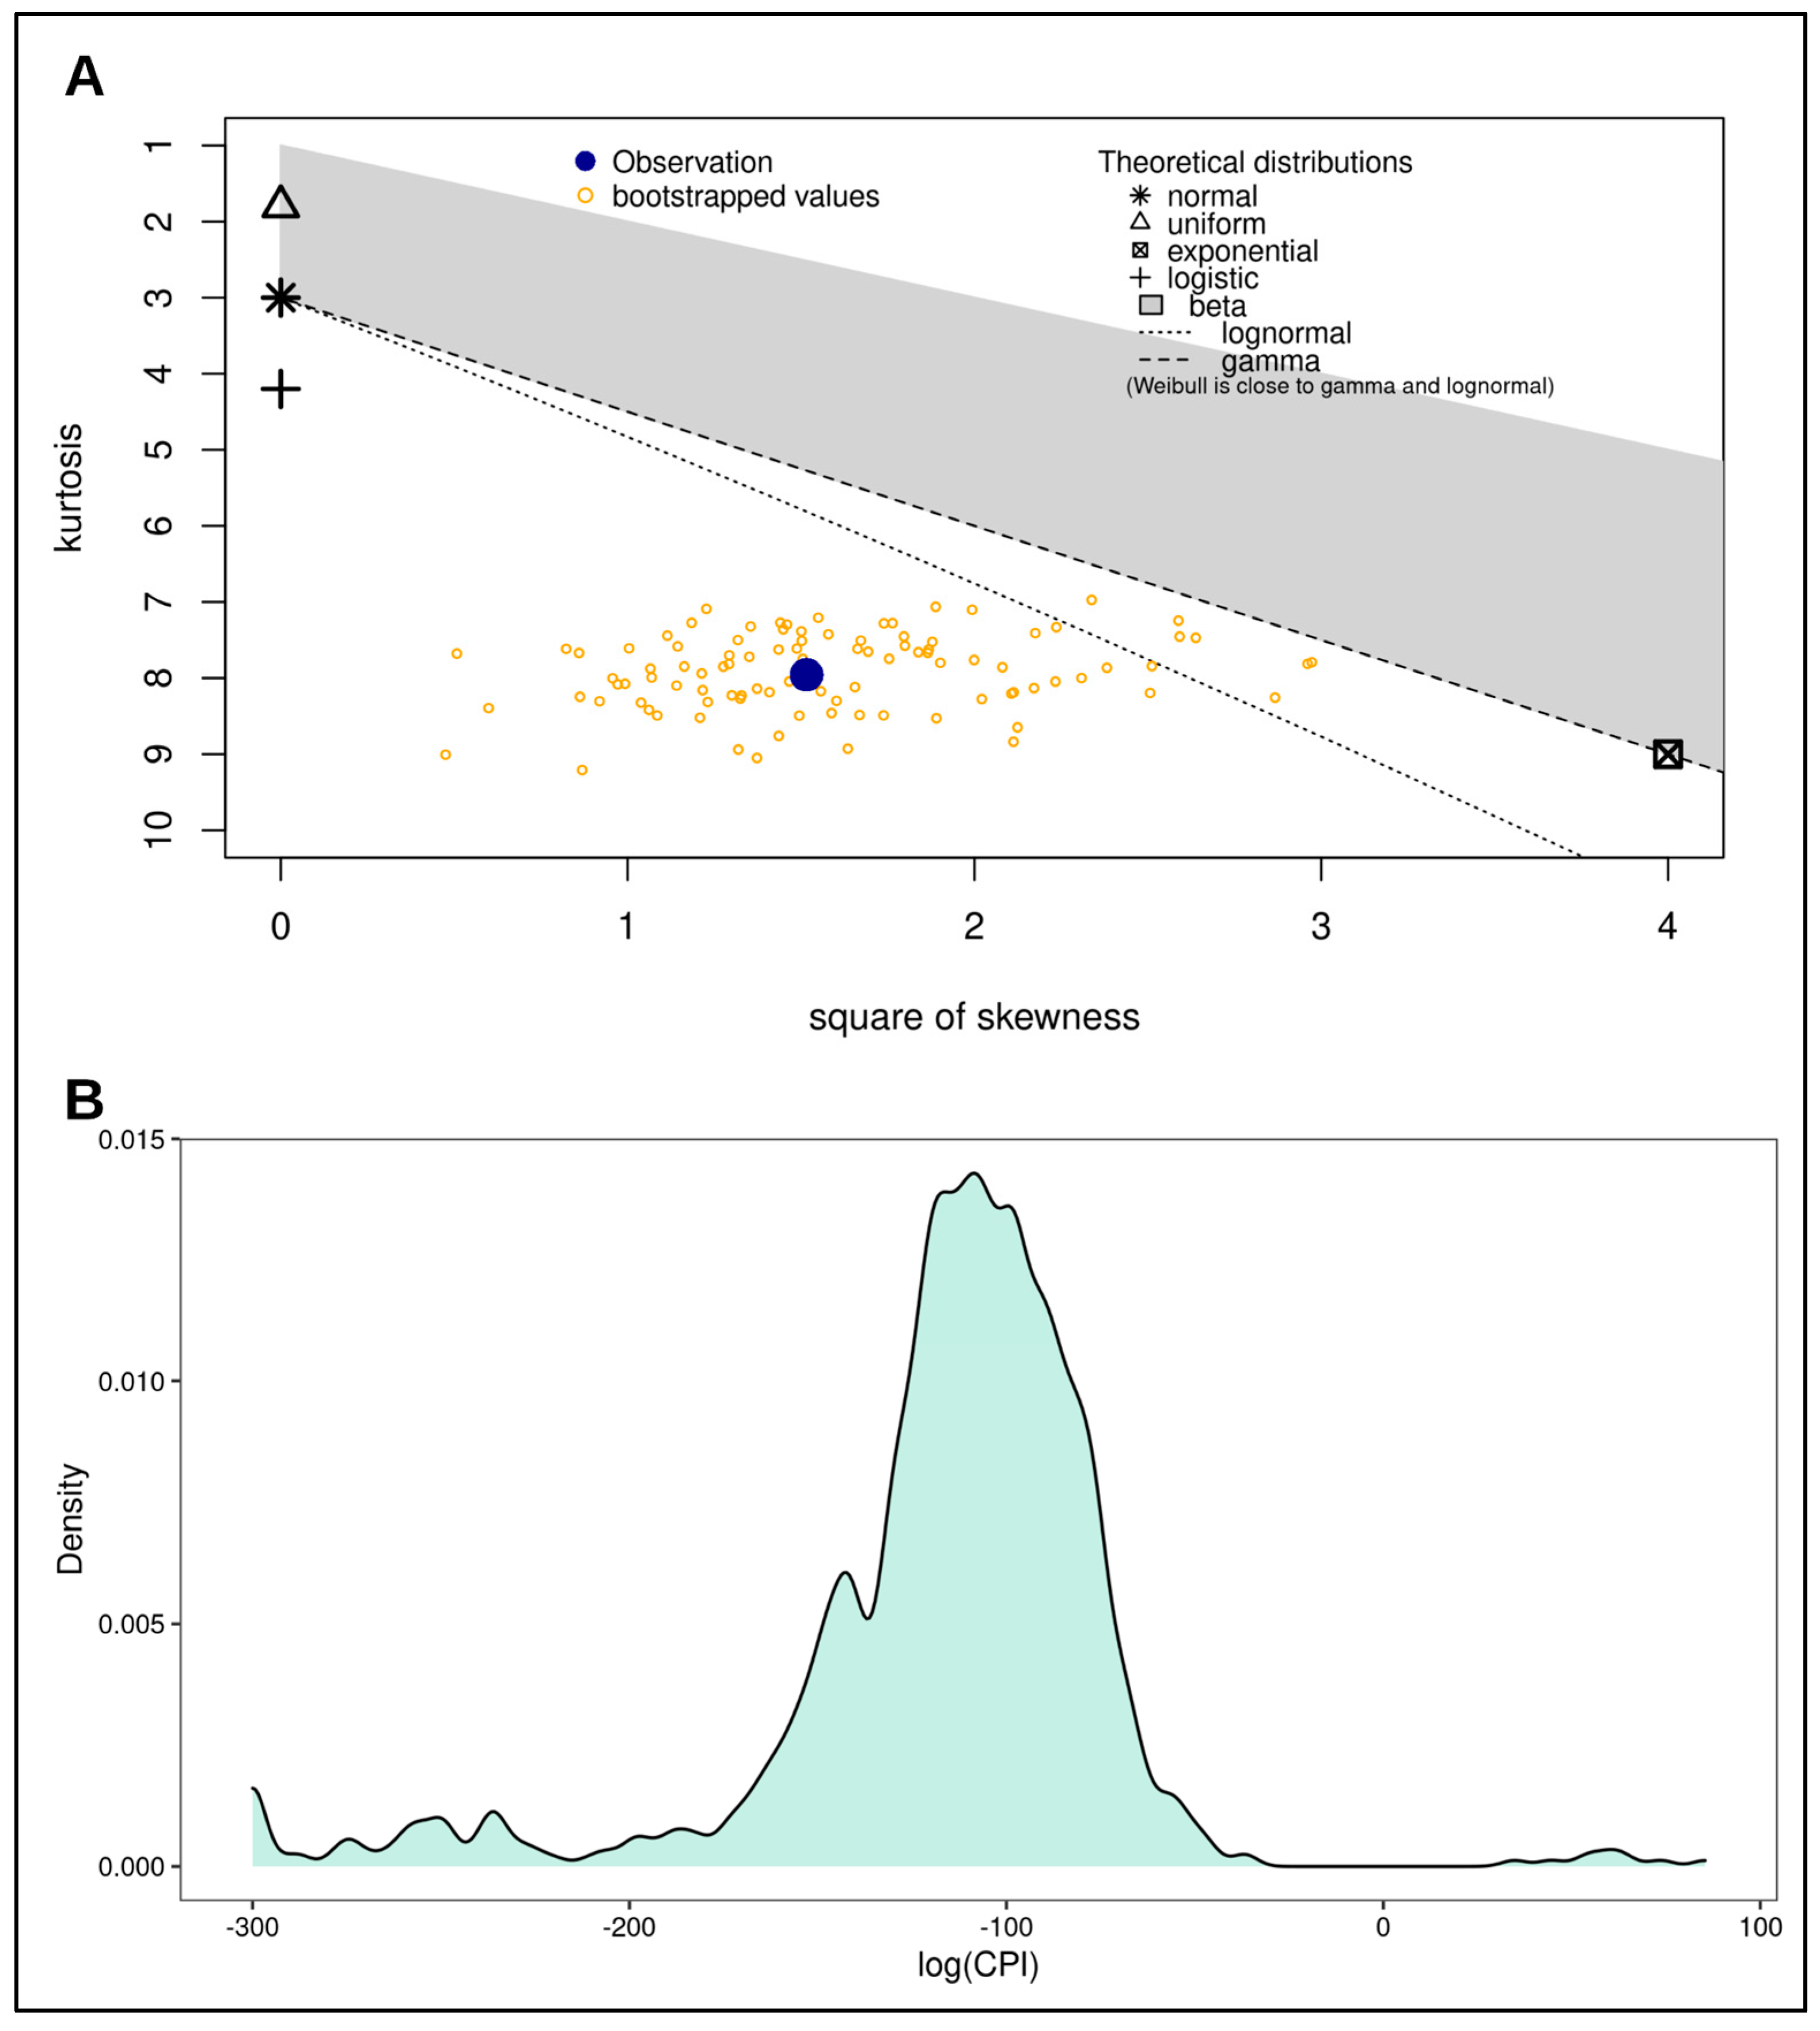
Abstract
:1. Introduction
2. Materials and Methods
2.1. Selection of Samples and NGS Analysis
2.2. NIPAT-Flow Algorithm
2.3. Simulating Father’s Brothers
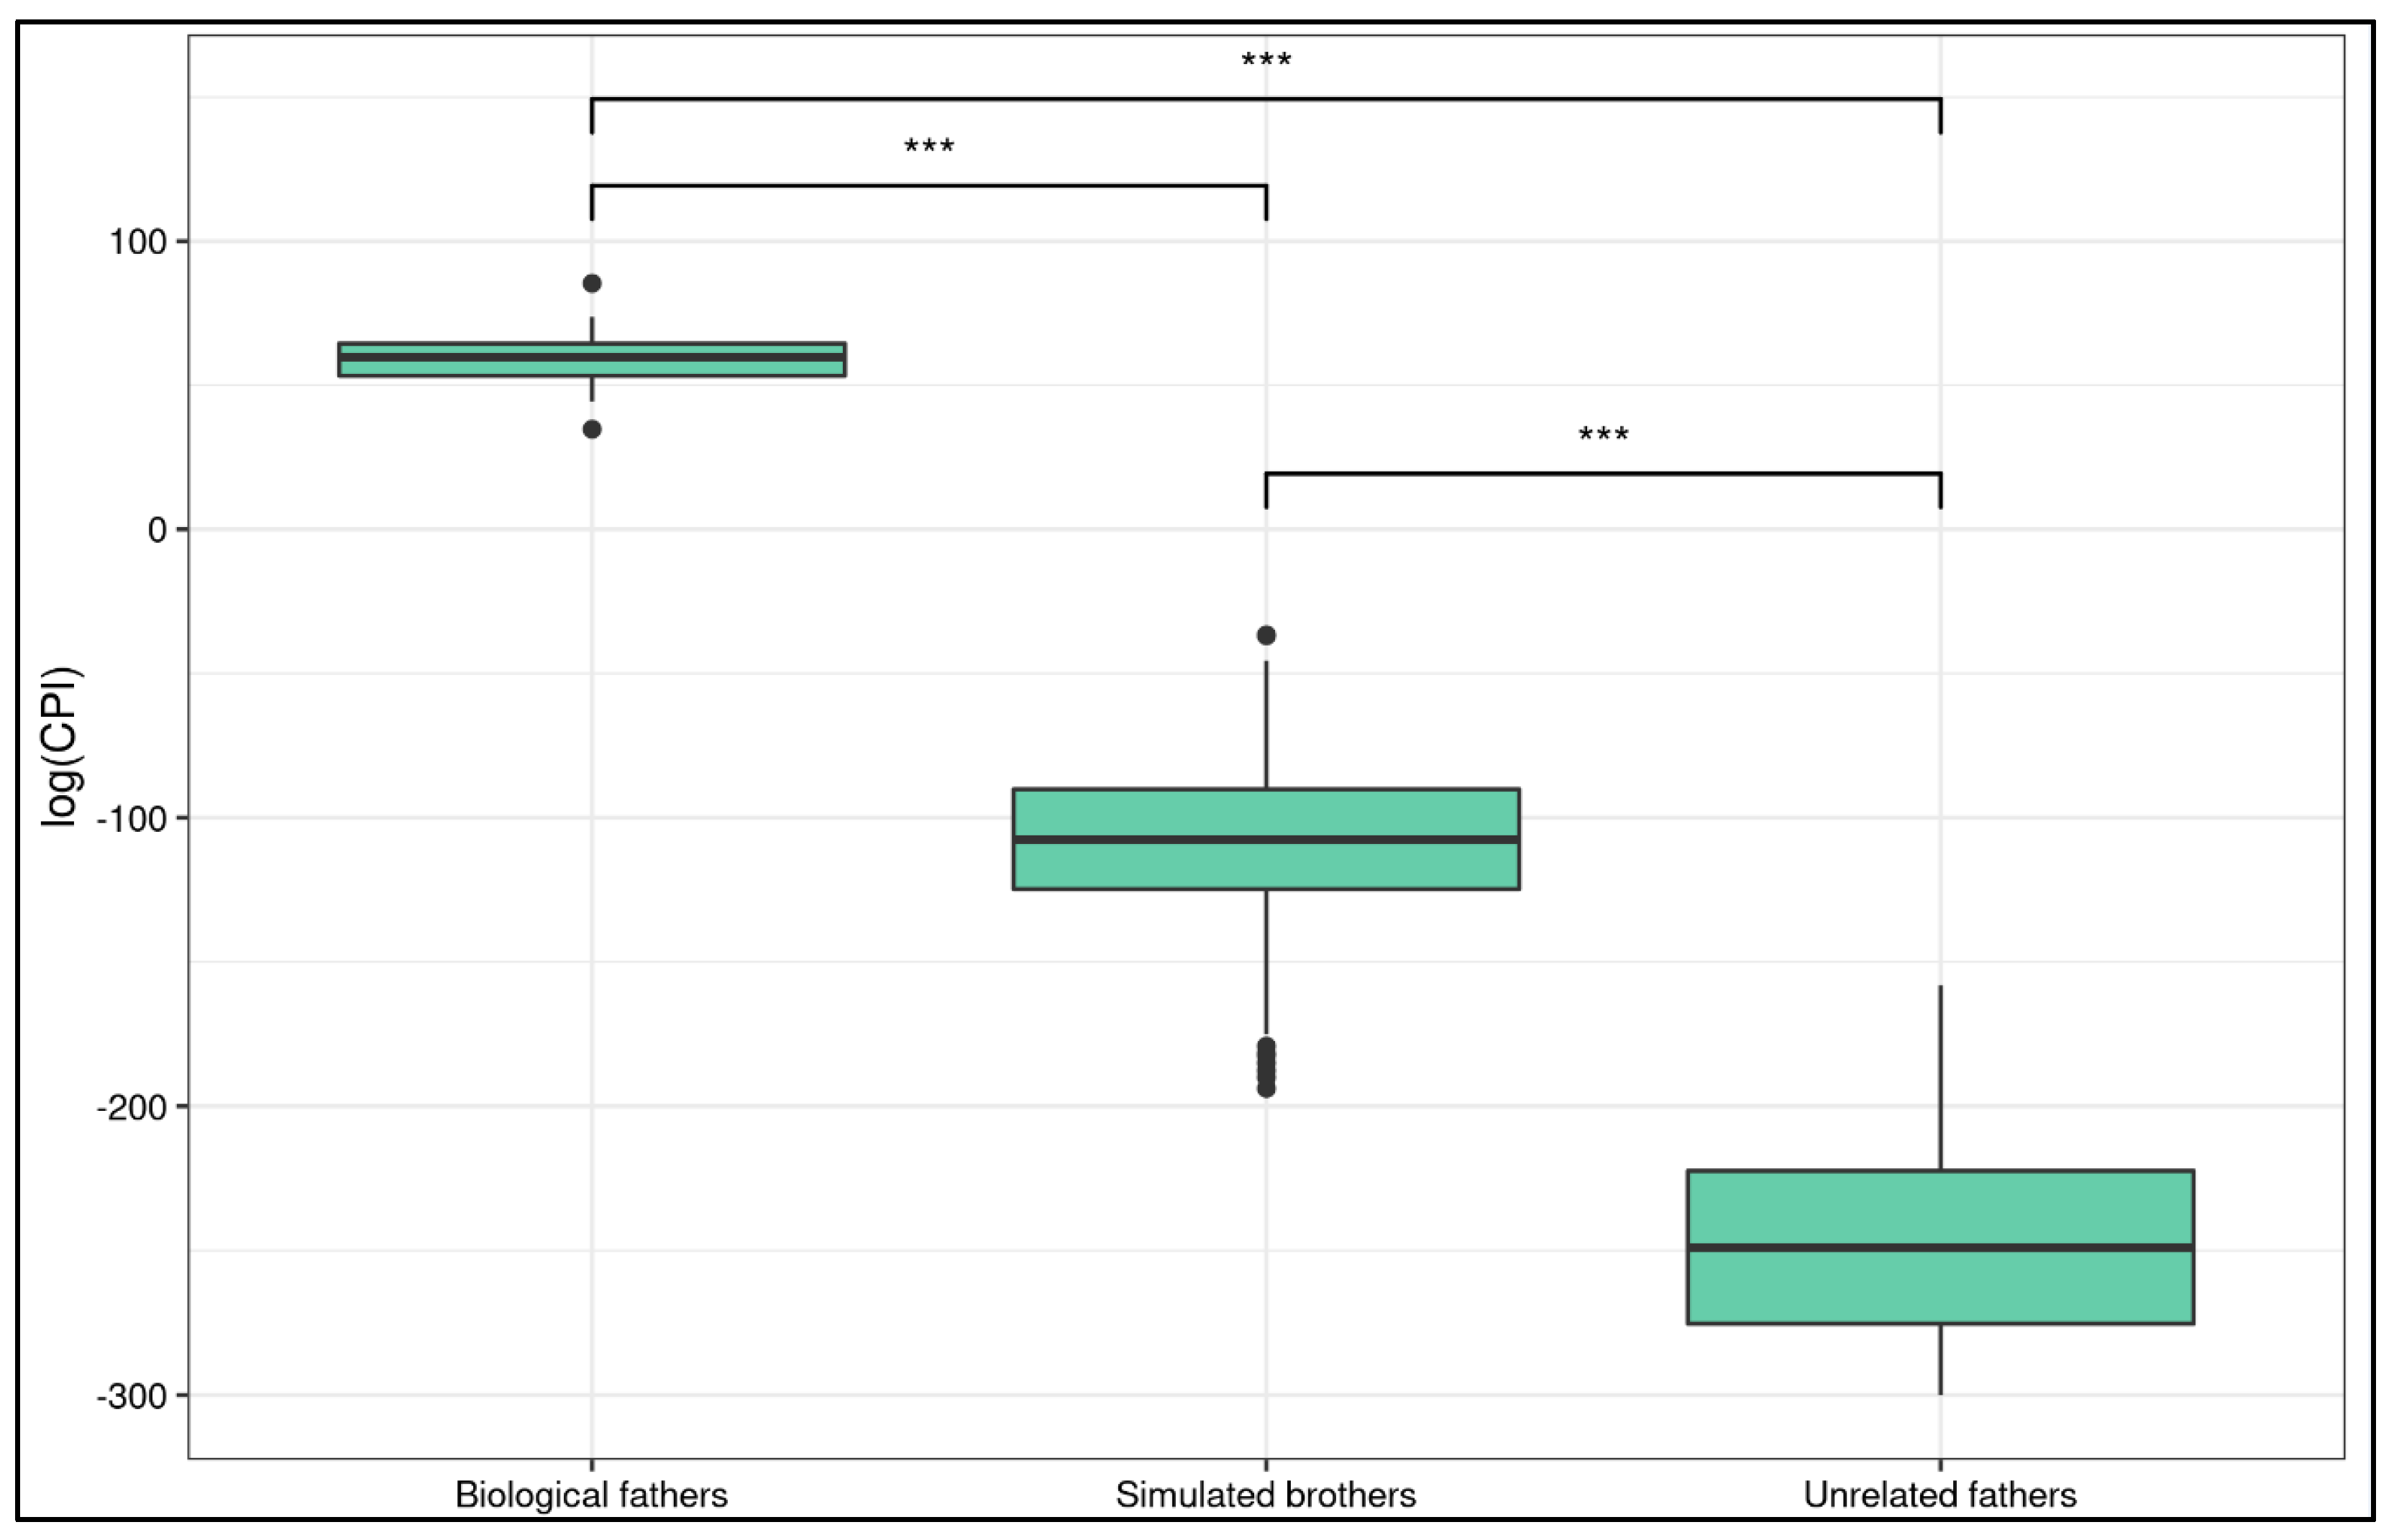
2.4. Statistical Analysis
3. Results
4. Discussion
Supplementary Materials
Author Contributions
Funding
Institutional Review Board Statement
Informed Consent Statement
Data Availability Statement
Conflicts of Interest
References
- Lo, Y.M.; Corbetta, N.; Chamberlain, P.F.; Rai, V.; Sargent, I.L.; Redman, C.W.; Wainscoat, J.S. Presence of fetal DNA in maternal plasma and serum. Lancet 1997, 350, 485–487. [Google Scholar] [CrossRef]
- Lo, Y.M.; Zhang, J.; Leung, T.N.; Lau, T.K.; Chang, A.M.Z.; Hjelm, N.M. Rapid Clearance of Fetal DNA from Maternal Plasma. Am. J. Hum. Genet. 1999, 64, 218–224. [Google Scholar] [CrossRef] [PubMed] [Green Version]
- Kolialexi, A.; Tsangaris, G.T.; Antsaklis, A.; Mavroua, A. Rapid clearance of fetal cells from maternal circulation after delivery. Ann. N. Y. Acad. Sci. 2004, 1022, 113–118. [Google Scholar] [CrossRef] [PubMed]
- Alberry, M.S.; Aziz, E.; Ahmed, S.R.; Abdel-Fattah, S. Non invasive prenatal testing (NIPT) for common aneuploidies and beyond. Eur. J. Obstet. Gynecol. Reprod. Biol. 2021, 258, 424–429. [Google Scholar] [CrossRef] [PubMed]
- Samura, O.J. Update on noninvasive prenatal testing: A review based on current worldwide research. Obstet. Gynaecol. Res. 2020, 46, 1246–1254. [Google Scholar] [CrossRef]
- Giardina, E.; Spinella, A.; Novelli, G. Past, present and future of forensic DNA typing. Nanomedicine 2011, 6, 257–270. [Google Scholar] [CrossRef]
- Giardina, E.; Pietrangeli, I.; Martone, C.; Zampatti, S.; Marsala, P.; Gabriele, L.; Ricci, O.; Solla, G.; Asili, P.; Arcudi, G.; et al. Whole genome amplification and real-time PCR in forensic casework. BMC Genom. 2009, 10, 159. [Google Scholar] [CrossRef] [Green Version]
- Hansson, O.; Gill, P. Characterisation of artefacts and drop-in events using STR-validator and single-cell analysis. Forensic Sci. Int. Genet. 2017, 30, 57–65. [Google Scholar] [CrossRef]
- Li, C. Forensic genetics. Forensic Sci. Res. 2018, 3, 103–104. [Google Scholar] [CrossRef] [Green Version]
- Giardina, E.; Pietrangeli, I.; Martone, C.; Asili, P.; Predazzi, I.; Marsala, P.; Gabriele, L.; Pipolo, C.; Ricci, O.; Solla, G.; et al. In silico and in vitro comparative analysis to select, validate and test SNPs for human identification. BMC Genom. 2007, 8, 457. [Google Scholar] [CrossRef]
- Ragazzo, M.; Puleri, G.; Errichiello, V.; Manzo, L.; Luzzi, L.; Potenza, S.; Strafella, C.; Peconi, C.; Nicastro, F.; Caputo, V.; et al. Evaluation of OpenArray™ as a Genotyping Method for Forensic DNA Phenotyping and Human Identification. Genes 2021, 12, 221. [Google Scholar] [CrossRef]
- Butler, J.M. Recent advances in forensic biology and forensic DNA typing: INTERPOL review 2019–2022. Forensic Sci. Int. Synerg. 2022, 6, 100311. [Google Scholar] [CrossRef]
- Strafella, C.; Caputo, V.; Termine, A.; Barati, S.; Caltagirone, C.; Giardina, E.; Cascella, R. Investigation of Genetic Variations of IL6 and IL6R as Potential Prognostic and Pharmacogenetics Biomarkers: Implications for COVID-19 and Neuroinflammatory Disorders. Life 2020, 10, 351. [Google Scholar] [CrossRef]
- Ou, X.; Qu, N. Noninvasive prenatal paternity testing by target sequencing microhaps. Forensic Sci. Int. Genet. 2020, 48, 102338. [Google Scholar] [CrossRef]
- Chang, L.; Yu, H.; Miao, X.; Zhang, J.; Li, S. Development and comprehensive evaluation of a noninvasive prenatal paternity testing method through a scaled trial. Forensic Sci. Int. Genet. 2019, 43, 102158. [Google Scholar] [CrossRef]
- Zhang, S.; Han, S.; Zhang, M.; Wang, Y. Non-invasive prenatal paternity testing using cell-free fetal DNA from maternal plasma: DNA isolation and genetic marker studies. Leg. Med. 2018, 32, 98–103. [Google Scholar] [CrossRef]
- Al-Asfi, M.; McNevin, D.; Mehta, B.; Power, D.; Gahan, M.E.; Daniel, R. Assessment of the Precision ID Ancestry panel. Int. J. Leg. Med. 2018, 132, 1581–1594. [Google Scholar] [CrossRef]
- Guo, Y.X.; Jin, X.Y.; Xia, Z.Y.; Chen, C.; Cui, W.; Zhu, B.F. A small NGS-SNP panel of ancestry inference designed to distinguish African, European, East, and South Asian populations. Electrophoresis 2020, 41, 649–656. [Google Scholar] [CrossRef]
- Gjertson, D.W.; Brenner, C.H.; Baur, M.P.; Carracedo, A.; Guidet, F.; Luque, J.A.; Lessig, R.; Mayr, W.R.; Pascali, V.L.; Prinz, M.; et al. ISFG: Recommendations on biostatistics in paternity testing. Forensic Sci. Int. Genet. 2007, 1, 223–231. [Google Scholar] [CrossRef]
- Kanokwongnuwut, P.; Martin, B.; Taylor, D.; Kirkbride, K.P.; Linacre, A. How many cells are required for successful DNA profiling? Forensic Sci. Int. Genet. 2021, 51, 102453. [Google Scholar] [CrossRef]
- Sherry, S.T.; Ward, M.; Sirotkin, K. dbSNP-database for single nucleotide polymorphisms and other classes of minor genetic variation. Genome Res. 1999, 9, 677–679. [Google Scholar] [CrossRef] [PubMed]
- Buckleton, J.S.; Bright, J.A.; Taylor, D. Forensic DNA Evidence Interpretation, 2nd ed.; CRC Press: Boca Raton, FL, USA, 2021; p. 508. [Google Scholar]
- Elias, H.; Guro, D.; Thore, E. relMix: An open source software for DNA mixtures with related contributors. Forensic Sci. Int. Genet. Suppl. Ser. 2019, 7, 221–223. [Google Scholar] [CrossRef] [Green Version]
- Haned, H.; Slooten, K.; Gill, P. Exploratory data analysis for the interpretation of low template DNA mixtures. Forensic Sci. Int. Genet. 2012, 6, 762–774. [Google Scholar] [CrossRef] [PubMed]
- Jiang, H.; Xie, Y.; Li, X.; Ge, H.; Deng, Y.; Mu, H.; Feng, X.; Yin, L.; Du, Z.; Chen, F.; et al. Noninvasive Prenatal Paternity Testing (NIPAT) through Maternal Plasma DNA Sequencing: A Pilot Study. PLoS ONE 2016, 11, e0159385. [Google Scholar] [CrossRef] [Green Version]
- Manichaikul, A.; Mychaleckyj, J.C.; Rich, S.S.; Daly, K.; Sale, M.; Chen, W.M. Robust relationship inference in genome-wide association studies. Bioinformatics 2010, 26, 2867–2873. [Google Scholar] [CrossRef] [Green Version]
- Cullen, A.C.; Frey, C.H.; Frey, C.H. Probabilistic Techniques in Exposure Assessment: A Handbook for Dealing with Variability and Uncertainty in Models and Inputs; Springer Science & Business Media: Berlin/Heidelberg, Germany, 1999; p. 335. [Google Scholar]
- R Core Team. R: A Language and Environment for Statistical Computing; R Foundation for Statistical Computing: Vienna, Austria, 2022. [Google Scholar]
- Ge, J.; Budowle, B. How many familial relationship testing results could be wrong? PLoS Genet. 2020, 16, e1008929. [Google Scholar] [CrossRef]


Disclaimer/Publisher’s Note: The statements, opinions and data contained in all publications are solely those of the individual author(s) and contributor(s) and not of MDPI and/or the editor(s). MDPI and/or the editor(s) disclaim responsibility for any injury to people or property resulting from any ideas, methods, instructions or products referred to in the content. |
© 2023 by the authors. Licensee MDPI, Basel, Switzerland. This article is an open access article distributed under the terms and conditions of the Creative Commons Attribution (CC BY) license (https://creativecommons.org/licenses/by/4.0/).
Share and Cite
Giannico, R.; Forlani, L.; Andrioletti, V.; Cotroneo, E.; Termine, A.; Fabrizio, C.; Cascella, R.; Salvaderi, L.; Linarello, P.; Varrone, D.; et al. NIPAT as Non-Invasive Prenatal Paternity Testing Using a Panel of 861 SNVs. Genes 2023, 14, 312. https://doi.org/10.3390/genes14020312
Giannico R, Forlani L, Andrioletti V, Cotroneo E, Termine A, Fabrizio C, Cascella R, Salvaderi L, Linarello P, Varrone D, et al. NIPAT as Non-Invasive Prenatal Paternity Testing Using a Panel of 861 SNVs. Genes. 2023; 14(2):312. https://doi.org/10.3390/genes14020312
Chicago/Turabian StyleGiannico, Riccardo, Luca Forlani, Valentina Andrioletti, Ettore Cotroneo, Andrea Termine, Carlo Fabrizio, Raffaella Cascella, Luca Salvaderi, Pasquale Linarello, Debora Varrone, and et al. 2023. "NIPAT as Non-Invasive Prenatal Paternity Testing Using a Panel of 861 SNVs" Genes 14, no. 2: 312. https://doi.org/10.3390/genes14020312