Article

Integrated Transcriptome Analysis of miRNAs and mRNAs in the Skeletal Muscle of Wuranke Sheep

1
College of Food Science and Engineering, Inner Mongolia Agricultural University, Hohhot 010018, China
2
School of Life Science and Technology, Inner Mongolia University of Science and Technology, Baotou 014010, China
3
College of Biochemistry and Engineering, Hohhot Vocational College, Hohhot 010051, China
4
Division of Life and Food Science, Graduate School of Science and Technology, Niigata University, Niigata 950-2181, Japan
*
Authors to whom correspondence should be addressed.
Genes 2023, 14(11), 2034; https://doi.org/10.3390/genes14112034
Submission received: 8 October 2023 / Revised: 26 October 2023 / Accepted: 30 October 2023 / Published: 31 October 2023
(This article belongs to the Special Issue Genetics and Genomics of Sheep and Goat)

Abstract

:
MicroRNAs (miRNAs) are regarded as important regulators in skeletal muscle development. To reveal the regulatory roles of miRNAs and their target mRNAs underlying the skeletal muscle development of Wuranke sheep, we investigated the miRNA and mRNA expression profiles in the biceps femoris of these sheep at the fetal (3 months of gestation) and 3- and 15-month-old postnatal stages. Consequently, a total of 1195 miRNAs and 24,959 genes were identified. Furthermore, 474, 461, and 54 differentially expressed miRNAs (DEMs) and 6783, 7407, and 78 differentially expressed genes (DEGs) were detected among three comparative groups. Functional analysis demonstrated that the target mRNAs of the DEMs were enriched in multiple pathways related to muscle development. Moreover, the interactions among several predicted miRNA–mRNA pairs (oar-miR-133-HDAC1, oar-miR-1185-5p-MYH1/HADHA/OXCT1, and PC-5p-3703_578-INSR/ACTG1) that potentially affect skeletal muscle development were verified using dual-luciferase reporter assays. In this study, we identified the miRNA and mRNA differences in the skeletal muscle of Wuranke sheep at different developmental stages and revealed that a series of candidate miRNA–mRNA pairs may act as modulators of muscle development. These results will contribute to future studies on the function of miRNAs and their target mRNAs during skeletal muscle development in Wuranke sheep.

1. Introduction

Skeletal muscle, the largest tissue by body mass, is closely related to the meat production and quality of livestock. The development of skeletal muscle is a complex and multistep biological process that has distinct embryonic and postnatal phases. The embryonic period, the key period of myogenesis, includes the formation, proliferation, and differentiation of myoblasts, the fusion of myotubes, and the maturation of myofibers. The number of muscle fibers is determined during the embryonic period and remains constant after birth, while postnatal muscle development is mainly manifested by an increase in muscle fiber size [1]. These processes are precisely regulated by a complex molecular regulatory network that is composed of a number of genetic factors [2,3].
MicroRNAs (miRNAs), a class of endogenous non-coding RNAs ranging in length from 18 to 25 nucleotides, act as post-transcriptional regulators of target gene expression by promoting mRNA decay or translational repression; they, thus, mediate a variety of biological processes [4,5]. It is known that cell proliferation and differentiation are crucial for the myogenic program, and increasing evidence suggests that many miRNAs play regulatory roles in balancing these two processes by regulating the expression of specific genes, including both the muscle-specific and non-muscle-specific miRNAs reviewed by Xu et al. [6]. Additionally, other studies showed that some miRNAs are also involved in the processes of skeletal muscle regeneration [7], muscle-fiber-type transformation [8], and energy metabolism [9].
Recently, several studies have analyzed miRNA profiles in sheep skeletal muscle using a miRNA sequencing approach. Zhao et al. [10] analyzed the longissimus dorsi muscle (LDM) at four developmental stages of Duolang sheep and obtained a total of 2396 miRNAs, including 1920 novel miRNAs. Further research found that some of these were differentially expressed among the four stages; additionally, miR-192 was confirmed to regulate the proliferation and differentiation of satellite cells in the skeletal muscle of sheep by targeting retinoblastoma 1 (RB1), a negative regulator of the cell cycle, which is involved in myogenesis. Liu et al. [11] identified 1086 known and 40 novel miRNAs in embryonic and adult Kazak sheep, 345 of which were differentially expressed. It was shown that these differentially expressed miRNAs (DEMs) were enriched in multiple signaling pathways related to muscle development. Among them, several were identified as regulators of sheep skeletal muscle cell proliferation and differentiation, such as miR-27b [12], miR-378 [13], miR-181a [14], and miR-22 [15]. Hu et al. [16] studied the expression profiles of miRNAs and their potential roles in the muscle of Chinese Merino sheep at three embryonic stages, detecting 4752 miRNAs, including 2275 novel ones. The expression of miR-410-5p was reduced during the embryonic period and restrained the proliferation of embryonic myoblasts by interacting with TEA domain transcription factor 1 (TEAD1), which activates several muscle-specific genes and regulates myoblast proliferation and differentiation. These studies were limited to the regulation of miRNAs relating to the proliferation and differentiation of sheep skeletal muscle cells, and, compared with the detected sheep miRNAs, most of their functions remain unclear. Thus, the identification of more potential muscle-associated miRNA–mRNA pairs is required in order to reveal such pairs’ underlying regulatory mechanisms.
The Wuranke sheep is an ancient Mongolian breed mainly raised in the northern border area of Abaga, Xilingol, Inner Mongolia, China (E 113°28′–116°11′, N 43°05′–45°26′), a region characterized by severe cold, drought, and wind. Through long-term natural selection and artificial breeding, these sheep demonstrate strong adaptability to the local alpine pastoral ecological environment, a high coarse feeding tolerance, a rapid growth rate, and good meat production performance under natural grazing conditions. Furthermore, they are very popular with consumers because of their delicate flesh and good flavor. Previous studies measured some indicators that reflect the meat performance of Wuranke sheep, such as body weight, body size, and carcass traits, but the molecular regulatory mechanisms involved in skeletal muscle development in this breed remain unclear. To better understand the functions of miRNAs and their target mRNAs that underlie skeletal muscle development in Wuranke sheep, we employed high-throughput sequencing to analyze and compare the expression profiles of miRNA and mRNA in the skeletal muscle of natural grazing Wuranke sheep at three developmental stages. The DEMs between any two stages and their candidate target mRNAs were identified and used for functional enrichment in order to reveal the potential miRNA–mRNA pairs involved in the process of muscle development. Finally, we constructed three miRNA–mRNA interaction networks, and the predicted targets of three miRNAs were validated via dual luciferase reporter assays. The results provided valuable information about the regulatory mechanisms of skeletal muscle development and basic data on the breeding and selection of Wuranke sheep.

2. Materials and Methods

2.1. Sample Collection and RNA Extraction

Wuranke sheep used in this study were collected from the “The original Breeding Farm of Wuranke Sheep” in Abaga Banner, Inner Mongolia, China. All the animals were raised under natural grazing conditions. Pregnant ewes and 3- and 15-month-old male sheep were randomly selected. Male fetuses were from a single birth and were collected at 3 months of gestation via cesarean section. Biceps femoris samples were collected from three male fetuses, three 3-month-old male sheep, and three 15-month-old male sheep, which were as close to the median average body weight of their groups as possible. The collected samples were immediately placed in liquid nitrogen and then stored at −80 °C. miRNeasy Mini Kit (Qiagen, Hilden, Germany) was used to extract the total RNA from each sample. The Agilent 2100 Bioanalyzer and RNA 6000 Nano LabChip Kit (Agilent Technologies, Santa Clara, CA, USA) were used to detect the total RNA quantity and purity, and an RNA integrity number of >7.0 was set as the selection criterion.

2.2. Small RNA Sequencing and Data Analysis

Small RNA libraries were constructed with approximately 1 μg of total RNA using the TruSeq Small RNA Sample Prep Kits (Illumina, San Diego, CA, USA). Then, the libraries were used for single-end (1 × 50 bp) deep sequencing using an Illumina HiSeq 2500 platform. The raw reads were submitted to ACGT101-miR v4.2 (LC Sciences, Houston, TX, USA) to remove adapter dimers, junk, low complexity, common RNA families (rRNA, tRNA, snRNA, and snoRNA), and repeats. Next, unique sequences ranging in length from 18 to 26 nucleotides were aligned to all mature mammalian miRNAs and their precursor sequences in miRBase to identify known miRNAs using BLAST search. In addition, the remaining unmapped sequences that we were able to match to the sheep reference genome (Ovis aries v3.1) were used to predict novel miRNAs using miRDeep2 [17]. Meanwhile, the expression level of each miRNA was normalized using the method described by Li et al. [18], and differential miRNA expressions were analyzed using t-tests. miRNAs with |log2 (fold-change)| ≥ 1 and p < 0.05 were deemed to be differentially expressed between any two developmental stages.

2.3. mRNA Sequencing and Data Analysis

mRNA libraries were constructed with approximately 10 μg of total RNA using the mRNA-Seq Sample Preparation Kit (Illumina, San Diego, CA, USA). Then, the libraries were used for paired-end reads (2 × 150 bp) deep sequencing using an Illumina HiSeq 4000 platform. The raw data were subjected to Cutadapt [19] to remove adaptor sequences, primers, and low-quality sequences in order to obtain clean reads. The HISAT v2.0.4 package (https://daehwankimlab.github.io/hisat2/, accessed on 21 August 2020) [20] was used to align clean reads to the sheep reference genome (Ovis aries v3.1), and StringTie v1.3.4 (http://ccb.jhu.edu/software/stringtie/, accessed on 21 August 2020) [21] was used to assemble the mapped reads and evaluate the expression levels for mRNAs by calculating fragments per kilobase of exon model per million mapped reads (FPKM). Finally, differentially expressed genes (DEGs) with |log2 (fold-change)| ≥ 1 and p < 0.05 as thresholds were identified using the R package Ballgown [22].

2.4. Real-Time Quantitative Polymerase Chain Reaction (RT-qPCR) Analysis

Total RNA was reverse-transcribed using the RevertAid First Strand cDNA Synthesis Kit (Thermo, Waltham, MA, USA), following the manufacturer’s instructions, and using stem-loop primers for miRNA and random primers for mRNA. RT-qPCR was performed using the ABI StepOnePlus Real-Time PCR System (Applied Biosystems) with THUNDERBIRD SYBR qPCR Mix (Toyobo, Osaka, Japan). U6 and GAPDH were used as internal reference genes in normalizing miRNA and mRNA expression, respectively. The 2−ΔΔCt method was employed to measure the relative gene expression [23]. The results are presented as mean ± standard error (SE) of triplicate for each sample. The sequences of the primers are listed in Tables S1 and S2.

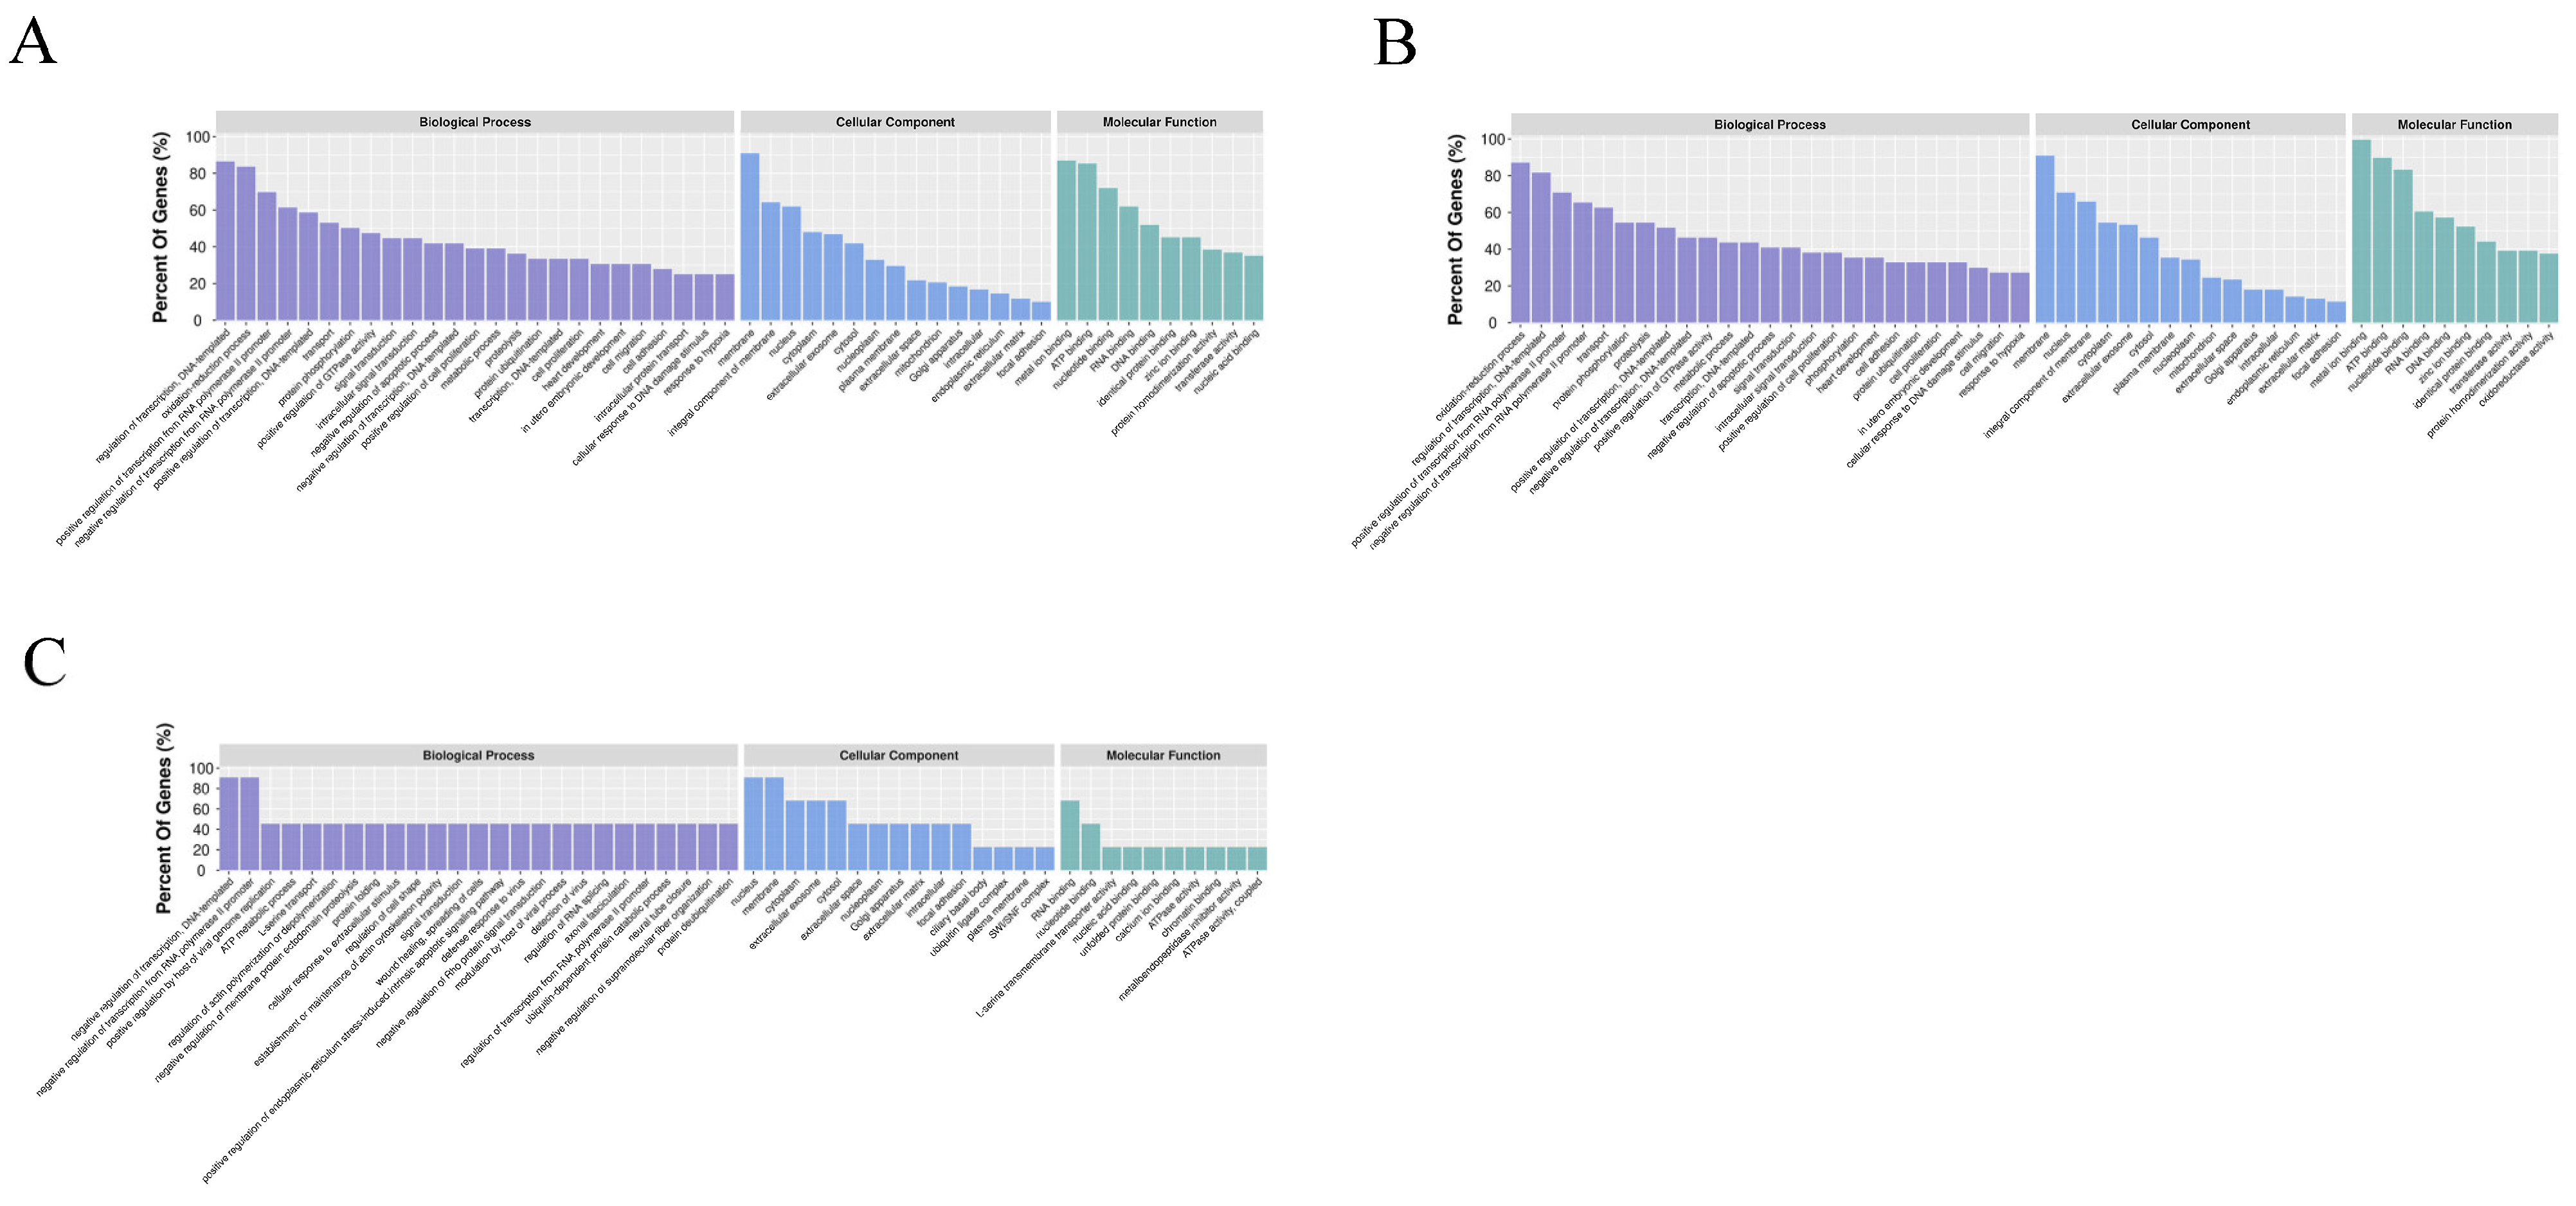
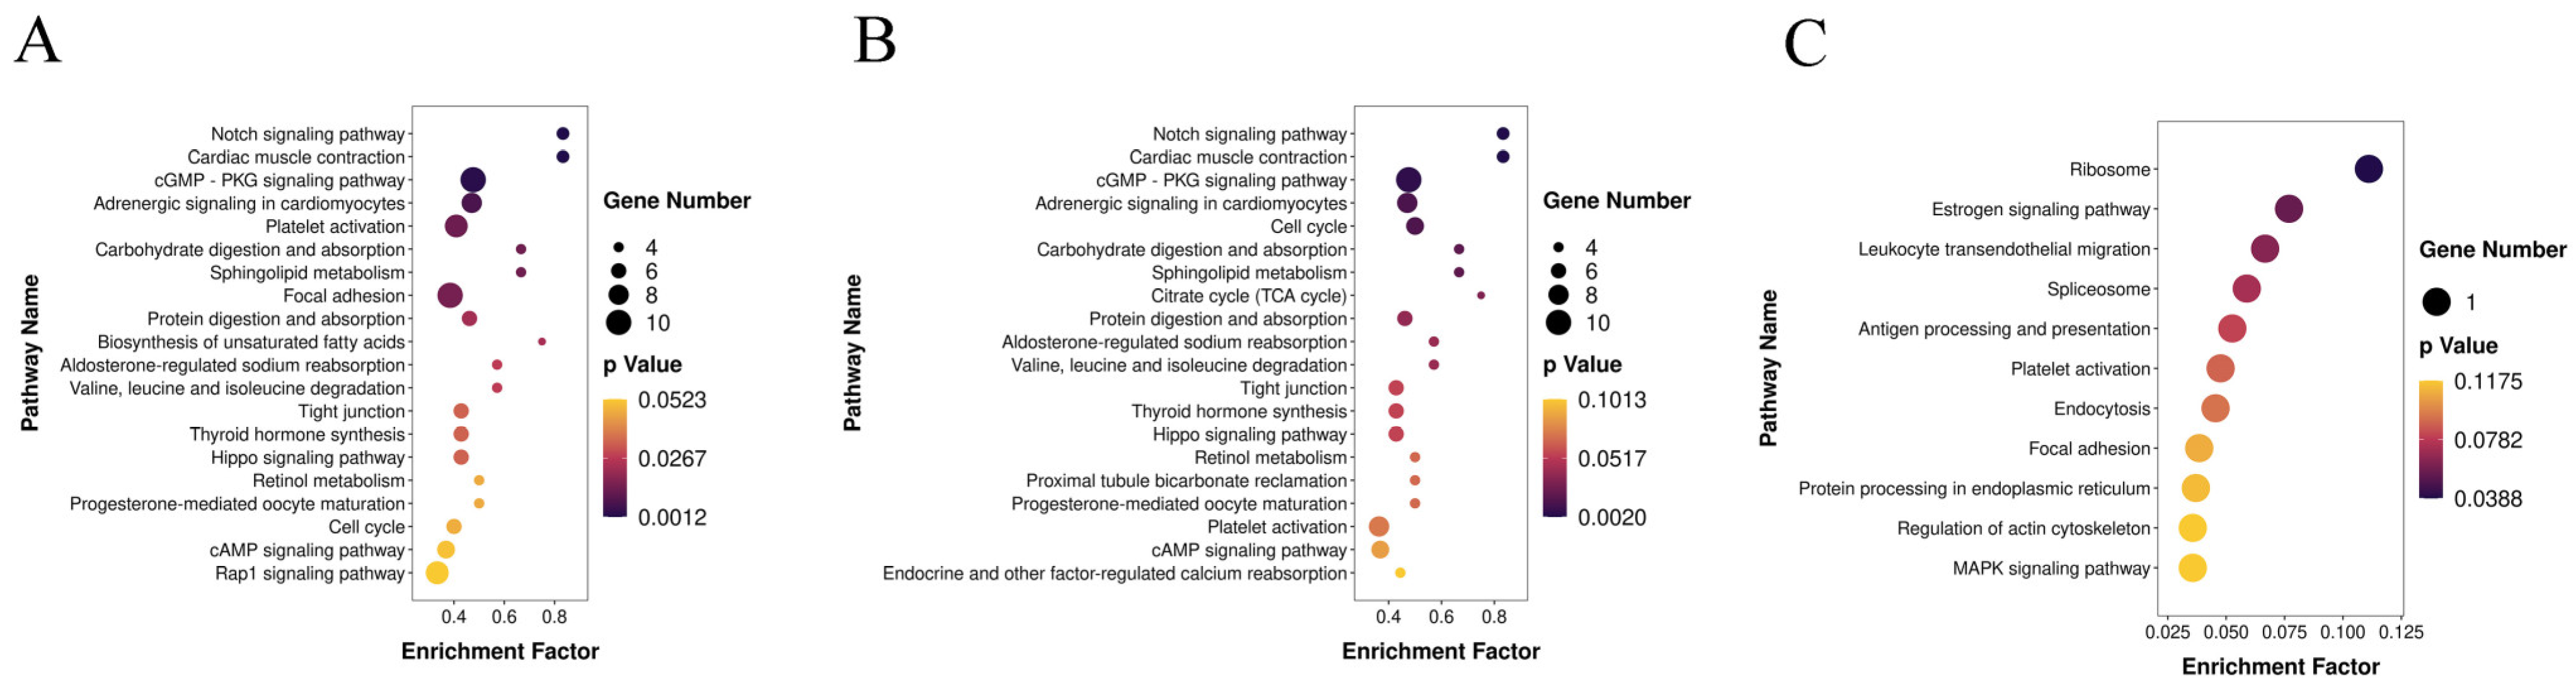
2.5. Target Gene Prediction and Functional Analysis

To predict target mRNAs of DEMs, we used TargetScan 50 and miRanda 3.3a algorithms to identify miRNA binding sites. The predicted targets obtained using both algorithms were calculated. Then, the results were combined with the DEG data. ACGT101-CORR v1.1 was used to analyze differentially expressed miRNA–mRNA correlations. Only target mRNAs with inverse relationships with corresponding miRNAs were identified as candidate target mRNAs. To predict the potential function of candidate target mRNAs, we aligned them against the Gene Ontology (GO) [24] and Kyoto Encyclopedia of Genes and Genomes (KEGG) [25] databases. The GO functional annotation is categorized into three ontologies: biological process (BP), cellular components (CC), and molecular functions (MF). GO function and KEGG pathway enrichment analysis were performed using the Goseq v1.18.0 (https://bioconductor.org/packages/3.0/bioc/html/goseq.html, accessed on 30 August 2020) [26] and KOBAS v2.0 (http://bioinfo.org/kobas/, accessed on 30 August 2020) packages [27], respectively. A p-value of < 0.05 was defined as statistically significant. Then, the regulatory networks of miRNA–mRNA interactions related to muscle development in all pairwise comparisons were visualized using Cytoscape v3.9.0 (http://www.cytoscape.org/, accessed on 10 September 2021).

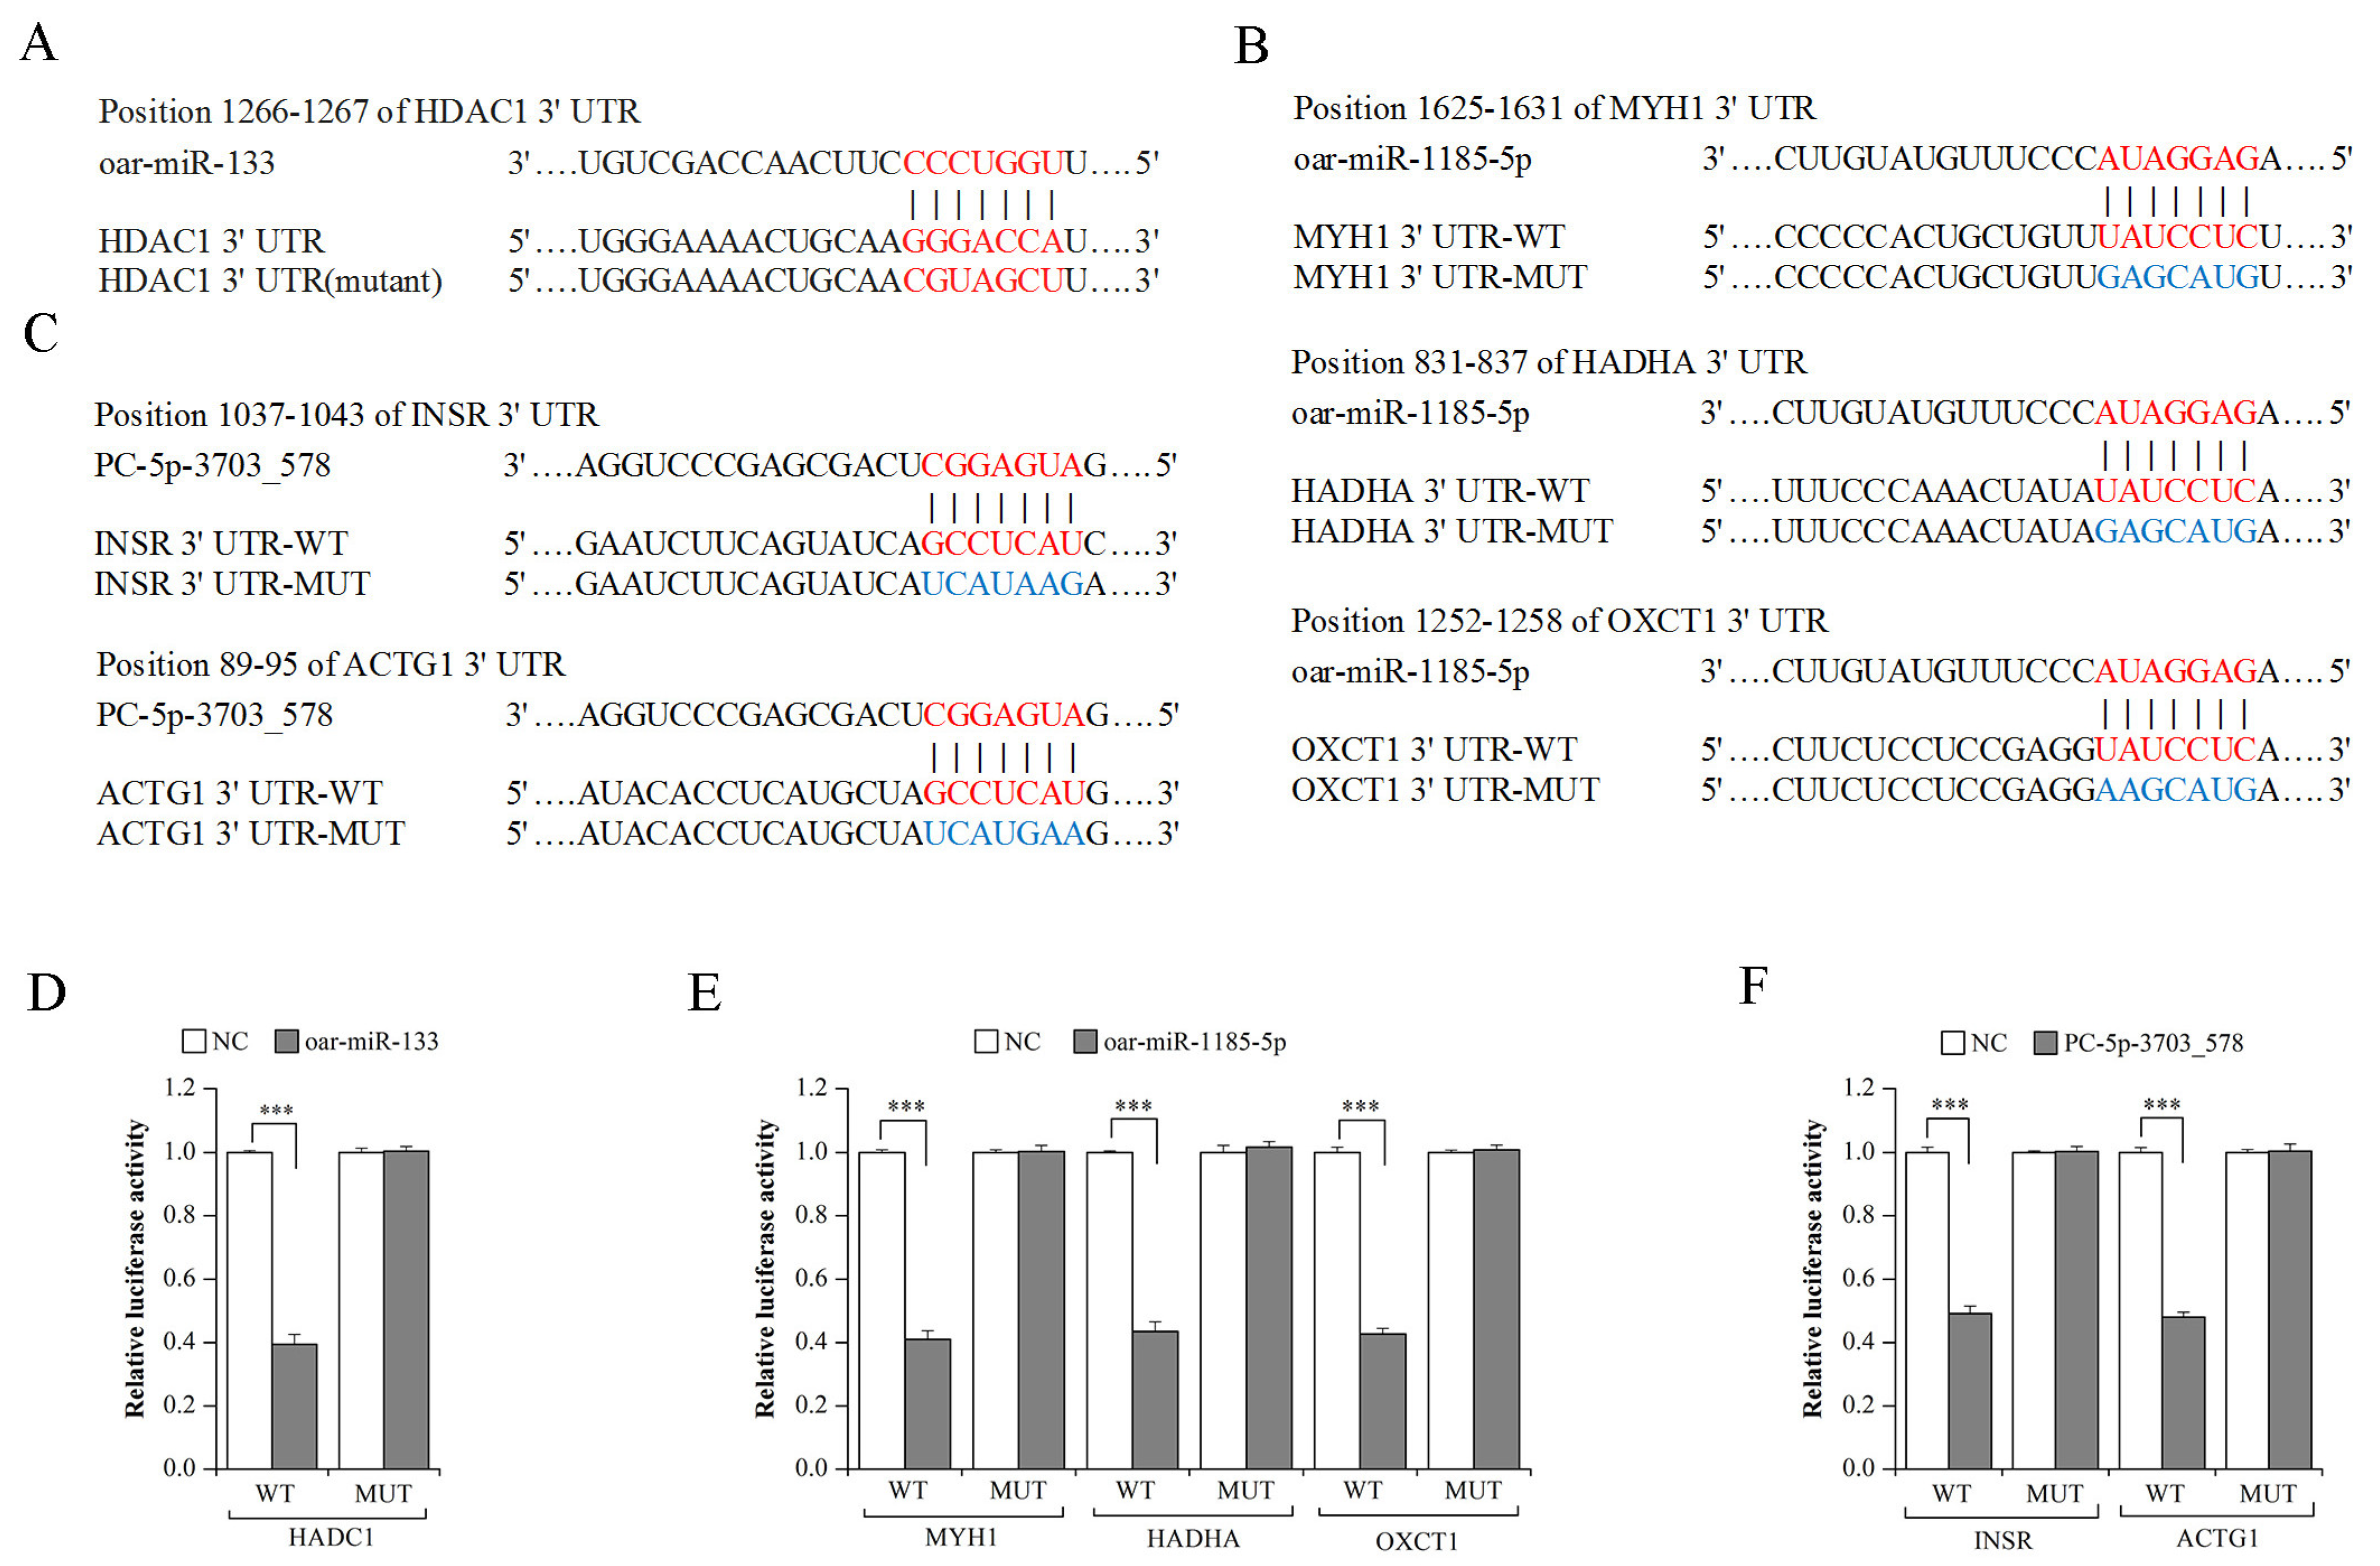
2.6. Dual-Luciferase Reporter Assays

miRNA mimics and the negative control (NC) mimics were synthesized by GenePharama (Shanghai, China). Wild-type (WT) and mutant (MUT) luciferase reporter vectors were constructed by cloning predicted sequences or the corresponding mutated sequences for the 3′UTR of individual genes into psiCHECK-2 vectors (Promega, Madison, WI, USA). Before transfection, 293T cells were seeded in 96-well plates (3 × 10⁴ cells/well) and incubated at 37 °C. At 70% confluency, the cells were cotransfected using the WT or MUT constructs along with miRNA mimics or NC mimics using LipoFiterTM Liposomal Transfection Reagent (Hanbio, Shanghai, China). After 48 h of transfection, the firefly and Renilla luciferase activities were detected with an Infinite M1000 PRO multimode reader (Tecan, Mannedorf, Switzerland) using the dual-luciferase assay system (Promega, Madison, WI, USA).

2.7. Statistical Analysis

The RNA-seq and RT-qPCR data were analyzed as described above. The Renilla luciferase activity data were analyzed using Student’s t-test and presented as mean ± standard error (SE). A p-value < 0.05 was deemed as statistically significant. The principal component analyses (PCA) of the miRNA and mRNA expression profiles were performed using the OmicStudio tools at https://www.omicstudio.cn/tool, accessed on 21 August 2020.

3. Results

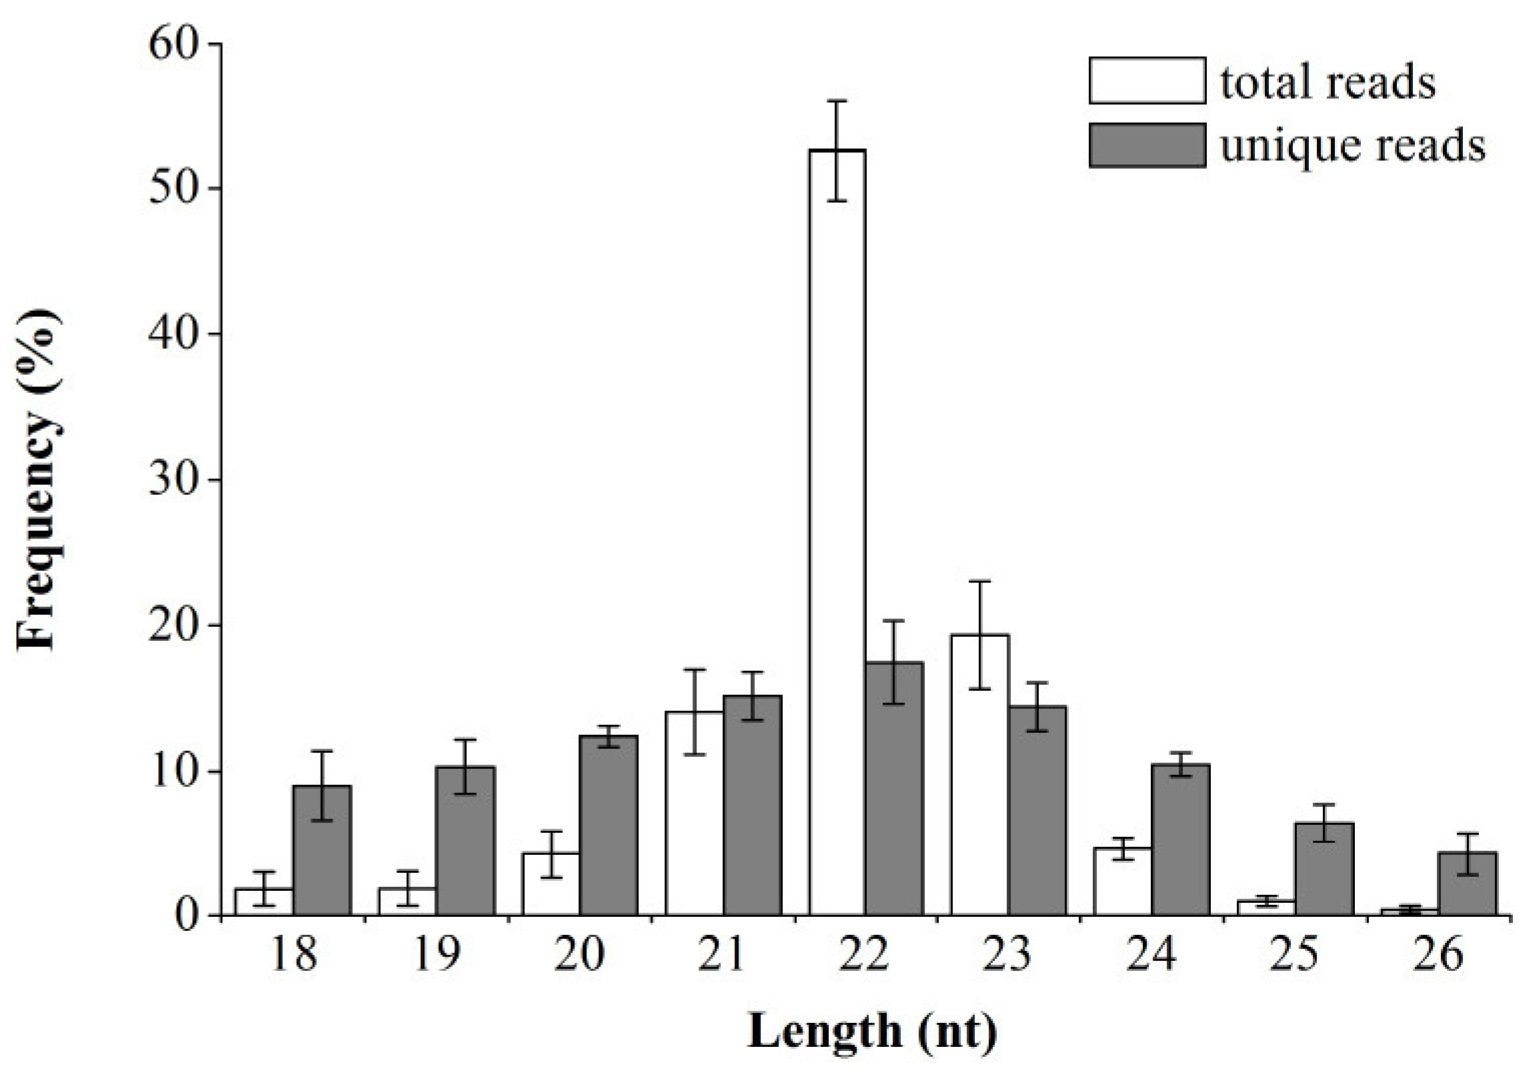
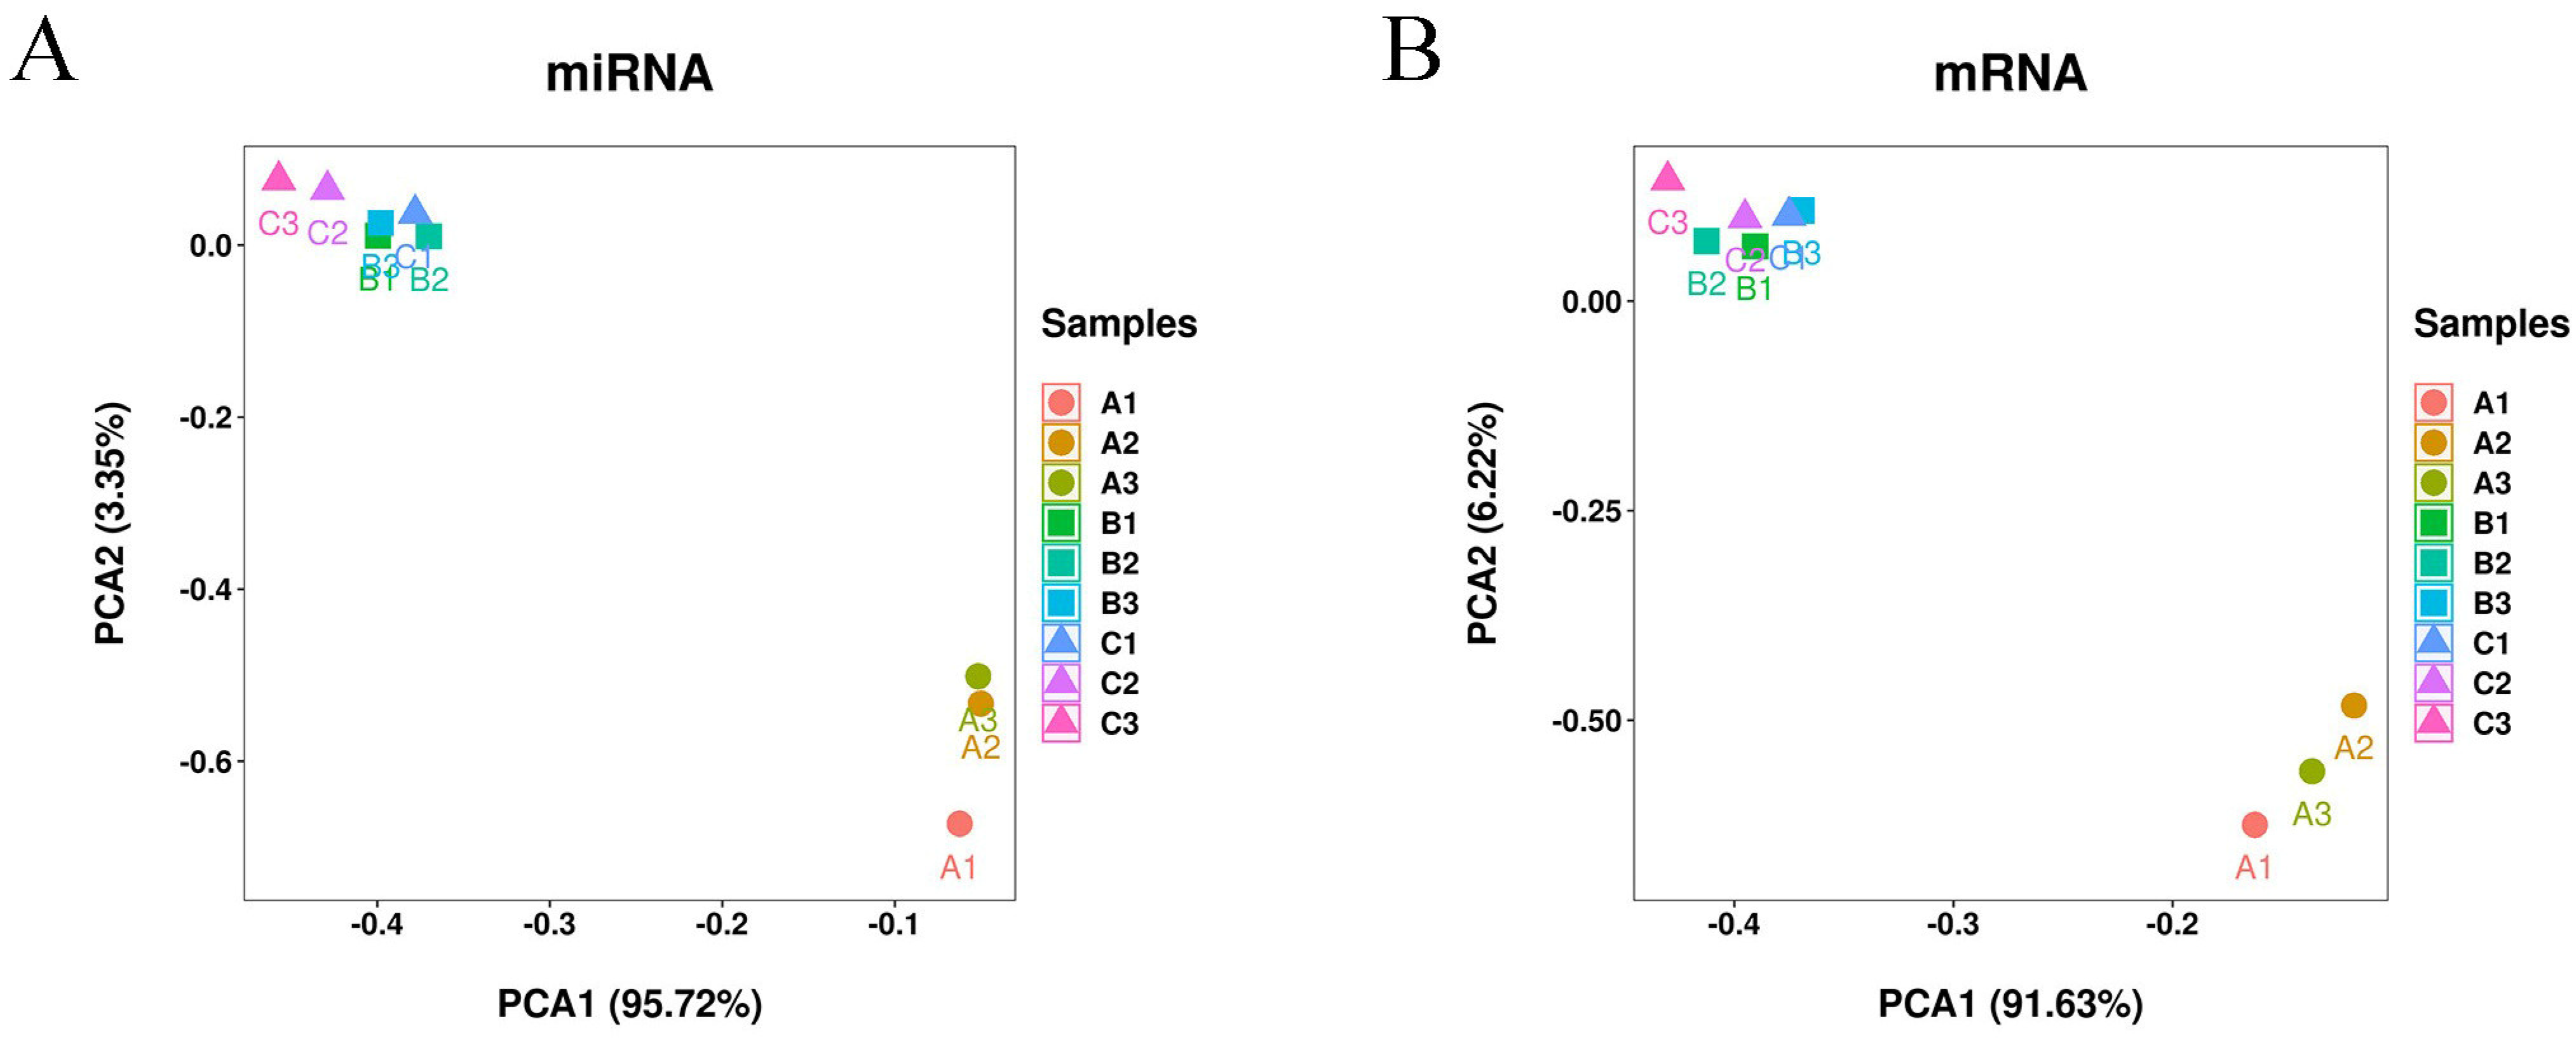
3.1. Overview of Small RNA and mRNA Sequencing Data

During the small RNA sequencing, a total of 109,558,270 raw reads were generated. After filtering and size selection were carried out, 91,104,586 valid reads were obtained (Table S3). The majority of the small RNA reads were 21–23 nt in size, with a length of 22 nt being the most common (Figure 1), which was in line with the characteristics of classic dicer-processed products and the mature miRNA length distribution [28]. The valid reads were aligned to the reference sequence. A total of 1195 miRNAs were identified, including 988 known miRNAs and 207 novel miRNAs. Based on normalized counts, high expression levels were observed in the known miRNAs, with oar-miR-133 being the most abundant miRNA (Table S4). The novel miRNAs had much lower expression levels than the known miRNAs, with only one miRNA (PC-3p-282_33957) having average normalized counts greater than 1000 at any of the studied developmental stages (Table S5). During mRNA sequencing, a total of 484,263,900 raw reads were generated, and more than 98% of them were found to be valid reads after the low-quality bases were filtered out. On average, about 91.58% of the valid reads were mapped to the sheep reference genome from each library (Table S6), suggesting the high quality of the sequencing results.
Then, the mapped reads were assembled into 24,959 genes. The PCA analysis of the miRNA (Figure 2A) and mRNA (Figure 2B) expression profiles showed that the triplicate samples for each group were clustered together, and that the 3- and 15-month-old samples were more similar to each other than and robustly separated from the fetal samples, suggesting that there are great differences between fetal sheep and 3- and 15-month-old sheep.

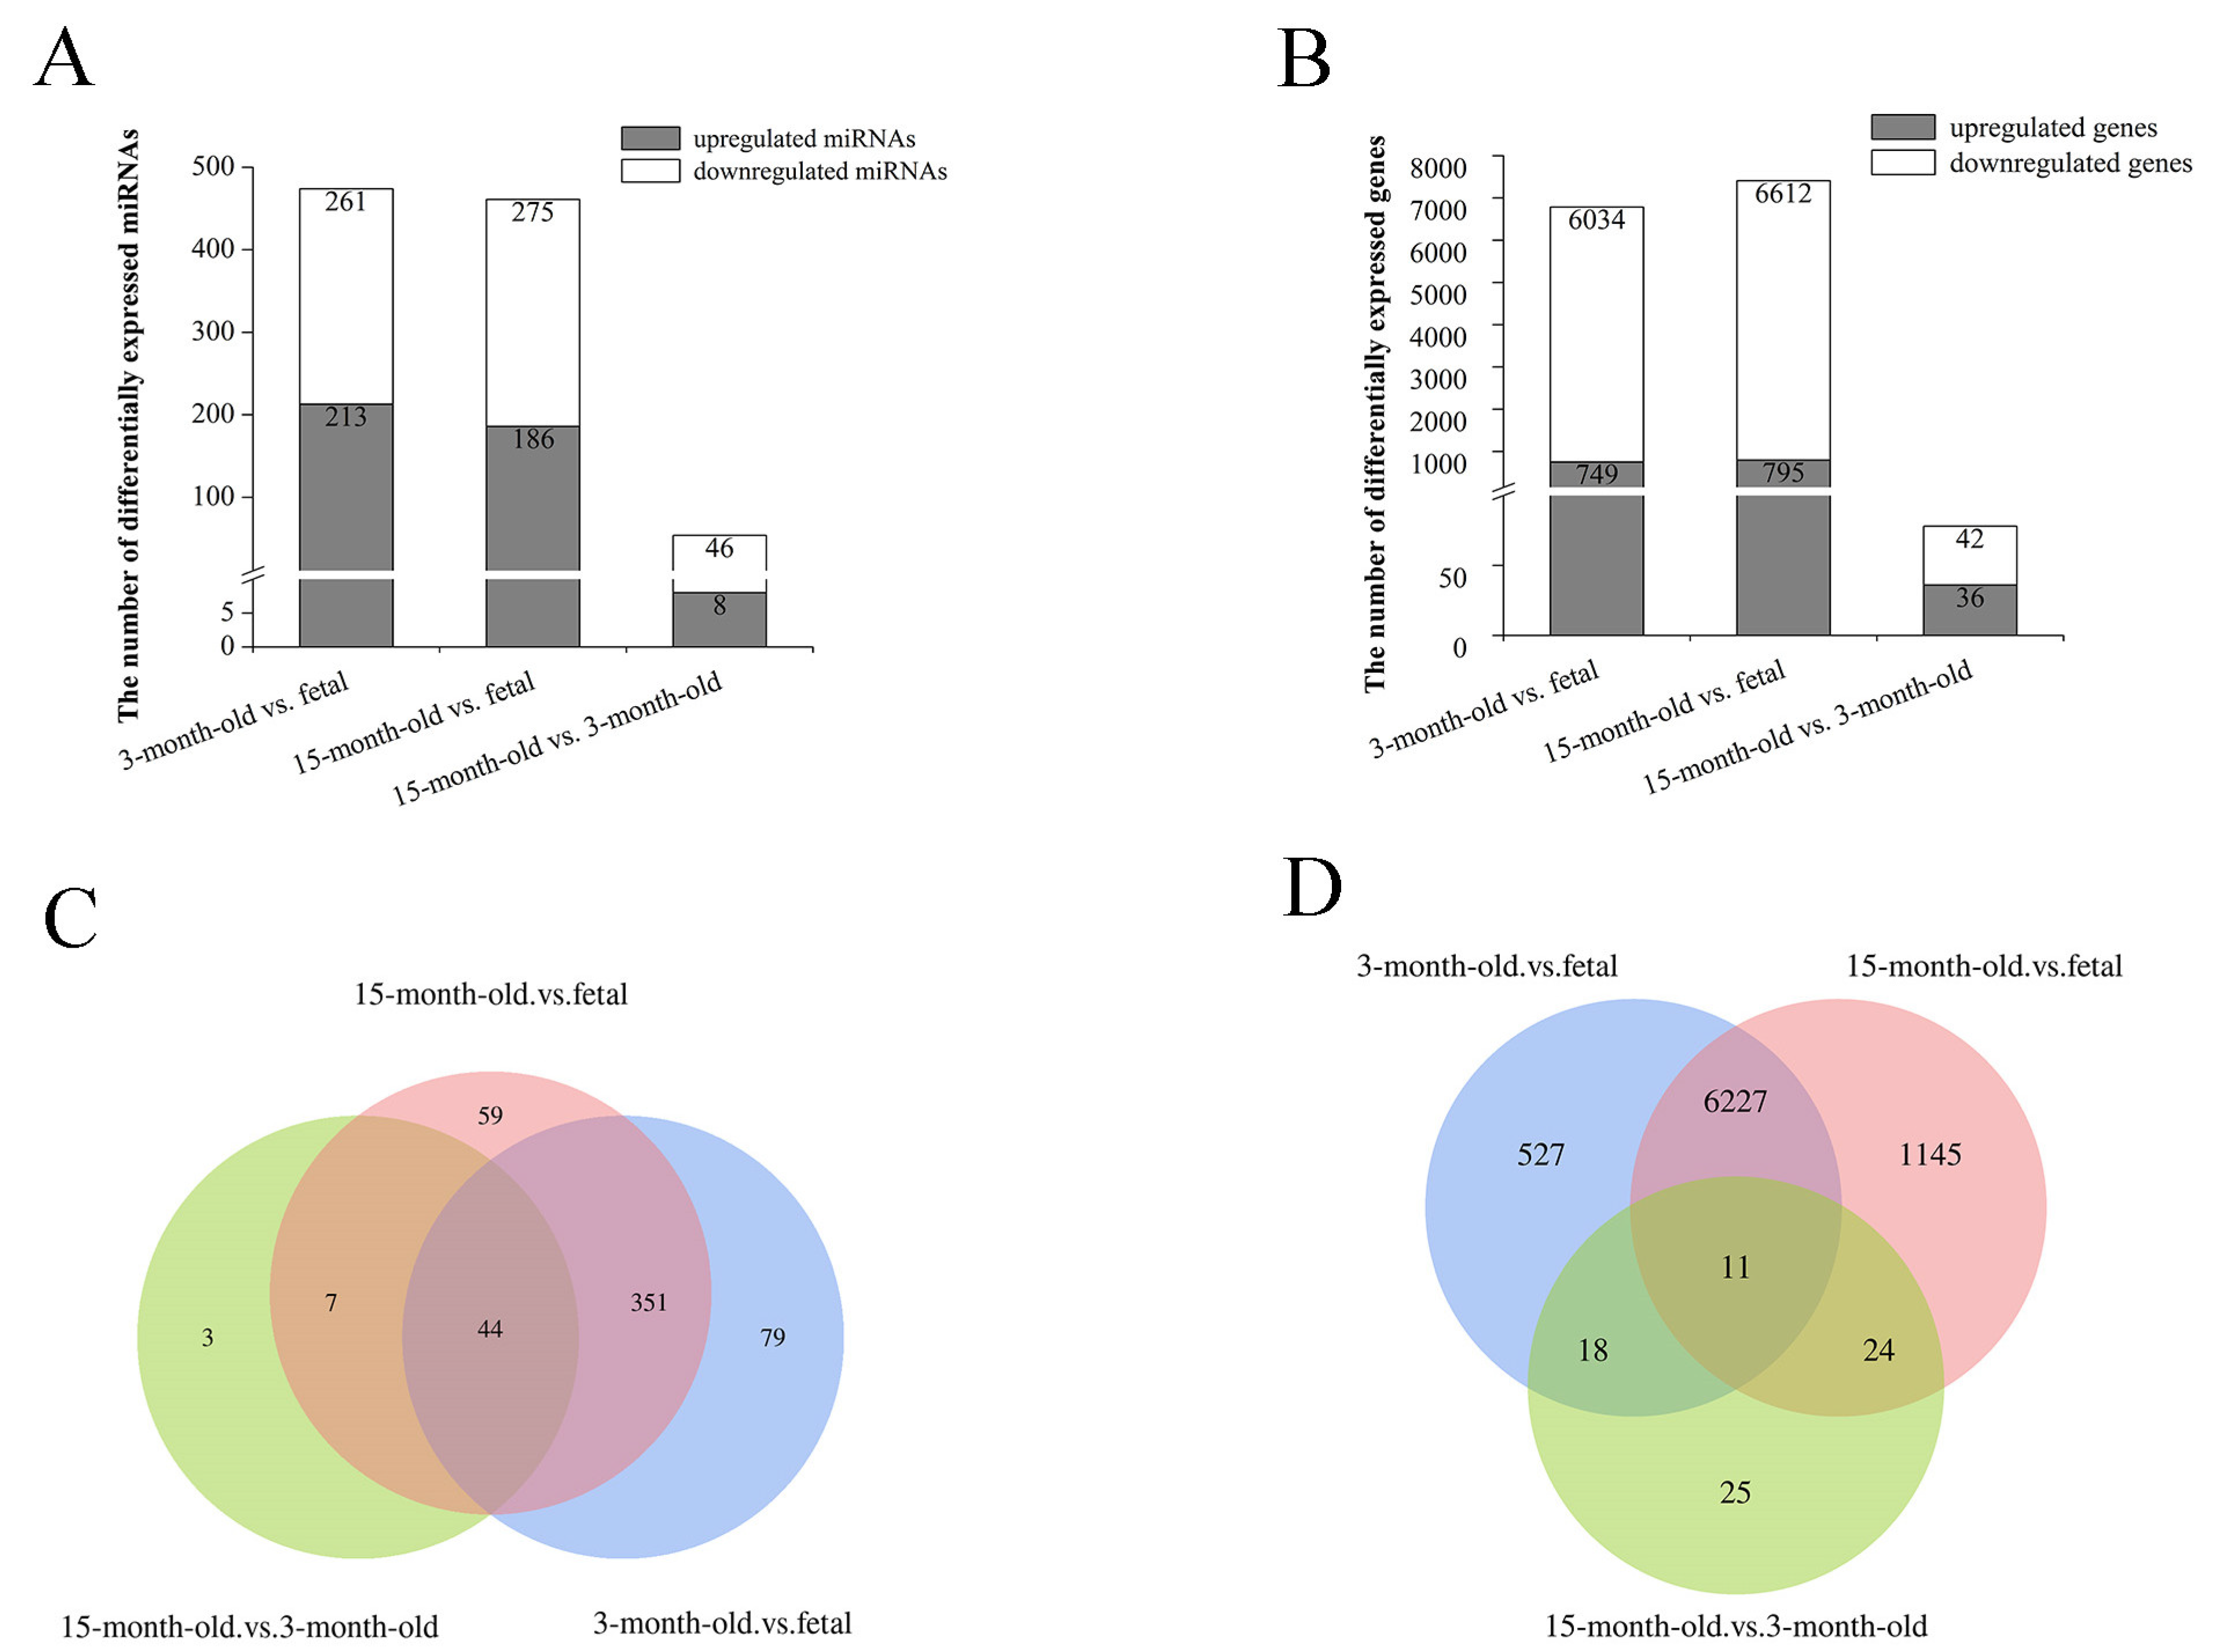
3.2. Differential Expression Analysis of miRNAs and mRNAs

We compared the miRNA and mRNA expression levels of each stage with the others (3-month-old vs. fetal, 15-month-old vs. fetal, and 15-month-old vs. 3-month-old). As a result, 474 DEMs (213 upregulated and 261 downregulated) were obtained in the 3-month-old vs. fetal comparison, including 23 novel miRNAs. In the 15-month-old vs. fetal comparison, 461 DEMs (186 upregulated and 275 downregulated) were identified, including 17 novel miRNAs. In the 15-month-old vs. 3-month-old comparison, 54 miRNAs (8 upregulated and 46 downregulated) were differentially expressed, but no novel miRNAs were detected (Figure 3A). We also obtained 6783 DEGs (749 upregulated and 6034 downregulated), 7407 DEGs (795 upregulated and 6612 downregulated), and 78 DEGs (36 upregulated and 42 downregulated) in the 3-month-old vs. fetal, 15-month-old vs. fetal, and 15-month-old vs. 3-month-old comparisons, respectively (Figure 3B). Most of these DEMs and DEGs were found at the intersection of the 3-month-old vs. fetal and 15-month-old vs. fetal comparisons, with the lowest number of these being found in the 15-month-old vs. 3-month-old comparison (Figure 3C,D). These findings indicated there were distinct miRNA and mRNA expression patterns between the fetal and the two postnatal (3- and 15-month-old) samples, which supports the results of the PCA analysis mentioned above.

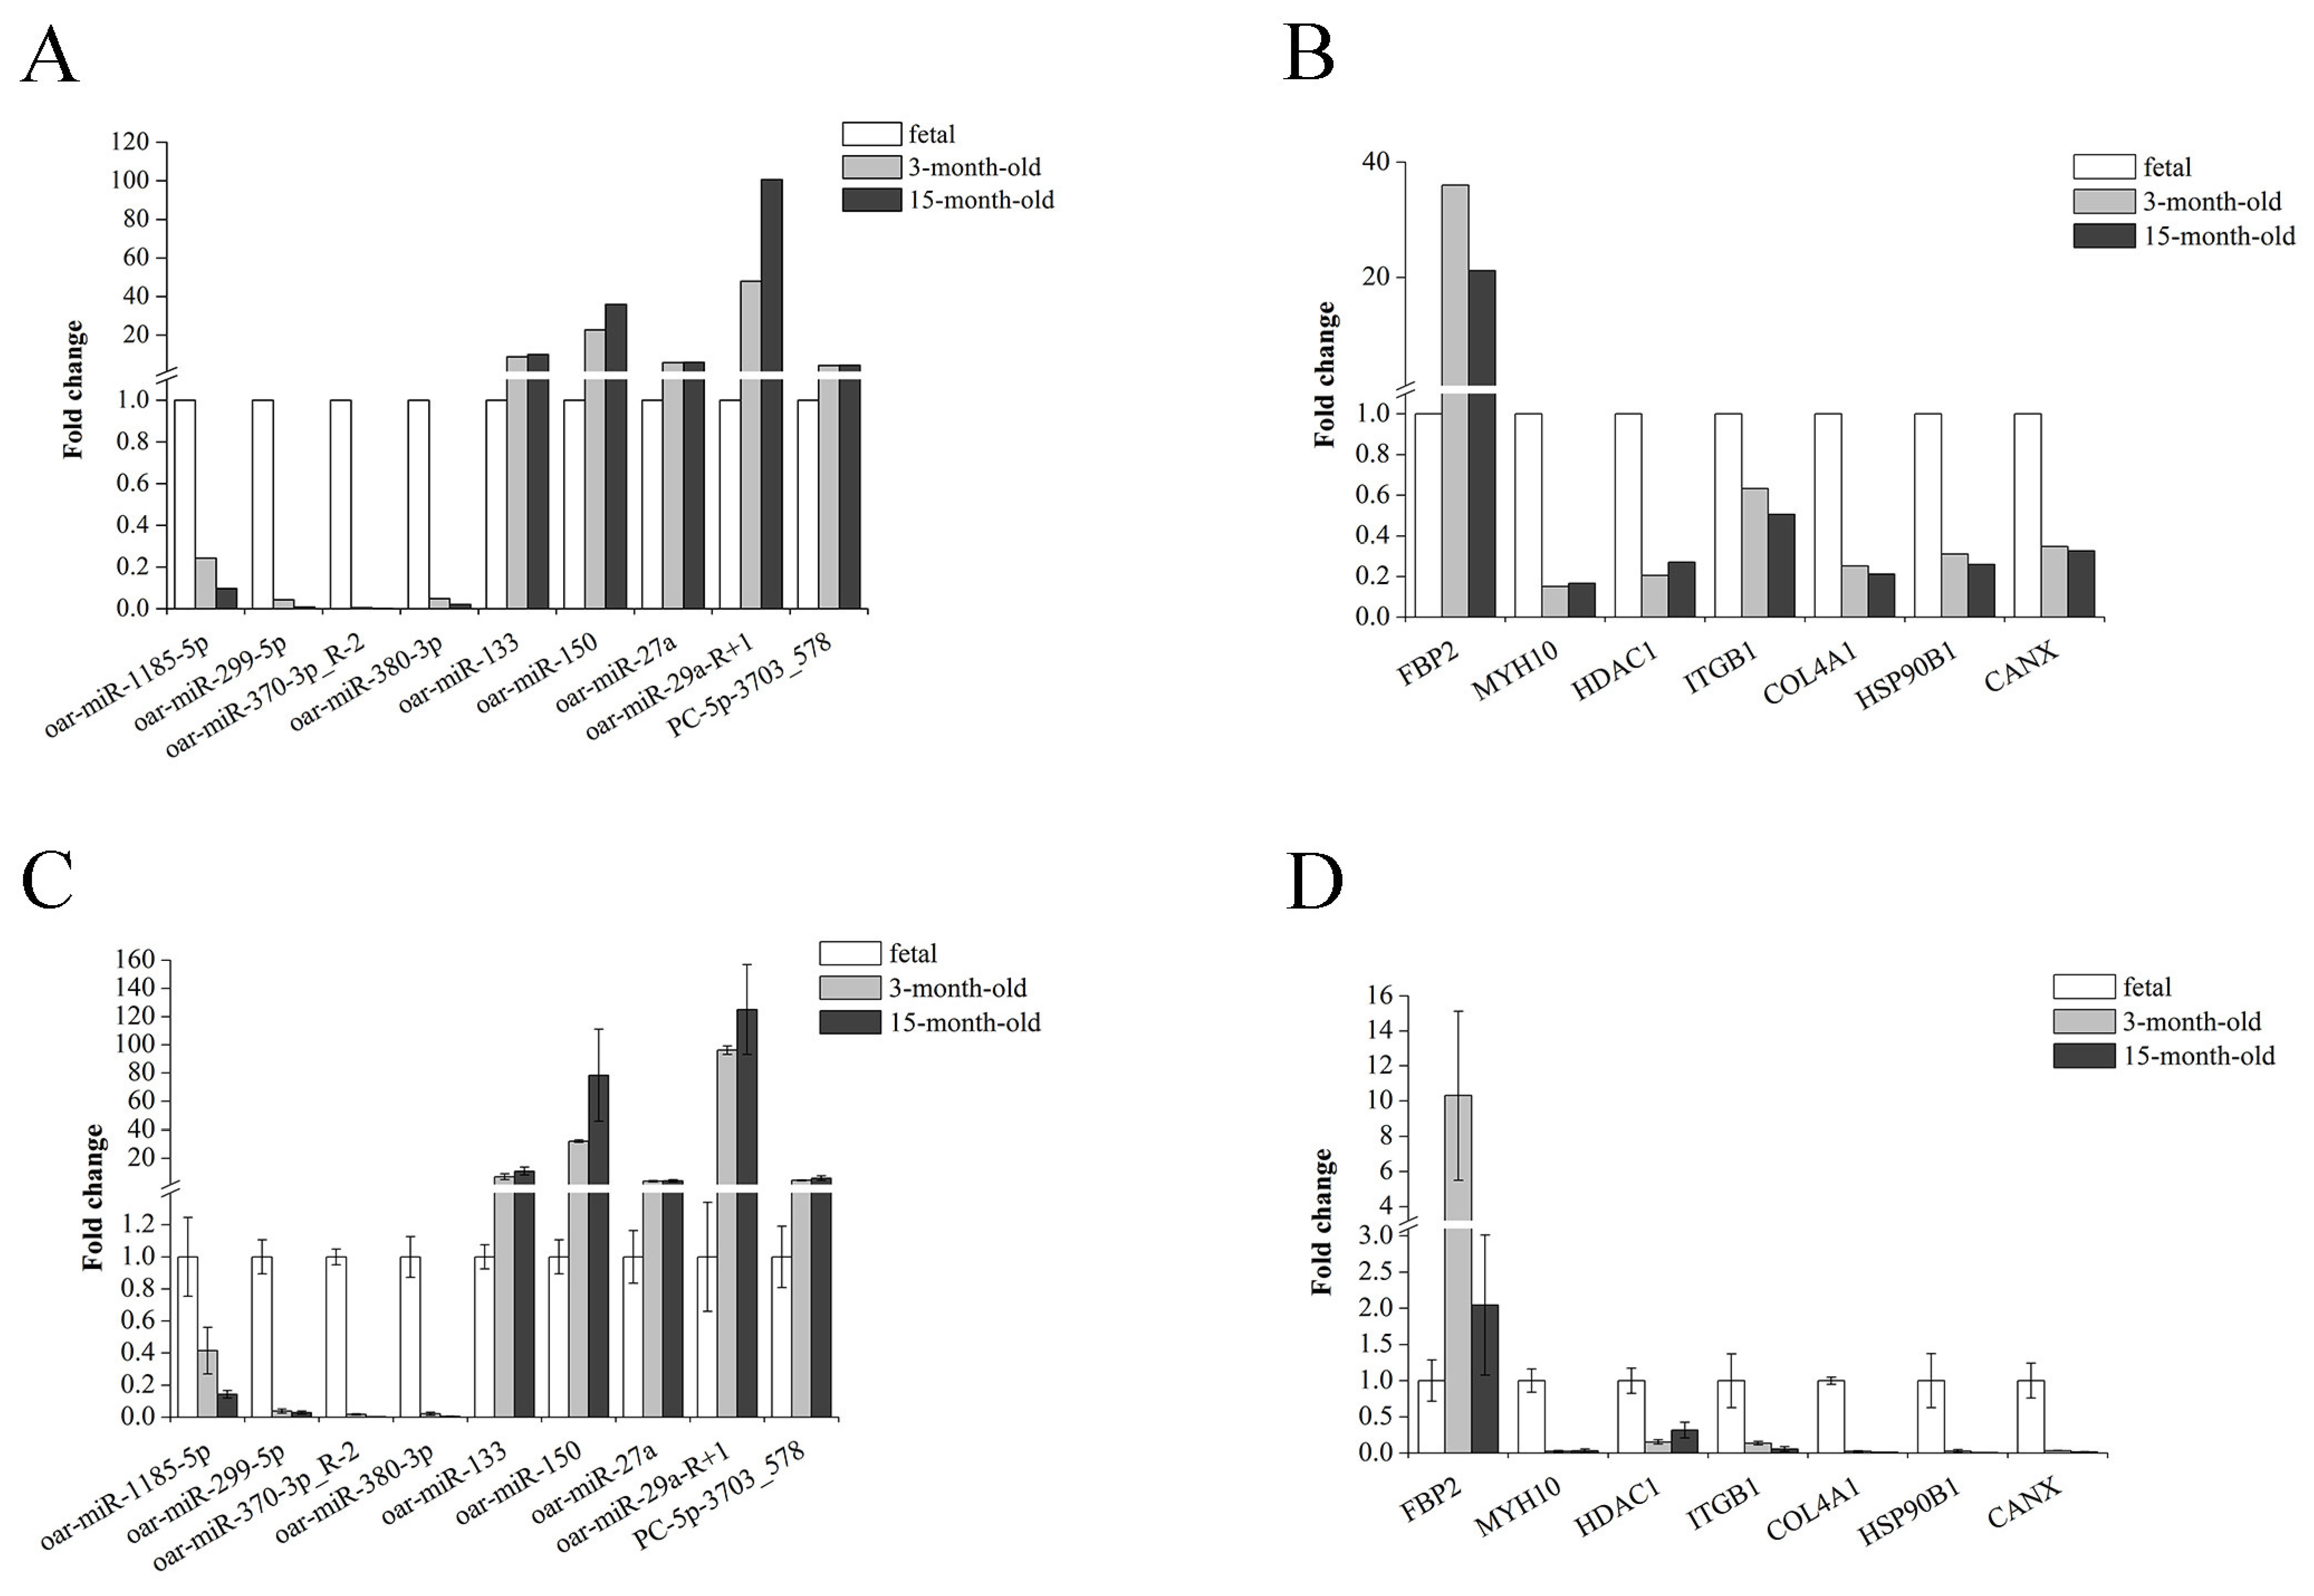
3.3. Validation of RNA-seq Data Using RT-qPCR

To validate the sequencing data, nine DEMs (oar-miR-1185-5p, oar-miR-299-5p, oar-miR-370-3p_R-2, oar-miR-380-3p, oar-miR-133, oar-miR-150, oar-miR-27a, oar-miR-29a_R+1, and PC-5p-3703_578) and seven DEGs (FBP2, MYH10, HDAC1, ITGB1, COL4A1, HSP90B1, and CANX) were randomly selected for examination of their expression levels using RT-qPCR (Figure 4). The expression trends observed using RT-qPCR were consistent with those based on the sequencing data, indicating that the sequencing results were reliable.

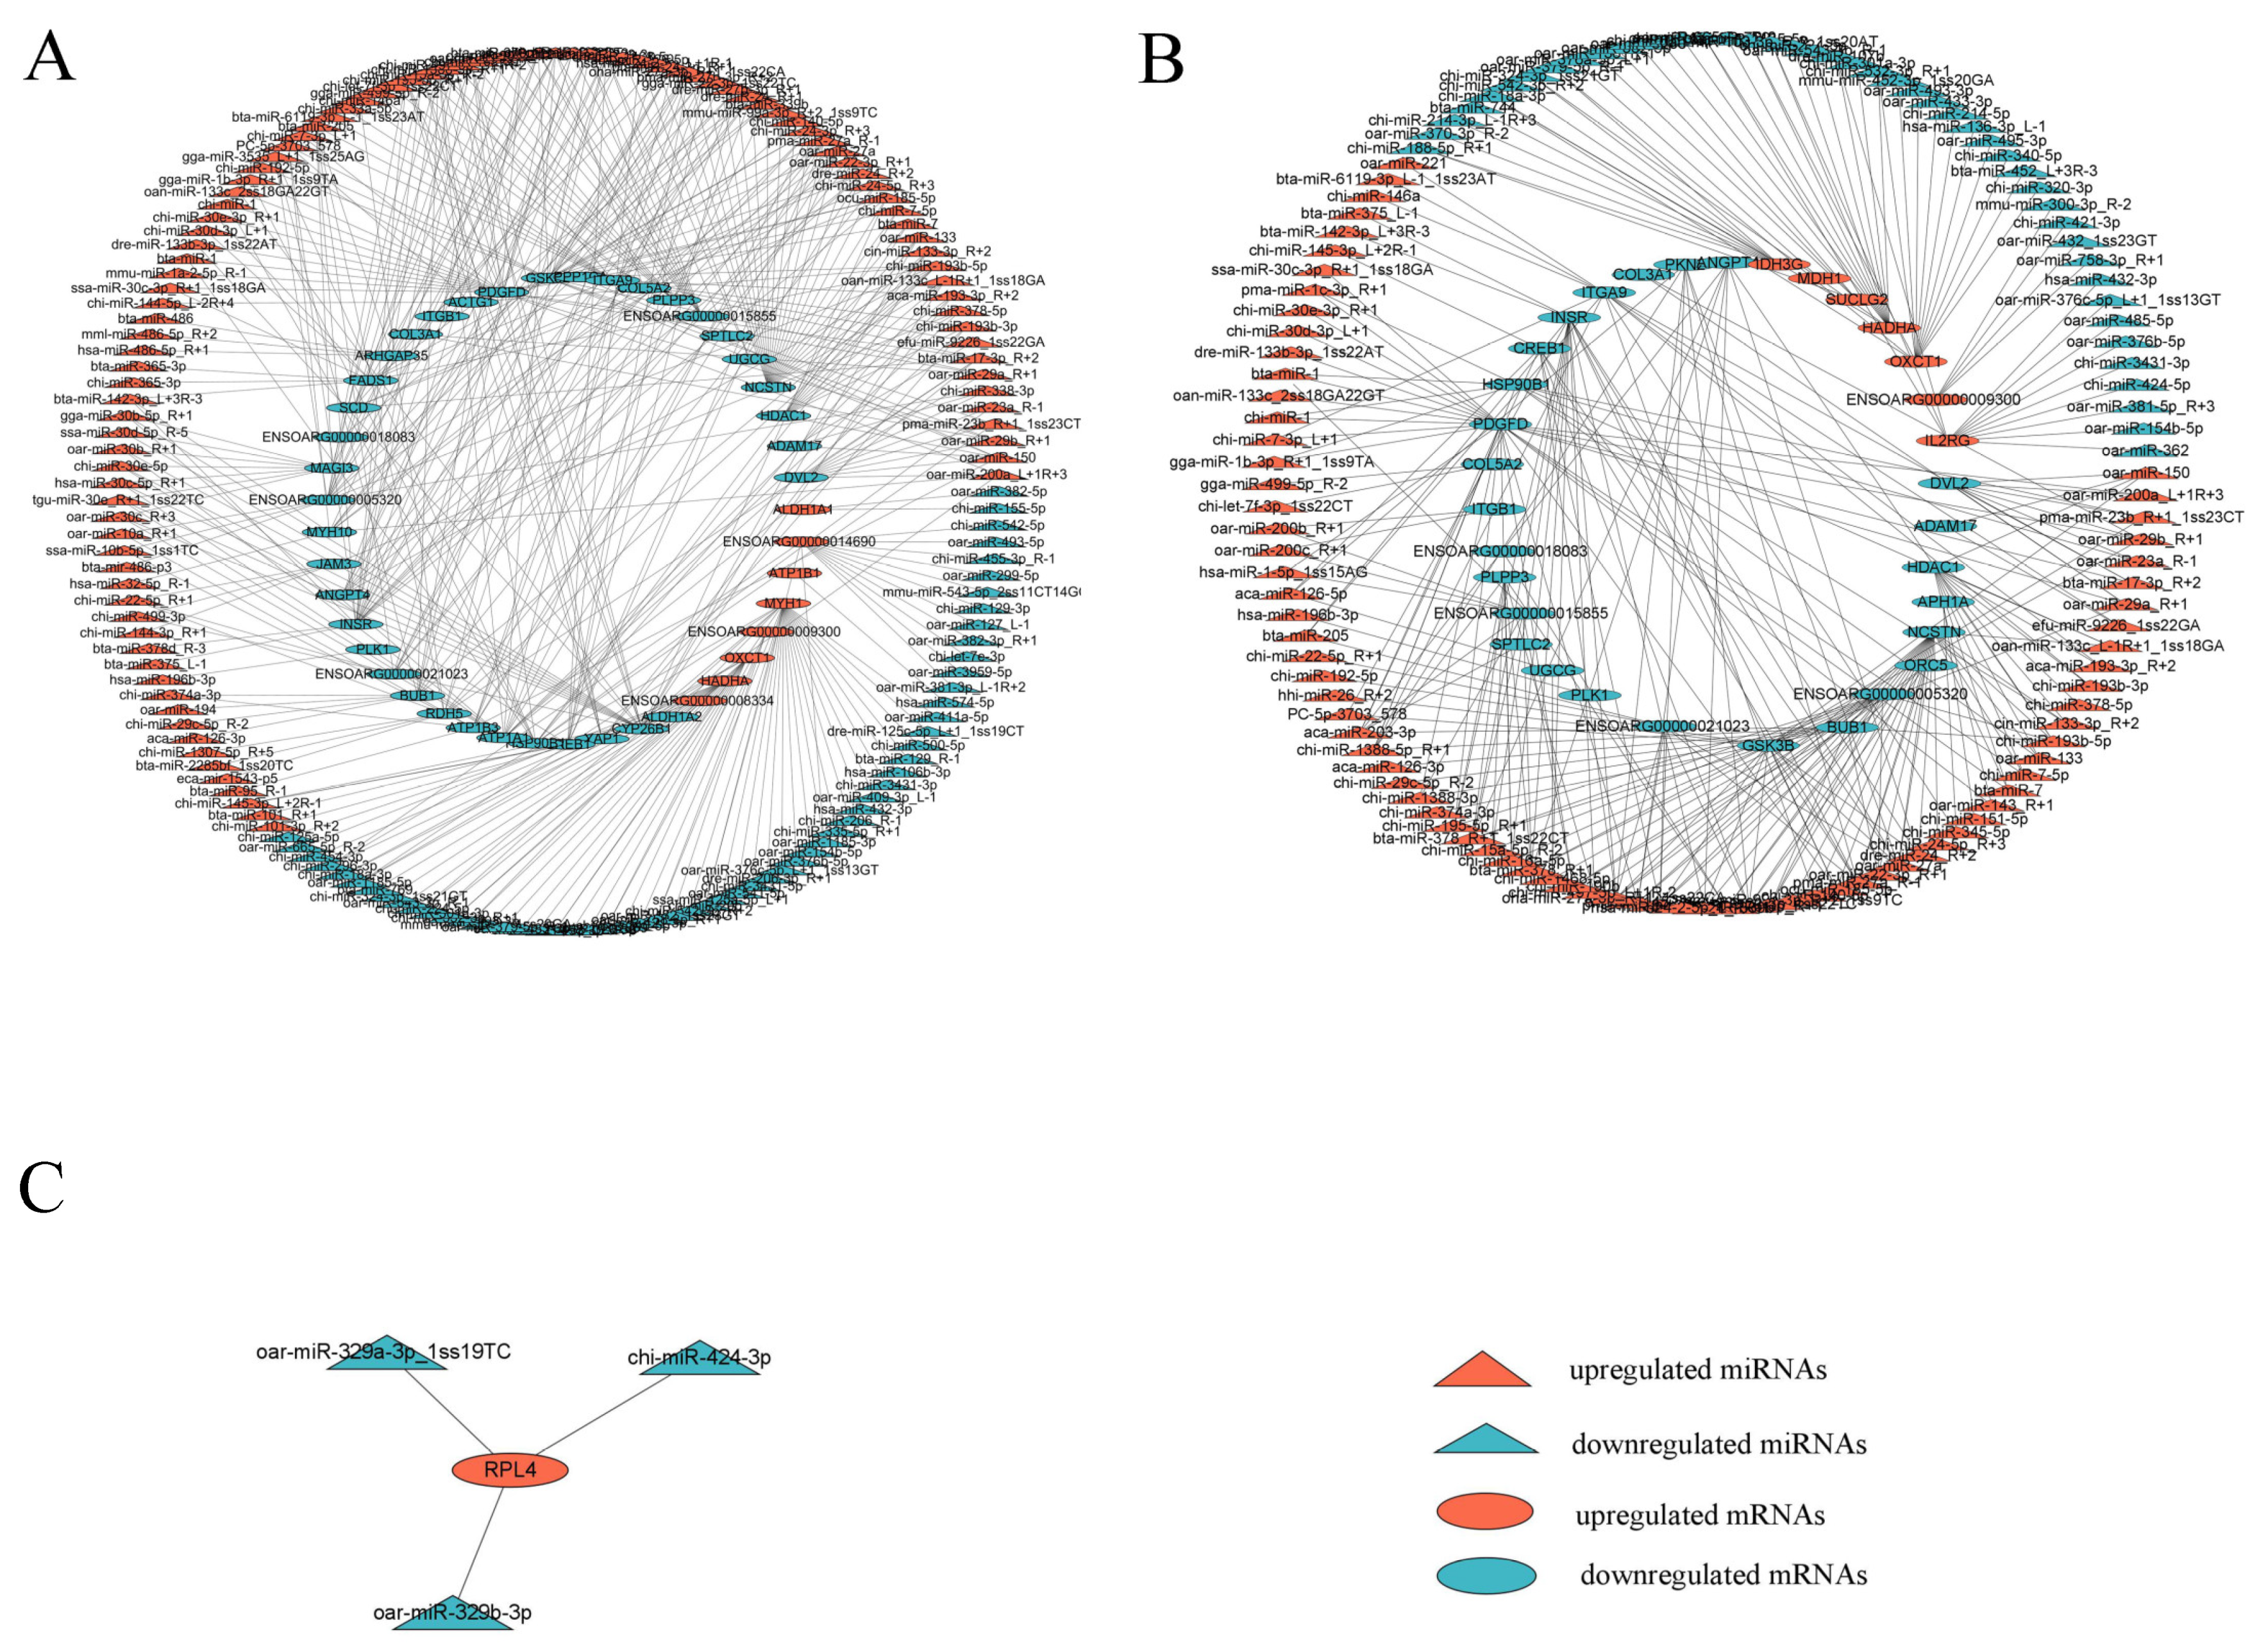
3.4. Integrated miRNA–mRNA Interaction Analysis

As described in the “Materials and Methods” Section, we obtained the candidate target mRNAs of all the DEMs for further analysis. The enriched GO functions for the candidate target mRNAs in the 3-month-old vs. fetal comparison showed a high similarity with those in the 15-month-old vs. fetal comparison and were mainly enriched in the “regulation of transcription, DNA–templated” and “oxidation–reduction process” terms in the BP ontology, the “membrane” and “integral component of membrane” terms in the CC ontology, and the “metal ion binding” and “ATP binding” terms in the MF ontology (Figure 5A,B). Alternatively, in the 15-month-old vs. 3-month-old comparison, the candidate target mRNAs were primarily enriched in the “negative regulation of transcription, DNA-templated” and “negative regulation of transcription from RNA polymerase II promoter” terms in the BP ontology, the “nucleus” and “membrane” terms in the CC ontology, and the “RNA binding” and “nucleotide binding” terms in the MF ontology (Figure 5C). Some muscle-related GO terms were also enriched, including the “cell proliferation”, “cell migration”, “cell adhesion”, “myotube differentiation”, and “canonical Wnt signaling pathway” terms. The KEGG pathway analysis revealed that the candidate target mRNAs of the DEMs were significantly enriched in 18, 11, and 1 pathways in the 3-month-old vs. fetal (Figure 6A), 15-month-old vs. fetal (Figure 6B), and 15-month-old vs. 3-month-old comparisons (Figure 6C), respectively (p < 0.05). Notably, the “PI3K–Akt signaling pathway” was enriched by the largest number of candidate target mRNAs in both the 3-month-old vs. fetal and 15-month-old vs. fetal comparisons, although the enrichment was not significant (p > 0.05). Most of these pathways were associated with muscle growth and development, including the “Notch signaling pathway”, “PI3K-Akt signaling pathway”, and “Hippo signaling pathway”, as well as the “focal adhesion”; “tight adhesion”; “cell cycle”; “citrate cycle”; “biosynthesis of unsaturated fatty acids”; “sphingolipid metabolism”; “retinol metabolism”; “valine, leucine and isoleucine degradation”; “thyroid hormone synthesis”; and “ribosome” pathways.
Then, we constructed a miRNA–mRNA interaction network for each comparison using DEMs with average normalized counts greater than 100 and their candidate target mRNAs that were enriched in KEGG pathways associated with muscle development. As a result, a total of 401 differentially expressed miRNA–mRNA pairs (163 miRNAs and 45 mRNAs), 267 differentially expressed miRNA–mRNA pairs (123 miRNAs and 33 mRNAs), and 3 differentially expressed miRNA–mRNA pairs (3 miRNAs and 1 mRNA) with negative regulatory relationships were detected in the 3-month-old vs. fetal (Figure 7A), 15-month-old vs. fetal (Figure 7B), and 15-month-old vs. 3-month-old (Figure 7C) comparisons, respectively.

3.5. Validation of miRNA–mRNA Interaction Using Dual-Luciferase Reporter Assays

To verify the interactions between the miRNAs and mRNAs involved in these networks, six miRNA–mRNA interactions were analyzed using dual-luciferase reporter assays. The results showed that the luciferase activity in cells cotransfected with oar-miR-133 mimics and the HDAC1 3′UTR-WT vector; oar-miR-1185-5p mimics and the MYH1, HADHA, or OXCT1 3′UTR-WT vector; and PC-5p-3703_578 mimics and the INSR or ACTG1 3′UTR-WT vector was significantly reduced compared with those transfected with NC mimics (p < 0.001), whereas there was no effect on the corresponding mutant reporter activity (Figure 8). These data suggest that HDAC1 is a direct target of oar-miR-133; MYH1, HADHA, and OXCT1 are direct targets of oar-miR-1185-5p; and INSR and ACTG1 are direct targets of PC-5p-3703_578.

4. Discussion

miRNAs are recognized as important regulators of skeletal muscle development because of their modulation of gene expression. Thus, it is of great significance to study their roles in skeletal muscle development. Muscle fibers are formed prenatally in sheep, especially during mid-gestation [29]. In contrast, their postnatal muscle growth largely relies on muscle fiber hypertrophy [30]. The growth rate of sheep is extremely rapid between birth and six months of age. After 1–1.5 years of growth, their skeletal muscle fibers are close to their mature size [31]. Therefore, high-throughput sequencing technology was used to characterize the miRNA and mRNA expression profiles of the biceps femoris of Wuranke sheep at the fetal (3 months of gestation) and 3- and 15-month-old postnatal stages in this study.
We identified 1195 miRNAs (988 known and 207 novel miRNAs) in the small RNA libraries. A total of 543 miRNAs were significantly differentially expressed among the three stages, with most of these miRNAs being found both in the 3-month-old vs. fetal and 15-month-old vs. fetal comparisons, including some miRNAs that are highly expressed in skeletal muscle, such as oar-miR-133, bta-miR-1, chi-miR-206_R-1, oar-miR-127_L-1, and chi-miR-378-3p. The muscle-specific miRNAs miR-1, miR-133, and miR-206 were extensively studied for their regulatory roles in multiple aspects of skeletal muscle development [32]. It was shown in previous studies that the main function of miR-1/miR-206 is to promote myogenic differentiation [33], while the main function of miR-133 is to promote myogenic proliferation [34]. Furthermore, it was reported that miR-133a and miR-206 can regulate the muscle-fiber-type transition in mice [35,36]. A local injection of double-stranded miR-1, miR-133, and miR-206 in a rat skeletal muscle injury model was found to contribute to muscle regeneration [37]. Further, miR-127 was found to be a differentially expressed miRNA in the prenatal and postnatal skeletal muscle of sheep [11] and pigs [38]. Studies with C2C12 cells revealed that miR-127 regulates myoblast proliferation and differentiation, and its experimentally confirmed target genes include vesicle-associated membrane protein 2 (VAMP2) [39], sphingosine-1-phosphate receptor 3 (S1PR3) [40], lysine methyltransferase 5A (KMT5A) [41], and septin 7 (SEPT7) [42]. miR-378 was reported to facilitate C2C12 cell differentiation by targeting myogenic repressor (MYOR) [43] and bone morphogenetic protein 4 (BMP4) [44] as well as to promote the differentiation of the bovine skeletal-muscle-derived satellite cell by targeting DNA polymerase alpha subunit B (POLA2) [45]. In addition, miR-378 was verified to promote myoblast proliferation in sheep [13].
In the present study, the expression levels of oar-miR-133, bta-miR-1, and chi-miR-378-3p were significantly higher in the muscle of 3- and 15-month-old sheep than those of fetal sheep, while the expression levels of chi-miR-206_R-1 and oar-miR-127_L-1 showed the opposite pattern. These results suggested that different types of miRNA may play crucial regulatory roles in different phases of sheep skeletal muscle development. Therefore, the study of miRNA expression profiles in the skeletal muscle of Wuranke sheep at different developmental stages is helpful for us to discover potential miRNAs and their regulatory mechanisms related to skeletal muscle development.
By regulating their target genes’ expression, miRNAs exert their functions at the post-transcriptional level. To perform miRNA–mRNA integrated analysis, we simultaneously characterized the mRNA expression profiles at the three developmental stages. A total of 7978 DEGs were identified through pairwise comparisons of the three stages; the majority of them were differentially expressed in the 3- and 15-month-old muscle samples compared to in the fetal muscle samples. Some of these DEGs are known for their crucial roles in regulating skeletal muscle development, such as myogenic factor 5 (MYF5) [46], myogenin (MYOG) [47], myocyte enhancer factor 2C (MEF2C) [48], and paired box 7 (PAX7) [49]. Furthermore, in order to reveal the potential miRNAs that regulate muscle development, the candidate target mRNAs of the DEMs were determined using integrated analysis.
The functional enrichment analysis revealed that the candidate target mRNAs were enriched in 13 pathways that are related to muscle growth and development. Among them, the “Notch signaling pathway” [50,51], “PI3K–Akt signaling pathway” [52], and “Hippo signaling pathway” [53,54], as well as the “focal adhesion” [55], “tight adhesion” [56], and “cell cycle” [57] pathways, were confirmed to regulate muscle proliferation and differentiation. Metabolic pathways, including the “citrate cycle” [58]; “biosynthesis of unsaturated fatty acids” [59]; “sphingolipid metabolism” [60]; “retinol metabolism” [61,62]; “valine, leucine and isoleucine degradation” [63]; and “thyroid hormone synthesis” [35,64] pathways, are closely associated with muscle development. Notably, these pathways were not enriched in the 15-month-old vs. 3-month-old comparison. As mentioned above, there were great differences in the mechanisms of skeletal muscle development between the fetal and postnatal period, which suggests that the DEMs and their target mRNAs that were enriched in these pathways play more important roles in the early stages of skeletal muscle development. In the 15-month-old vs. 3-month-old comparison, the “ribosome” pathway was the only significantly enriched pathway (p < 0.05). It is known that ribosomes serve as macromolecular machines for protein synthesis, with such machines being responsible for muscle growth [65,66]. Therefore, the miRNA–mRNA pairs involved in this pathway may exert roles in the regulation of protein synthesis rates, thus impacting skeletal muscle development.
Previous studies revealed that miRNAs with lower abundances have no discernible regulatory effects on their target genes [67,68]. Therefore, we constructed interaction networks for each comparison after filtering out the lowly expressed DEMs (average normalized counts < 100). In the interaction networks, each miRNA was shown to interact with one or more mRNAs, and vice versa, highlighting the complex regulatory roles of miRNAs.
Among the DEMs found in the networks, oar-miR-133 was the most abundantly expressed miRNA; its expression was significantly increased after birth. We further confirmed that histone deacetylase 1 (HDAC1) was the target of oar-miR-133, according to a dual-luciferase reporter assay. As a known muscle-specific miRNA, miR-133 was reported as a regulator in muscle cell proliferation and differentiation by targeting the serum response factor (SRF) [34], insulin-like growth factor-1 receptor (IGF-1R) [69], uncoupling protein 2 (UCP2) [70], forkhead transcriptional factor 2 (FOXL2) [71], etc. However, no studies to date suggest that miR-133 and HDAC1 interact. HDAC1 plays a inhibiting role in the skeletal muscle myogenesis by suppressing the transcriptional activities of myoblast determination protein (MYOD), a key regulator of muscle differentiation [72]. Therefore, we hypothesized that increases in oar-miR-133 expression may promote sheep skeletal muscle cell differentiation by downregulating HDAC1; if confirmed, this would extend our understanding of how miR-133 regulates skeletal muscle development.
Among the mRNAs whose expression levels were increased in the networks, myosin heavy chain 1 (MYH1), hydroxyacyl-CoA dehydrogenase/3-ketoacyl-CoA thiolase/enoyl-CoA hydratase (trifunctional protein), alpha subunit (HADHA), and 3-oxoacid CoA-transferase 1 (OXCT1) were the three genes targeted by the highest number of miRNAs. MYH1, a highly expressed gene in MyHC-IIx fibers (fast-twitch fibers), is crucial for skeletal muscle development and can be used as a myoblast differentiation marker gene [73,74]. The upregulation of MYH1 expression indicates that the proportion of MyHC-IIx fibers increased. Previous studies showed that muscle fiber composition is correlated with muscle fiber diameter and that the transformation of slow-twitch fibers into fast-twitch fibers can induce an increase in muscle mass [75,76]. Both HADHA and OXCT1 are genes related to metabolism. HADHA encodes the subunit of the mitochondrial trifunctional protein, a key enzyme for the β-oxidation of fatty acid [77]. OXCT1 encodes succinyl-CoA:3-oxoacid CoA transferase (SCOT), which is a key enzyme for ketolysis [78]. In skeletal muscle, mitochondrial fatty acid β-oxidation and ketolysis represent aerobic energy sources [79,80]. Zheng et al. [81] detected the expression of OXCT1 and found it is associated with chicken skeletal muscle hypertrophy, while Komatsu et al. [82] demonstrated that HADHA expression in skeletal muscle is associated with the growth rate of pigs. In our research, oar-miR-1185-5p was found to be significantly downregulated in all three comparison groups and to have interacted with the abovementioned three mRNAs. MYH1 was found to be involved in the “tight junction” pathway, OXCT1 in the “valine, leucine and isoleucine degradation” pathway, and HADHA in both the “valine, leucine and isoleucine degradation” and the “biosynthesis of unsaturated fatty acids” pathways. These results implied that oar-miR-1185-5p may play a role in sheep muscle development through the related cellular process and metabolism pathways. To the best of our knowledge, no research has yet been reported on miR-1185 roles during skeletal muscle development. Therefore, the results obtained from this research may provide a new perspective for understanding the regulatory mechanisms of skeletal muscle.
Further, we found that PC-5p-3703_578 was the only novel miRNA that was involved in the networks and that interacted with insulin receptor (INSR) and actin gamma 1 (ACTG1). It is widely known that insulin is an important anabolic hormone in skeletal muscle [83]. INSR is an insulin receptor with tyrosine kinase activity, which acts as a molecular switch in the insulin signal transduction pathway [84]. Following the binding of insulin to INSR, the PI3K/AKT and MAPK/ERK signaling pathways, which regulate muscle development, are initiated, which, in turn, leads to muscle hypertrophy [85,86]. Furthermore, a recent study using C2C12 cells showed that the knockdown of INSR induced cell cycle arrest at G1/G0 and inhibited cell proliferation [87]. The ACTG1-encoded protein (cytoplasmic γ-1-actin), an actin isoform, is involved in cytoskeleton maintenance [88]. Previous studies revealed that ACTG1 has a regulating effect in the myogenic cell migration, which is necessary for skeletal muscle formation [1,89]. Other studies found that knocking out ACTG1 leads to growth delay and skeletal myopathy in mice [90,91]. From these results, we can speculate that PC-5p-3703_578 may be a potential negative regulator of skeletal muscle development.
Altogether, the results of the present study provide reference data that will be of great use for investigating the regulatory mechanisms of skeletal muscle development in Wuranke sheep.

5. Conclusions

In this study, it is revealed that a series of candidate miRNA–mRNA pairs may act as modulators of muscle development. This study’s findings provide a theoretical basis for a deeper understanding of the functions of the miRNAs and their candidate target mRNAs that underlie skeletal muscle development in sheep.

Supplementary Materials

The following supporting information can be downloaded at https://www.mdpi.com/article/10.3390/genes14112034/s1. Table S1: Primer sequences of miRNAs for RT-qPCR used in this study; Table S2: Primer sequences of mRNAs for RT-qPCR used in this study; Table S3: Summary of small RNA sequencing data; Table S4: Expression levels of top 10 highly expressed known miRNAs; Table S5: Expression levels of top 10 highly expressed novel miRNAs; Table S6: Summary of mRNA sequencing data.

Author Contributions

Conceptualization, Y.Y. and G.B.; methodology, Y.Y., T.N. and G.B.; software, Y.Y., R.W., X.H., X.Q. and L.C.; validation, Y.Y., R.W., X.H., X.Q. and L.C.; formal analysis, Y.Y., T.N., R.W. and X.H.; investigation, Y.Y., R.W., X.H., X.Q. and L.C.; resources, G.B.; data curation, Y.Y. and G.B.; writing—original draft preparation, Y.Y.; writing—review and editing: Y.Y., T.N., L.S., X.Y. and G.B.; visualization, Y.Y., R.W. and X.H.; supervision, G.B.; project administration, G.B.; funding acquisition, G.B. All authors have read and agreed to the published version of the manuscript.

Funding

This research was funded by the China Agriculture Research System of MOF and MARA (CARS38) and the Inner Mongolia Autonomous Region Science and Technology Plan Project (2019–2022).

Institutional Review Board Statement

All experimental procedures complied with the guidelines for the ethical review of laboratory animal welfare (People’s Republic of China National Standard [GB/T 35892-2018]) and were approved by the Specialized Committee on Scientific Research and Academic Ethics of Inner Mongolia Agricultural University (approval document number [2020]022).

Informed Consent Statement

Not applicable.

Data Availability Statement

The sequence data of the present study were submitted to SRA with bioproject numbers PRJNA1009824 and PRJNA1009886.

Conflicts of Interest

The authors declare no conflict of interest.

References

  1. Buckingham, M. Skeletal muscle formation in vertebrates. Curr. Opin. Genet. Dev. 2001, 11, 440–448. [Google Scholar] [CrossRef] [PubMed]
  2. Nie, M.; Deng, Z.L.; Liu, J.; Wang, D.Z. Noncoding RNAs, emerging regulators of skeletal muscle development and diseases. BioMed Res. Int. 2015, 2015, 676575. [Google Scholar] [CrossRef]
  3. Nesvadbova, M.; Borilova, G. Molecular regulation of skeletal muscle tissue formation and development. Vet. Med. Czech. 2018, 63, 489–499. [Google Scholar] [CrossRef]
  4. Fabian, M.R.; Sonenberg, N.; Filipowicz, W. Regulation of mRNA translation and stability by microRNAs. Annu. Rev. Biochem. 2010, 79, 351–379. [Google Scholar] [CrossRef]
  5. Iwakawa, H.; Tomari, Y. The functions of microRNAs: mRNA decay and translational repression. Trends Cell Biol. 2015, 25, 651–665. [Google Scholar] [CrossRef]
  6. Xu, M.; Chen, X.; Chen, D.; Yu, B.; Li, M.; He, J.; Huang, Z. Regulation of skeletal myogenesis by microRNAs. J. Cell. Physiol. 2020, 235, 87–104. [Google Scholar] [CrossRef]
  7. Nie, M.; Liu, J.; Yang, Q.; Seok, H.Y.; Hu, X.; Deng, Z.L.; Wang, D.Z. MicroRNA-155 facilitates skeletal muscle regeneration by balancing pro- and anti-inflammatory macrophages. Cell Death Dis. 2016, 7, e2261. [Google Scholar] [CrossRef]
  8. Van Rooij, E.; Quiat, D.; Johnson, B.A.; Sutherland, L.B.; Qi, X.; Richardson, J.A.; Kelm, R.J.; Olson, E.N. A Family of microRNAs Encoded by Myosin Genes Governs Myosin Expression and Muscle Performance. Dev. Cell 2009, 17, 662–673. [Google Scholar] [CrossRef]
  9. Wang, Y.C.; Li, Y.; Wang, X.Y.; Zhang, D.; Zhang, H.; Wu, Q.; He, Y.Q.; Wang, J.Y.; Zhang, L.; Xia, H.; et al. Circulating miR-130b mediates metabolic crosstalk between fat and muscle in overweight/obesity. Diabetologia 2013, 56, 2275–2285. [Google Scholar] [CrossRef]
  10. Zhao, Q.; Kang, Y.; Wang, H.Y.; Guan, W.J.; Li, X.C.; Jiang, L.; He, X.H.; Pu, Y.B.; Han, J.L.; Ma, Y.H.; et al. Expression profiling and functional characterization of miR-192 throughout sheep skeletal muscle development. Sci. Rep. 2016, 6, 30281. [Google Scholar] [CrossRef]
  11. Liu, Z.; Li, C.; Li, X.; Yao, Y.; Ni, W.; Zhang, X.; Cao, Y.; Hazi, W.; Wang, D.; Quan, R.; et al. Expression profiles of microRNAs in skeletal muscle of sheep by deep sequencing. Asian-Australas. J. Anim. Sci. 2019, 32, 757–766. [Google Scholar] [CrossRef] [PubMed]
  12. Zhang, W.; Wang, S.Y.; Deng, S.Y.; Gao, L.; Yang, L.W.; Liu, X.N.; Shi, G.Q. MiR-27b promotes sheep skeletal muscle satellite cell proliferation by targeting myostatin gene. J. Genet. 2018, 97, 1107–1117. [Google Scholar] [CrossRef]
  13. Lu, Z.; Du, L.; Liu, R.; Di, R.; Zhang, L.; Ma, Y.; Li, Q.; Liu, E.; Chu, M.; Wei, C. MiR-378 and BMP-Smad can influence the proliferation of sheep myoblast. Gene 2018, 674, 143–150. [Google Scholar] [CrossRef] [PubMed]
  14. He, M.; Zhang, W.; Wang, S.; Ge, L.; Cao, X.; Wang, S.; Yuan, Z.; Lv, X.; Getachew, T.; Mwacharo, J.M.; et al. MicroRNA-181a regulates the proliferation and differentiation of Hu sheep skeletal muscle satellite cells and targets the YAP1 gene. Genes 2022, 13, 520. [Google Scholar] [CrossRef]
  15. Wang, S.; Cao, X.; Ge, L.; Gu, Y.; Lv, X.; Getachew, T.; Mwacharo, J.M.; Haile, A.; Sun, W. MiR-22-3p inhibits proliferation and promotes differentiation of skeletal muscle cells by targeting IGFBP3 in Hu sheep. Animals 2022, 12, 114. [Google Scholar] [CrossRef]
  16. Hu, W.; Wang, X.; Bi, Y.; Bao, J.; Shang, M.; Zhang, L. The molecular mechanism of the TEAD1 gene and miR-410-5p affect embryonic skeletal muscle development: A miRNA-mediated ceRNA network analysis. Cells 2023, 12, 943. [Google Scholar] [CrossRef]
  17. Friedländer, M.R.; Chen, W.; Adamidi, C.; Maaskola, J.; Einspanier, R.; Knespel, S.; Rajewsky, N. Discovering microRNAs from deep sequencing data using miRDeep. Nat. Biotechnol. 2008, 26, 407–415. [Google Scholar] [CrossRef]
  18. Li, X.; Shahid, M.Q.; Wu, J.; Wang, L.; Liu, X.; Lu, Y. Comparative small RNA analysis of pollen development in autotetraploid and diploid rice. Int. J. Mol. Sci. 2016, 17, 499. [Google Scholar] [CrossRef]
  19. Martin, M. Cutadapt removes adapter sequences from high-throughput sequencing reads. EMBnet J. 2011, 17, 10–12. [Google Scholar] [CrossRef]
  20. Kim, D.; Langmead, B.; Salzberg, S.L. HISAT: A fast spliced aligner with low memory requirements. Nat. Methods 2015, 12, 357–360. [Google Scholar] [CrossRef]
  21. Pertea, M.; Pertea, G.M.; Antonescu, C.M.; Chang, T.C.; Mendell, J.T.; Salzberg, S.L. StringTie enables improved reconstruction of a transcriptome from RNA-seq reads. Nat. Biotechnol. 2015, 33, 290–295. [Google Scholar] [CrossRef] [PubMed]
  22. Frazee, A.C.; Pertea, G.; Jaffe, A.E.; Langmead, B.; Salzberg, S.L.; Leek, J.T. Ballgown bridges the gap between transcriptome assembly and expression analysis. Nat. Biotechnol. 2015, 33, 243–246. [Google Scholar] [CrossRef] [PubMed]
  23. Livak, K.J.; Schmittgen, T.D. Analysis of relative gene expression data using real-time quantitative PCR and the 2−∆∆CT method. Methods 2001, 25, 402–408. [Google Scholar] [CrossRef] [PubMed]
  24. Ashburner, M.; Ball, C.A.; Blake, J.A.; Botstein, D.; Butler, H.; Cherry, J.M.; Davis, A.P.; Dolinski, K.; Dwight, S.S.; Eppig, J.T.; et al. Gene ontology: Tool for the unification of biology. Nat. Genet. 2000, 25, 25–29. [Google Scholar] [CrossRef] [PubMed]
  25. Kanehisa, M.; Araki, M.; Goto, S.; Hattori, M.; Hirakawa, M.; Itoh, M.; Katayama, T.; Kawashima, S.; Okuda, S.; Tokimatsu, T.; et al. KEGG for linking genomes to life and the environment. Nucleic Acids Res. 2008, 36, D480–D484. [Google Scholar] [CrossRef] [PubMed]
  26. Young, M.D.; Wakefield, M.J.; Smyth, G.K.; Oshlack, A. Gene ontology analysis for RNA-seq: Accounting for selection bias. Genome Biol. 2010, 11, R14. [Google Scholar] [CrossRef] [PubMed]
  27. Wu, J.; Mao, X.; Cai, T.; Luo, J.; Wei, L. KOBAS server: A web-based platform for automated annotation and pathway identification. Nucleic Acids Res. 2006, 34, W720–W724. [Google Scholar] [CrossRef]
  28. Bartel, D.P. MicroRNAs: Genomics, biogenesis, mechanism, and function. Cell 2004, 116, 281–297. [Google Scholar] [CrossRef]
  29. Ren, H.; Li, L.; Su, H.; Xu, L.; Wei, C.; Zhang, L.; Li, H.; Liu, W.; Du, L. Histological and transcriptome-wide level characteristics of fetal myofiber hyperplasia during the second half of gestation in Texel and Ujumqin sheep. BMC Genomics 2011, 12, 411. [Google Scholar] [CrossRef]
  30. Greene, M.A.; Powell, R.; Bruce, T.; Bridges, W.C.; Duckett, S.K. miRNA transcriptome and myofiber characteristics of lamb skeletal muscle during hypertrophic growth. Front. Genet. 2022, 13, 988756. [Google Scholar] [CrossRef]
  31. Siqin, Q.; Nishiumi, T.; Yamada, T.; Wang, S.; Liu, W.; Wu, R.; Borjigin, G. Relationships among muscle fiber type composition, fiber diameter and MRF gene expression in different skeletal muscles of naturally grazing Wuzhumuqin sheep during postnatal development. Anim. Sci. J. 2017, 88, 2033–2043. [Google Scholar] [CrossRef] [PubMed]
  32. Horak, M.; Novak, J.; Bienertova-Vasku, J. Muscle-specific microRNAs in skeletal muscle development. Dev. Biol. 2016, 410, 1–13. [Google Scholar] [CrossRef]
  33. Dai, Y.; Wang, Y.M.; Zhang, W.R.; Liu, X.F.; Li, X.; Ding, X.B.; Guo, H. The role of microRNA-1 and microRNA-206 in the proliferation and differentiation of bovine skeletal muscle satellite cells. Vitr. Cell. Dev. Biol. Anim. 2016, 52, 27–34. [Google Scholar] [CrossRef] [PubMed]
  34. Chen, J.F.; Mandel, E.M.; Thomson, J.M.; Wu, Q.; Callis, T.E.; Hammond, S.M.; Conlon, F.L.; Wang, D.Z. The role of microRNA-1 and microRNA-133 in skeletal muscle proliferation and differentiation. Nat. Genet. 2006, 38, 228–233. [Google Scholar] [CrossRef]
  35. Zhang, D.; Wang, X.; Li, Y.; Zhao, L.; Lu, M.; Yao, X.; Xia, H.; Wang, Y.C.; Liu, M.F.; Jiang, J.; et al. Thyroid hormone regulates muscle fiber type conversion via miR-133a1. J. Cell Biol. 2014, 207, 753–766. [Google Scholar] [CrossRef] [PubMed]
  36. Bjorkman, K.K.; Guess, M.G.; Harrison, B.C.; Polmear, M.M.; Peter, A.K.; Leinwand, L.A. miR-206 enforces a slow muscle phenotype. J. Cell Sci. 2020, 133, jcs243162. [Google Scholar] [CrossRef]
  37. Nakasa, T.; Ishikawa, M.; Shi, M.; Shibuya, H.; Adachi, N.; Ochi, M. Acceleration of muscle regeneration by local injection of muscle-specific microRNAs in rat skeletal muscle injury model. J. Cell Mol. Med. 2010, 14, 2495–2505. [Google Scholar] [CrossRef]
  38. Yang, Y.L.; Li, Y.; Liang, R.Y.; Zhou, R.; Ao, H.; Mu, Y.L.; Yang, S.L.; Li, K.; Tang, Z.L. Dynamic expression of microRNA-127 during porcine prenatal and postnatal skeletal muscle development. J. Integr. Agric. 2014, 13, 1331–1339. [Google Scholar] [CrossRef]
  39. Li, J.; Wang, G.; Jiang, J.; Fu, L.; Zhou, P.; Ren, H. The microRNA-127-3p directly targeting Vamp2 in C2C12 myoblasts. Anim. Cells Syst. 2018, 22, 299–304. [Google Scholar] [CrossRef]
  40. Zhai, L.; Wu, R.; Han, W.; Zhang, Y.; Zhu, D. miR-127 enhances myogenic cell differentiation by targeting S1PR3. Cell Death Dis. 2017, 8, e2707. [Google Scholar] [CrossRef]
  41. Yuan, R.; Zhang, X.; Fang, Y.; Nie, Y.; Cai, S.; Chen, Y.; Mo, D. mir-127-3p inhibits the proliferation of myocytes bytargeting KMT5a. Biochem. Biophys. Res. Commun. 2018, 503, 970–976. [Google Scholar] [CrossRef] [PubMed]
  42. Li, J.; Wang, G.; Jiang, J.; Zhang, L.; Zhou, P.; Ren, H. MicroRNA-127-3p regulates myoblast proliferation bytargeting Sept7. Biotechnol. Lett. 2020, 42, 1633–1644. [Google Scholar] [CrossRef]
  43. Gagan, J.; Dey, B.K.; Layer, R.; Yan, Z.; Dutta, A. MicroRNA-378 targets the myogenic repressor MyoR during myoblast differentiation. J. Biol. Chem. 2011, 286, 19431–19438. [Google Scholar] [CrossRef]
  44. Ju, H.; Yang, Y.; Sheng, A.; Qi, Y. MicroRNA-378 promotes myogenic differentiation by targeting BMP4. Mol. Med. Rep. 2016, 13, 2194–2200. [Google Scholar] [CrossRef] [PubMed]
  45. Tong, H.; Jiang, R.; Liu, T.; Wei, Y.; Li, S.; Yan, Y. bta-miR-378 promote the differentiation of bovine skeletal muscle-derived satellite cells. Gene 2018, 668, 246–251. [Google Scholar] [CrossRef]
  46. Rudnicki, M.A.; Schnegelsberg, P.N.J.; Stead, R.H.; Braun, T.; Arnold, H.H.; Jaenisch, R. MyoD or Myf-5 is required for the formation of skeletal muscle. Cell 1993, 75, 1351–1359. [Google Scholar] [CrossRef]
  47. Ganassi, M.; Badodi, S.; Ortuste Quiroga, H.P.; Zammit, P.S.; Hinits, Y.; Hughes, S.M. Myogenin promotes myocyte fusion to balance fibre number and size. Nat. Commun. 2018, 9, 4232. [Google Scholar] [CrossRef]
  48. Taylor, M.V.; Hughes, S.M. Mef2 and the skeletal muscle differentiation program. Semin. Cell Dev. Biol. 2017, 72, 33–44. [Google Scholar] [CrossRef]
  49. Buckingham, M.; Relaix, F. PAX3 and PAX7 as upstream regulators of myogenesis. Semin. Cell Dev. Biol. 2015, 44, 115–125. [Google Scholar] [CrossRef]
  50. Buas, M.F.; Kadesch, T. Regulation of skeletal myogenesis by Notch. Exp. Cell Res. 2010, 316, 3028–3033. [Google Scholar] [CrossRef]
  51. Fujimaki, S.; Ono, Y. Notch signaling in the regulation of skeletal muscle stem cells. J. Phys. Fit. Sports Med. 2018, 7, 213–219. [Google Scholar] [CrossRef]
  52. Glass, D.J. PI3 kinase regulation of skeletal muscle hypertrophy and atrophy. Curr. Top. Microbiol. Immunol. 2010, 346, 267–278. [Google Scholar] [CrossRef] [PubMed]
  53. Watt, K.I.; Turner, B.J.; Hagg, A.; Zhang, X.; Davey, J.R.; Qian, H.; Beyer, C.; Winbanks, C.E.; Harvey, K.F.; Gregorevic, P. The Hippo pathway effector YAP is a critical regulator of skeletal muscle fibre size. Nat. Commun. 2015, 6, 6048. [Google Scholar] [CrossRef] [PubMed]
  54. Watt, K.I.; Goodman, C.A.; Hornberger, T.A.; Gregorevic, P. The Hippo signaling pathway in the regulation of skeletal muscle mass and function. Exerc. Sport Sci. Rev. 2018, 46, 92–96. [Google Scholar] [CrossRef] [PubMed]
  55. Sastry, S.K.; Lakonishok, M.; Wu, S.; Truong, T.Q.; Huttenlocher, A.; Turner, C.E.; Horwitz, A.F. Quantitative changes in integrin and focal adhesion signaling regulate myoblast cell cycle withdrawal. J. Cell Biol. 1999, 144, 1295–1309. [Google Scholar] [CrossRef] [PubMed]
  56. Schneeberger, E.E.; Lynch, R.D. The tight junction: A multifunctional complex. Am. J. Physiol. Cell Physiol. 2004, 286, C1213–C1228. [Google Scholar] [CrossRef]
  57. Matson, J.P.; Cook, J.G. Cell cycle proliferation decisions: The impact of single cell analyses. FEBS J. 2017, 284, 362–375. [Google Scholar] [CrossRef]
  58. Owen, O.E.; Kalhan, S.C.; Hanson, R.W. The key role of anaplerosis and cataplerosis for citric acid cycle function. J. Biol. Chem. 2002, 277, 30409–30412. [Google Scholar] [CrossRef]
  59. Hurley, M.S.; Flux, C.; Salter, A.M.; Brameld, J.M. Effects of fatty acids on skeletal muscle cell differentiation in vitro. Brit. J. Nutr. 2006, 95, 623–630. [Google Scholar] [CrossRef]
  60. Bruni, P.; Donati, C. Pleiotropic effects of sphingolipids in skeletal muscle. Cell. Mol. Life Sci. 2008, 65, 3725–3736. [Google Scholar] [CrossRef]
  61. Li, Q.; Zhang, T.; Zhang, R.; Qin, X.; Zhao, J. All-trans retinoic acid regulates sheep primary myoblast proliferation and differentiation in vitro. Domest. Anim. Endocrin. 2020, 71, 106394. [Google Scholar] [CrossRef]
  62. Wang, B.; Nie, W.; Fu, X.; de Avila, J.M.; Ma, Y.; Zhu, M.J.; Maquivar, M.; Parish, S.M.; Busboom, J.R.; Nelson, M.L.; et al. Neonatal vitamin A injection promotes cattle muscle growth and increases oxidative muscle fibers. J. Anim. Sci. Biotechnol. 2018, 9, 82. [Google Scholar] [CrossRef] [PubMed]
  63. Maki, T.; Yamamoto, D.; Nakanishi, S.; Iida, K.; Iguchi, G.; Takahashi, Y.; Kaji, H.; Chihara, K.; Okimura, Y. Branched-chain amino acids reduce hindlimb suspension-induced muscle atrophy and protein levels of atrogin-1 and MuRF1 in rats. Nutr. Res. 2012, 32, 676–683. [Google Scholar] [CrossRef]
  64. Salvatore, D.; Simonides, W.S.; Dentice, M.; Zavacki, A.M.; Larsen, P.R. Thyroid hormones and skeletal muscle—New insights and potential implications. Nat. Rev. Endocrinol. 2014, 10, 206–214. [Google Scholar] [CrossRef] [PubMed]
  65. Chaillou, T. Ribosome specialization and its potential role in the control of protein translation and skeletal muscle size. J. Appl. Physiol. 2019, 127, 599–607. [Google Scholar] [CrossRef] [PubMed]
  66. Nader, G.A. Ribosomes ‘muscle up’ postnatal muscle growth. J. Physiol. 2014, 592, 5143. [Google Scholar] [CrossRef] [PubMed]
  67. Mullokandov, G.; Baccarini, A.; Ruzo, A.; Jayaprakash, A.D.; Tung, N.; Israelow, B.; Evans, M.J.; Sachidanandam, R.; Brown, B.D. High-throughput assessment of microRNA activity and function using microRNA sensor and decoy libraries. Nat. Methods 2012, 9, 840–846. [Google Scholar] [CrossRef]
  68. Brown, B.D.; Gentner, B.; Cantore, A.; Colleoni, S.; Amendola, M.; Zingale, A.; Baccarini, A.; Lazzari, G.; Galli, C.; Naldini, L. Endogenous microRNA can be broadly exploited to regulate transgene expression according to tissue, lineage and differentiation state. Nat. Biotechnol. 2007, 25, 1457–1467. [Google Scholar] [CrossRef]
  69. Huang, M.B.; Xu, H.; Xie, S.J.; Zhou, H.; Qu, L.H. Insulin-like growth factor-1 receptor is regulated by microRNA-133 during skeletal myogenesis. PLoS ONE 2011, 6, e29173. [Google Scholar] [CrossRef]
  70. Chen, X.; Wang, K.; Chen, J.; Guo, J.; Yin, Y.; Cai, X.; Guo, X.; Wang, G.; Yang, R.; Zhu, L.; et al. In vitro evidence suggests that miR-133a-mediated regulation of uncoupling protein 2 (UCP2) is an indispensable step in myogenic differentiation. J. Biol. Chem. 2009, 284, 5362–5369. [Google Scholar] [CrossRef]
  71. Luo, Y.; Wu, X.; Ling, Z.; Yuan, L.; Cheng, Y.; Chen, J.; Xiang, C. microRNA133a targets Foxl2 and promotes differentiation of C2C12 into myogenic progenitor cells. DNA Cell Biol. 2015, 34, 29–36. [Google Scholar] [CrossRef] [PubMed]
  72. Mal, A.; Sturniolo, M.; Schiltz, R.L.; Ghosh, M.K.; Harter, M.L. A role for histone deacetylase HDAC1 in modulating the transcriptional activity of MyoD: Inhibition of the myogenic program. EMBO J. 2001, 20, 1739–1753. [Google Scholar] [CrossRef] [PubMed]
  73. Schiaffino, S.; Reggiani, C. Fiber types in mammalian skeletal muscles. Physiol. Rev. 2011, 91, 1447–1531. [Google Scholar] [CrossRef] [PubMed]
  74. Chen, R.; Jiang, T.; Lei, S.; She, Y.; Shi, H.; Zhou, S.; Ou, J.; Liu, Y. Expression of circular RNAs during C2C12 myoblast differentiation and prediction of coding potential based on the number of open reading frames and N6-methyladenosine motifs. Cell Cycle 2018, 17, 1832–1845. [Google Scholar] [CrossRef]
  75. Peinado, B.; Latorre, R.; Váquez-Autón, J.M.; Poto, A.; Ramírez, G.; López-Albors, O.; Moreno, F.; Gil, F. Histochemical skeletal muscle fibre types in the sheep. Anat. Histol. Embryol. 2004, 33, 236–243. [Google Scholar] [CrossRef]
  76. Wegner, J.; Albrecht, E.; Fiedler, I.; Teuscher, F.; Papstein, H.J.; Ender, K. Growth- and breed-related changes of muscle fiber characteristics in cattle. J. Anim. Sci. 2000, 78, 1485–1496. [Google Scholar] [CrossRef]
  77. IJlst, L.; Ruiter, J.P.N.; Hoovers, J.M.N.; Jakobs, M.E.; Wanders, R.J.A. Common missense mutation G1528C in long-chain 3-hydroxyacyl-CoA dehydrogenase deficiency. J. Clin. Investig. 1996, 98, 1028–1033. [Google Scholar] [CrossRef]
  78. Nam, G.H.; Ahn, K.; Bae, J.H.; Cho, B.W.; Park, K.D.; Lee, H.K.; Yang, Y.M.; Kim, T.H.; Seong, H.H.; Han, K.; et al. Identification of ORF sequences and exercise-induced expression change in thoroughbred horse OXCT1 gene. Gene 2012, 496, 45–48. [Google Scholar] [CrossRef]
  79. Fukao, T.; Mitchell, G.; Sass, J.O.; Hori, T.; Orii, K.; Aoyama, Y. Ketone body metabolism and its defects. J. Inherit. Metab. Dis. 2014, 37, 541–551. [Google Scholar] [CrossRef]
  80. Bastin, J. Regulation of mitochondrial fatty acid β-oxidation in human: What can we learn from inborn fatty acid β-oxidation deficiencies? Biochimie 2014, 96, 113–120. [Google Scholar] [CrossRef]
  81. Zheng, Q.; Zhang, Y.; Chen, Y.; Yang, N.; Wang, X.J.; Zhu, D. Systematic identification of genes involved in divergent skeletal muscle growth rates of broiler and layer chickens. BMC Genom. 2009, 10, 87. [Google Scholar] [CrossRef] [PubMed]
  82. Komatsu, Y.; Sukegawa, S.; Yamashita, M.; Katsuda, N.; Tong, B.; Ohta, T.; Kose, H.; Yamada, T. Identification of genes showing differential expression profile associated with growth rate in skeletal muscle tissue of Landrace weanling pig. J. Genet. 2016, 95, 341–347. [Google Scholar] [CrossRef] [PubMed]
  83. Chow, L.S.; Albright, R.C.; Bigelow, M.L.; Toffolo, G.; Cobelli, C.; Nair, K.S. Mechanism of insulin’s anabolic effect on muscle: Measurements of muscle protein synthesis and breakdown using aminoacyl-tRNA and other surrogate measures. Am. J. Physiol. Endocrinol. Metab. 2006, 291, E729–E736. [Google Scholar] [CrossRef] [PubMed]
  84. Lee, J.; Pilch, P.F. The insulin receptor: Structure, function, and signaling. Am. J. Physiol. 1994, 266, C319–C334. [Google Scholar] [CrossRef]
  85. Sandri, M. Signaling in muscle atrophy and hypertrophy. Physiology 2008, 23, 160–170. [Google Scholar] [CrossRef]
  86. De Sousa, R.A.L.; Harmer, A.R.; Freitas, D.A.; Mendonça, V.A.; Lacerda, A.C.R.; Leite, H.R. An update on potential links between type 2 diabetes mellitus and Alzheimer’s disease. Mol. Biol. Rep. 2020, 47, 6347–6356. [Google Scholar] [CrossRef]
  87. Wei, W.; Zhang, W.Y.; Bai, J.B.; Zhang, H.X.; Zhao, Y.Y.; Li, X.Y.; Zhao, S.H. The NF-κB modulated miR-195/497 inhibit myoblast proliferation by targeting Igf1r/Insr and cyclin genes. J. Cell Sci. 2016, 129, 39–50. [Google Scholar] [CrossRef]
  88. Tang, Y.; Peng, X.; Huang, X.; Li, J. Actin gamma 1 is a critical regulator of pancreatic ductal adenocarcinoma. Saudi J. Gastroenterol. 2022, 28, 239–246. [Google Scholar] [CrossRef]
  89. Wang, L.; Miao, J.; Li, L.; Wu, D.; Zhang, Y.; Peng, Z.; Zhang, L.; Yuan, Z.; Sun, K. Identification of an FHL1 protein complex containing gamma-actin and non-muscle myosin IIB by analysis of protein-protein interactions. PLoS ONE 2013, 8, e79551. [Google Scholar] [CrossRef]
  90. Bunnell, T.M.; Ervasti, J.M. Delayed embryonic development and impaired cell growth and survival in Actg1 null mice. Cytoskeleton 2010, 67, 564–572. [Google Scholar] [CrossRef]
  91. Sonnemann, K.J.; Fitzsimons, D.P.; Patel, J.R.; Liu, Y.; Schneider, M.F.; Moss, R.L.; Ervasti1, J.M. Cytoplasmic gamma-actin is not required for skeletal muscle development but its absence leads to a progressive myopathy. Dev. Cell 2006, 11, 387–397. [Google Scholar] [CrossRef] [PubMed]
Figure 1. Sequence length distribution of total and unique valid reads. Data are presented as mean ± SD from nine small RNA libraries.
Genes 14 02034 g001
Figure 2. Principal component analysis (PCA) for miRNA (A) and mRNA (B) expression profiles. Fetal: A1, A2, and A3; 3-month-old: B1, B2, and B3; 15-month-old: C1, C2, and C3.
Genes 14 02034 g002
Figure 3. Analysis of differentially expressed miRNAs (DEMs) and differentially expressed genes (DEGs) in the 3-month-old vs. fetal, 15-month-old vs. fetal, and 15-month-old vs. 3-month-old comparisons. (A) Numbers of upregulated and downregulated DEMs in each pairwise comparison. (B) Numbers of upregulated and downregulated DEGs in each pairwise comparison. (C) Venn diagram of DEMs in each pairwise comparison. (D) Venn diagram of DEGs in each pairwise comparison.
Genes 14 02034 g003
Figure 4. Validation of RNA-seq data using real-time quantitative polymerase chain reaction (RT-qPCR). (A) RNA-seq data for DEMs. (B) RNA-seq data for DEGs. (C) RT-qPCR analysis of DEMs. (D) RT-qPCR analysis of DEGs.
Genes 14 02034 g004
Figure 5. Gene Ontology (GO) enrichment analysis of candidate target mRNAs in 3-month-old vs. fetal (A), 15-month-old vs. fetal (B), and 15-month-old vs. 3-month-old (C) comparisons.
Genes 14 02034 g005
Figure 6. Kyoto Encyclopedia of Genes and Genomes (KEGG) pathway enrichment analysis of candidate target mRNAs in 3-month-old vs. fetal (A), 15-month-old vs. fetal (B), and 15-month-old vs. 3-month-old (C) comparisons.
Genes 14 02034 g006
Figure 7. Regulatory networks of miRNA–mRNA pairs related to muscle development in 3-month-old vs. fetal (A), 15-month-old vs. fetal (B), and 15-month-old vs. 3-month-old (C) comparisons. Red triangles represent upregulated miRNAs, blue triangles represent downregulated miRNAs, red ellipses represent upregulated mRNAs, and blue ellipses represent downregulated mRNAs.
Genes 14 02034 g007
Figure 8. Prediction and validation of oar-miR-133, oar-miR-1185-5p, and PC-5p-3703_578 target mRNAs. (A) The predicted binding sites of oar-miR-133 in the 3′UTR of HADC1. (B) The predicted binding sites of oar-miR-1185-5p in the 3′UTR of MYH1, HADHA, and OXCT1. (C) The predicted binding sites of PC-5p-3703_578 in the 3′UTR of INSR and ACTG1. (D) The luciferase reporter assays were performed on 293T cells by cotransfecting the HADC1 3′UTR-WT or 3′UTR-MUT psiCHECK-2 vector along with either oar-miR-133 mimics or NC mimics. (E) The luciferase reporter assays were performed on 293T cells by cotransfecting the MYH1, HADHA or OXCT1 3′UTR-WT or 3′UTR-MUT psiCHECK-2 vector along with either oar-miR-1185-5p mimics or NC mimics. (F) The luciferase reporter assays were performed on 293T cells by cotransfecting the INSR or ACTG1 3′UTR-WT or 3′UTR-MUT psiCHECK-2 vector along with either PC-5p-3703_578 mimics or NC mimics. *** p < 0.001.
Genes 14 02034 g008
Disclaimer/Publisher’s Note: The statements, opinions and data contained in all publications are solely those of the individual author(s) and contributor(s) and not of MDPI and/or the editor(s). MDPI and/or the editor(s) disclaim responsibility for any injury to people or property resulting from any ideas, methods, instructions or products referred to in the content.

