Article

Differences in Adipose Gene Expression Profiles between Male and Female Even Reindeer (Rangifer tarandus) in Sakha (Yakutia)

1
Natural Resources Institute Finland (Luke), 31600 Jokioinen, Finland
2
NordGen—Nordic Genetic Resource Centre, 1432 Ås, Norway
*
Author to whom correspondence should be addressed.
Genes 2022, 13(9), 1645; https://doi.org/10.3390/genes13091645
Submission received: 24 August 2022 / Revised: 6 September 2022 / Accepted: 12 September 2022 / Published: 13 September 2022
(This article belongs to the Section Animal Genetics and Genomics)

Abstract

:
Reindeer are native to harsh northern Eurasian environments which are characterized by long and cold winters, short summers, and limited pasture vegetation. Adipose tissues play a significant role in these animals by modulating energy metabolism, immunity, and reproduction. Here, we have investigated the transcriptome profiles of metacarpal, perirenal, and prescapular adipose tissues in Even reindeer and searched for genes that were differentially expressed in male and female individuals. A total of 15,551 genes were expressed, where the transcriptome profile of metacarpal adipose tissue was found to be distinct from that of perirenal and prescapular adipose tissues. Interestingly, 10 genes, including PRDM9, which is known to have an important role in adaptation and speciation in reindeer, were always upregulated in all three tissues of male reindeer.

1. Introduction

Adipose tissues serve a variety of functions, including storing lipids for energy metabolism and secreting signaling molecules and hormones that play an important role in metabolism, immunity, and reproduction [1,2,3,4,5,6]. The most prevalent functional components of adipose tissues—white and brown adipocytes—store energy in the form of lipids and regulate and respond to the endocrine processes involved in thermohomeostasis and energy balance. The amount and distribution of adipose tissue in mammals can differ significantly between males and females [6,7,8,9,10,11]. Previous studies in humans have shown that sex and sex hormones influence adipose tissue in terms of adipocyte development, adipogenesis, gene expression profiles regulating insulin resistance and lipolysis, and inflammatory response [6,12,13,14,15]. Although sex hormones and steroids are involved in fundamental sex differences in adipose tissue distribution and inflammation, sex chromosomes also determine adipose tissue distribution, along with metabolic and inflammatory responses [6,9,16].
Gender differences in fat distribution, as well as their links to metabolic health, have been widely investigated in clinical and epidemiological studies [6,9,12,15,17]. However, sex-specific differences in studies regarding adipose transcriptome profiling and regulation are relatively scarce. Gender differences in adipose tissue gene expression have mainly been studied in humans and mice [17,18,19,20,21,22,23,24]. Building on these prior studies, we have recently investigated transcriptome profiles of three adipose tissues from different anatomical depots (metacarpal, perirenal and prescapular) in Finnish and Even reindeer (from the Sakha Republic, Russia) during the spring and winter to obtain better insights into how animals in the arctic adapt and survive during harsh conditions [25]. The study found genes associated with energy metabolism and the immune system that responded differently to seasonal and biogeographical changes.
In the present study, for the first time, we have investigated gene expression differences between male and female semi-domestic reindeer in three adipose tissues collected from different anatomical locations (metacarpal, perirenal, and prescapular). The samples were collected from Even (Sakha Republic, Yakutia, Russia) reindeer breed (or population) which have adapted to the harsh Yakutian environments. In this region, the annual temperature may fluctuate from −60 °C up to +30 °C, winters are long, summers are short, and the reindeer feed on natural pastures year-round.

2. Materials and Methods

2.1. Sample Collection for Transcriptome Analysis

The current study includes RNA-seq of 18 tissue samples from six reindeer individuals (three adult females and three adult males) that were randomly collected at slaughter in the Eveno-Bytantay District, Sakha (Yakutia), the Russian Federation in the winter (November–December) (Table 1 and Table S1). The male samples were recently included in the study by Weldenegodguad et al. [25]. Perirenal samples were taken from the adipose tissue around the kidneys, prescapular samples from the adipose tissue located beneath the cervical muscles in front of the scapula, and metacarpal samples from the bone marrow in the diaphysis of the metacarpal bone (left front leg). For convenience, throughout the text, the sample groups are abbreviated using gender (M, F) and tissue type (P, S, M). For example, M-M represents the metacarpal tissue of male reindeer. The samples were stored in RNAlater® Solution (Ambion/QIAGEN, Valencia, CA, USA). The animals had been grazing on natural pastures throughout the year before the sampling. The animals were exposed to seasonal ambient temperatures and photoperiods. The mean daily temperature in Northern Sakha varied between −13 °C and −24 °C before sampling (6.5 h of daylight, 17.5 h of dark). All protocols and sample collections were performed in accordance with the legislation approved by the Russian authorization board (FS/UVN 03/163733/07.04.2016s).

2.2. RNA Extraction, Library Preparation, and Sequencing

RNA extraction, library preparation, and sequencing were performed at the Finnish Functional Genomic Centre (FFGC), Turku, Finland. Total RNA was extracted from adipose tissues (ca < 30 mg/sample) using the Qiagen AllPrep DNA/RNA/miRNA kit, here, according to the manufacturer’s protocol. The quality of the RNA samples was ensured with an Agilent Bioanalyzer 2100 (Agilent Technologies, Waldbronn, Germany), and the concentration of each sample was measured with a Nanodrop ND-2000 (Thermo Scientific; Wilmington, NC, USA) and a Qbit(R) Fluorometric Quantification, Life Technologies. All samples revealed an RNA integrity number (RIN) above 7.5.
Library preparation was done according to Illumina TruSeq® Stranded mRNA Sample Preparation Guide (part #15031047). Unique Illumina TruSeq indexing adapters were ligated to each sample to pool several samples later in one flow cell lane. Library quality was inferred using an Advanced Analytical Fragment Analyser and concentration with a Qubit fluorometer, and only good-quality libraries were sequenced.
The samples were normalized and pooled for automated cluster preparation, which was carried out with Illumina cBot station. All libraries were combined in one pool and run on the Illumina HiSeq 3000 platform. Paired-end sequencing with a 2 × 75 bp read length was used. Base calling and adapter trimming were performed using Illumina’s standard bcl2fastq (v2.20) software.

2.3. Bioinformatic Analyses

The overall quality of the raw RNA-seq reads in fastq and aligned reads in BAM format were examined using FastQC software v0.11.7 [26]. The FastQC reports were summarized using MultiQC v1.7 [27]. High-quality RNA-seq reads for each sample were mapped against the reindeer draft assembly [28] using Spliced Transcripts Alignment to a Reference (STAR) (version 2.6.0a) [29], here, with the default parameters. Next, we generated read counts from the aligned files using the featureCounts software (version 1.6.1) from the Subread package [30] to assign the reads to genes. The GTF format annotation file associated with the reindeer draft assembly was used for gene coordinate information.
To examine the shared and uniquely expressed genes across the three adipose tissues, we used the cpm function from the edgeR library [31] to generate count-per-million (CPM) values. Lowly expressed transcripts with CPM < 0.5 were discarded.
Adipose transcriptomes are affected by the type of adipose, as well as by the sex of the animal [32]. We conducted differential gene expression analysis between male and female reindeer for each adipose tissue.
Raw read counts were processed using the R Bioconductor package DESeq2 [33] to perform differential gene expression and related quality control analyses. Prior to running DESeq2, lowly expressed (rowSums < 1) genes were discarded. Raw gene expression counts were normalized for differences in library size and sequencing depth using DESeq2 to enable gene expression comparisons across samples. We performed principal component analysis (PCA) to assess sample similarity using the variance stabilizing transformation (VST) method. In the current study, we used fold change and false discovery rate (FDR) filtering criteria to identify significantly differentially expressed genes (DEGs). To screen for significant DEGs, we set the absolute value of log2 fold change (LFC) to be greater than or equal to 1.5 (|log2FoldChange| > 1.5) and an adjusted p-value of 0.05 (padj < 0.05). The Benjamini–Hochberg FDR method was used to calculate the adjusted p-values.
To gain insights into the biological functions and relevance of the identified DEGs, a functional enrichment analysis was conducted using AgriGO v2.0 [34]. In the AgriGO analysis toolkit, to detect the significantly enriched GO terms, default parameters were used in the ‘Advanced options’: Fisher as the statistical test method, Yekutieli for multiple test correction at a significance level threshold 0.05 (FDR < 0.05) and a minimum number of five mapping entries. In this analysis, the GO annotation file from the de novo assembled reindeer genome [28] was used as a background reference. Furthermore, to explore the biological pathways associated with the DEGs, we performed Kyoto Encyclopaedia of Genes and Genomes (KEGG) pathway analysis using the GAGE [35] Bioconductor package. The significantly enriched pathways were identified based on the q-values obtained from Fisher’s exact test (q-value < 0.1).

3. Results and Discussion

3.1. RNA Sequencing and Mapping

A total of 53 gigabases (Gb) of RNA-seq data were generated from 18 adipose tissue samples collected from six Even reindeer. Because the adapters were trimmed automatically and the Phred quality scores of the reads from all samples were greater than 30, we did not perform further trimming and quality filtering. The number of reads per sample ranged from 30.0 million (M) (4.5 Gb) to 39.3 M (5.8 Gb), with a mean high-quality 33.6 M and 2 × 75 bp pair-ended reads per sample (Table S1). The proportion of reads mapped to the reindeer reference genome ranged from 88.7% to 91.3%, with, on average, >90% of the reads from each sample uniquely mapped to the reindeer draft genome assembly (Table S2). In general, the mapping statistics indicated good quality for downstream gene expression analyses and were similar to other livestock transcriptome studies [36]. The raw sequence reads in the compressed fastq format (fastq.gz) that were analyzed in the current study are part of a larger study [25]. The data have been deposited to the European Nucleotide Archive (ENA) and are publicly available under accession PRJEB44094.

3.2. Gene Expression Overview

A total of 15,551 genes were expressed (cpm > 0.5 in at least two samples) in the 18 samples (Table S3), representing approximately 56.6% of the 27,332 reindeer genes reported in the draft reindeer genome assembly annotation file [28]. The highest number of genes were expressed in metacarpal adipose tissue (n = 14,481), followed by perirenal (n = 14,085) and prescapular (n = 13,954) adipose tissues. In both male and female reindeer, >12,800 genes were commonly expressed between the adipose tissues (Figure 1A). In both male and female reindeer, the highest number of genes were expressed in the metacarpal adipose tissue, which also displayed the highest number of uniquely expressed genes. To assess the expression similarity among the samples, we performed PCA based on the top 500 most variable genes (Figure 1B). We identified that the gene expression profiles of the metacarpal tissue in both the female and male samples were distinct. These observations are in good agreement with our recent reindeer transcriptome study [25]. The number of genes expressed in the metacarpal tissues was the highest, and in the PCA plot, the metacarpal samples formed a separate cluster from the other tissue samples. The important physiological role of the metacarpal adipose tissue, for example, in energy metabolism of reindeer, has been discussed by Weldenegodguad et al. (2021) [25] and the references therein.

3.3. Uniquely Expressed Genes

We explored genes specific to male and female reindeer (sex-biased genes in the present context) in each adipose tissue by removing the lowly expressed genes based on the mean transcripts per million (TPM < 1). In metacarpal adipose tissue, out of 825 genes, 290 and 282 genes were uniquely expressed in male and female reindeer, respectively (Figure 2a). Similarly, perirenal adipose tissue revealed 46 and 28 uniquely expressed genes in male and female reindeer (Figure 2b), respectively, and 31 and 35 genes in the prescapular for male and female reindeer, respectively (Figure 2c).
To further explore the specific genes expressed in male and female reindeer in each adipose tissue, we selected highly expressed genes based on the TPM values. In male reindeer metacarpal adipose tissue, genes such as IBSP, IGLC7, EDIL3, IGFBP2, TRIM63, LDB2, CHST6, DAZAP2, UBE2E2, and ACAN were found to be highly expressed genes (TPM > 17.12), whereas CCDC190, CCL26, ENHO, ISM1, CPZ, OTOS, PGF, GNAO1, and VMO1 and MT-CYB were among the highly expressed genes (TPM > 11.72) in female reindeer. In general, a group of C-C chemokines and collagens were uniquely expressed in the male samples, whereas ribosomal proteins were specific to female metacarpal samples. Sex-biased genes have multifunctional roles of which we provide examples here. The collagens (COL24A1, COL4A3, COL6A3, and COL6A5) and IBSP are major structural proteins of the bone matrix and are associated with bone mineral density formation. Being male-specific, these genes might contribute to larger bone elements in males compared with females [37,38]. Similarly, immune-related genes such as chemokines (CCR5, CCR6 and CCR7), IGLC7, IGKV2-30, IL2RA, and IGLV1-51 were uniquely expressed in male metacarpal tissues. Moreover, the genes related to spermatogenesis (DAZAP2 and IZUMO2) were also unique to male samples. On the other hand, ribosomal proteins (MRPS26, RPS15A, RPS19, RPS20 and RPS6) and placenta-related (PGF and PLAC8) genes were uniquely expressed in female metacarpal genes.
The perirenal-specific genes in male reindeer include several ribosomal proteins (RPL23A, RPL27A, RPL39, RPLP1, RPS11, RPS13, RPS14, and RPS23), and in female reindeer genes, those specifically expressed in perirenal include Ubiquitin-conjugating enzyme (UBE2C and UBE2QL1) and Zinc finger protein (ZNF324 and ZNF775). Similarly, the scapular-specific genes in male reindeer include ribosomal proteins (RPL39, RPL7, and RPS13) and immune response-related genes (IGLV3-19 and MS4A2). Ribosomal and zinc finger proteins have essential functions for reindeer adaptation in general, as reported previously [28]. Go enrichment analyses did not reveal any significant GO terms.

3.4. Differential Gene Expression Analyses

Our comparison of the gene expression profiles between female and male reindeer revealed a total of 327 significant DEGs in the three adipose tissues (Table 2, Tables S4–S6).
We identified a total of 225 significant DEGs between female and male reindeer in metacarpal tissue (M-F vs. M-M) (Figure 3A, Table 2 and Table S4). Of 225 significant DEGs, 78 genes were upregulated and 147 were downregulated in M-F (Table 2 and Table S4). The upregulated genes in the female samples included ANGPTL1, CX3CR1, CYP2B11, CYP2F3, CYP4B1, FABP6, ELOVL7, IGHV3-6, SLC19A3, SLC35F1, and SLC6A17 genes, while genes such as BMP1, BMP, IBSP, EFS, CCL19, IGDCC4, IL17RB, NAV3, NCAM1, NRL, OLFML2B, OLFML3, PRDM9, SCUBE1, and FLT4 were upregulated in the male samples.
In perirenal tissue, a total of 104 significant DEGs were detected, of which 54 genes were upregulated in females, and the rest were upregulated in males (Figure 3B, Table 2 and Table S5). The upregulated genes in female samples included ABCG1, ACSL6, SLC14A1, SLC16A2, SLC4A10, SLC9A2, ZNF219, PTER, PLA2G5, ETNPPL, PLCD3, S1PR3, and S1PR3. The genes ATP5H, CCL3, COX7A1, CXCL9, NMB, NRL, PRDM9, SLC19A1, SLC22A5, ZFX, and ZRSR2 were upregulated in the male samples.
Furthermore, a total of 49 significant DEGs were detected between female and male reindeer in prescapular tissue (S-F vs. S-M), of which 27 and 22 genes were upregulated and downregulated in S-F, respectively (Figure 3C, Table 2 and Table S6). GYS2, ARHGEF5, ABCC4, SUMO1, RPL39, SLC4A10, and ACSL6 are examples of upregulated genes in female samples, and genes such as TXLNG, DDX3Y, USP9X, EIF2S3X, PRDM9, KDM6A, ZRSR2, and UCP1 examples of downregulated genes.
The gene expression analysis of gender differences in adipose tissues indicated that genes associated with fatty acid metabolism and male sterility were upregulated in female and male reindeer, respectively. The upregulated genes associated with fatty acid metabolism in females include ELOVL7 and FABP6 in metacarpal, ABCG1, ACSL6, PLCD3, and PLA2G5 in perirenal and ACSL6 and PLA2R1 in prescapular tissue. This result is consistent with previous studies in humans and mice [39,40] that have suggested that females show higher levels of fat deposition than males. Interestingly, the upregulated genes in male reindeer revealed 10 shared genes among the three tissues, such as UBA1, TXLNG, PRDM9, EIF2S3X, NRL, DDX3Y, KDM6A, ZRSR2, USP9X, and ZFX. Six of these genes, PRDM9 [41,42], UBA1 [43], EIF2S3X [44,45], DDX3Y [46,47,48], ZRSR2 [49], and USP9X [50] have been shown to be associated with male sterility. In our recent study, as well as by others, PRDM9 has an important role in reindeer adaptation and survival in the subarctic regions [28]. PRDM9 is one of the rapidly evolving genes in reindeer and is involved in recombination events and epigenetic modifications [51]. Moreover, recent studies on mice and rats showed that PRDM9 has important roles in spermatogenesis and male fertility [41,52]. Similarly, other upregulated genes in male samples have diverse functions and may be linked to male infertility or spermatogenic failure (DDX3Y), mRNA splicing (ZRSR2), lipid metabolism (EIF2S3X), circadian rhythm (USP9X), cell cycle regulation (TXLNG), and photoreceptor development/function (NRL).
Moreover, it should be noted that the reindeer reference genome lacked gene annotations for the Y chromosome and that many of the Y chromosome-specific RNA-seq reads may have aligned to the paralog genes of the X chromosome.

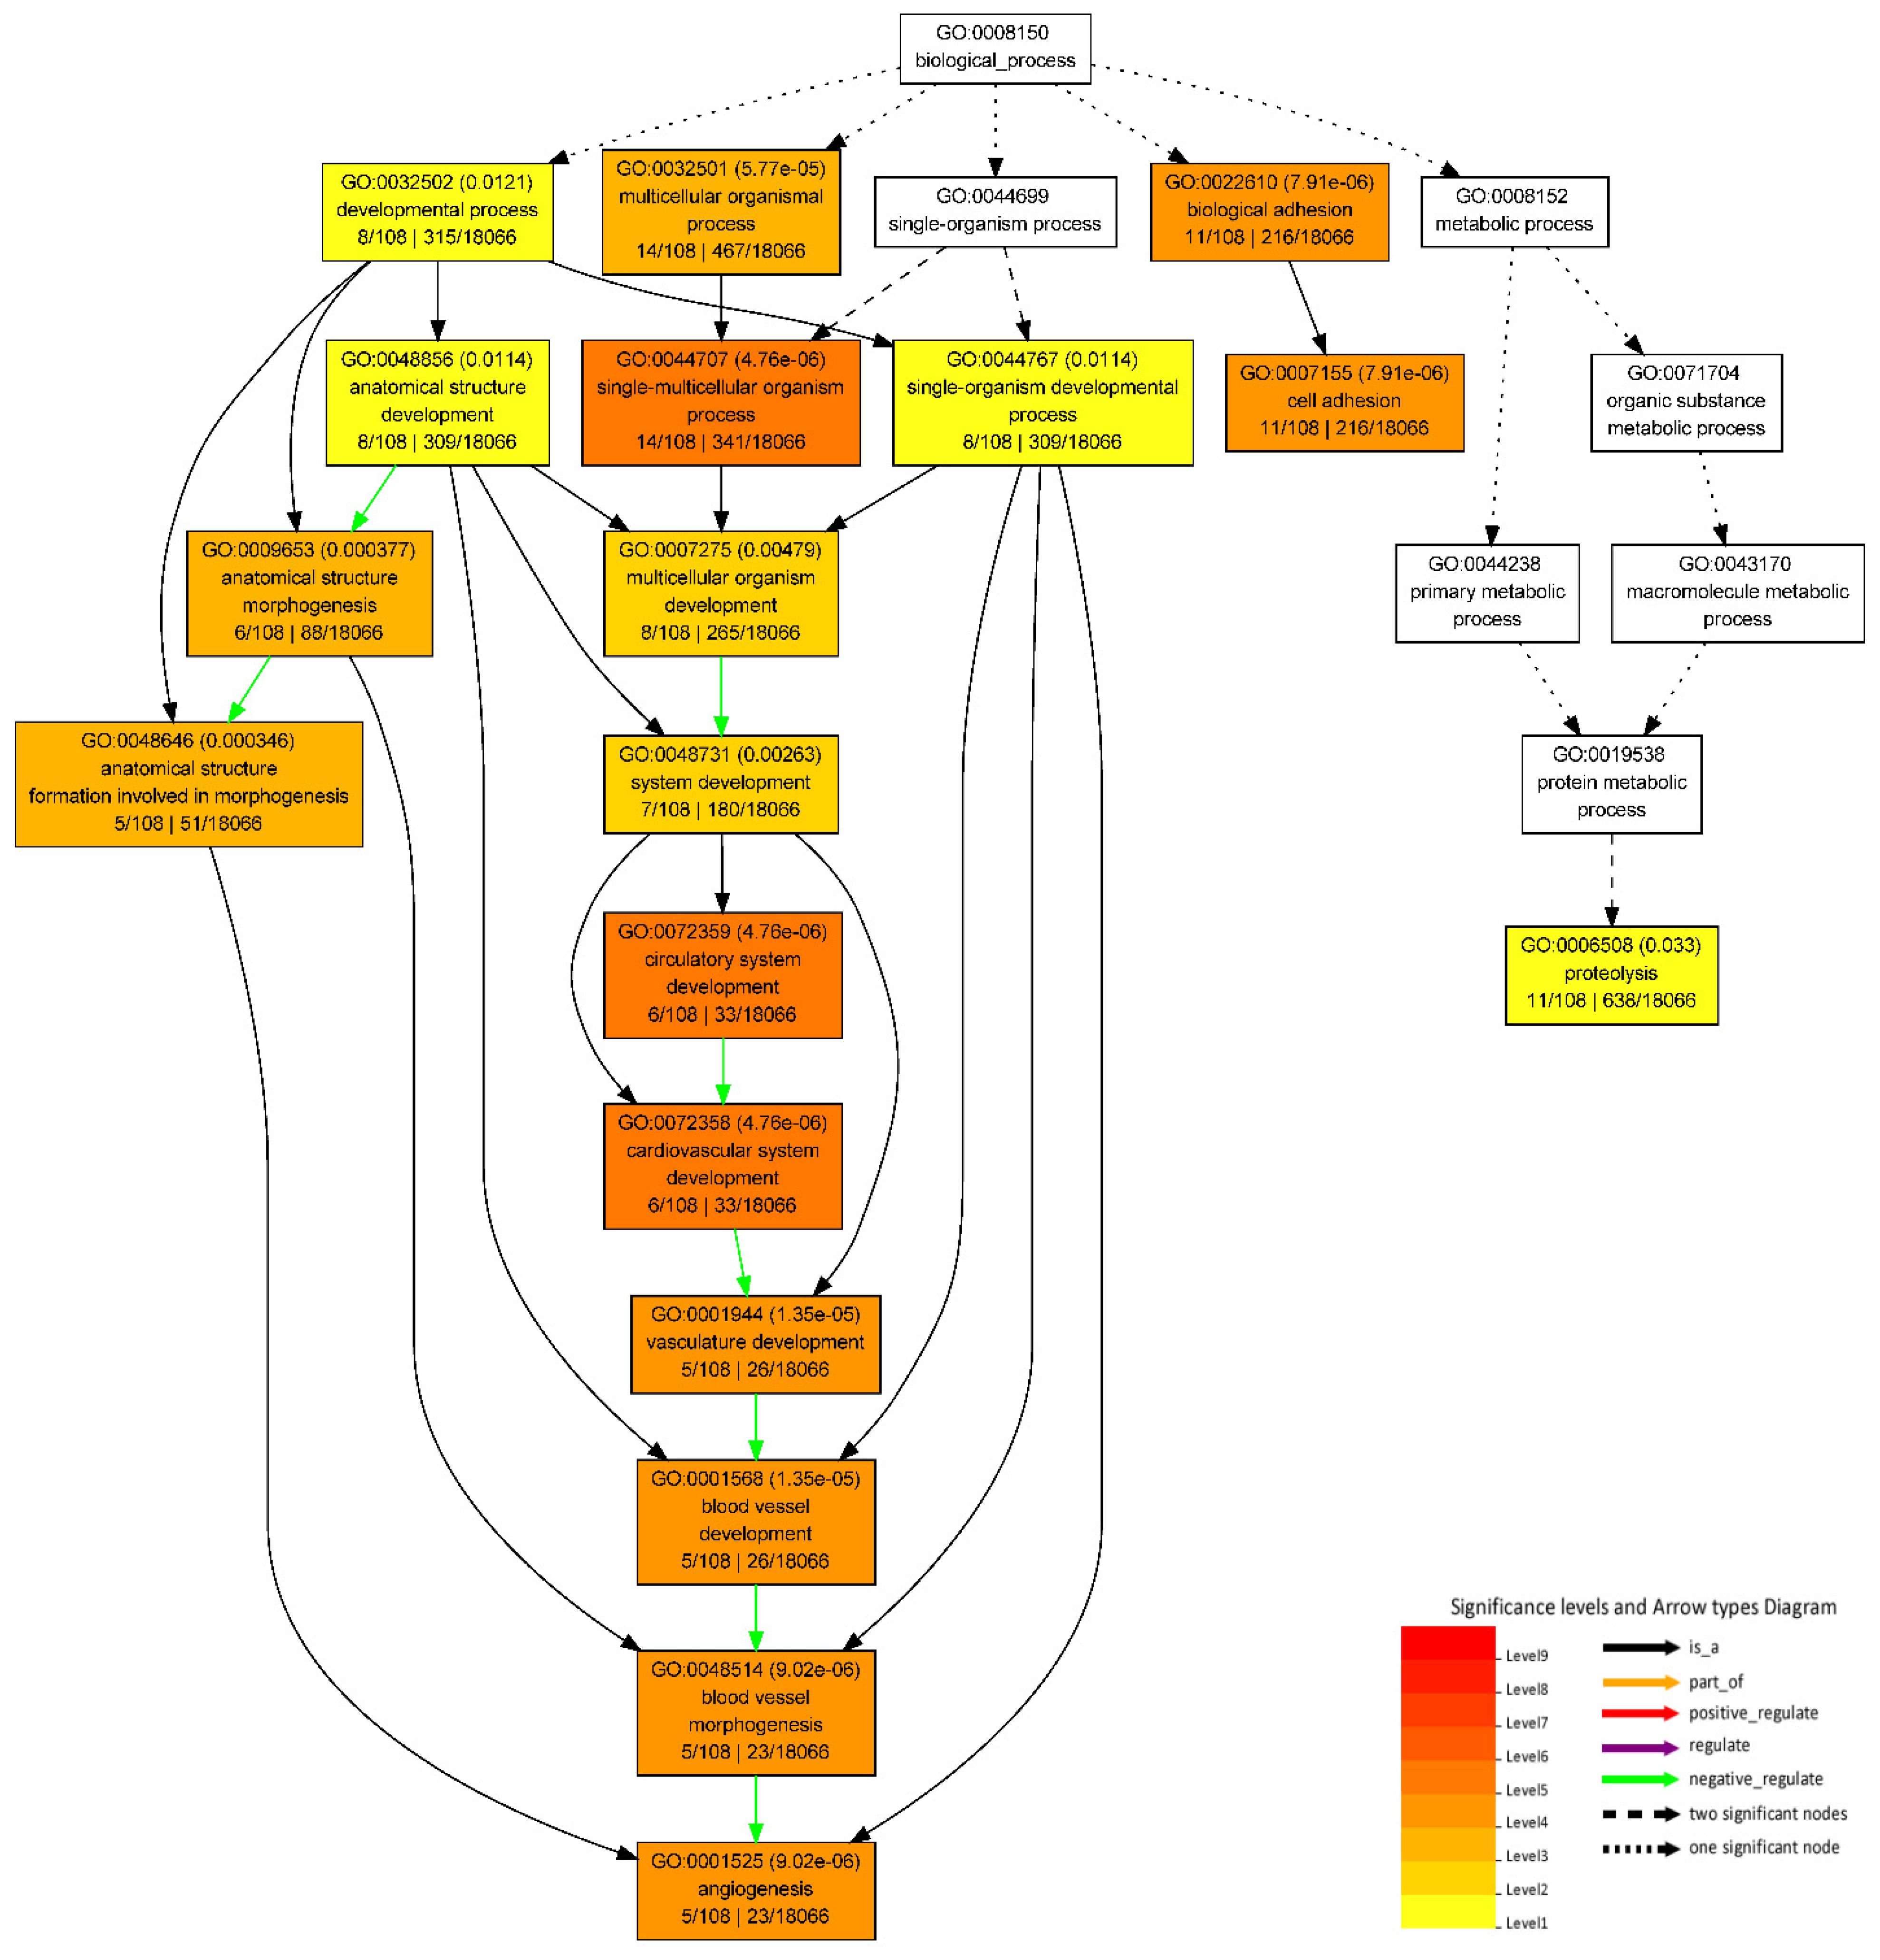
3.5. GO Enrichment Analyses

From the list of 225 significantly DEGs identified in the M-F vs. M-M comparison (Table S4), 59 genes did not have GO annotations. The GO analysis results of the upregulated genes in male metacarpal tissue (n = 108 with GO annotation) revealed 31 significantly enriched GO terms, whereas those upregulated in female samples (n = 58 with GO annotation) resulted only one GO term ‘Oxidoreductase activity, acting on paired donors, with incorporation or reduction of molecular oxygen’ (Table S7). The upregulated genes in males were significantly enriched in 18 biological processes, 10 molecular functions and 3 cellular component categories (Table S7). Out of the 18 biological processes, 9 GO terms were associated with developmental processes, such as ‘circulatory system development’, ‘cardiovascular system development’, ‘blood vessel development’, ‘vasculature development’, and ‘anatomical structure development’ (Figure 4). Moreover, the biological process GO terms, ‘cell adhesion’, ‘angiogenesis’, ‘blood vessel morphogenesis’, and ‘anatomical structure formation involved in morphogenesis’ were also significantly enriched in the upregulated DEGs in male metacarpal tissue.
From the list of 104 significant DEGs identified in the P-F vs. P-M comparison (Table S5), 15 lacked a GO annotation. The GO analysis result of the upregulated (n = 48 with GO annotation) DEGs in female perirenal tissue revealed six significantly represented cellular component categories, including “plasma membrane”, “cell periphery”, “plasma membrane part,” and “integral component of membrane” (Table S8). No significantly represented GO terms were associated with upregulated DEGs in male (n = 41 with GO annotations).
From the list of 49 significant DEGs identified in the S-F vs. S-M comparison (Table S6), seven genes lacked a GO annotation. The GO analysis result of the upregulated (n = 23 with GO annotation) and downregulated (n = 19 with GO annotation) DEGs in female prescapular tissue revealed three significant enriched molecular function categories and no significantly enriched GO terms, respectively. The significantly enriched GO terms in downregulated DEGs in female reindeer prescapular tissue included ‘cation binding’, ‘ion binding’ and ‘metal ion binding’, indicating their role in the acquisition of mineral nutrients: iron, zinc, and calcium.

3.6. KEGG Pathway Analyses

KEGG pathway analysis revealed no statistically significant enriched KEGG pathways between M-F and M-M. ‘Ribosome’ was the only KEGG pathway associated with DEGs from the perirenal and prescapular adipose tissues. Interestingly, in both tissues, the ‘ribosome’ pathway was downregulated in female reindeer.

4. Conclusions

In the present study, we have investigated male versus female differences in gene expressions in three adipose tissues in the Even reindeer population originating from Northern Sakha (Yakutia), which is one of the coldest geographic regions where reindeer herding has held a long tradition in people’s livelihoods. To the best of our knowledge, this is the first transcriptome study comparing gender differences in reindeer. In general, sex differences in adipose tissue transcriptomes have mainly been examined in humans and mice. One of the key observations made in the present study was that metacarpal adipose tissue displayed distinct gene expression profiles compared with the other two tissues. In addition, we found that the metacarpal tissue showed the highest number of gender-specific genes expressed only in the female and male samples. Among the list of DEGs, PRDM9 was specifically upregulated in all three adipose tissues of males, indicating its significant functional role in male fertility and the evolution of reindeer in general.

Supplementary Materials

The following supporting information can be downloaded at: https://www.mdpi.com/article/10.3390/genes13091645/s1, Table S1: Statistics of clean data; Table S2: STAR mapping statistics; Table S3: Summary of expressed genes in each tissue and gender (sheet 1), List of expressed genes in metacarpal adipose tissue in male reindeer (M-M) (sheet 2), List of expressed genes in metacarpal adipose tissue in female reindeer (M-F) (sheet 3), List of expressed genes in perirenal adipose tissue in male reindeer (P-M) (sheet 4), List of expressed genes in perirenal adipose tissue in female reindeer (P-F) (sheet 5), List of expressed genes in scapular adipose tissue in male reindeer (S-M) (sheet 6), List of expressed genes in scapular adipose tissue in female reindeer (S-F) (sheet 7); Table S4: List of significantly differentially expressed genes between (M-F vs. M-M); Table S5: List of significantly differentially expressed genes between (P-F vs. P-M); Table S6: List of significantly differentially expressed genes between (S-F vs. S-M); Table S7: List of significantly enriched GO terms associated with significantly downregulated DEGs in M-F vs. M-M; Table S8: List of significantly enriched GO terms associated with significantly upregulated DEGs in P-F vs. P-M.

Author Contributions

Conceptualization, J.K. and K.P.; methodology, M.W. and K.P.; software, M.W.; formal analysis, M.W.; data curation, M.W.; writing—original draft preparation, M.W.; writing—review and editing, M.W., K.P., J.K. and J.P.; visualization, M.W. and K.P.; supervision, J.K. and K.P.; funding acquisition, J.K. All authors have read and agreed to the published version of the manuscript.

Funding

This study was funded by the Academy of Finland in the Arctic Research Programme ARKTIKO (decision number 286040).

Institutional Review Board Statement

The study was conducted in accordance with the Declaration of Helsinki, and approved by the Russian authorization board (FS/UVN 03/163733/07.04.2016) and the Animal Experiment Board in Finland (ESAVI/7034/04.10.07.2015).

Informed Consent Statement

Not applicable.

Data Availability Statement

Raw sequence reads in compressed fastq format (fastq.gz) have been deposited to the European Nucleotide Archive (ENA) and are publicly available under accession PRJEB44094.

Acknowledgments

We acknowledge Innokentyi Ammosov and Tiina Reilas for excellent collaboration in collection of research materials and reindeer herders for providing reindeer for our research. We thank the CSC-IT Center for Science, Finland for computational resources and the Finnish Functional Genomics Centre supported by the University of Turku, and Åbo Akademi University, and Biocenter Finland for RNA extractions and RNA sequencing.

Conflicts of Interest

The authors declare no conflict of interest.

References

  1. Pond, C.M. An Evolutionary and Functional View of Mammalian Adipose Tissue. Proc. Nutr. Soc. 1992, 51, 367–377. [Google Scholar] [CrossRef] [PubMed]
  2. Kershaw, E.E.; Flier, J.S. Adipose Tissue as an Endocrine Organ. J. Clin. Endocrinol. Metab. 2004, 89, 2548–2556. [Google Scholar] [CrossRef] [PubMed]
  3. Ahima, R.S. Central Actions of Adipocyte Hormones. Trends Endocrinol. Metab. 2005, 16, 307–313. [Google Scholar] [CrossRef] [PubMed]
  4. Trzeciak-Ryczek, A.; Tokarz-Deptuła, B.; Niedźwiedzka-Rystwej, P.; Deptuła, W. Review PaperAdipose Tissue—Component of the Immune System. Cent. Eur. J. OfnbspImmunol. 2011, 36, 95–99. [Google Scholar]
  5. Palmer, B.F.; Clegg, D.J. The Sexual Dimorphism of Obesity. Mol. Cell. Endocrinol. 2015, 402, 113–119. [Google Scholar] [CrossRef]
  6. Chang, E.; Varghese, M.; Singer, K. Gender and Sex Differences in Adipose Tissue. Curr. Diabetes Rep. 2018, 18, 69. [Google Scholar] [CrossRef]
  7. Power, M.L.; Schulkin, J. Sex Differences in Fat Storage, Fat Metabolism, and the Health Risks from Obesity: Possible Evolutionary Origins. Br. J. Nutr. 2008, 99, 931–940. [Google Scholar] [CrossRef]
  8. Michaud, A.; Drolet, R.; Noël, S.; Paris, G.; Tchernof, A. Visceral Fat Accumulation Is an Indicator of Adipose Tissue Macrophage Infiltration in Women. Metab. Clin. Exp. 2012, 61, 689–698. [Google Scholar] [CrossRef]
  9. Fuente-Martín, E.; Argente-Arizón, P.; Ros, P.; Argente, J.; Chowen, J.A. Sex Differences in Adipose Tissue. Adipocyte 2013, 2, 128–134. [Google Scholar] [CrossRef]
  10. Fletcher, L.A.; Kim, K.; Leitner, B.P.; Cassimatis, T.M.; O’Mara, A.E.; Johnson, J.W.; Halprin, M.S.; McGehee, S.M.; Brychta, R.J.; Cypess, A.M.; et al. Sexual Dimorphisms in Adult Human Brown Adipose Tissue. Obesity 2020, 28, 241–246. [Google Scholar] [CrossRef]
  11. Le Magueresse-Battistoni, B. Adipose Tissue and Endocrine-Disrupting Chemicals: Does Sex Matter? Int. J. Environ. Res. Public. Health 2020, 17, 9403. [Google Scholar] [CrossRef]
  12. Karastergiou, K.; Smith, S.R.; Greenberg, A.S.; Fried, S.K. Sex Differences in Human Adipose Tissues—The Biology of Pear Shape. Biol. Sex Differ. 2012, 3, 13. [Google Scholar] [CrossRef]
  13. Mongraw-Chaffin, M.L.; Anderson, C.A.M.; Allison, M.A.; Ouyang, P.; Szklo, M.; Vaidya, D.; Woodward, M.; Golden, S.H. Association Between Sex Hormones and Adiposity: Qualitative Differences in Women and Men in the Multi-Ethnic Study of Atherosclerosis. J. Clin. Endocrinol. Metab. 2015, 100, E596–E600. [Google Scholar] [CrossRef] [PubMed]
  14. Ter Horst, K.W.; Gilijamse, P.W.; de Weijer, B.A.; Kilicarslan, M.; Ackermans, M.T.; Nederveen, A.J.; Nieuwdorp, M.; Romijn, J.A.; Serlie, M.J. Sexual Dimorphism in Hepatic, Adipose Tissue, and Peripheral Tissue Insulin Sensitivity in Obese Humans. Front. Endocrinol. 2015, 6, 182. [Google Scholar] [CrossRef] [PubMed]
  15. Yang, Y.; Xie, M.; Yuan, S.; Zeng, Y.; Dong, Y.; Wang, Z.; Xiao, Q.; Dong, B.; Ma, J.; Hu, J. Sex Differences in the Associations between Adiposity Distribution and Cardiometabolic Risk Factors in Overweight or Obese Individuals: A Cross-Sectional Study. BMC Public Health 2021, 21, 1232. [Google Scholar] [CrossRef] [PubMed]
  16. Chen, X.; McClusky, R.; Chen, J.; Beaven, S.W.; Tontonoz, P.; Arnold, A.P.; Reue, K. The Number of X Chromosomes Causes Sex Differences in Adiposity in Mice. PLoS Genet. 2012, 8, e1002709. [Google Scholar] [CrossRef]
  17. Anderson, W.D.; Soh, J.Y.; Innis, S.E.; Dimanche, A.; Ma, L.; Langefeld, C.D.; Comeau, M.E.; Das, S.K.; Schadt, E.E.; Björkegren, J.L.M.; et al. Sex Differences in Human Adipose Tissue Gene Expression and Genetic Regulation Involve Adipogenesis. Genome Res. 2020, 30, 1379–1392. [Google Scholar] [CrossRef]
  18. Iglesias, M.J.; Eiras, S.; Piñeiro, R.; López-Otero, D.; Gallego, R.; Fernández, A.L.; Lago, F.; González-Juanatey, J.R. Gender differences in adiponectin and leptin expression in epicardial and subcutaneous adipose tissue. Findings in patients undergoing cardiac surgery. Rev. Esp. Cardiol. 2006, 59, 1252–1260. [Google Scholar] [CrossRef]
  19. Viguerie, N.; Montastier, E.; Maoret, J.-J.; Roussel, B.; Combes, M.; Valle, C.; Villa-Vialaneix, N.; Iacovoni, J.S.; Martinez, J.A.; Holst, C.; et al. Determinants of Human Adipose Tissue Gene Expression: Impact of Diet, Sex, Metabolic Status, and Cis Genetic Regulation. PLoS Genet. 2012, 8, e1002959. [Google Scholar] [CrossRef]
  20. Nookaew, I.; Svensson, P.-A.; Jacobson, P.; Jernås, M.; Taube, M.; Larsson, I.; Andersson-Assarsson, J.C.; Sjöström, L.; Froguel, P.; Walley, A.; et al. Adipose Tissue Resting Energy Expenditure and Expression of Genes Involved in Mitochondrial Function Are Higher in Women than in Men. J. Clin. Endocrinol. Metab. 2013, 98, E370–E378. [Google Scholar] [CrossRef]
  21. Link, J.C.; Hasin-Brumshtein, Y.; Cantor, R.M.; Chen, X.; Arnold, A.P.; Lusis, A.J.; Reue, K. Diet, Gonadal Sex, and Sex Chromosome Complement Influence White Adipose Tissue MiRNA Expression. BMC Genom. 2017, 18, 89. [Google Scholar] [CrossRef] [PubMed] [Green Version]
  22. Bianconi, E.; Casadei, R.; Frabetti, F.; Ventura, C.; Facchin, F.; Canaider, S. Sex-Specific Transcriptome Differences in Human Adipose Mesenchymal Stem Cells. Genes 2020, 11, 909. [Google Scholar] [CrossRef] [PubMed]
  23. Kaikaew, K.; Grefhorst, A.; Steenbergen, J.; Swagemakers, S.M.A.; McLuskey, A.; Visser, J.A. Sex Difference in the Mouse BAT Transcriptome Reveals a Role of Progesterone. J. Mol. Endocrinol. 2021, 66, 97–113. [Google Scholar] [CrossRef] [PubMed]
  24. Rey, F.; Messa, L.; Pandini, C.; Maghraby, E.; Barzaghini, B.; Garofalo, M.; Micheletto, G.; Raimondi, M.T.; Bertoli, S.; Cereda, C.; et al. RNA-Seq Characterization of Sex-Differences in Adipose Tissue of Obesity Affected Patients: Computational Analysis of Differentially Expressed Coding and Non-Coding RNAs. J. Pers. Med. 2021, 11, 352. [Google Scholar] [CrossRef] [PubMed]
  25. Weldenegodguad, M.; Pokharel, K.; Niiranen, L.; Soppela, P.; Ammosov, I.; Honkatukia, M.; Lindeberg, H.; Peippo, J.; Reilas, T.; Mazzullo, N.; et al. Adipose Gene Expression Profiles Reveal Insights into the Adaptation of Northern Eurasian Semi-Domestic Reindeer (Rangifer tarandus). Commun. Biol. 2021, 4, 1170. [Google Scholar] [CrossRef]
  26. Andrews, S. FASTQC. A Quality Control Tool for High Throughput Sequence Data. Available online: https://github.com/s-andrews/FastQC (accessed on 18 September 2020).
  27. Ewels, P.; Magnusson, M.; Lundin, S.; Käller, M. MultiQC: Summarize Analysis Results for Multiple Tools and Samples in a Single Report. Bioinformatics 2016, 32, 3047–3048. [Google Scholar] [CrossRef] [PubMed]
  28. Weldenegodguad, M.; Pokharel, K.; Ming, Y.; Honkatukia, M.; Peippo, J.; Reilas, T.; Røed, K.H.; Kantanen, J. Genome Sequence and Comparative Analysis of Reindeer (Rangifer tarandus) in Northern Eurasia. Sci. Rep. 2020, 10, 8980. [Google Scholar] [CrossRef]
  29. Dobin, A.; Davis, C.A.; Schlesinger, F.; Drenkow, J.; Zaleski, C.; Jha, S.; Batut, P.; Chaisson, M.; Gingeras, T.R. STAR: Ultrafast Universal RNA-Seq Aligner. Bioinformatics 2013, 29, 15–21. [Google Scholar] [CrossRef]
  30. Liao, Y.; Smyth, G.K.; Shi, W. FeatureCounts: An Efficient General Purpose Program for Assigning Sequence Reads to Genomic Features. Bioinformatics 2014, 30, 923–930. [Google Scholar] [CrossRef]
  31. Robinson, M.D.; McCarthy, D.J.; Smyth, G.K. EdgeR: A Bioconductor Package for Differential Expression Analysis of Digital Gene Expression Data. Bioinformatics 2010, 26, 139–140. [Google Scholar] [CrossRef]
  32. Zhou, Y.; Sun, J.; Li, C.; Wang, Y.; Li, L.; Cai, H.; Lan, X.; Lei, C.; Zhao, X.; Chen, H. Characterization of Transcriptional Complexity during Adipose Tissue Development in Bovines of Different Ages and Sexes. PLoS ONE 2014, 9, e101261. [Google Scholar] [CrossRef] [PubMed]
  33. Love, M.I.; Huber, W.; Anders, S. Moderated Estimation of Fold Change and Dispersion for RNA-Seq Data with DESeq2. Genome Biol. 2014, 15, 550. [Google Scholar] [CrossRef] [PubMed]
  34. Tian, T.; Liu, Y.; Yan, H.; You, Q.; Yi, X.; Du, Z.; Xu, W.; Su, Z. AgriGO v2.0: A GO Analysis Toolkit for the Agricultural Community, 2017 Update. Nucleic Acids Res. 2017, 45, W122–W129. [Google Scholar] [CrossRef] [PubMed]
  35. Luo, W.; Friedman, M.S.; Shedden, K.; Hankenson, K.D.; Woolf, P.J. GAGE: Generally Applicable Gene Set Enrichment for Pathway Analysis. BMC Bioinform. 2009, 10, 161. [Google Scholar] [CrossRef] [PubMed]
  36. Pokharel, K.; Peippo, J.; Honkatukia, M.; Seppälä, A.; Rautiainen, J.; Ghanem, N.; Hamama, T.-M.; Crowe, M.A.; Andersson, M.; Li, M.-H.; et al. Integrated Ovarian MRNA and MiRNA Transcriptome Profiling Characterizes the Genetic Basis of Prolificacy Traits in Sheep (Ovis aries). BMC Genom. 2018, 19, 104. [Google Scholar] [CrossRef]
  37. Pelletier, M.; Kotiaho, A.; Niinimäki, S.; Salmi, A.-K. Identifying Early Stages of Reindeer Domestication in the Archaeological Record: A 3D Morphological Investigation on Forelimb Bones of Modern Populations from Fennoscandia. Archaeol. Anthropol. Sci. 2020, 12, 169. [Google Scholar] [CrossRef]
  38. Mizuno, M.; Kuboki, Y. Osteoblast-Related Gene Expression of Bone Marrow Cells during the Osteoblastic Differentiation Induced by Type I Collagen. J. Biochem. 2001, 129, 133–138. [Google Scholar] [CrossRef]
  39. Lee, M.-J.; Fried, S.K. Sex-Dependent Depot Differences in Adipose Tissue Development and Function; Role of Sex Steroids. J. Obes. Metab. Syndr. 2017, 26, 172–180. [Google Scholar] [CrossRef]
  40. Valencak, T.G.; Osterrieder, A.; Schulz, T.J. Sex Matters: The Effects of Biological Sex on Adipose Tissue Biology and Energy Metabolism. Redox Biol. 2017, 12, 806–813. [Google Scholar] [CrossRef]
  41. Mukaj, A.; Piálek, J.; Fotopulosova, V.; Morgan, A.P.; Odenthal-Hesse, L.; Parvanov, E.D.; Forejt, J. Prdm9 Intersubspecific Interactions in Hybrid Male Sterility of House Mouse. Mol. Biol. Evol. 2020, 37, 3423–3438. [Google Scholar] [CrossRef]
  42. Davies, B.; Hatton, E.; Altemose, N.; Hussin, J.G.; Pratto, F.; Zhang, G.; Hinch, A.G.; Moralli, D.; Biggs, D.; Diaz, R.; et al. Re-Engineering the Zinc Fingers of PRDM9 Reverses Hybrid Sterility in Mice. Nature 2016, 530, 171–176. [Google Scholar] [CrossRef] [Green Version]
  43. Kulkarni, M.; Smith, H.E. E1 Ubiquitin-Activating Enzyme UBA-1 Plays Multiple Roles throughout C. Elegans Development. PLoS Genet. 2008, 4, e1000131. [Google Scholar] [CrossRef] [PubMed]
  44. Yamauchi, Y.; Riel, J.M.; Stoytcheva, Z.; Ward, M.A. Two Y Genes Can Replace the Entire Y Chromosome for Assisted Reproduction in the Mouse. Science 2014, 343, 1242544. [Google Scholar] [CrossRef]
  45. Ruthig, V.A.; Nielsen, T.; Riel, J.M.; Yamauchi, Y.; Ortega, E.A.; Salvador, Q.; Ward, M.A. Testicular Abnormalities in Mice with Y Chromosome Deficiencies. Biol. Reprod. 2017, 96, 694–706. [Google Scholar] [CrossRef] [PubMed]
  46. Lardone, M.C.; Parodi, D.A.; Valdevenito, R.; Ebensperger, M.; Piottante, A.; Madariaga, M.; Smith, R.; Pommer, R.; Zambrano, N.; Castro, A. Quantification of DDX3Y, RBMY1, DAZ and TSPY MRNAs in Testes of Patients with Severe Impairment of Spermatogenesis. Mol. Hum. Reprod. 2007, 13, 705–712. [Google Scholar] [CrossRef] [PubMed]
  47. Ramathal, C.; Angulo, B.; Sukhwani, M.; Cui, J.; Durruthy-Durruthy, J.; Fang, F.; Schanes, P.; Turek, P.J.; Orwig, K.E.; Reijo Pera, R. DDX3Y Gene Rescue of a Y Chromosome AZFa Deletion Restores Germ Cell Formation and Transcriptional Programs. Sci. Rep. 2015, 5, 15041. [Google Scholar] [CrossRef]
  48. Matsumura, T.; Endo, T.; Isotani, A.; Ogawa, M.; Ikawa, M. An Azoospermic Factor Gene, Ddx3y and Its Paralog, Ddx3x Are Dispensable in Germ Cells for Male Fertility. J. Reprod. Dev. 2019, 65, 121–128. [Google Scholar] [CrossRef]
  49. Luo, M.; Peng, D. ANGPTL8: An Important Regulator in Metabolic Disorders. Front. Endocrinol. 2018, 9, 169. [Google Scholar] [CrossRef]
  50. Kishi, K.; Uchida, A.; Takase, H.M.; Suzuki, H.; Kurohmaru, M.; Tsunekawa, N.; Kanai-Azuma, M.; Wood, S.A.; Kanai, Y. Spermatogonial Deubiquitinase USP9X Is Essential for Proper Spermatogenesis in Mice. Reproduction 2017, 154, 135–143. [Google Scholar] [CrossRef]
  51. Grey, C.; Baudat, F.; de Massy, B. PRDM9, a Driver of the Genetic Map. PLoS Genet. 2018, 14, e1007479. [Google Scholar] [CrossRef]
  52. Mihola, O.; Landa, V.; Pratto, F.; Brick, K.; Kobets, T.; Kusari, F.; Gasic, S.; Smagulova, F.; Grey, C.; Flachs, P.; et al. Rat PRDM9 Shapes Recombination Landscapes, Duration of Meiosis, Gametogenesis, and Age of Fertility. BMC Biol. 2021, 19, 86. [Google Scholar] [CrossRef] [PubMed]
Figure 1. Sample relatedness. (A) Venn diagram showing overlap of expressed genes (CPM ≥ 0.5 for at least two samples) among the tissues in male (a) and female (b) reindeer. (B) PCA plots of the analysed samples based on expression profiles.
Genes 13 01645 g001
Figure 2. Distribution of uniquely expressed genes in each adipose tissue in male and female reindeer. (a) Shared and uniquely expressed genes in the metacarpal adipose tissue of male (M-M) and female (M-F) samples, (b) shared and uniquely expressed genes in the perirenal tissue of male (P-M) and female (P-F) samples, and (c) shared and uniquely expressed genes in the scapular tissue of male (S-M) and female (S-F) samples.
Genes 13 01645 g002
Figure 3. Volcano plot of genes that were expressed in the (A) metacarpal adipose tissue, (B) perirenal adipose tissue, and (C) prescapular adipose tissue. Significantly differentially expressed genes are marked with their gene names. For the complete list of differentially expressed genes, please see Tables S4–S6. In figure, NS = non-significant; LFC = absolute Log2 fold change greater than 2; padj = adjusted p value less than 0.001; and padj and LFC represent genes that fulfil the criteria of threshold for LFC and padj.
Genes 13 01645 g003
Figure 4. GO hierarchical graph of 18 biological processes associated with upregulated genes in the metacarpal adipose tissue of male samples.
Genes 13 01645 g004
Table 1. Summary of adipose tissue samples.
MaleFemale
Metacarpal33
Perirenal33
Prescapular33
Table 2. Summary of the DEGs from male (-M) and female (-F) comparisons in metacarpal (M), perirenal (P) and prescapular (S) adipose tissues of Even (E) reindeer.
ComparisonTotalUpregulatedDownregulated
M-F vs. M-M22578147
P-F vs. P-M 1045450
S-F vs. S-M492722
Publisher’s Note: MDPI stays neutral with regard to jurisdictional claims in published maps and institutional affiliations.

