
Multinomial Convolutions for Joint Modeling of Regulatory Motifs and Sequence Activity Readouts

 , and
, and 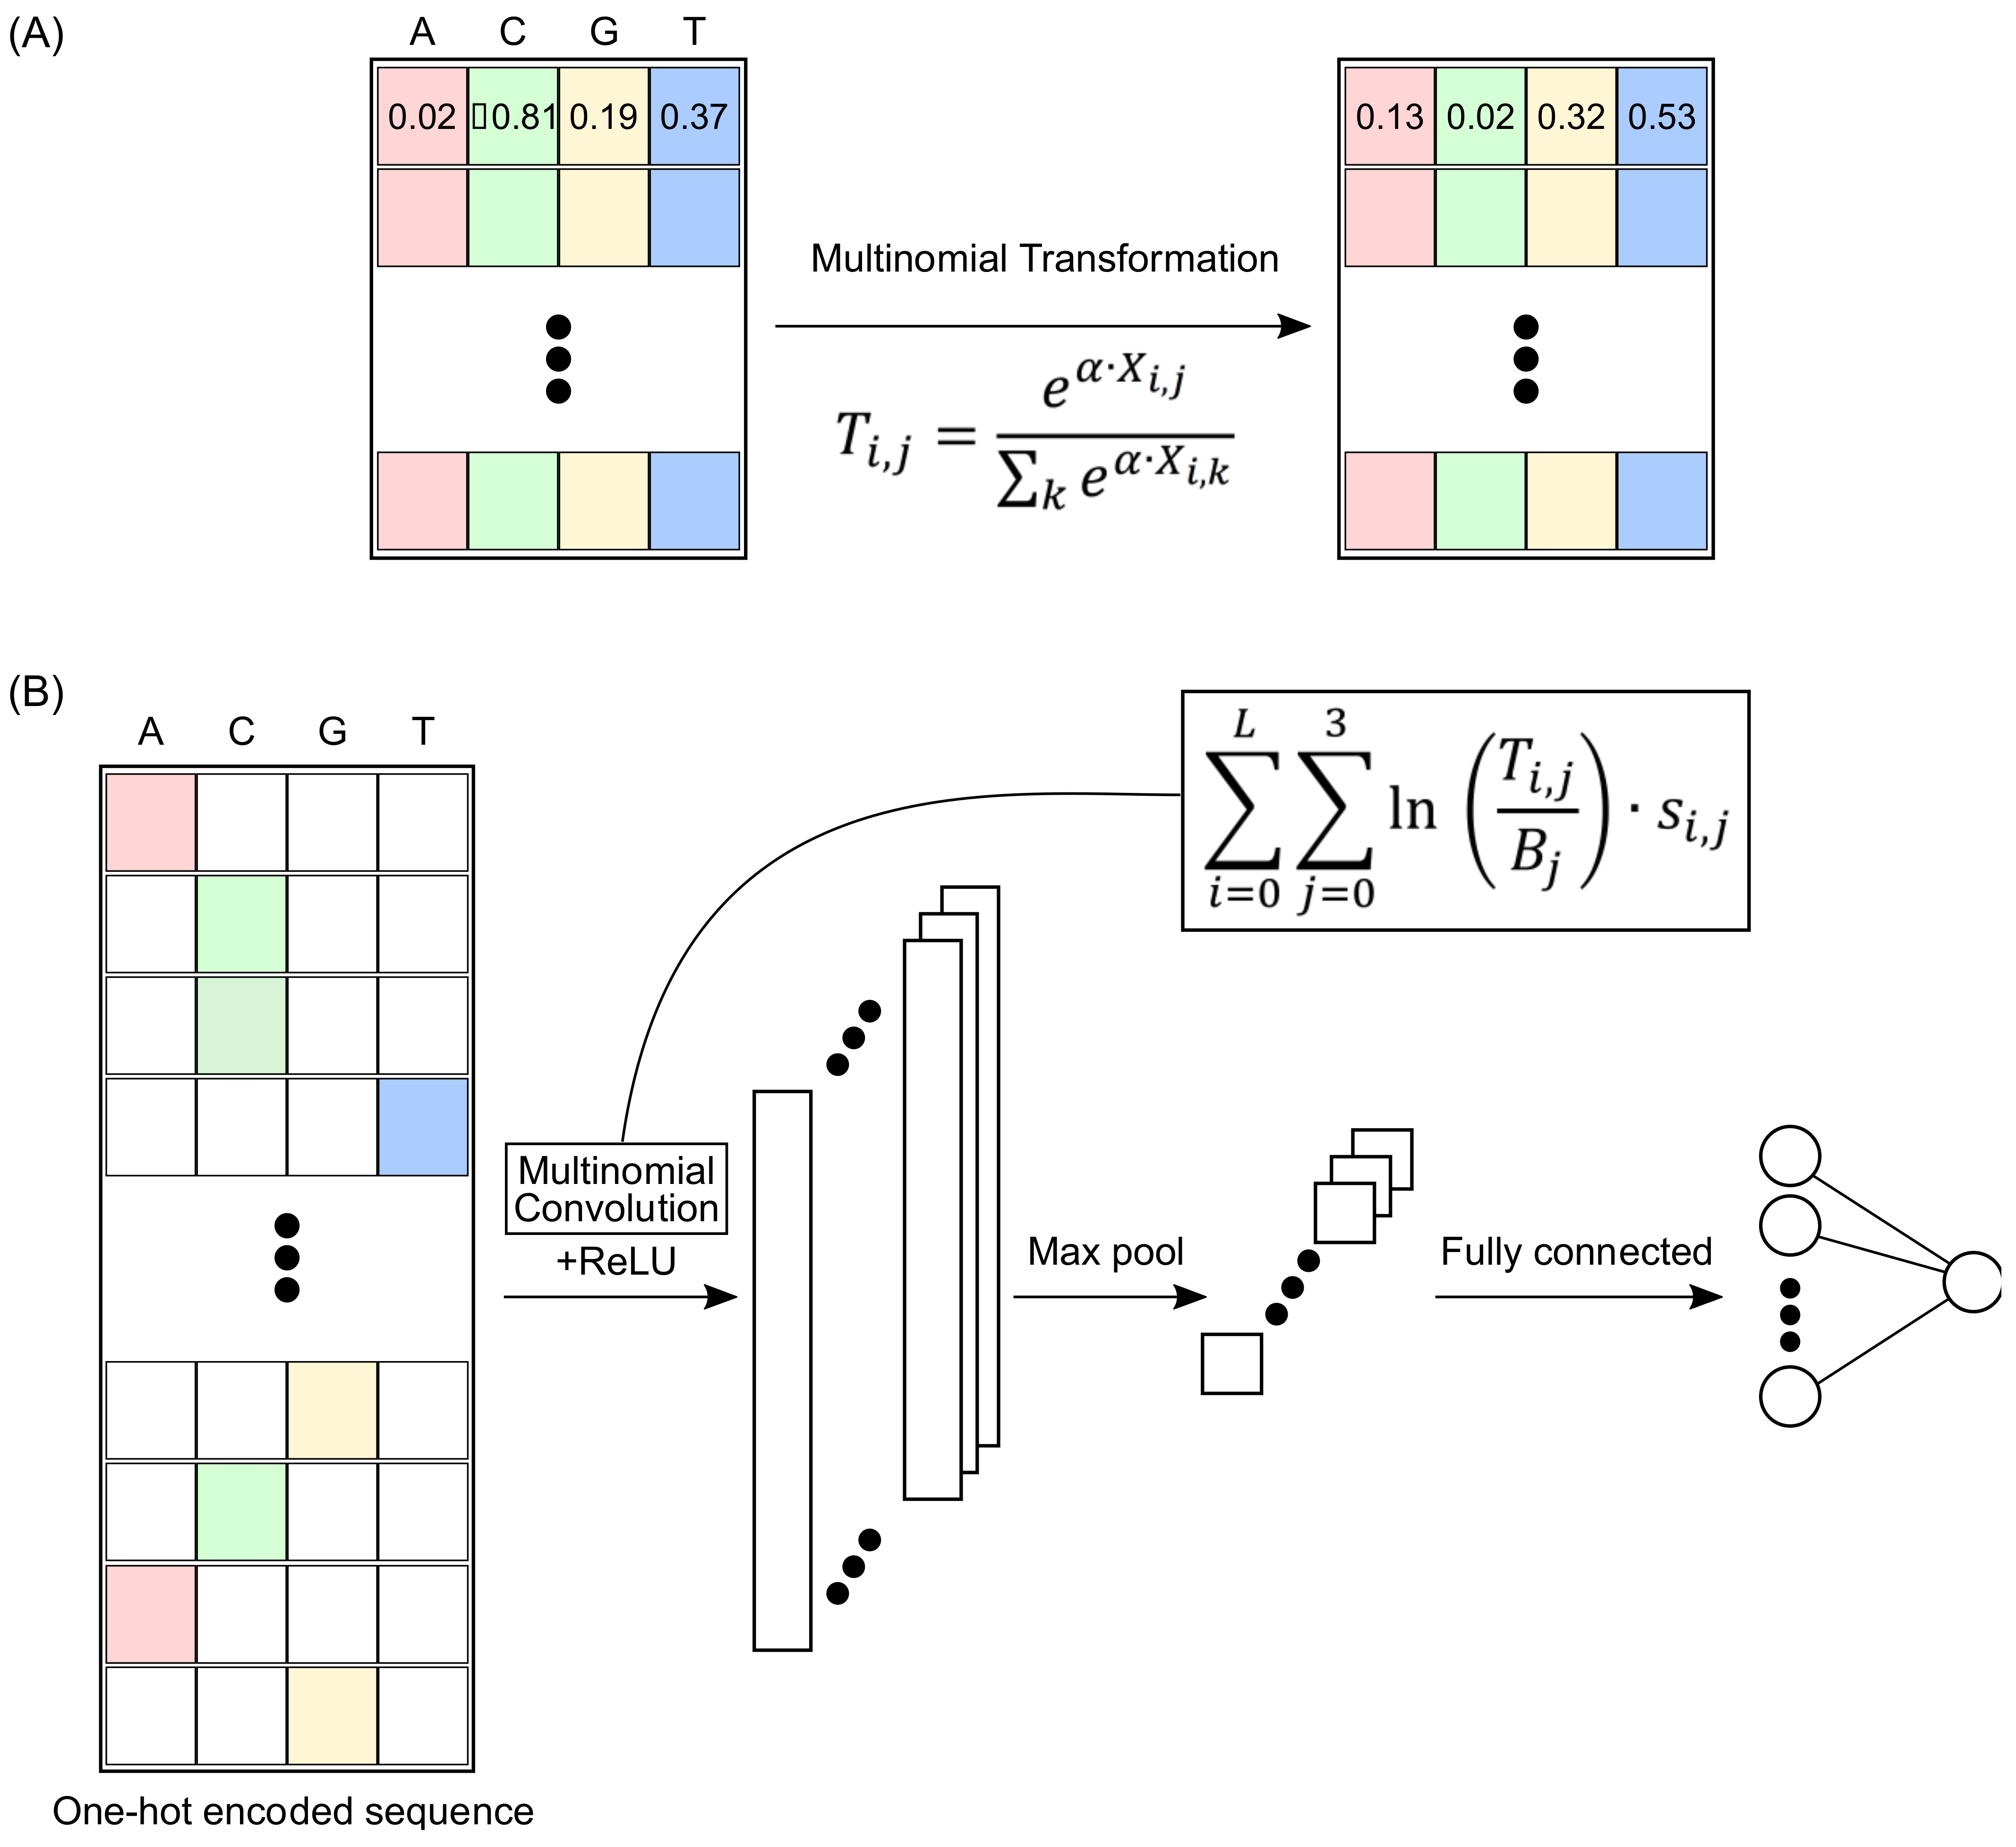
Abstract
:1. Introduction
2. Results
2.1. Multinomial Convolutions
2.2. MuSeAM: A CNN Implementing Multinomial Convolutions
2.3. Application of MuSeAM on Human Liver Enhancer MPRA Data
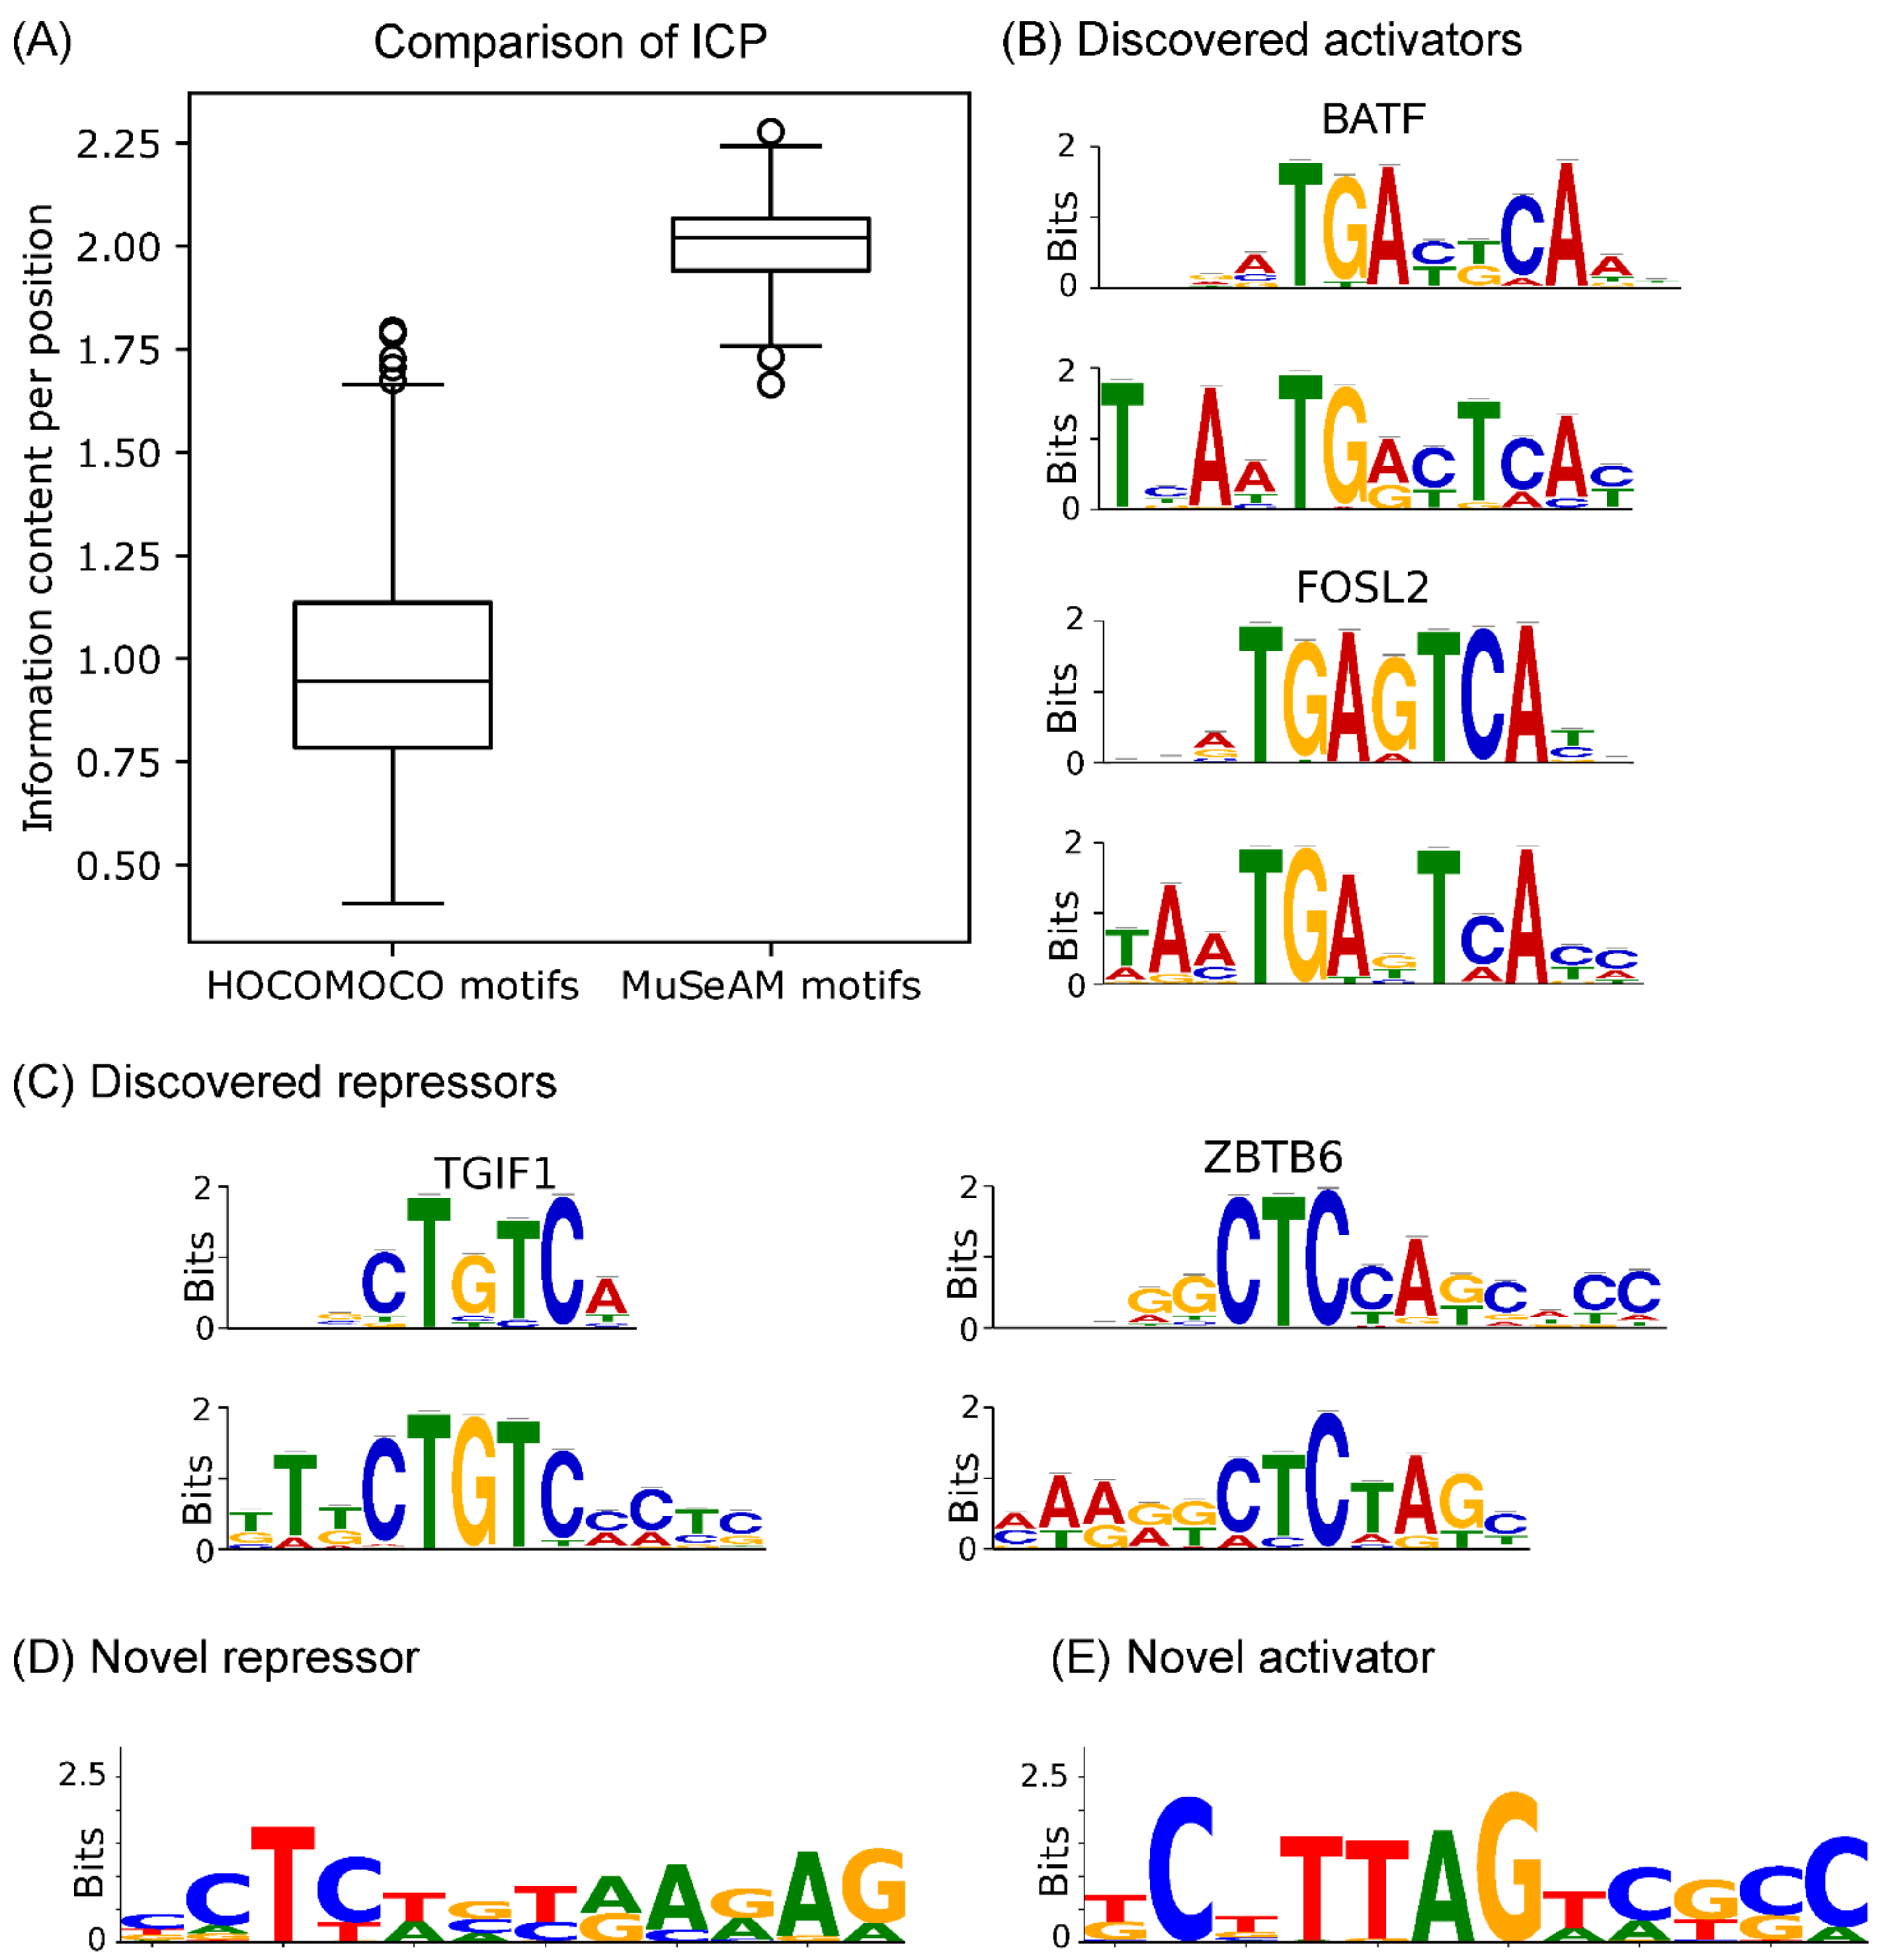
2.4. Multinomial Convolutions in MuSeAM Reveal Regulatory TFs in Human Liver
3. Discussion
4. Methods
4.1. MPRA Data
4.2. Motif Databases and Motif Searching
4.3. RNA-seq Data
4.4. MuSeAM: A Multinomial Convolutional Neural Network Model
- Input Layer
- Convolution Layer
- Output Layer
4.5. Optimization and Model Selection
- Loss Function
- Model Optimization
- Model Selection
4.6. Comparing Information Content per Position
4.7. Alternative Architectures for MuSeAM and Conventional CNN
- MuSeAM
- Number of filters from 64 to 1024;
- Filter lengths from 5 to 16;
- One and two fully connected layers;
- α values from 100 to 140;
- Batch sizes from 32 to 512;
- Regularization factors from 0.0005 to 0.01;
- Dropout rates from 0.001 to 0.6;
- Activation functions from ReLU, sigmoid, and tanh;
- Pooling approaches from max, sum, and average;
- Early stopping.
- Conventional CNN
- Convolution layers from 1 to 5;
- Number of filters from 64 to 1024;
- Filter lengths from 5 to 16;
- One and two fully connected layers;
- Batch Sizes from 32 to 512;
- Regularization factors from 0.0005 to 0.01;
- Dropout rates from 0.1 to 0.6;
- Activation functions from ReLU, ELU, sigmoid, and tanh;
- Pooling approaches from max, sum, and average;
- Early stopping.
4.8. Optimal Hyperparameters
Supplementary Materials
Author Contributions
Funding
Institutional Review Board Statement
Informed Consent Statement
Data Availability Statement
Conflicts of Interest
References
- Alipanahi, B.; Delong, A.; Weirauch, M.T.; Frey, B.J. Predicting the sequence specificities of DNA- and RNA-binding proteins by deep learning. Nat. Biotechnol. 2015, 33, 831–838. [Google Scholar] [CrossRef] [PubMed]
- Zhou, J.; Troyanskaya, O.G. Predicting effects of noncoding variants with deep learning–based sequence model. Nat. Methods 2015, 12, 931–934. [Google Scholar] [CrossRef] [PubMed]
- Liu, G.; Zeng, H.; Gifford, D.K. Visualizing complex feature interactions and feature sharing in genomic deep neural networks. BMC Bioinform. 2019, 20. 401. [Google Scholar] [CrossRef]
- Rodríguez-Pérez, R.; Bajorath, J. Interpretation of machine learning models using shapley values: Application to compound potency and multi-target activity predictions. J. Comput. Mol. Des. 2020, 34, 1013–1026. [Google Scholar] [CrossRef]
- Shrikumar, A.; Katherine, T.; Žiga, A.; Anna, S.; Abhimanyu, B.; Mahfuza, S.; Surag, N.; Anshul, K. Technical Note on Transcription Factor Motif Discovery from Importance Scores (TF-MoDISco) Version 0.5.6.5. arXiv 2018, arXiv:1811.00416. Available online: http://arxiv.org/abs/1811.00416 (accessed on 1 July 2021).
- Lundberg, S.M.; Lee, S.I. A Unified Approach to Interpreting Model Predictions. Adv. Neural Inf. Process. Syst. 2017. Available online: https://proceedings.neurips.cc/paper/2017/hash/8a20a8621978632d76c43dfd28b67767-Abstract.html (accessed on 1 July 2021).
- Avsec, Ž.; Weilert, M.; Shrikumar, A.; Krueger, S.; Alexandari, A.; Dalal, K.; Zeitlinger, J. Base-resolution models of transcription-factor binding reveal soft motif syntax. Nat. Genet. 2021, 53, 354–366. [Google Scholar] [CrossRef] [PubMed]
- Murdoch, W.J.; Chandan, S.; Karl, K.; Reza, A.-A.; Bin, Y. Definitions, Methods, and Applications in Interpretable Machine Learning. Proc. Natl. Acad. Sci. USA 2019, 116, 22071–22080. [Google Scholar] [CrossRef]
- Lander, E.S.; Linton, L.M.; Birren, B.; Nusbaum, C.; Zody, M.C.; Baldwin, J.; Devon, K.; Dewar, K.; Doyle, M.; FitzHugh, W.; et al. Initial sequencing and analysis of the human genome. Nature 2001, 409, 860–921, Correction in Nature 2001, 412, 565–566; Erratum in Nature 2001, 7, 720. [Google Scholar] [CrossRef]
- Shrikumar, A.; Peyton, G.; Anshul, K. Learning Important Features Through Propagating Activation Differences. In Proceedings of the 34th International Conference on Machine Learning, Sydney, Australia, 6–11 August 2017; PMLR: Brooklin, MA, USA; pp. 3145–3153. [Google Scholar]
- Inoue, F.; Ahituv, N. Decoding enhancers using massively parallel reporter assays. Genomics 2015, 106, 159–164. [Google Scholar] [CrossRef]
- Inoue, F.; Kircher, M.; Martin, B.; Cooper, G.M.; Witten, D.M.; McManus, M.T.; Ahituv, N.; Shendure, J. A systematic comparison reveals substantial differences in chromosomal versus episomal encoding of enhancer activity. Genome Res. 2017, 27, 38–52. [Google Scholar] [CrossRef]
- Kulakovskiy, I.V.; Vorontsov, I.E.; Yevshin, I.S.; Sharipov, R.N.; Fedorova, A.D.; Rumynskiy, E.I.; Makeev, V.J. HOCOMOCO: Towards a Complete Collection of Transcription Factor Binding Models for Human and Mouse via Large-Scale ChIP-Seq Analysis. Nucleic Acids Res. 2018, 46, D252–D259. [Google Scholar] [CrossRef] [PubMed]
- Fornes, O.; Castro-Mondragon, J.A.; Khan, A.; Van Der Lee, R.; Zhang, X.; Richmond, P.A.; Modi, B.P.; Correard, S.; Gheorghe, M.; Baranašić, D.; et al. JASPAR 2020: Update of the open-access database of transcription factor binding profiles. Nucleic Acids Res. 2020, 48, D87–D92. [Google Scholar] [CrossRef] [PubMed]
- Ernst, J.; Melnikov, A.; Zhang, X.; Wang, L.; Rogov, P.L.; Mikkelsen, T.S.; Kellis, A.M.X.Z.L.W.P.R.T.S.M.M. Genome-scale high-resolution mapping of activating and repressive nucleotides in regulatory regions. Nat. Biotechnol. 2016, 34, 1180–1190. [Google Scholar] [CrossRef]
- Savic, D.; Roberts, B.S.; Carleton, J.B.; Partridge, E.C.; White, M.A.; Cohen, B.A.; Cooper, G.M.; Gertz, J.; Myers, R.M. Promoter-distal RNA polymerase II binding discriminates active from inactive CCAAT/enhancer-binding protein beta binding sites. Genome Res. 2015, 25, 1791–1800. [Google Scholar] [CrossRef]
- Gustems, M.; Woellmer, A.; Rothbauer, U.; Eck, S.H.; Wieland, T.; Lutter, D.; Hammerschmidt, W. c-Jun/c-Fos heterodimers regulate cellular genes via a newly identified class of methylated DNA sequence motifs. Nucleic Acids Res. 2013, 42, 3059–3072. [Google Scholar] [CrossRef] [PubMed]
- Pham, D.; Moseley, C.E.; Gao, M.; Savic, D.; Winstead, C.J.; Sun, M.; Kee, B.L.; Myers, R.M.; Weaver, C.T.; Hatton, R.D. Batf Pioneers the Reorganization of Chromatin in Developing Effector T Cells via Ets1-Dependent Recruitment of Ctcf. Cell Rep. 2019, 29, 1203–1220.e7. [Google Scholar] [CrossRef]
- Chandra, S.; Srinivasan, S.; Batra, J. Hepatocyte nuclear factor 1 beta: A perspective in cancer. Cancer Med. 2021, 10, 1791–1804. [Google Scholar] [CrossRef]
- Wang, X.; Hassan, W.; Zhao, J.; Bakht, S.; Nie, Y.; Wang, Y.; Pang, Q.; Huang, Z. The impact of hepatocyte nuclear factor-1α on liver malignancies and cell stemness with metabolic consequences. Stem Cell Res. Ther. 2019, 10. 663. [Google Scholar] [CrossRef]
- Xu, W.; Angelis, K.; Danielpour, D.; Haddad, M.M.; Bischof, O.; Campisi, J.; Stavnezer, E.; Medrano, E.E. Ski acts as a co-repressor with Smad2 and Smad3 to regulate the response to type β transforming growth factor. Proc. Natl. Acad. Sci. USA 2000, 97, 5924–5929. [Google Scholar] [CrossRef]
- Wotton, D.; Lo, R.S.; Lee, S.; Massagué, J. A Smad Transcriptional Corepressor. Cell 1999, 97, 29–39. [Google Scholar] [CrossRef]
- Lopes, J.E.; Torgerson, T.R.; Schubert, L.A.; Anover, S.D.; Ocheltree, E.L.; Ochs, H.D.; Ziegler, S.F. Analysis of FOXP3 Reveals Multiple Domains Required for Its Function as a Transcriptional Repressor. J. Immunol. 2006, 177, 3133–3142. [Google Scholar] [CrossRef] [PubMed] [Green Version]
- Shang, Y.; Coppo, M.; He, T.; Ning, F.; Yu, L.; Kang, L.; Zhang, B.; Ju, C.; Qiao, Y.; Zhao, B.; et al. The transcriptional repressor Hes1 attenuates inflammation by regulating transcription elongation. Nat. Immunol. 2016, 17, 930–937. [Google Scholar] [CrossRef]
- Gaudet, P.; Livstone, M.S.; Lewis, S.E.; Thomas, P.D. Phylogenetic-based propagation of functional annotations within the Gene Ontology consortium. Brief. Bioinform. 2011, 12, 449–462. [Google Scholar] [CrossRef]
- Safran, M.; Naomi, R.; Michal, T.; Ruth, B.; Tsippi, I.S.; Dvir, D.; Simon, F.; Doron, L. The GeneCards Suite. In Practical Guide to Life Science Databases; Imad, A., Takeya, K., Eds.; Springer Nature Singapore: Singapore, 2021; pp. 27–56. [Google Scholar]
- Kelley, D.R.; Reshef, Y.A.; Bileschi, M.; Belanger, D.; McLean, C.Y.; Snoek, J. Sequential regulatory activity prediction across chromosomes with convolutional neural networks. Genome Res. 2018, 28, 739–750. [Google Scholar] [CrossRef] [PubMed]
- De Boer, C.G.; Vaishnav, E.D.; Sadeh, R.; Abeyta, E.L.; Friedman, N.; Regev, A. Deciphering eukaryotic gene-regulatory logic with 100 million random promoters. Nat. Biotechnol. 2019, 38, 56–65. [Google Scholar] [CrossRef]
- He, X.; Samee, A.H.; Blatti, C.; Sinha, S. Thermodynamics-Based Models of Transcriptional Regulation by Enhancers: The Roles of Synergistic Activation, Cooperative Binding and Short-Range Repression. PLOS Comput. Biol. 2010, 6, e1000935. [Google Scholar] [CrossRef]
- Ploenzke, M.S.; Irizarry, R.A. Interpretable Convolution Methods for Learning Genomic Sequence Motifs. BioRxiv 2018. [Google Scholar] [CrossRef]
- Koo, P.K.; Ploenzke, M. Improving representations of genomic sequence motifs in convolutional networks with exponential activations. Nat. Mach. Intell. 2021, 3, 258–266. [Google Scholar] [CrossRef]
- Bailey, T.L.; James, J.; Charles, E.G.; William, S.N. The MEME Suite. Nucleic Acids Res. 2015, 43, W39–W49. [Google Scholar] [CrossRef]
- ENCODE Project Consortium. An Integrated Encyclopedia of DNA Elements in the Human Genome. Nature 2012, 489, 57–74. [Google Scholar] [CrossRef] [Green Version]
- Abadi, M.; Ashish, A.; Paul, B.; Eugene, B.; Zhifeng, C.; Craig, C.; Greg, S.C. TensorFlow: Large-Scale Machine Learning on Heterogeneous Distributed Systems. arXiv 2016, arXiv:1603.04467. Available online: http://arxiv.org/abs/1603.04467 (accessed on 1 January 2020).


Publisher’s Note: MDPI stays neutral with regard to jurisdictional claims in published maps and institutional affiliations. |
© 2022 by the authors. Licensee MDPI, Basel, Switzerland. This article is an open access article distributed under the terms and conditions of the Creative Commons Attribution (CC BY) license (https://creativecommons.org/licenses/by/4.0/).
Share and Cite
Park, M.; Singh, S.; Khan, S.R.; Abrar, M.A.; Grisanti, F.; Rahman, M.S.; Samee, M.A.H. Multinomial Convolutions for Joint Modeling of Regulatory Motifs and Sequence Activity Readouts. Genes 2022, 13, 1614. https://doi.org/10.3390/genes13091614
Park M, Singh S, Khan SR, Abrar MA, Grisanti F, Rahman MS, Samee MAH. Multinomial Convolutions for Joint Modeling of Regulatory Motifs and Sequence Activity Readouts. Genes. 2022; 13(9):1614. https://doi.org/10.3390/genes13091614
Chicago/Turabian StylePark, Minjun, Salvi Singh, Samin Rahman Khan, Mohammed Abid Abrar, Francisco Grisanti, M. Sohel Rahman, and Md. Abul Hassan Samee. 2022. "Multinomial Convolutions for Joint Modeling of Regulatory Motifs and Sequence Activity Readouts" Genes 13, no. 9: 1614. https://doi.org/10.3390/genes13091614