Article

Molecular Dynamic Simulation Reveals Structure Differences in APOL1 Variants and Implication in Pathogenesis of Chronic Kidney Disease

1
The African Computational Genomics (TACG) Research Group, Medical Research Council/Uganda Virus Research Institute and London School of Hygiene & Tropical Medicine Uganda Research Unit, Entebbe 31405, Uganda
2
Department of Immunology and Molecular Biology, College of Health Sciences, Makerere University, Kampala 10101, Uganda
3
African Center of Excellence in Bioinformatics (ACE-B), University of Science, Technique and Technologies of Bamako (USTTB), Bamako 3206, Mali
4
Molecular Bio-Computation and Drug Design Laboratory, School of Health Sciences, University of KwaZulu-Natal, Durban 4041, South Africa
5
Department of Computer Science and Information Technology, Sol Plaatje University, Kimberley 8301, South Africa
6
Department of Internal Medicine and Department of Physiology, Makerere University, Kampala 10101, Uganda
7
African Center of Excellence in Bioinformatics (ACE-B), Makerere University, Kampala 10101, Uganda
8
MRC/Wits Developmental Pathways for Health Research Unit, Department of Paediatrics, Faculty of Health Sciences, University of the Witwatersrand, Johannesburg 2050, South Africa
9
Sydney Brenner Institute for Molecular Bioscience, Faculty of Health Sciences, University of the Witwatersrand, Johannesburg 2193, South Africa
10
Department of Non-Communicable Disease Epidemiology (NCDE), London School of Hygiene and Tropical Medicine, London WC1E 7HT, UK
*
Author to whom correspondence should be addressed.
Genes 2022, 13(8), 1460; https://doi.org/10.3390/genes13081460
Submission received: 2 June 2022 / Revised: 28 July 2022 / Accepted: 8 August 2022 / Published: 16 August 2022
(This article belongs to the Topic Bioinformatics in Drug Design and Discovery)

Abstract

:
Background: According to observational studies, two polymorphisms in the apolipoprotein L1 (APOL1) gene have been linked to an increased risk of chronic kidney disease (CKD) in Africans. One polymorphism involves the substitution of two amino-acid residues (S342G and I384M; known as G1), while the other involves the deletion of two amino-acid residues in a row (N388 and Y389; termed G2). Despite the strong link between APOL1 polymorphisms and kidney disease, the molecular mechanisms via which these APOL1 mutations influence the onset and progression of CKD remain unknown. Methods: To predict the active site and allosteric site on the APOL1 protein, we used the Computed Atlas of Surface Topography of Proteins (CASTp) and the Protein Allosteric Sites Server (PASSer). Using an extended molecular dynamics simulation, we investigated the characteristic structural perturbations in the 3D structures of APOL1 variants. Results: According to CASTp’s active site characterization, the topmost predicted site had a surface area of 964.892 Å2 and a pocket volume of 900.792 Å3. For the top three allosteric pockets, the allostery probability was 52.44%, 46.30%, and 38.50%, respectively. The systems reached equilibrium in about 125 ns. From 0–100 ns, there was also significant structural instability. When compared to G1 and G2, the wildtype protein (G0) had overall high stability throughout the simulation. The root-mean-square fluctuation (RMSF) of wildtype and variant protein backbone Cα fluctuations revealed that the Cα of the variants had a large structural fluctuation when compared to the wildtype. Conclusion: Using a combination of different computational techniques, we identified binding sites within the APOL1 protein that could be an attractive site for potential inhibitors of APOL1. Furthermore, the G1 and G2 mutations reduced the structural stability of APOL1.

1. Introduction

Kidney disease affects between 11% and 15% of the world’s population [1]. Every year, millions of people die prematurely as a result of kidney-related diseases. Damaged kidneys are unable to filter blood adequately, process toxic wastes, and manage the excess fluid buildup in the human body [2,3]. Chronic kidney disease (CKD), defined as a gradual loss in kidney function for more than 3 months, has been found to be most common in people of African descent, accounting for approximately 15% of the population [4,5].
The apolipoprotein L1 (APOL1) gene has been linked to a fourfold increase in the risk of developing CKD in African-Americans [6,7].
APOL1 is involved in the innate immunity of trypanosomes and other lysing infecting flagellated parasites [8,9]. Parasite-induced resistance to APOL1 activities, on the other hand, has resulted in the emergence of two nonsynonymous coding variants (G1(S342G:I384M) and G2(N388del:Y389del) [10]. Carrying the two risk APOL1 alleles increases the risk of CKD development, progression, and severity by 70% [11]. This has also contributed to rapid disease development and end-stage renal disease (ESRD) in people of recent African descent [11]. As a result, in addition to protecting against trypanosomes, APOL1 (see Figure 1A) plays a negative role [12]. The two most common treatments for kidney failure are dialysis and kidney transplantation [13]. Unfortunately, these are expensive and unavailable in resource-constrained environments [14]. Sabins (2020) established a number of novel chemicals for the treatment of kidney diseases, most notably focal segmental glomerulosclerosis (FSGS) and/or nondiabetic kidney disease (NDKD) [15]. We investigated the mechanistic impact of a ligand on the dynamics of the APOL1 protein using a newly synthesized compound (Compound 1) (see Figure 1B). As a result, this study was designed to gain insight into the impact of mutations on the 3D architecture of the APOL1 protein and to posit a possible mechanism of action of a potential APOL1 inhibitor, in order to gain further insight into the etiology of CKD.

2. Methodology

2.1. Protein and Ligand Preparation

The AlphaFold database was used to obtain the human APOL1 protein structure accession number O14791 [16]. Molegro molecular viewer was used to refine the structures [17]. The APOL1 G1 variants, rs73885319 and rs60910145, were created by replacing Ser at position 342 with Gly (Ser342Gly) and Ile at position 384 with Met (Ile384Met) in CHIMERA using the “Swapaa” command line [18]. The APOL1 G2 (rs71785313) variant is the result of a 6 bp deletion; thus, the mutation was introduced in the structure by removing Asn at position 388 and Tyr at position 389 and using the join command [19]. The steps taken to prepare the ligand were as follows: the 2D structure was drawn with Marvin sketch [20], after which energy minimization was carried out on the ligand using the energy optimization tool within Avogadro software [21]. We used the GAFF forcefield and the steepest descent algorithm to obtain the most stable form and lowest energy of the ligand. The energy-minimized structure was then used for molecular docking in Chimera [22].

2.2. Molecular Dynamic Simulation

The simulation was carried out using the AMBER force field, FF18SB [23]. We used the General Amber Force Field (GAFF) and the restrained electrostatic potential (REP) to describe the atomic charges of APIND. Amber’s Leap module was used to perform system neutralization and hydrogen atom addition. An orthorhombic box of TIP3P water molecules surrounding all of the APOL1 atoms at a distance of 9 Å [24] was also used for system solvation. We performed system minimization in 2000 steps using a restriction potential of 500 kcal/mol. This was followed by 1000 steps of full minimization with no constraints. In all, we undertook two minimization process. The first minimization, partial minimization, was undertaken to relieve bad van der Waals contact in the surrounding solvent while keeping the solute, i.e., the protein, restrained. The second minimization process, full minimization, was undertaken to relieve bad contacts in the whole system. The system was gradually heated from 10 to 273 K at 50 ps using a Langevin thermostat at a collision frequency of 1.0 ps−1. After equilibration, we heated each system for 50 ps while maintaining a constant temperature of 300 K and pressure of 1 bar (isobaric-isothermal ensemble, NPT using Berendsen barostat) with a timestep of 2 fs. We used the SHAKE algorithm [25] within the AMBER software to constrain (NTC = 2) all bonds involving hydrogen. This step is important as it removes the highest-frequency oscillation in the system and that of hydrogen vibrations. The PTRAJ module of Amber 14 was used for additional analyses such as root-mean-square deviation (RMSD), root-mean-square fluctuation (RMSF), and radius of gyration [26], as in previous publications [27]. We created data plots with the ORIGIN analytical tool. AMBER’s molecular mechanics/Poisson–Boltzmann surface area (MM/GBSA) module was used to estimate thermodynamic calculations, as described below.
Gbind = Gcomplex − (Greceptor + Ginhibitor),
ΔGbind = ΔGgas + ΔGsol − TΔS,
ΔGgas = ΔEint + ΔEele + ΔEvdW,
ΔGsol = ΔGele,sol(GB) − ΔGnp,sol,
ΔGnp,sol = γSASA + β
where ΔGgas represents the total gas-phase energy calculated by intermolecular energy (ΔEint), electrostatic energy (ΔEelel), and van der Waals energy (ΔEvdW), ΔGsol represents the solvation energy, TΔS represents the entropy change, ΔGele,sol(GB) describes the polar desolvation energy, ΔGnp,sol describes the nonpolar desolvation energy, γ is the surface tension proportionality constant and is set to 0.0072 kcal·mol−1·Å−2, β is a constant equal to 0, and SASA is the solvent-accessible surface area (Å2).

3. Results

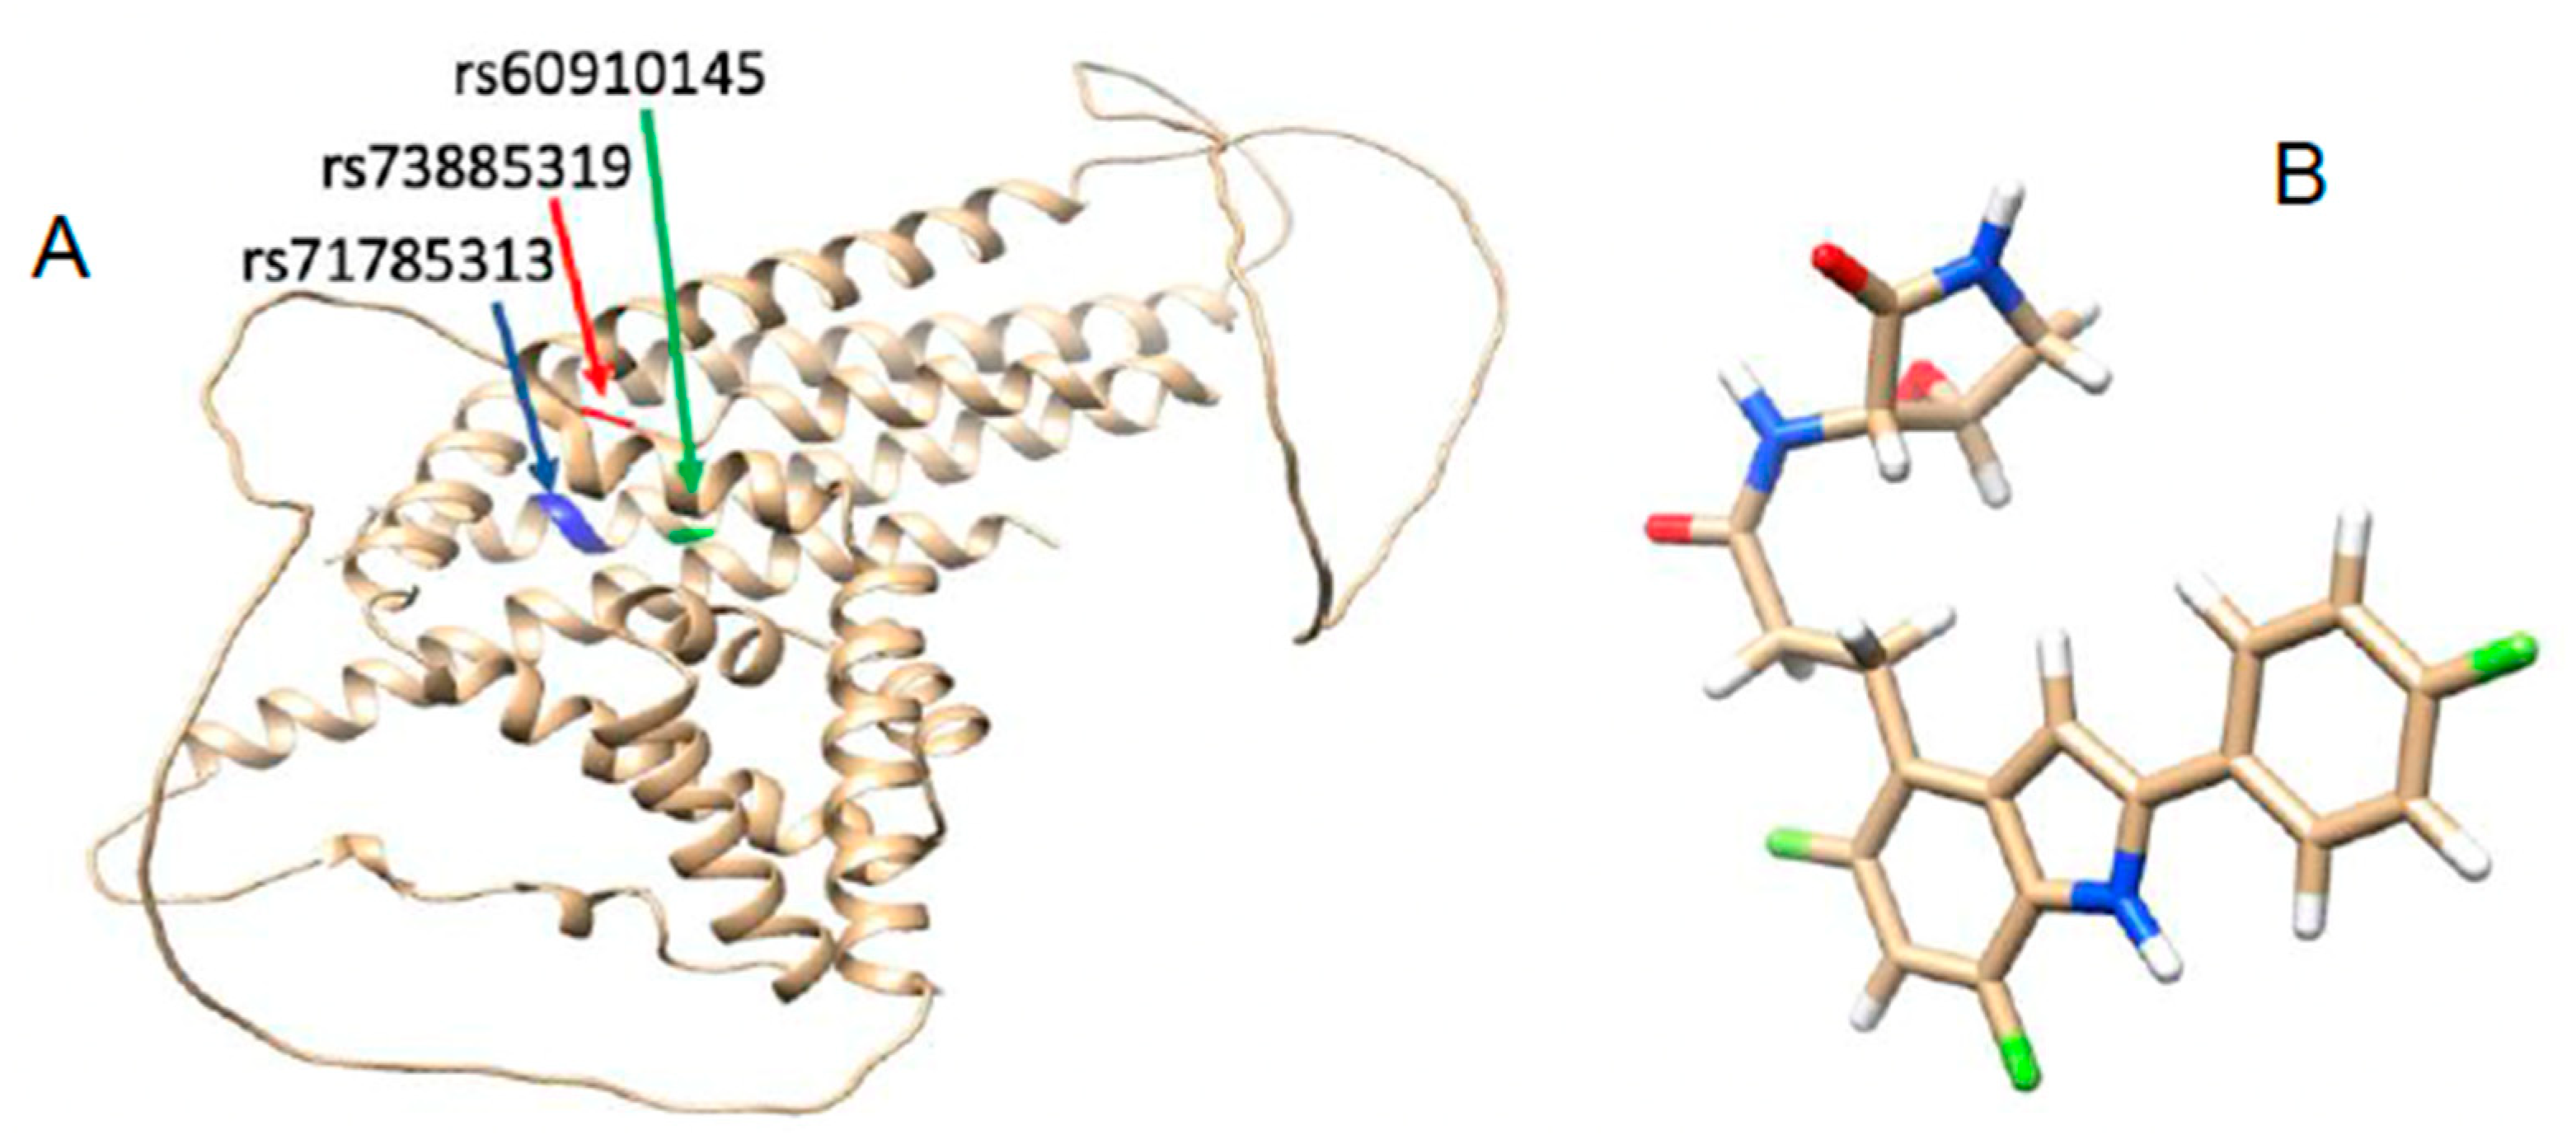
3.1. APOL1 Structural Elucidation

The 3D structure of APOL1 was obtained from the AlphaFold protein structure database [16], and the active sites were predicted using the Computed Atlas of Surface Topography of Proteins (CASTp) server [28]. The CASTp server identifies topographic features, measures area and volume, and computes imprint using the α shape method developed in computational geometry [29]. According to CASTp’s active site characterization, the top predicted site had a surface area of 964.892 Å2 and a spatial volume of 900.792 Å3. We used PASSer (Protein Allosteric Sites Server) to evaluate potential APOL1 allosteric pockets. Allostery probabilities for the top three allosteric pockets were 52.44%, 46.30%, and 38.50%. Other descriptors of these pockets are reported in Table 1.

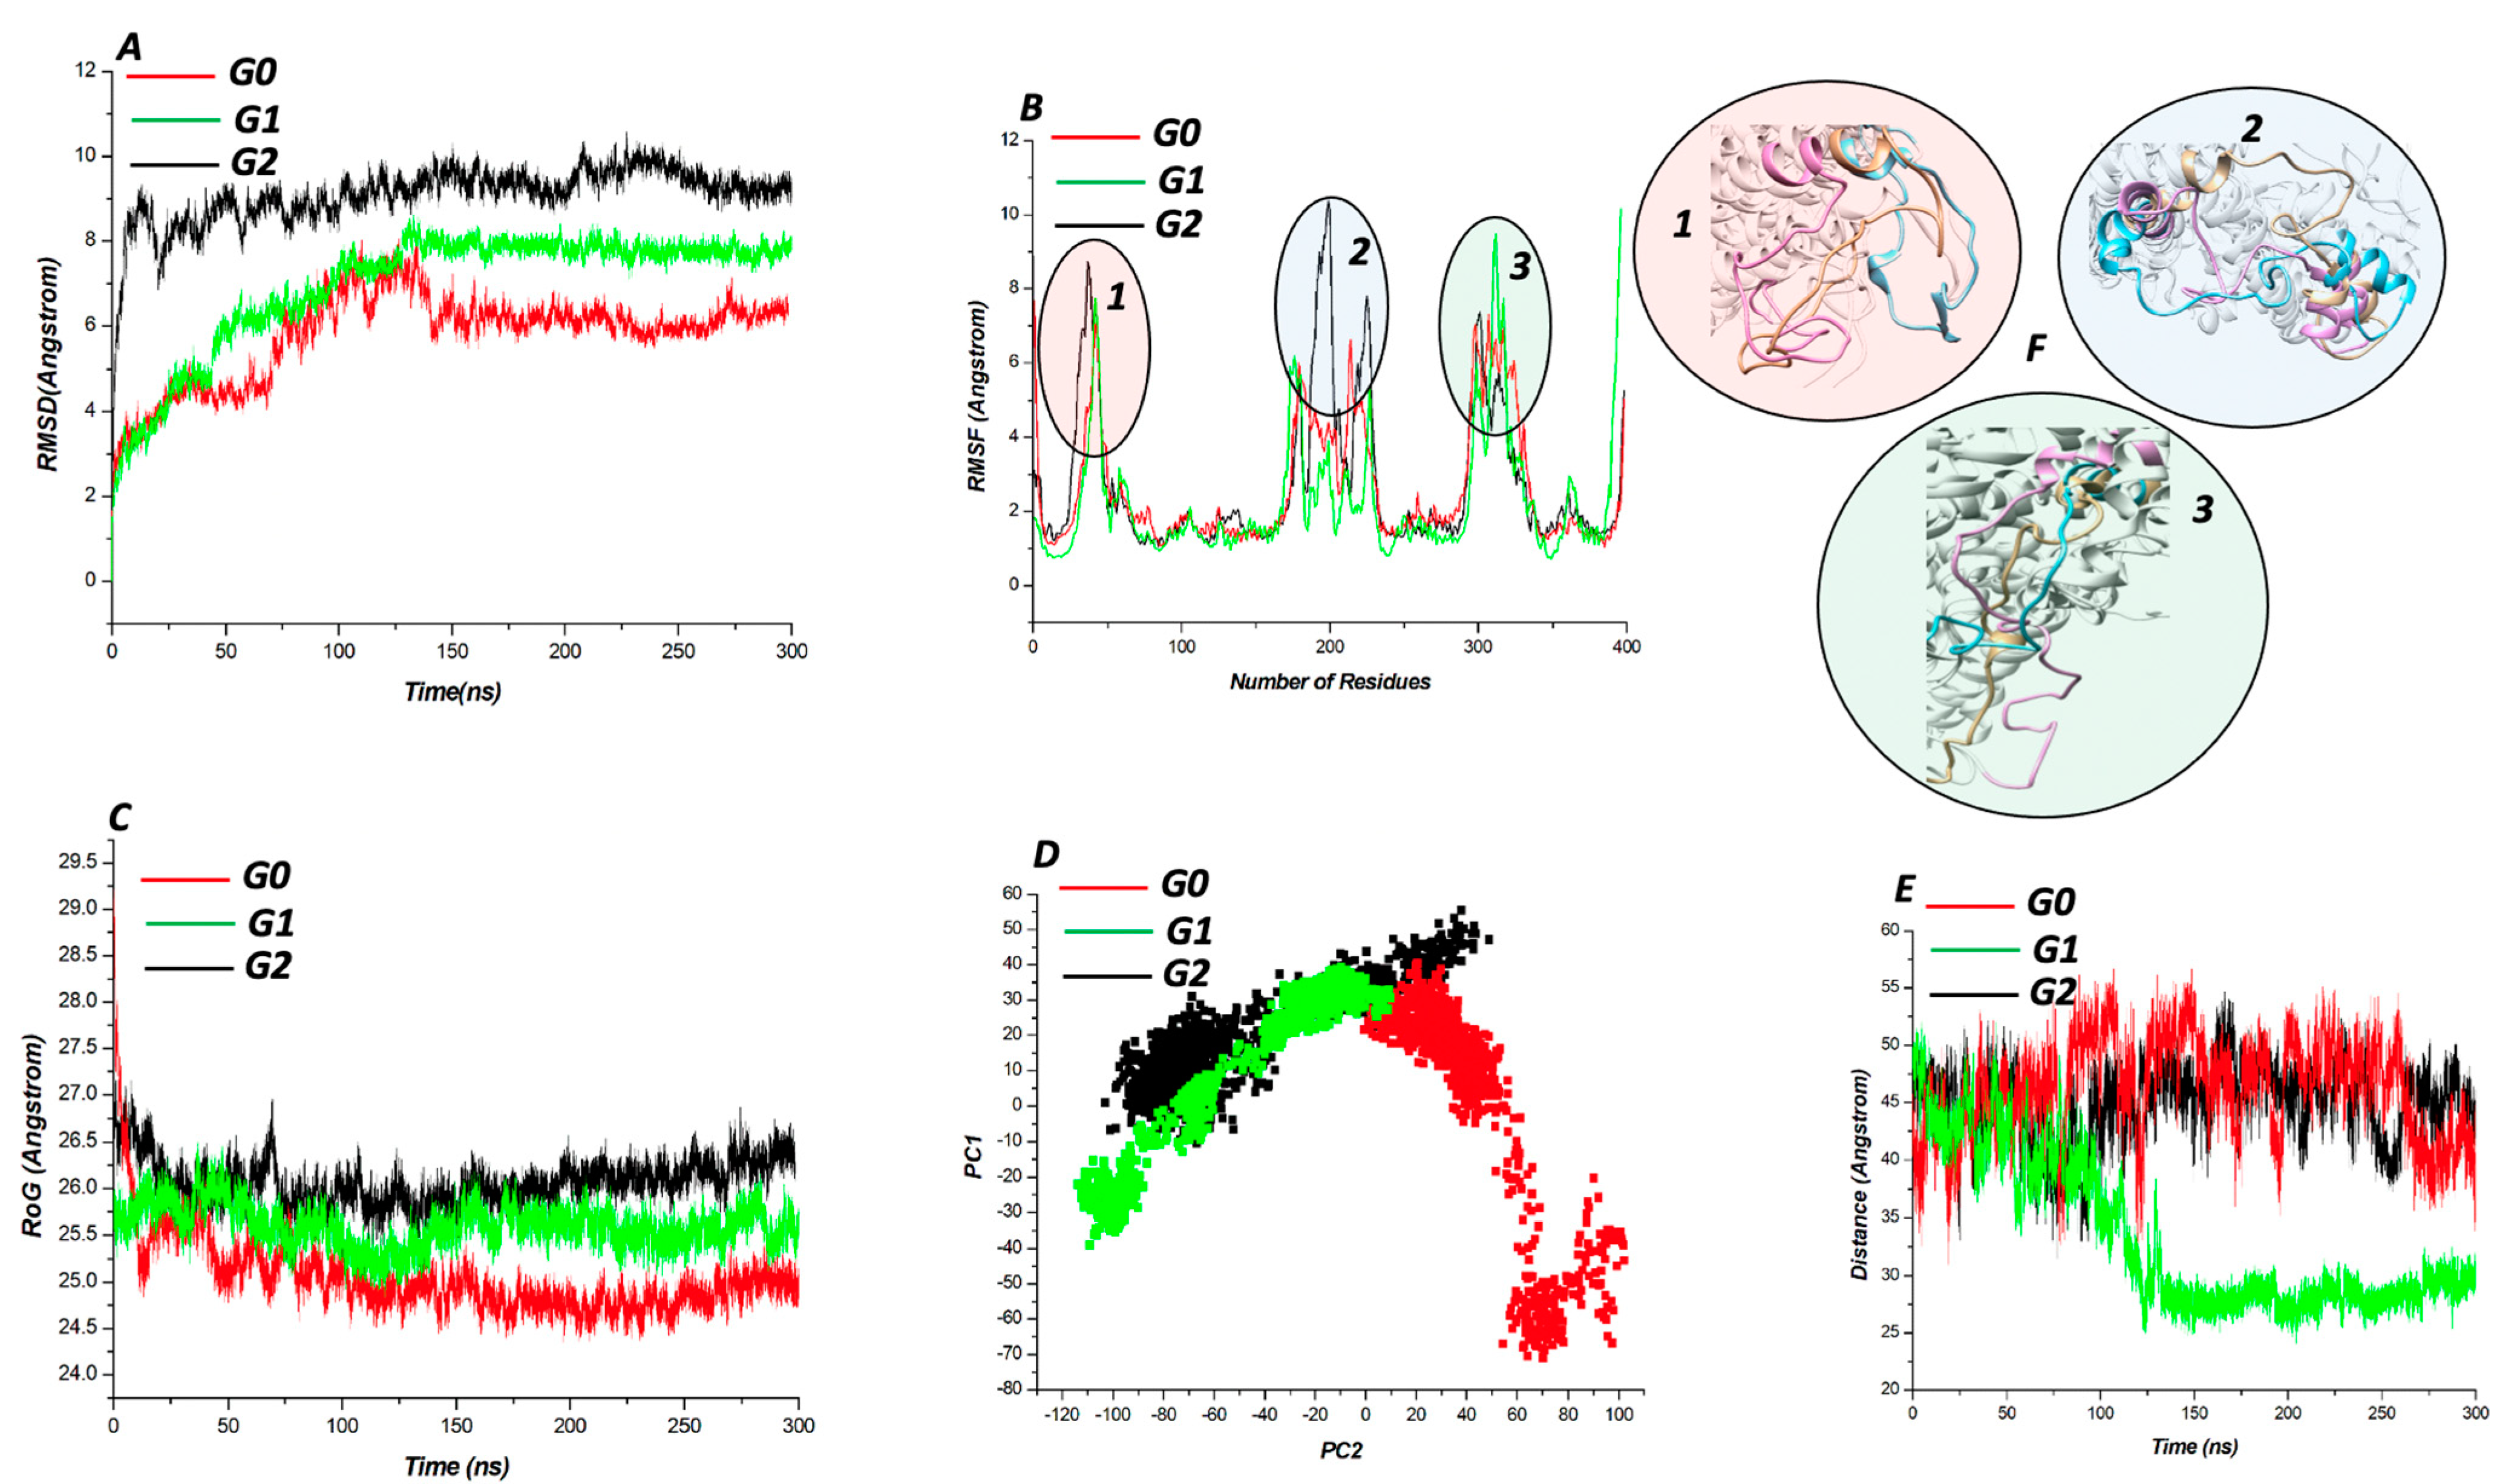
3.2. Mutation-Structural Perturbation of APOL1

Molecular docking was carried out using AutoDock vina tools in-built in Chimera. A grid box with coordinate (center: x = 12.622, y = 45.876, z = 24.735; size: x = 21, y = 29, z = 30) was set around the binding sites of APOL1 wildtype and mutant proteins predicted by CASTp to accommodate the ligand (APIND). The binding affinity of the wildtype and mutant proteins upon binding to APIND was as follows: G0, −7.9 kcal/mol; G1, −8.4 kcal/mol; G2, −9.1 kcal/mol. Because mutations within a protein can potentially alter its 3D structure, we investigated the molecular behavior of the Cα of the wild, G1, and G2 variants using an extended molecular dynamics simulation. The metrics RMSD, RoG, RMSF, and PCA were used to evaluate the MD trajectories [29]. RMSD analysis provides information about the protein’s conformational change and overall stability during the MD simulation. While all of the systems reached equilibration around 125 ns, there was significant structural instability from 0–100 ns (Figure 2A). The G0 protein had an overall high stability throughout the simulation, with an average RMSD value of 5.79 Å, as expected, while the G1 and G2 proteins had average RMSD values of 6.96 Å and 9.09 Å, respectively. The RMSF is a measure of individual residue displacement during the simulation. Backbone Cα fluctuations expressed as the RMSF of wildtype and variant proteins revealed that the Cα of the variants had a high structural fluctuation when compared to the wildtype. The G0, G1, and G2 average Cα fluctuations were 2.27 Å, 2.63 Å, and 2.76 Å, respectively (Figure 2B). Importantly, high fluctuation was observed in regions other than the mutation point, leading us to believe that the mutation has a “distant effect” on the structure of APOL1 (Figure 2F). The radius of gyration, which is a measure of the RMS average of the distance of the atoms from the protein’s center, supported the RMSD analysis, as the wildtype protein had less atomic gyration than the G1 and G2 variants (Figure 2C).
PCA is a parameter used in unraveling a protein’s conformational changes and mobility during simulation. The PCA highlighted the disparate motions of the wildtype and variant proteins along two major components, as observed in the RMSD and RMSF analyses (PC1 and PC2). The variants showed greater dispersion along these principal components (G0: −48.15, 9.75; G1: −47.81, 18.21; G2: 40.57, 2.68) (Figure 2D). We used ORIGIN to extrapolate these coordinates by identifying the minimum and maximum data points in each principal components of the systems. Furthermore, the system’s intermolecular distance supported the structural instability caused by the variants (Figure 2E). This intermolecular distance was calculated for the whole system by using the center of mass.

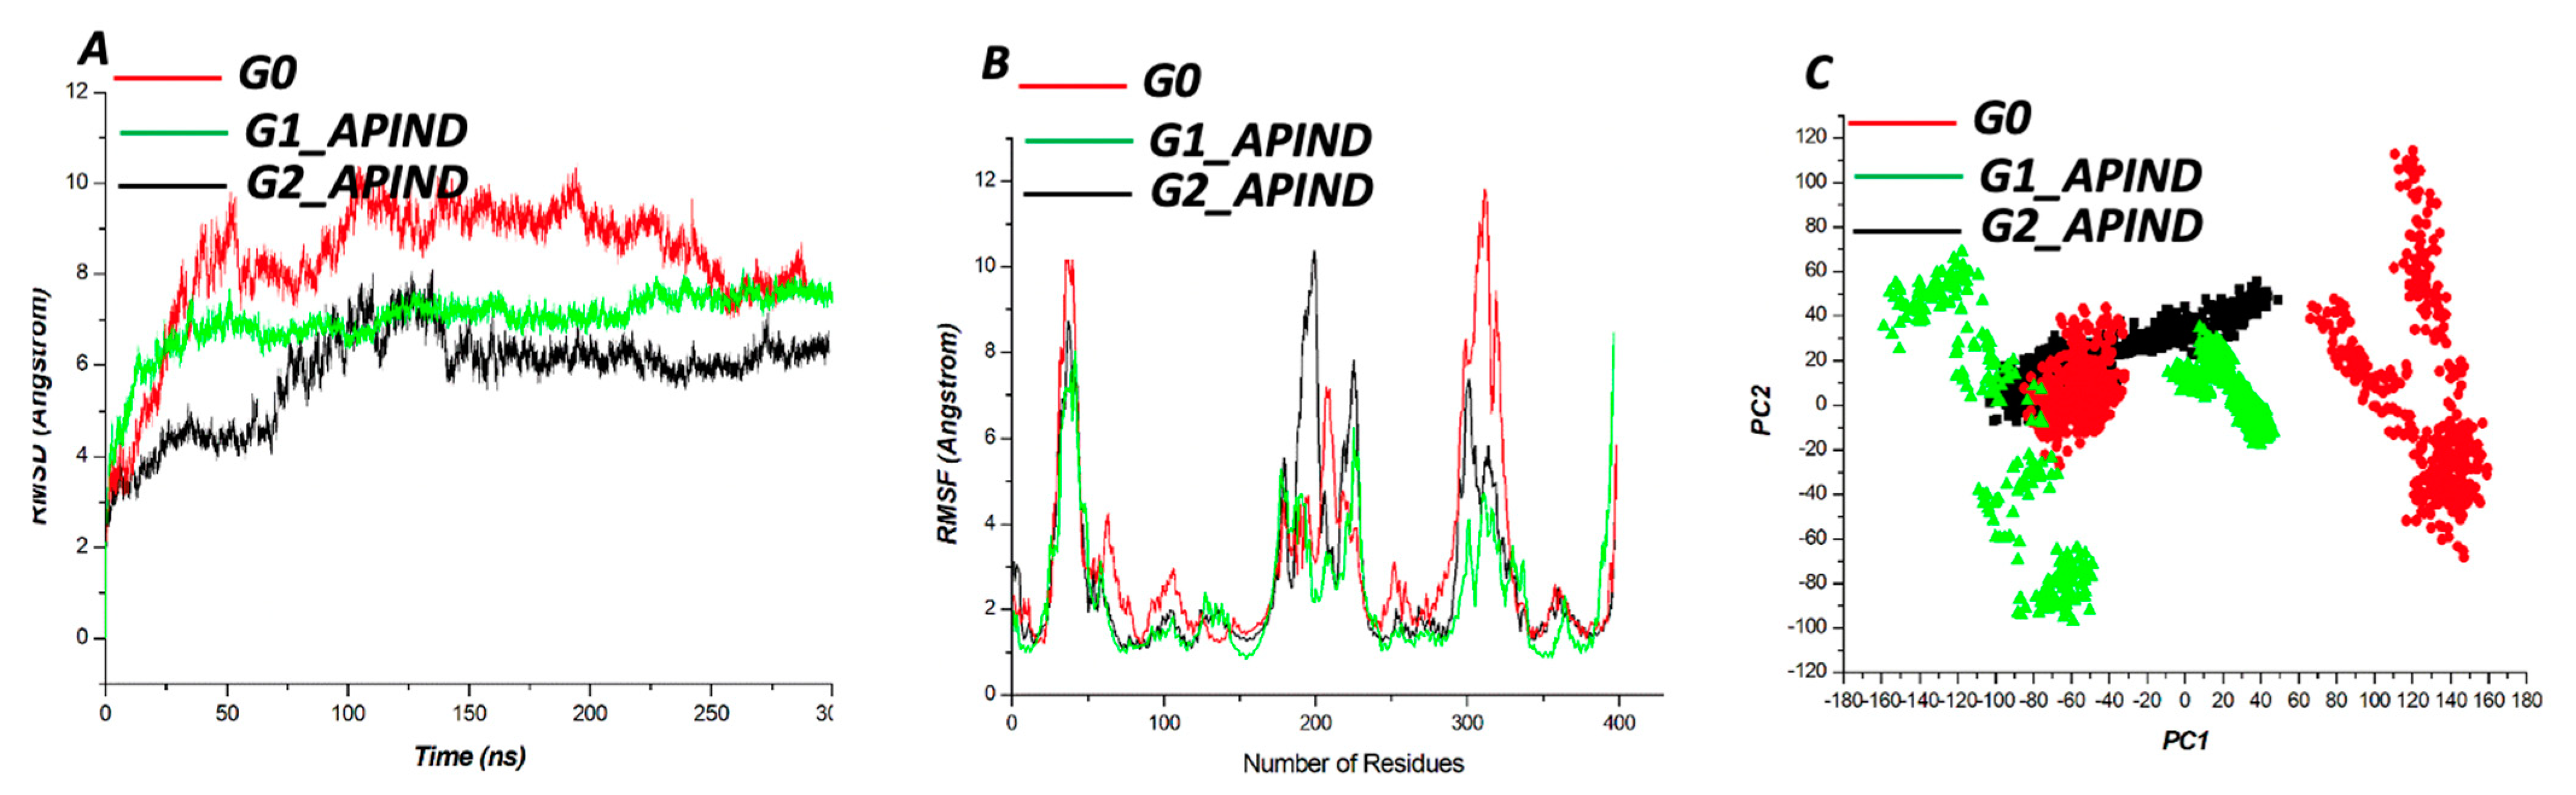
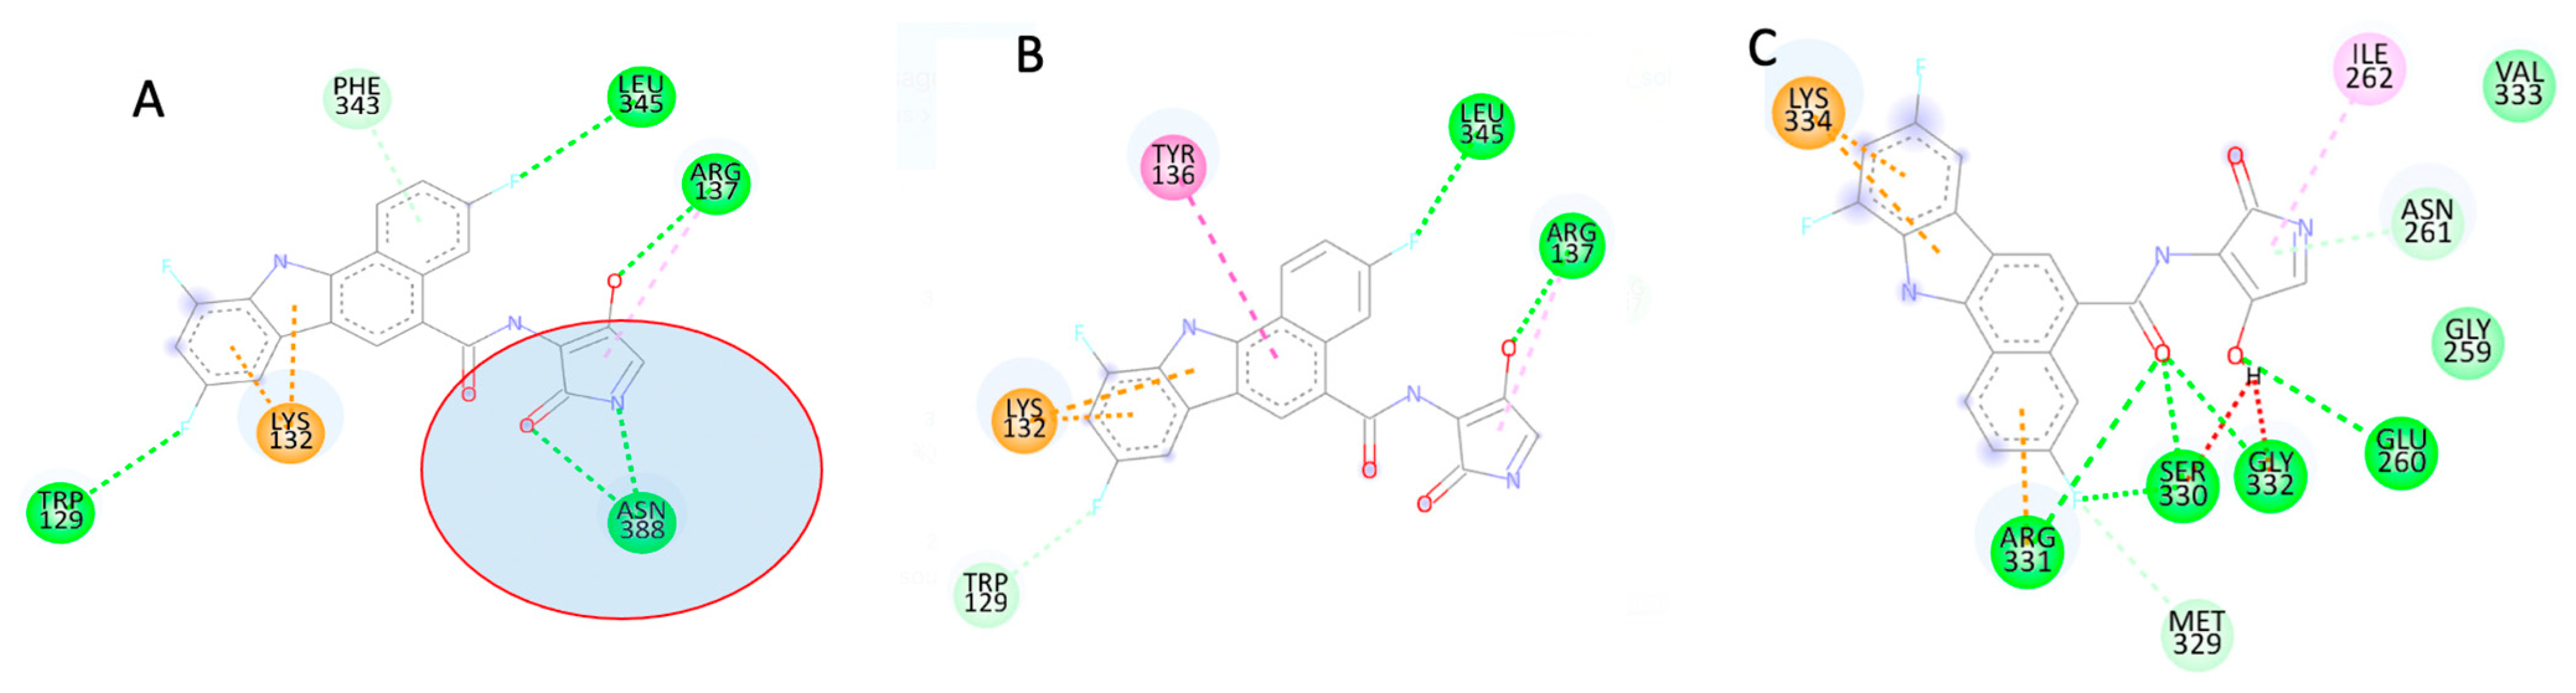
APIND Alters the Structure of Apol1

Distinctive from Figure 2, where we explored the structural changes in the variants without ligand binding, we undertook a protein–ligand simulation to investigate the potential of APIND to mitigate the effect of the structural distortion in APOL1 caused by mutation (Figure 3). Our findings show that APIND binding reduced the structural average RMSD of G1 and G2 variants, lowering the structural average RMSD from 6.96 Å to 6.83 Å for G1 and from 9.09 Å to 5.780 Å for G2 variants (Figure 3A). The Cα fluctuation followed a similar trend. However, some regions demonstrated high flexibility, presumably due to the presence of loops (Figure 3B). The RMSD trend was observed in the PCA analysis of G1 and G2 (Figure 3C).
We elucidated the mechanistic interaction of APIND within the predicted active site of APOL1 protein using the rs71785313 variant as a model to posit a possible mechanism of action of the potential APOL1 inhibitor (APIND). We discovered that, in the wildtype protein (G0), APIND forms a strong hydrogen bond with ASN388 (red circle; Figure 4A); however, when ASN388 is deleted in G2, this interaction is lost. This is likely one of the mechanisms via which APIND stabilizes the 3D structure of APOL1 and inhibits the protein.
The MM/GBSA technique for calculating free binding energy could provide insight into protein–ligand interaction systems. As a result, we looked into the time-dependent bond interactions between critical residues in the active sites of APOL1 variants and APIND. The total binding energies of G1 and G2 upon APIND binding were −10.65 kcal/mol and −20.876 kcal/mol, respectively, according to thermodynamic calculations (Table 2).
Figure 4 depicts how this energy contributed to the thermodynamic process.

4. Discussion

APOL1 variants have been linked to an increased risk of developing CKD, particularly in African-Americans [30]. Understanding how a protein works and the functional effects of its modification, such as through site-directed mutations, can be aided by studying its structure [31]. Knowledge of protein structure also allows us to understand molecules that bind to proteins, decipher disease pathophysiology, and identify potential treatment targets [27]. A single amino-acid change in a protein’s structure can have disastrous functional consequences [32]. As in previous studies [33], using a combination of computational techniques such as computational modeling, molecular docking, and molecular dynamics (MD) simulations, we identified binding sites within the APOL1 protein that could be an attractive site for potential APOL1 inhibitors [34]. These approaches aided in our understanding of the structure of APOL1-G0, as well as the effect of G1 and G2 variations on protein structure and dynamics. As a result, we investigated the distinctive structural perturbations in the 3D structures of APOL1 variants. The introduction of the G1 and G2 mutations reduced the structural stability of APOL1. The findings of this study are supported by other experimental studies that have alluded to structural instability in G1 and G2 variants of APOL1, affecting APOL1 interactions with other proteins within the cell [35]. Protein residues are implicated in various activities, including protein structure and function [36]. Mutations can cause decreased structure stability, resulting in misfolding and a loss of protein function [37]. Changes in protein conformation and stability provide information about the deviation of backbone atoms from their starting structure during MD simulation. The APOL1 protein–ligand interaction improved structural stability, according to our findings. This could be because protein interactions with small ligands frequently result in an increase in protein thermostability due to the coupling of binding and unfolding equilibrium [38]. Although kidney diseases are ostensibly a global health issue, renal replacement is prohibitively expensive and difficult to obtain [38]. In the quest for more treatment options, we discovered that variation-mediated protein conformational changes may impair APOL1 variants’ ability to regulate or interact with other downstream proteins such as VAMP8 and SNARE. As a result, this may lead to the development and progression of CKD. This is a computer-based study in which we looked at only one compound as a potential drug. As a result, in silico, in vivo, and in vitro studies are needed to screen various compounds for their potential as drug candidates for kidney-related diseases [33].

Author Contributions

Conceptualization of the study: S.F. and O.S.; Data curation and analysis: O.S. and R.M.; Writing—original draft, R.M.; Writing—critical review and editing, R.M., C.K., O.S., O.O.O., O.D., M.W., R.K., D.J., T.C. and S.F.; Supervision: S.F., O.S., R.K., D.J. and T.C. All authors have read and agreed to the published version of the manuscript.

Funding

This work was supported by the Wellcome Trust grant number 220740/Z/20/Z to Segun Fatumo. T.C. is an international training fellow supported by the Wellcome Trust grant (214205/Z/18/Z). O.O.O. acknowledges the German Deutscher Akademischer Austauschdienst (DAAD) climapAfrica grant (with grant/scholarship personal reference number ST32/91769426) and the Oppenheimer Memorial Trust (OMT) personal research grant (with grant award/scholarship reference number OMT Ref. 21563/01). We thank the Fogarty International Center of the National Institutes of Health of the United States for supporting Mamadou Wele and Oudou Diabate under grant U2RTW010673 of the West African Center of Excellence for Global Health Bioinformatics Research Training. Daudi Jjingo acknowledges the support of the National Institutes of Health, Fogarty International Center [grant numbers: 1D43TW010045-01, 1U2RTW010672-01].

Institutional Review Board Statement

Not applicable.

Informed Consent Statement

Not applicable.

Data Availability Statement

The data presented in this study are available in the manuscript.

Acknowledgments

This study was undertaken as a part of the Ph.D. thesis of Richard Mayanja. Therefore, we gratefully acknowledge the contribution of the resources at the MRC/UVRI and LSHTM Uganda Research Unit and at the African Center of Excellence in Bioinformatics (ACE-B), Makerere University, Uganda. Richard Mayanja appreciates PhD research fellowship from NIH grant 1U01MH115485-01.

Conflicts of Interest

The authors declare no conflict of interest.

References

  1. Lv, J.-C.; Zhang, L.-X. Prevalence and Disease Burden of Chronic Kidney Disease. Adv. Exp. Med. Biol. 2019, 1165, 3–15. [Google Scholar] [CrossRef] [PubMed]
  2. Kidney Disease Statistics for the United States|NIDDK. Available online: https://www.niddk.nih.gov/health-information/health-statistics/kidney-disease (accessed on 7 March 2022).
  3. Kidney Disease/Chronic Kidney Disease: Symptoms, Treatment & More. Available online: https://my.clevelandclinic.org/health/diseases/15096-kidney-disease-chronic-kidney-disease (accessed on 7 March 2022).
  4. Things to Know About Kidney Function|National Kidney Foundation. Available online: https://www.kidney.org/kidneydisease/howkidneyswrk (accessed on 7 March 2022).
  5. Kaze, A.D.; Ilori, T.; Jaar, B.G.; Echouffo-Tcheugui, J.B. Burden of chronic kidney disease on the African continent: A systematic review and meta-analysis. BMC Nephrol. 2018, 19, 125. [Google Scholar] [CrossRef] [PubMed]
  6. Chronic Kidney Disease (CKD)—Symptoms, Causes, Treatment|National Kidney Foundation. Available online: https://www.kidney.org/atoz/content/about-chronic-kidney-disease (accessed on 7 March 2022).
  7. Reidy, K.J.; Hjorten, R.; Parekh, R.S. Genetic risk of APOL1 and kidney disease in children and young adults of African ancestry. Curr. Opin. Pediatr. 2018, 30, 252. [Google Scholar] [CrossRef] [PubMed]
  8. Hung, R.K.; Binns-Roemer, E.; Booth, J.W.; Hilton, R.; Harber, M.; Santana-Suarez, B.; Campbell, L.; Fox, J.; Ustianowski, A.; Cosgrove, C.; et al. Genetic Variants of APOL1 Are Major Determinants of Kidney Failure in People of African Ancestry with HIV. Kidney Int. Rep. 2022, 7, 786–796. [Google Scholar] [CrossRef] [PubMed]
  9. Bruggeman, L.A.; O’Toole, J.F.; Sedor, J.R. Identifying the Intracellular Function of APOL1. J. Am. Soc. Nephrol. 2017, 28, 1008–1011. [Google Scholar] [CrossRef] [PubMed]
  10. Cooper, A.; Capewell, P.; Clucas, C.; Veitch, N.; Weir, W.; Thomson, R.; Raper, J.; MacLeod, A. A Primate APOL1 Variant That Kills Trypanosoma brucei gambiense. PLoS Negl. Trop. Dis. 2016, 10, e0004903. [Google Scholar] [CrossRef]
  11. Yusuf, A.A.; Govender, A.M.; Brandenburg, J.-T.; Winkler, A.C. Kidney disease and APOL1. Hum. Mol. Genet. 2021, 30, R129–R137. [Google Scholar] [CrossRef] [PubMed]
  12. Thurlow, J.S.; Joshi, M.; Yan, G.; Norris, K.C.; Agodoa, L.Y.; Yuan, C.M.; Nee, R. Global Epidemiology of End-Stage Kidney Disease and Disparities in Kidney Replacement Therapy. Am. J. Nephrol. 2021, 52, 98–107. [Google Scholar] [CrossRef] [PubMed]
  13. Pays, E. The function of apolipoproteins L (APOLs): Relevance for kidney disease, neurotransmission disorders, cancer and viral infection. FEBS J. 2021, 288, 360–381. [Google Scholar] [CrossRef] [PubMed]
  14. Patient Education: Dialysis or Kidney Transplantation—Which Is Right for Me? (Beyond the Basics)–UpToDate. Available online: https://www.uptodate.com/contents/dialysis-or-kidney-transplantation-which-is-right-for-me-beyond-the-basics (accessed on 7 March 2022).
  15. Duriseti, P.; Idrees, N.; Aldairem, A.; Jaber, B.L.; Balakrishnan, V.S. Cost analysis of two modalities of continuous renal replacement therapy. Hemodial. Int. 2021, 25, 173–179. [Google Scholar] [CrossRef] [PubMed]
  16. Sabnis, R.W. Novel APOL1 Inhibitors for Treating Kidney Diseases. ACS Med. Chem. Lett. 2020, 11, 2352–2353. [Google Scholar] [CrossRef] [PubMed]
  17. AlphaFold Protein Structure Database. Available online: https://alphafold.ebi.ac.uk/ (accessed on 7 March 2022).
  18. Molegro Molecular Viewer—Molexus. Available online: http://molexus.io/molegro-molecular-viewer/ (accessed on 7 March 2022).
  19. Download UCSF Chimera. Available online: https://www.cgl.ucsf.edu/chimera/download.html (accessed on 7 March 2022).
  20. Chimera User’s Guide. Available online: https://www.cgl.ucsf.edu/chimera/current/docs/UsersGuide/ (accessed on 7 March 2022).
  21. Marvin|ChemAxon. Available online: https://chemaxon.com/products/marvin (accessed on 7 March 2022).
  22. Avogadro—Free Cross-Platform Molecular Editor–Avogadro. Available online: https://avogadro.cc/ (accessed on 7 March 2022).
  23. The Amber Force Fields. Available online: https://ambermd.org/AmberModels.php (accessed on 7 March 2022).
  24. Harrach, M.F.; Drossel, B. Structure and dynamics of TIP3P, TIP4P, and TIP5P water near smooth and atomistic walls of different hydroaffinity. J. Chem. Phys. 2014, 140, 174501. [Google Scholar] [CrossRef] [PubMed]
  25. Snake Algorithm–File Exchange—MATLAB Central. Available online: https://www.mathworks.com/matlabcentral/fileexchange/51220-snake-algorithm (accessed on 7 March 2022).
  26. Okoh, M.P.; Singla, R.K.; Madu, C.; Soremekun, O.; Adejoh, J.; Alli, L.A.; Shen, B. Phytomedicine in Disease Management: In-Silico Analysis of the Binding Affinity of Artesunate and Azadirachtin for Malaria Treatment. Front. Pharmacol. 2021, 12. [Google Scholar] [CrossRef]
  27. Analysis. Available online: http://www.strodel.info/index_files/lecture/html/analysis-4.html (accessed on 7 March 2022).
  28. UCSF Chimera Home Page. Available online: https://www.cgl.ucsf.edu/chimera/ (accessed on 7 March 2022).
  29. CASTp 3.0: Computed Atlas of Surface Topography of Proteins. Available online: http://sts.bioe.uic.edu/castp/index.html?3trg (accessed on 9 March 2022).
  30. Tian, H.; Jiang, X.; Tao, P. PASSer: Prediction of allosteric sites server. Mach. Learn. Sci. Technol. 2021, 2, 035015. [Google Scholar] [CrossRef]
  31. Martínez, L. Automatic Identification of Mobile and Rigid Substructures in Molecular Dynamics Simulations and Fractional Structural Fluctuation Analysis. PLoS ONE 2015, 10, e0119264. [Google Scholar] [CrossRef]
  32. Friedman, D.J.; Pollak, M.R. APOL1 and Kidney Disease: From Genetics to Biology. Annu. Rev. Physiol. 2020, 82, 323–342. [Google Scholar] [CrossRef]
  33. Why Structure Prediction Matters|DNASTAR. Available online: https://www.dnastar.com/blog/structural-biology/why-structure-prediction-matters/ (accessed on 8 March 2022).
  34. Vihinen, M. Functional effects of protein variants. Biochimie 2021, 180, 104–120. [Google Scholar] [CrossRef]
  35. Udosen, B.; Soremekun, O.; Ekenna, C.; Omotuyi, O.I.; Chikowore, T.; Nashiru, O.; Fatumo, S. In-silico analysis reveals druggable single nucleotide polymorphisms in angiotensin 1 converting enzyme involved in the onset of blood pressure. BMC Res. Notes 2021, 14, 457. [Google Scholar] [CrossRef]
  36. Subair, T.I.; Akawa, O.B.; Soremekun, O.S.; Olotu, F.A.; Soliman, M.E.S. Insight into the Therapeutic Potential of a Bicyclic Hydroxypyridone Compound 2-[(2,4-Dichlorophenyl)methyl]-7-hydroxy-1,2,3,4-tetrahydro-8H-pyrido[1,2-a]pyrazin-8-one as COMT Inhibitor in the Treatment of Parkinson’s Disease: A Molecular Dynamic Simulation Approach. Chem. Biodivers. 2021, 18, e2100204. [Google Scholar] [CrossRef]
  37. Haque, S.; Patil, G.; Mishra, A.; Lan, X.; Popik, W.; Malhotra, A.; Skorecki, K.; Singhal, P.C. Effect of APOL1 disease risk variants on APOL1 gene product. Biosci. Rep. 2017, 37, 20160531. [Google Scholar] [CrossRef] [PubMed]
  38. Capra, J.A.; Singh, M. Predicting functionally important residues from sequence conservation. Bioinformatics 2007, 23, 1875–1882. [Google Scholar] [CrossRef] [PubMed]
Figure 1. The 3D structure of APOL1 protein highlighting the point of mutation (A) and 3D structure of potential APOL1 inhibitor (B). For the G1 mutations, SNPs rs60910145 and rs73885319 correspond to I384M and S342G respectively, while, for G2, SNP rs1785313 corresponds to N388del: Y389del.
Genes 13 01460 g001
Figure 2. Backbone RMSDs depicted as a function of time for G0 (red), G1 (green), and G2 (black) (A). Cα fluctuation of G0 (red), G1 (green), and G2 (black) (B). RoG plot of G0 (red), G1 (green), and G2 (black) (C). PCA scatter plots depicting a distinct separation of motions between G0 (red), G1 (green), and G2 (black) (D). Intermolecular distance plot of G0 (red), G1 (green), and G2 (black) (E). The 3D structures of highly fluctuating region in the system (F).
Genes 13 01460 g002
Figure 3. Backbone RMSDs are depicted as a function of time for the wildtype protein (G0) and bound variants (G1 and G2) (A). Cα fluctuation for the wildtype protein (G0) and bound variants (G1 and G2) (B). PCA scatter plots depicting a distinct separation of motions for the wildtype protein (G0) and bound variants (G1 and G2) (C).
Genes 13 01460 g003
Figure 4. Two-dimensional structures of G0_APIND (A), G1_APIND (B), and G2_APIND (C) interactions.
Genes 13 01460 g004
Table 1. Allosteric site descriptors of APOL1 allosteric sites.
ScoreDruggabilityVolumeHydrophobicityResidues
Pocket 10.0230.002300.26143.667N154,L147,L21,K132,L85,C13,V349,S342,Q82,D395,F265,V254,Q134,H130,V338,L258
Pocket 2−0.0340.002126.02344.875N154,V349,Q239,H360,H241,Q237,Y354,R157,V350,K357,K233,L161,V244,S356,L243,A240,L158,L371,T236,V353,L352
Pocket 3−0.0370.0013.33313.167V350,A5,Y351,E90,C13,G270,L6,L12,T272,R8,E348,F265,Y354,L266,A269,V9,L347,F344, E92,L86
Table 2. Thermodynamic calculations of G1 and G2 variants upon APIND binding.
Energy ComponentG1_APINDG2_APIND
∆EvdW (kcal/mol)−10.23−19.084
∆Eele (kcal/mol)20.78−40.092
∆GGB (kcal/mol)4.6565.1435
ESURF (kcal/mol)−3.89−5.086
∆Ggas (kcal/mol)6.44−99.98
∆Gsol (kcal/mol)4.4160.846
∆Gbind (kcal/mol)−10.65−20.876
Publisher’s Note: MDPI stays neutral with regard to jurisdictional claims in published maps and institutional affiliations.

