
Weighted Single-Step GWAS Identifies Genes Influencing Fillet Color in Rainbow Trout


Abstract
:1. Introduction
2. Materials and Methods
2.1. Fish Population and Phenotype Used for GWA in This Study
2.2. Genotyping and Quality Control
2.3. Descriptive Statistics
2.4. Genome-Wide Association Analysis
2.5. Identification of Candidate Genes
2.6. MicroRNA Target Prediction
3. Results
3.1. Descriptive Statistics and Heritability Estimates for the Color Traits
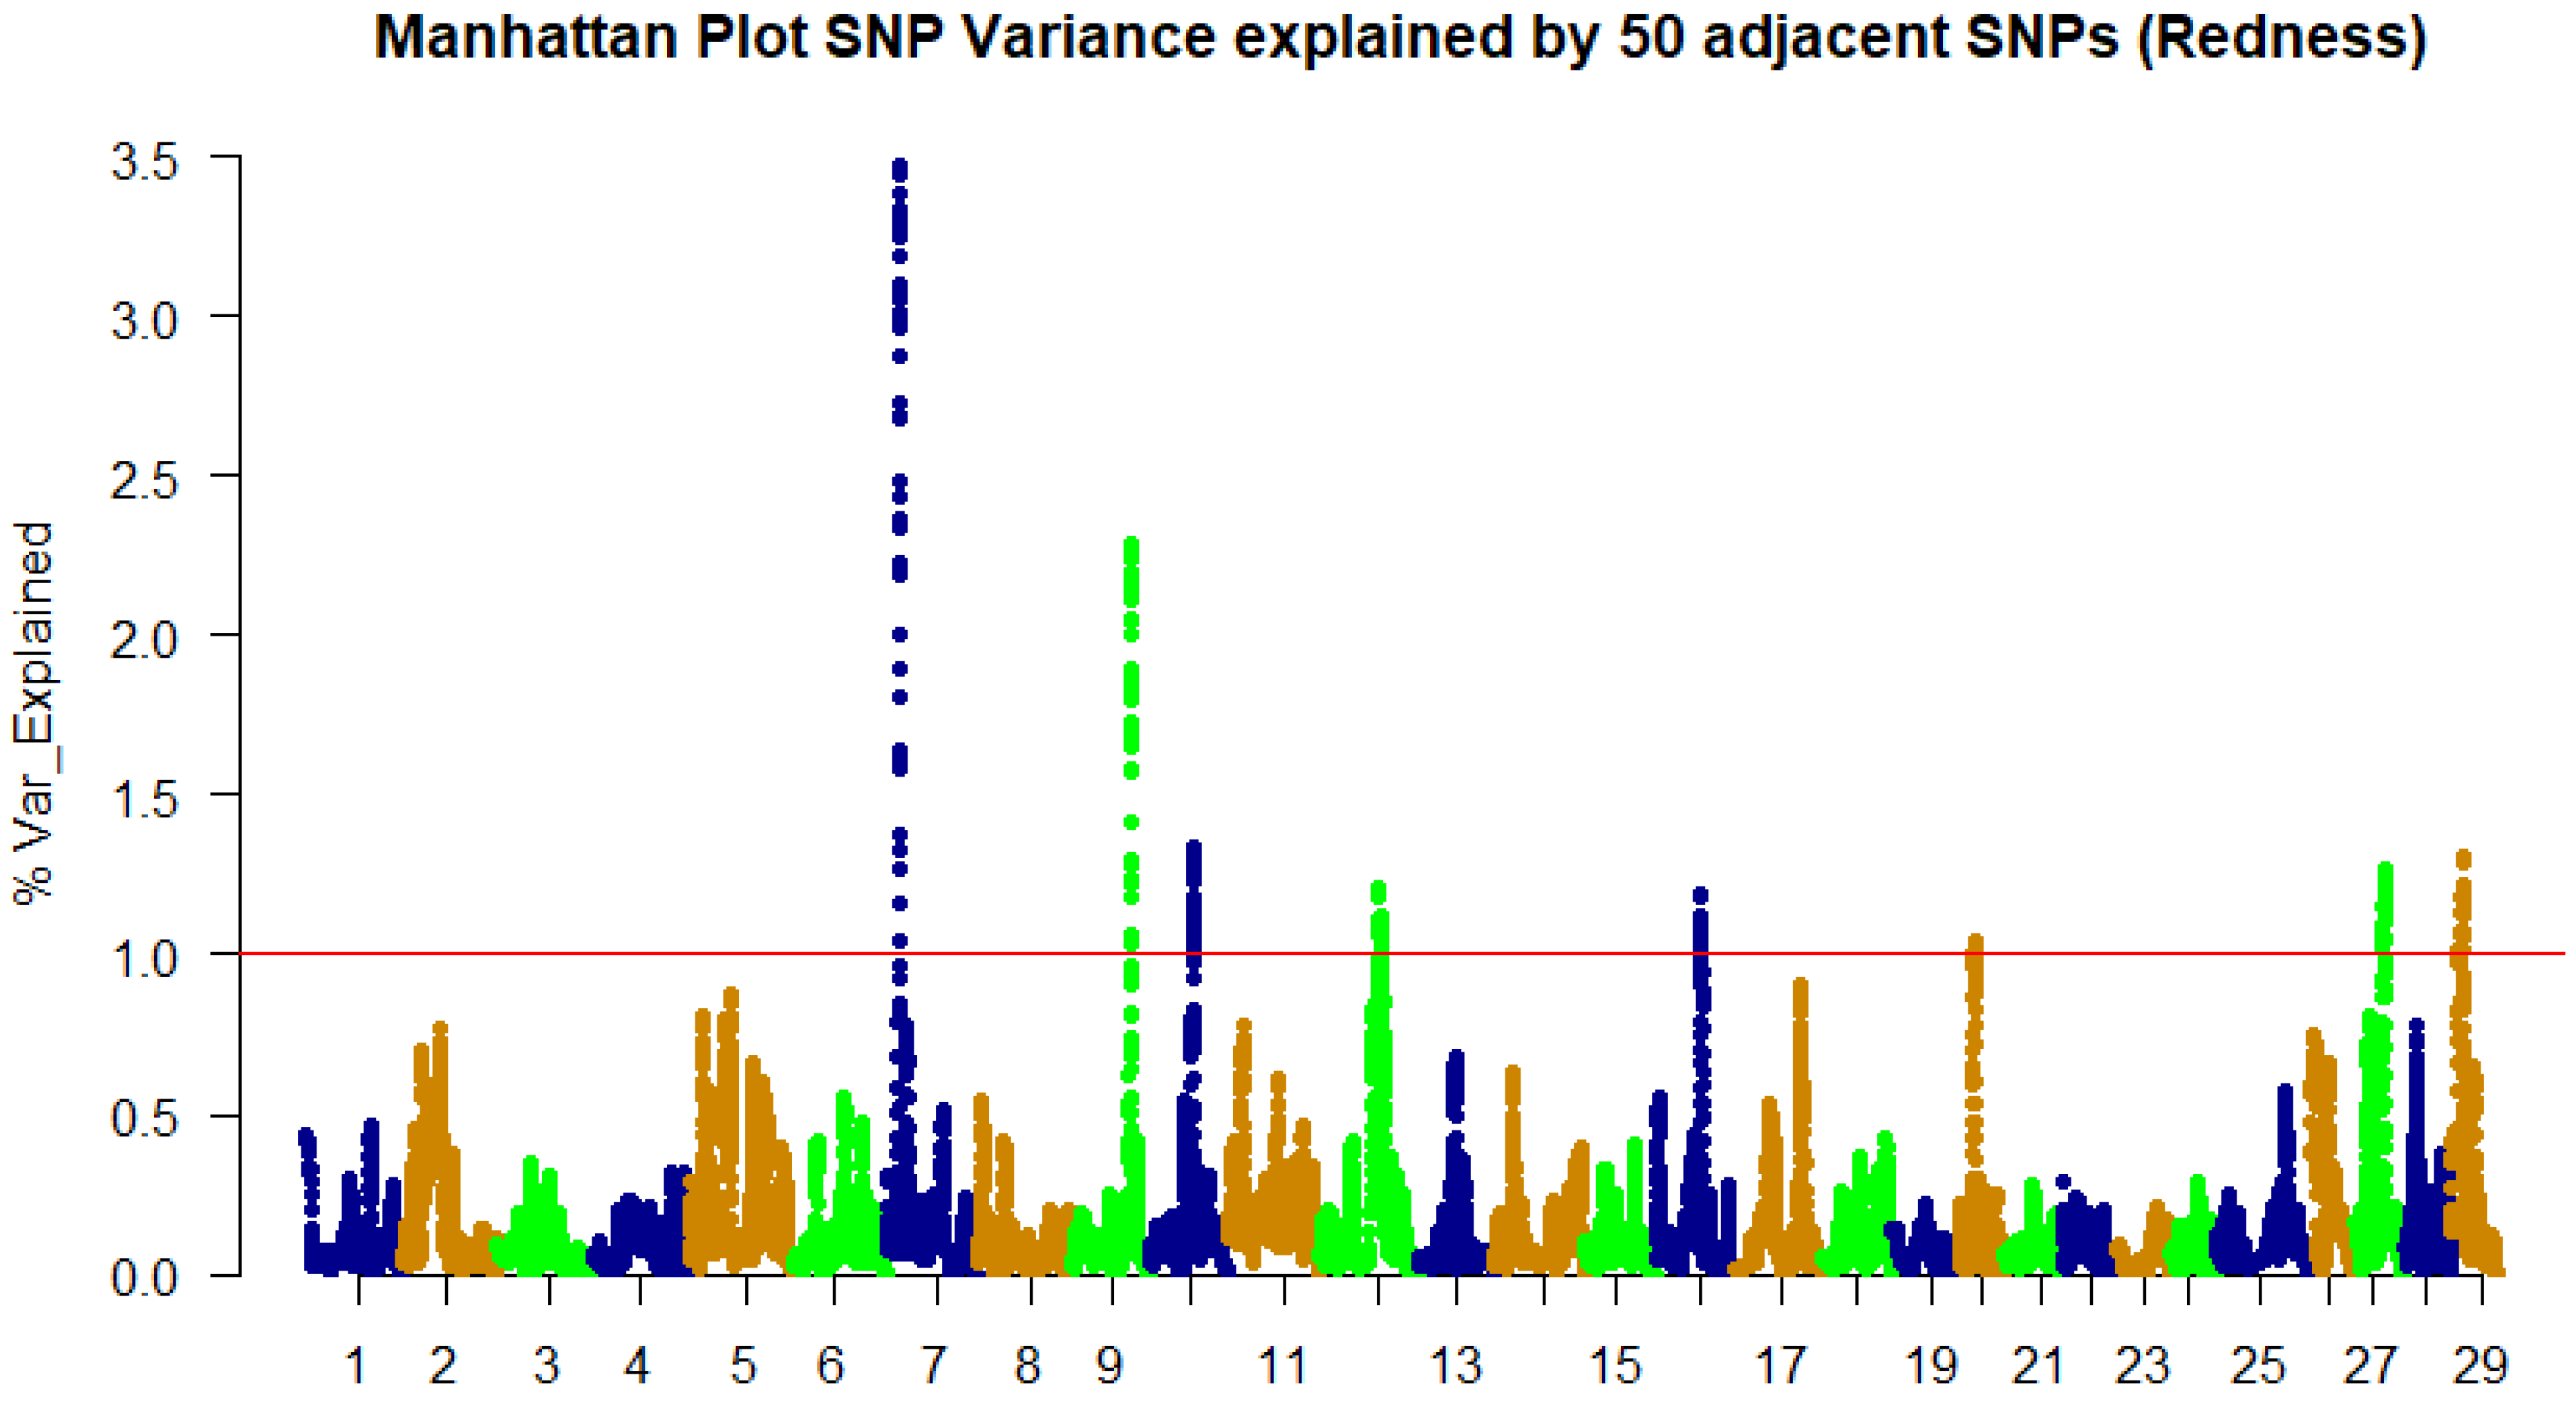
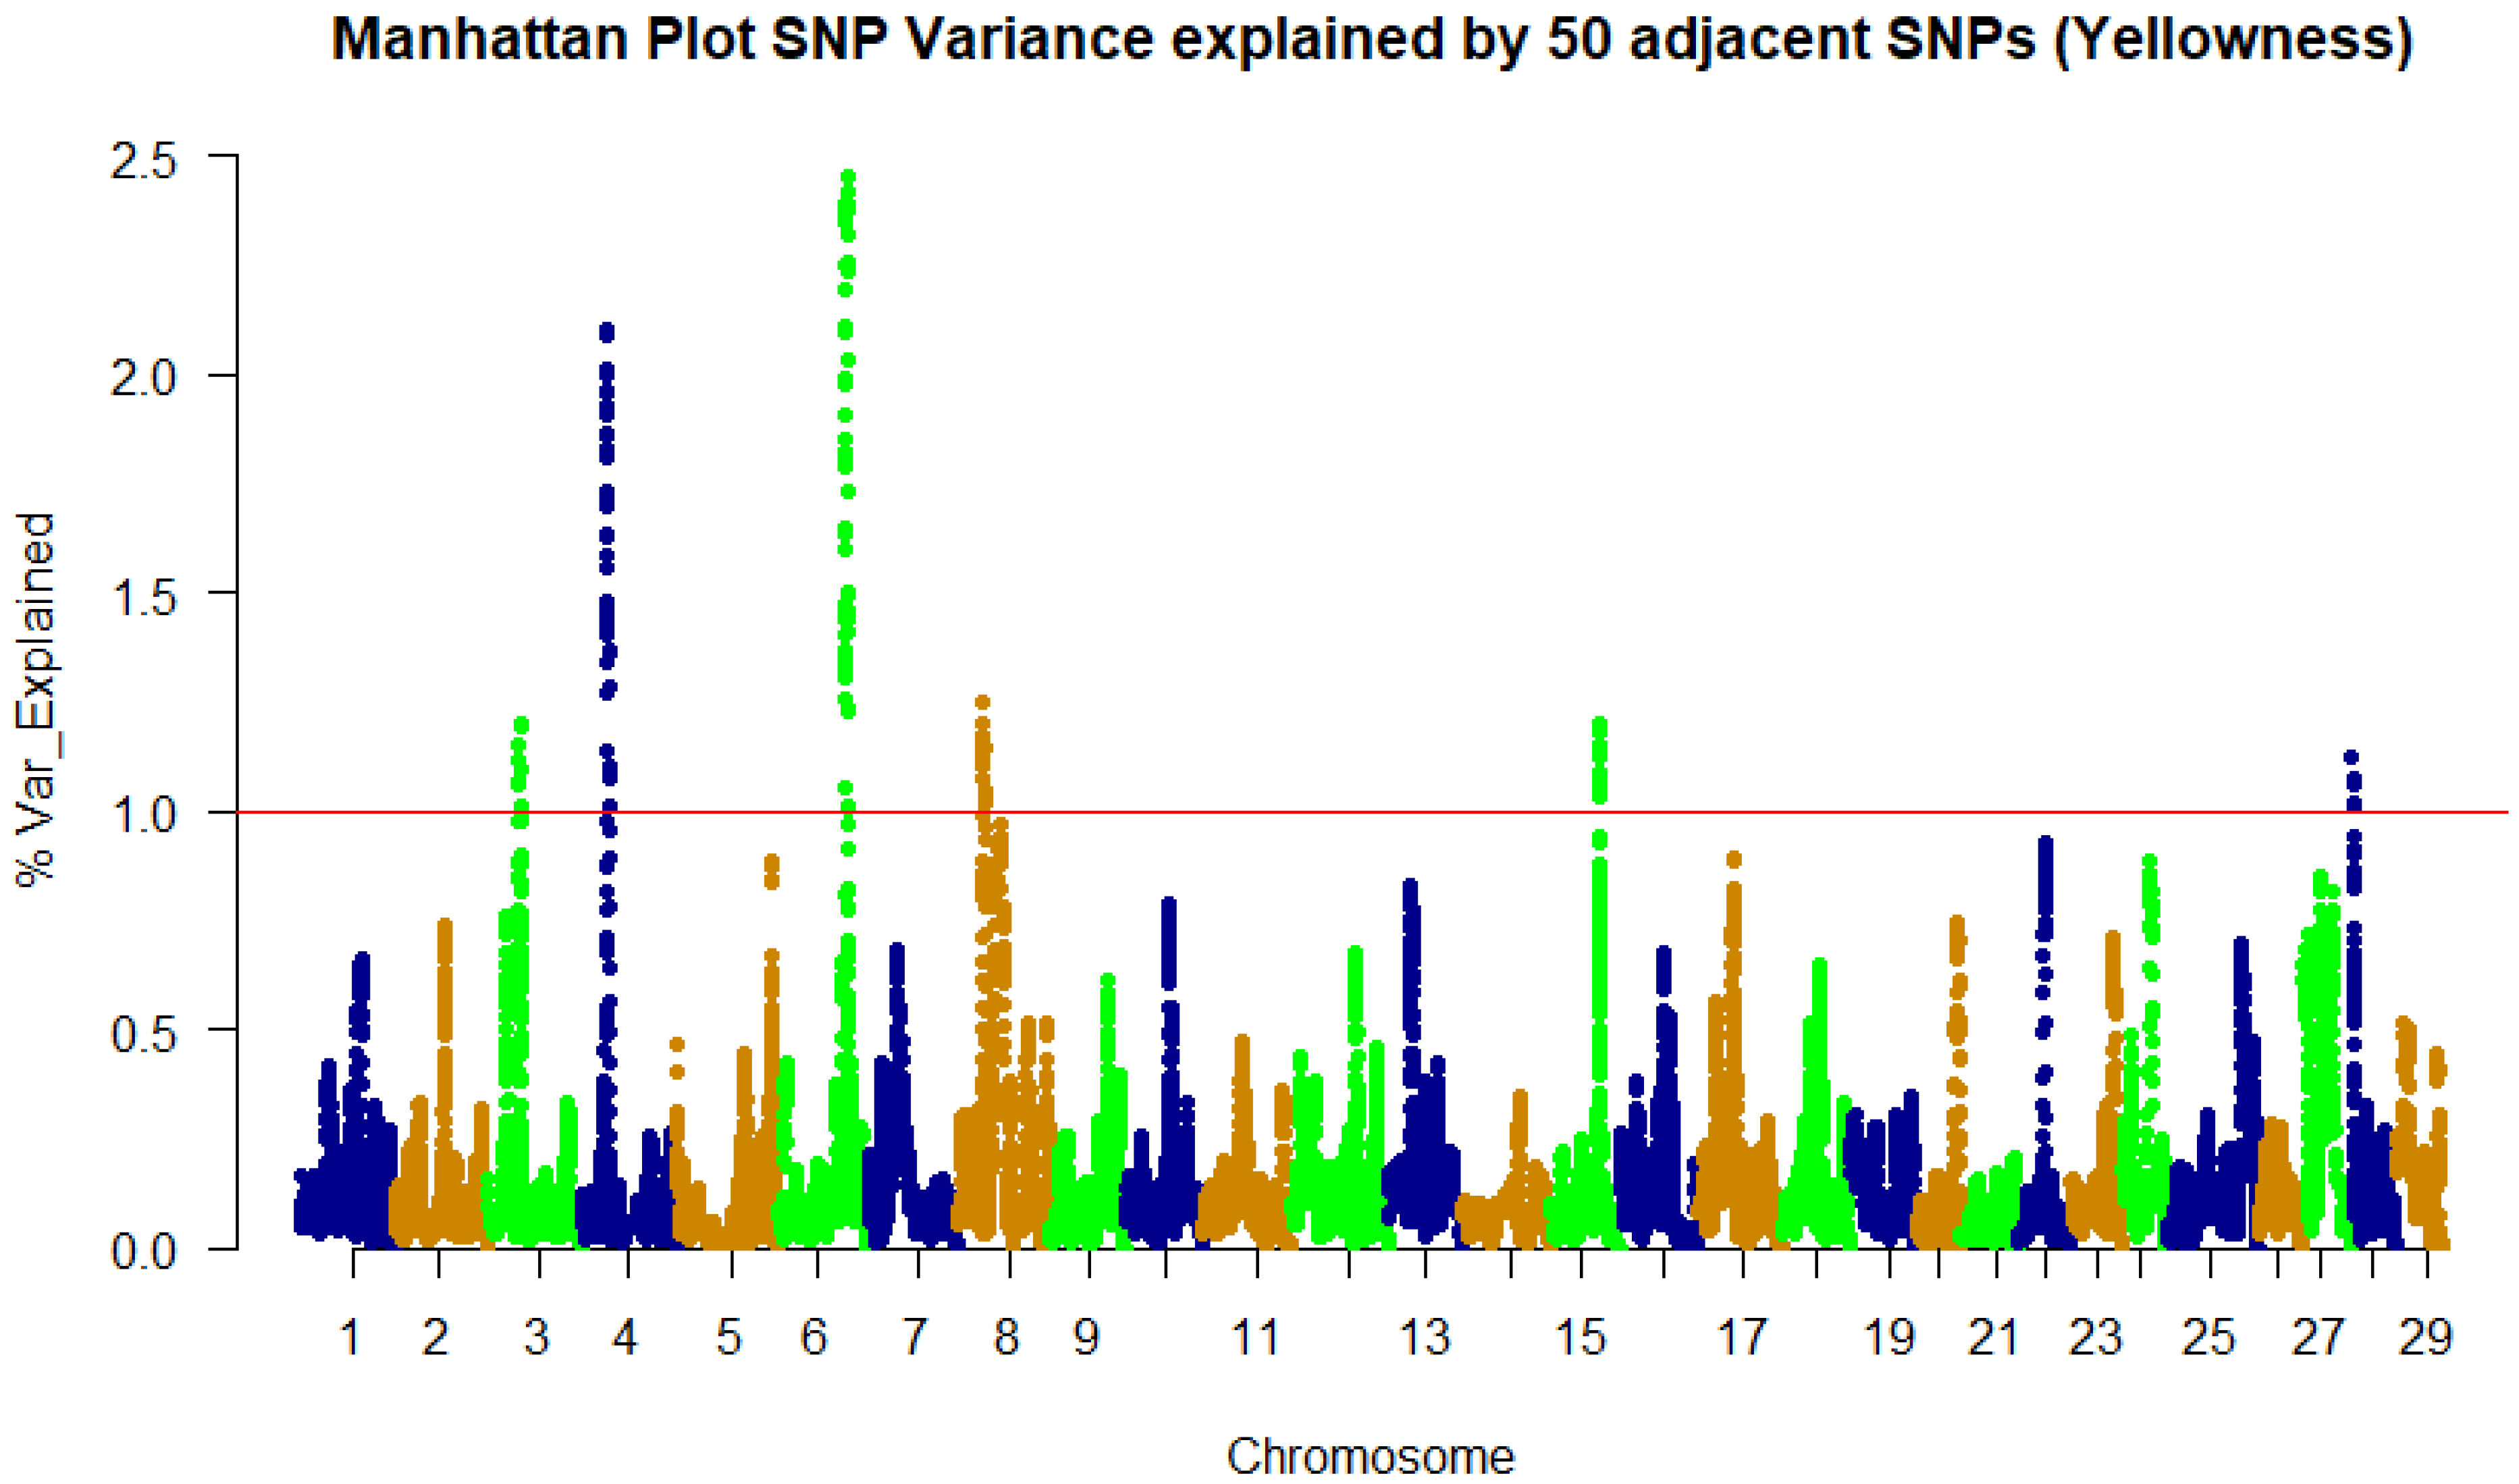
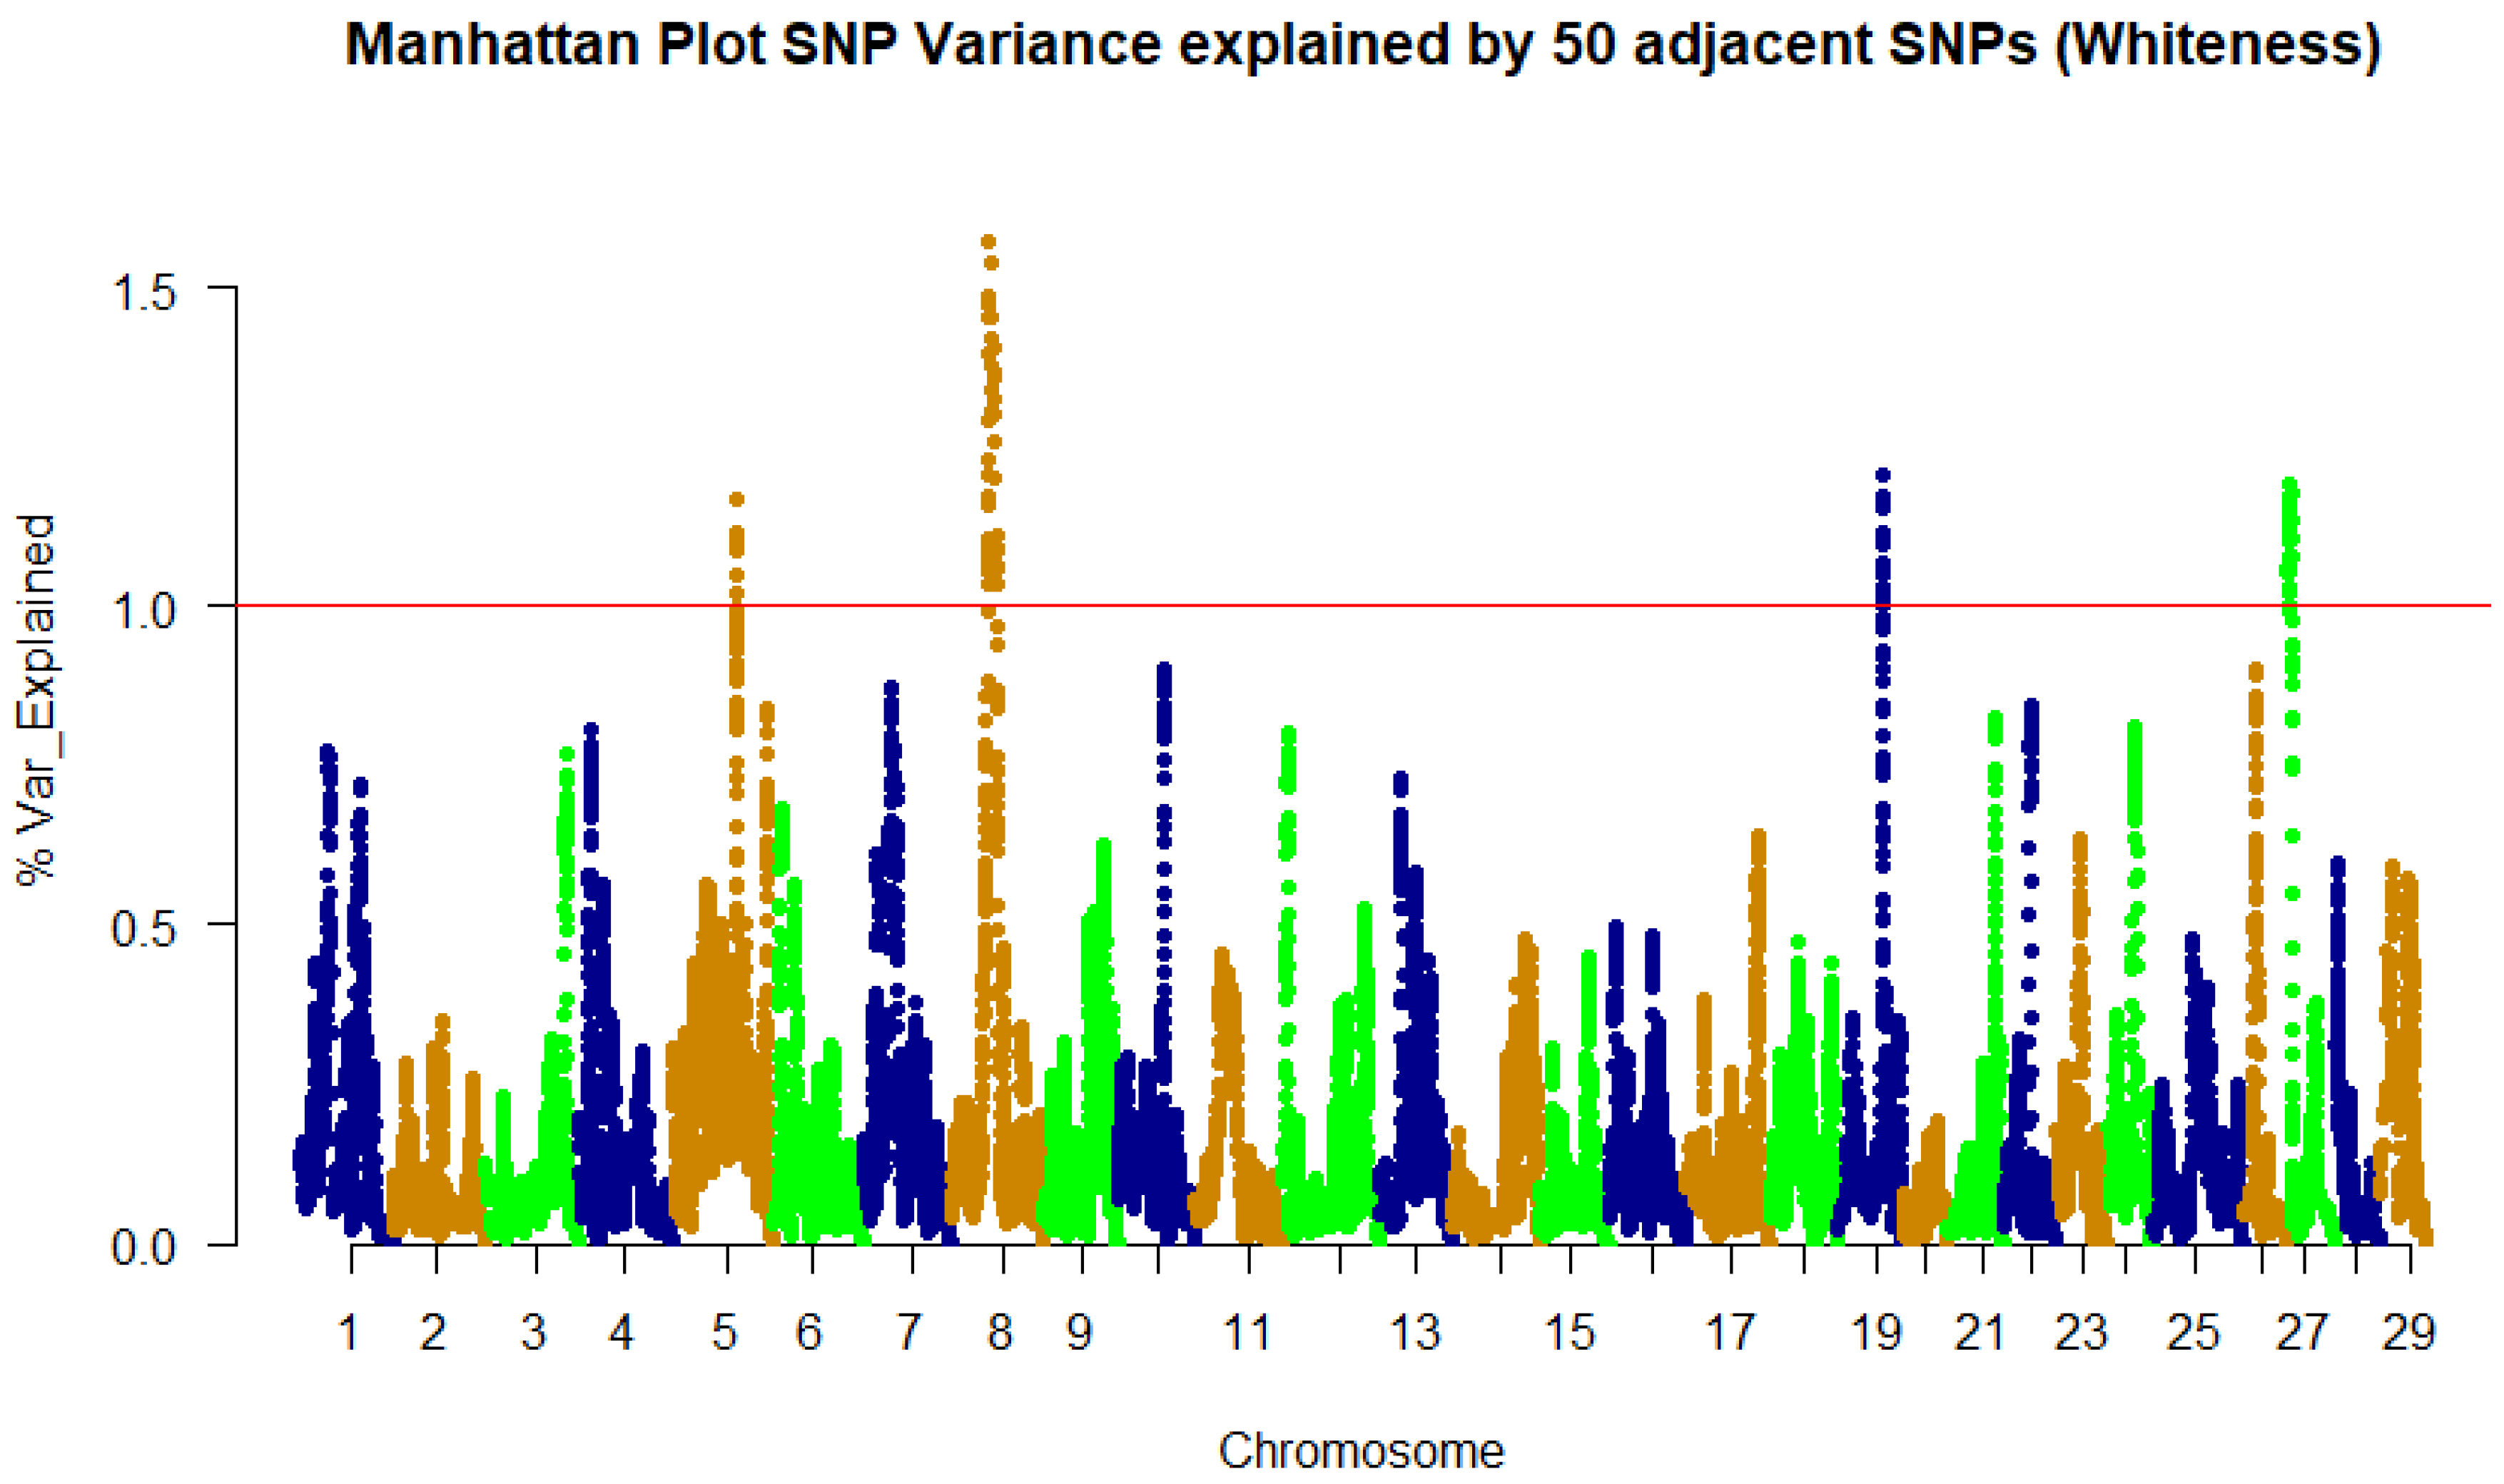
3.2. Genome-Wide Association Study and QTL Identification
3.3. MicroRNA Target Prediction
4. Discussion
4.1. Descriptive Statistics and Heritability Estimates for the Color Traits
4.2. Summary of wssGWAS for Fillet Color Traits
4.3. Genes Involved in Carotenoid Metabolism
4.4. Genes Involved in Myoglobin Homeostasis and Protection against Lipid Oxidation
4.5. Genes Involved in Maintenance of Muscle Structural Integrity
4.6. SNP Variants Alter MicroRNA Binding Sites
5. Conclusions
Supplementary Materials
Author Contributions
Funding
Institutional Review Board Statement
Informed Consent Statement
Data Availability Statement
Conflicts of Interest
Abbreviations
References
- Thorgaard, G.H.; Bailey, G.S.; Williams, D.; Buhler, D.R.; Kaattari, S.L.; Ristow, S.S.; Hansen, J.D.; Winton, J.R.; Bartholomew, J.L.; Nagler, J.J.; et al. Status and opportunities for genomics research with rainbow trout. Comp. Biochem. Physiol. B Biochem. Mol. Biol. 2002, 133, 609–646. [Google Scholar] [CrossRef]
- Turchini, G.M.; Francis, D.S.; Keast, R.S.; Sinclair, A.J. Transforming salmonid aquaculture from a consumer to a producer of long chain omega-3 fatty acids. Food Chem. 2011, 124, 609–614. [Google Scholar] [CrossRef]
- Harlioglu, A.G. Fatty acid composition, fat soluble vitamins and cholesterol content of farmed rainbow trout (Oncorhynchus mykiss). Pak. J. Zool. 2012, 44, 1013–1019. [Google Scholar]
- Zenger, K.; Khatkar, M.; Jerry, D.; Raadsma, H. The next wave in selective breeding: Implementing genomic selection in aquaculture. Proc. Proc. Assoc. Advmt. Anim. Breed. Genet. 2017, 22, 105–112. [Google Scholar]
- Ibtisham, F.; Zhang, L.; Xiao, M.; An, L.; Ramzan, M.B.; Nawab, A.; Zhao, Y.; Li, G.; Xu, Y. Genomic selection and its application in animal breeding. Thai J. Vet. Med. 2017, 47, 301. [Google Scholar]
- Ali, A.; Al-Tobasei, R.; Lourenco, D.; Leeds, T.; Kenney, B.; Salem, M. Genome-wide identification of loci associated with growth in rainbow trout. BMC Genom. 2020, 21, 209. [Google Scholar] [CrossRef] [Green Version]
- Salem, M.; Al-Tobasei, R.; Ali, A.; Lourenco, D.; Gao, G.; Palti, Y.; Kenney, B.; Leeds, T.D. Genome-Wide Association Analysis With a 50K Transcribed Gene SNP-Chip Identifies QTL Affecting Muscle Yield in Rainbow Trout. Front. Genet. 2018, 9, 387. [Google Scholar] [CrossRef]
- Ali, A.; Al-Tobasei, R.; Lourenco, D.; Leeds, T.; Kenney, B.; Salem, M. Genome-wide scan for common variants associated with intramuscular fat and moisture content in rainbow trout. BMC Genom. 2020, 21, 529. [Google Scholar] [CrossRef]
- Ali, A.; Al-Tobasei, R.; Lourenco, D.; Leeds, T.; Kenney, B.; Salem, M. Genome-Wide Association Study Identifies Genomic Loci Affecting Filet Firmness and Protein Content in Rainbow Trout. Front. Genet. 2019, 10, 386. [Google Scholar] [CrossRef]
- Vallejo, R.L.; Silva, R.M.O.; Evenhuis, J.P.; Gao, G.; Liu, S.; Parsons, J.E.; Martin, K.E.; Wiens, G.D.; Lourenco, D.A.L.; Leeds, T.D.; et al. Accurate genomic predictions for BCWD resistance in rainbow trout are achieved using low-density SNP panels: Evidence that long-range LD is a major contributing factor. J. Anim. Breed. Genet. 2018, 135, 263–274. [Google Scholar] [CrossRef] [Green Version]
- Colihueque, N. Genetics of salmonid skin pigmentation: Clues and prospects for improving the external appearance of farmed salmonids. Rev. Fish Biol. Fish. 2010, 20, 71–86. [Google Scholar] [CrossRef]
- Joseph, P.; Suman, S.P.; Li, S.; Beach, C.M.; Steinke, L.; Fontaine, M. Characterization of bison (Bison bison) myoglobin. Meat Sci. 2010, 84, 71–78. [Google Scholar] [CrossRef]
- Buttle, L.; Crampton, V.; Williams, P. The effect of feed pigment type on flesh pigment deposition and colour in farmed Atlantic salmon, Salmo salar L. Aquac. Res. 2001, 32, 103–111. [Google Scholar] [CrossRef]
- Castenmiller, J.J.; West, C.E. Bioavailability and bioconversion of carotenoids. Annu. Rev. Nutr. 1998, 18, 19–38. [Google Scholar] [CrossRef]
- Matthews, S.J.; Ross, N.W.; Lall, S.P.; Gill, T.A. Astaxanthin binding protein in Atlantic salmon. Comp. Biochem. Physiol. B Biochem. Mol. Biol. 2006, 144, 206–214. [Google Scholar] [CrossRef]
- Storebakken, T.; No, H.K. Pigmentation of rainbow trout. Aquaculture 1992, 100, 209–229. [Google Scholar] [CrossRef]
- Thomas, A.C. Astaxanthin in Juvenile Farmed Chinook salmon (Oncorhynchus tshawytscha): Effective Dietary Levels for Flesh Pigmentation and Influence on Fatty Acid Profile during Cold Temperature Storage of Fillets. Ph.D. Thesis, University of British Columbia, Vancouver, BC, Canada, 1999. [Google Scholar]
- Arredondo-Figueroa, J.L.; Mora, G.I.d.l.; Ponce-Palafox, J.T.; Barriga-Sosa, I.d.l.A.; Vernon-Carter, E.J. Color of raw, frozen, and smoked fillets of rainbow trout (Oncorhynchus mykiss) fed diets supplemented with astaxanthin and saponified red chilli (Capsicum annuum) extracts. J. Aquat. Food Prod. Technol. 2007, 16, 35–50. [Google Scholar] [CrossRef]
- Brown, K.R.; Barnes, M.; Parker, T.; Fletcher, B. Retention of fillet coloration in rainbow trout after dietary astaxanthin cessation. Fish. Aquac. J. 2016, 7, 163. [Google Scholar] [CrossRef] [Green Version]
- Crouse, C.C.; Davidson, J.W.; Good, C.M.; May, T.C.; Summerfelt, S.T.; Kenney, P.B.; Leeds, T.D.; Cleveland, B.M. Growth and fillet quality attributes of five genetic strains of rainbow trout (Oncorhynchus mykiss) reared in a partial water reuse system and harvested at different sizes. Aquac. Res. 2018, 49, 1672–1681. [Google Scholar] [CrossRef] [Green Version]
- Yabuta, S.; Masaki, M.; Shidoji, Y. Associations of Buccal Cell Telomere Length with Daily Intake of beta-Carotene or alpha-Tocopherol Are Dependent on Carotenoid Metabolism-related Gene Polymorphisms in Healthy Japanese Adults. J. Nutr. Health Aging 2016, 20, 267–274. [Google Scholar] [CrossRef]
- Lietz, G.; Oxley, A.; Leung, W.; Hesketh, J. Single nucleotide polymorphisms upstream from the beta-carotene 15,15′-monoxygenase gene influence provitamin A conversion efficiency in female volunteers. J. Nutr. 2012, 142, 161S–165S. [Google Scholar] [CrossRef] [PubMed] [Green Version]
- Le Bihan-Duval, E.; Nadaf, J.; Berri, C.; Pitel, F.; Graulet, B.; Godet, E.; Leroux, S.Y.; Demeure, O.; Lagarrigue, S.; Duby, C. Detection of a Cis eQTL controlling BMCO1 gene expression leads to the identification of a QTG for chicken breast meat color. PLoS ONE 2011, 6, e14825. [Google Scholar]
- Hessel, S.; Eichinger, A.; Isken, A.; Amengual, J.; Hunzelmann, S.; Hoeller, U.; Elste, V.; Hunziker, W.; Goralczyk, R.; Oberhauser, V.; et al. CMO1 deficiency abolishes vitamin A production from beta-carotene and alters lipid metabolism in mice. J. Biol. Chem. 2007, 282, 33553–33561. [Google Scholar] [CrossRef] [Green Version]
- Helgeland, H.; Sodeland, M.; Zoric, N.; Torgersen, J.S.; Grammes, F.; von Lintig, J.; Moen, T.; Kjoglum, S.; Lien, S.; Vage, D.I. Genomic and functional gene studies suggest a key role of beta-carotene oxygenase 1 like (bco1l) gene in salmon flesh color. Sci. Rep. 2019, 9, 20061. [Google Scholar] [CrossRef] [PubMed] [Green Version]
- Blay, C.; Haffray, P.; Bugeon, J.; D’ambrosio, J.; Dechamp, N.; Collewet, G.; Enez, F.; Petit, V.; Cousin, X.; Corraze, G. Genetic parameters and genome-wide association studies of quality traits characterised using imaging technologies in Rainbow trout, Oncorhynchus mykiss. Front. Genet. 2021, 12, 219. [Google Scholar] [CrossRef] [PubMed]
- Sae-Lim, P.; Boison, S.; Baranski, M. Multi-Trait Genome Wide Association Study in Correlated Traits: Fillet Colour and Body Weight in Atlantic Salmon; Wageningen Academic Publishers: Wageningen, The Netherlands; Available online: https://www.wageningenacademic.com/pb-assets/wagen/WCGALP2022/12_002.pdf (accessed on 22 July 2022).
- Zoric, N. Characterization of genes and gene products influencing carotenoid metabolism in Atlantic salmon. Ph.D. Thesis, Norwegian University of Life Sciences, As, Norway, 2017. [Google Scholar]
- Li, X.; Wang, S.; Xun, X.; Zhang, M.; Wang, S.; Li, H.; Zhao, L.; Fu, Q.; Wang, H.; Li, T. A carotenoid oxygenase is responsible for muscle coloration in scallop. Biochim. Biophys. Acta (BBA) Mol. Cell Biol. Lipids 2019, 1864, 966–975. [Google Scholar] [CrossRef]
- Lehnert, S.; Christensen, K.; Vandersteen, W.; Sakhrani, D.; Pitcher, T.; Heath, J.; Koop, B.; Heath, D.; Devlin, R. Carotenoid pigmentation in salmon: Variation in expression at BCO2-l locus controls a key fitness trait affecting red coloration. Proc. R. Soc. B 2019, 286, 20191588. [Google Scholar] [CrossRef] [Green Version]
- Leeds, T.D.; Vallejo, R.L.; Weber, G.M.; Gonzalez-Pena, D.; Silverstein, J.T. Response to five generations of selection for growth performance traits in rainbow trout (Oncorhynchus mykiss). Aquaculture 2016, 465, 341–351. [Google Scholar] [CrossRef] [Green Version]
- Al-Tobasei, R.; Ali, A.; Leeds, T.D.; Liu, S.; Palti, Y.; Kenney, B.; Salem, M. Identification of SNPs associated with muscle yield and quality traits using allelic-imbalance analyses of pooled RNA-Seq samples in rainbow trout. BMC Genom. 2017, 18, 582. [Google Scholar] [CrossRef] [Green Version]
- Park, J.W. Functional protein additives in surimi gels. J. Food Sci. 1994, 59, 525–527. [Google Scholar] [CrossRef]
- Misztal, I.; Tsuruta, S.; Strabel, T.; Auvray, B.; Druet, T.; Lee, D. BLUPF90 and related programs (BGF90). In Proceedings of the 7th World Congress on Genetics Applied to Livestock Production, Montpellier, France, 19–23 August 2002. [Google Scholar]
- Wang, H.; Misztal, I.; Aguilar, I.; Legarra, A.; Muir, W. Genome-wide association mapping including phenotypes from relatives without genotypes. Genet. Res. 2012, 94, 73–83. [Google Scholar] [CrossRef] [PubMed] [Green Version]
- Legarra, A.; Aguilar, I.; Misztal, I. A relationship matrix including full pedigree and genomic information. J. Dairy Sci. 2009, 92, 4656–4663. [Google Scholar] [CrossRef] [PubMed] [Green Version]
- Aguilar, I.; Misztal, I.; Johnson, D.L.; Legarra, A.; Tsuruta, S.; Lawlor, T.J. Hot topic: A unified approach to utilize phenotypic, full pedigree, and genomic information for genetic evaluation of Holstein final score. J. Dairy Sci. 2010, 93, 743–752. [Google Scholar] [CrossRef]
- Luo, Z. Computing inbreeding coefficients in large populations. Genet. Sel. Evol. 1992, 24, 305–313. [Google Scholar]
- VanRaden, P.M. Efficient methods to compute genomic predictions. J. Dairy Sci. 2008, 91, 4414–4423. [Google Scholar] [CrossRef] [Green Version]
- Turner, S.D. qqman: An R package for visualizing GWAS results using QQ and manhattan plots. Biorxiv 2014, 005165. [Google Scholar]
- Aguilar, I.; Misztal, I.; Legarra, A.; Tsuruta, S. Efficient computation of the genomic relationship matrix and other matrices used in single-step evaluation. J. Anim. Breed. Genet. 2011, 128, 422–428. [Google Scholar] [CrossRef]
- Gonzalez-Pena, D.; Gao, G.; Baranski, M.; Moen, T.; Cleveland, B.M.; Kenney, P.B.; Vallejo, R.L.; Palti, Y.; Leeds, T.D. Genome-wide association study for identifying loci that affect fillet yield, carcass, and body weight traits in rainbow trout (Oncorhynchus mykiss). Front. Genet. 2016, 7, 203. [Google Scholar] [CrossRef] [Green Version]
- Gao, N.; Chen, Y.; Liu, X.; Zhao, Y.; Zhu, L.; Liu, A.; Jiang, W.; Peng, X.; Zhang, C.; Tang, Z.; et al. Weighted single-step GWAS identified candidate genes associated with semen traits in a Duroc boar population. BMC Genom. 2019, 20, 797. [Google Scholar] [CrossRef]
- Juanchich, A.; Bardou, P.; Rue, O.; Gabillard, J.C.; Gaspin, C.; Bobe, J.; Guiguen, Y. Characterization of an extensive rainbow trout miRNA transcriptome by next generation sequencing. BMC Genom. 2016, 17, 164. [Google Scholar] [CrossRef]
- Gjerde, B.a.; Schaeffer, L. Body traits in rainbow trout: II. Estimates of heritabilities and of phenotypic and genetic correlations. Aquaculture 1989, 80, 25–44. [Google Scholar] [CrossRef]
- Haffray, P.; Enez, F.; Bugeon, J.; Chapuis, H.; Dupont-Nivet, M.; Chatain, B.; Vandeputte, M. Accuracy of BLUP breeding values in a factorial mating design with mixed families and marker-based parentage assignment in rainbow trout Oncorhynchus mykiss. Aquaculture 2018, 490, 350–354. [Google Scholar] [CrossRef] [Green Version]
- Yan, W.; Jang, G.-F.; Haeseleer, F.; Esumi, N.; Chang, J.; Kerrigan, M.; Campochiaro, M.; Campochiaro, P.; Palczewski, K.; Zack, D.J. Cloning and characterization of a human β,β-carotene-15, 15′-dioxygenase that is highly expressed in the retinal pigment epithelium. Genomics 2001, 72, 193–202. [Google Scholar] [CrossRef] [PubMed]
- Lei, C.; Li, J.; Zheng, Z.; Du, X.; Deng, Y. Molecular cloning, expression pattern of beta-carotene 15,15-dioxygenase gene and association analysis with total carotenoid content in pearl oyster Pinctada fucata martensii. Comp. Biochem. Physiol. B Biochem. Mol. Biol. 2019, 229, 34–41. [Google Scholar] [CrossRef] [PubMed]
- dela Seña, C.; Riedl, K.M.; Narayanasamy, S.; Curley, R.W.; Schwartz, S.J.; Harrison, E.H. The human enzyme that converts dietary provitamin A carotenoids to vitamin A is a dioxygenase. J. Biol. Chem. 2014, 289, 13661–13666. [Google Scholar] [CrossRef] [PubMed] [Green Version]
- Huang, Y.; Zhang, L.; Wang, G.; Huang, S. De novo assembly transcriptome analysis reveals the genes associated with body color formation in the freshwater ornamental shrimps Neocaridina denticulate sinensis. Gene 2022, 806, 145929. [Google Scholar] [CrossRef] [PubMed]
- Chisté, R.C.; Freitas, M.; Mercadante, A.Z.; Fernandes, E. Carotenoids inhibit lipid peroxidation and hemoglobin oxidation, but not the depletion of glutathione induced by ROS in human erythrocytes. Life Sci. 2014, 99, 52–60. [Google Scholar] [CrossRef]
- Grauso, M.; Lan, A.; Andriamihaja, M.; Bouillaud, F.; Blachier, F. Hyperosmolar environment and intestinal epithelial cells: Impact on mitochondrial oxygen consumption, proliferation, and barrier function in vitro. Sci. Rep. 2019, 9, 11360. [Google Scholar] [CrossRef]
- Ramanathan, R.; Nair, M.; Hunt, M.; Suman, S. Mitochondrial functionality and beef colour: A review of recent research. South Afr. J. Anim. Sci. 2019, 49, 9–19. [Google Scholar] [CrossRef]
- Ottestad, S.; Sørheim, O.; Heia, K.; Skaret, J.; Wold, J.P. Effects of storage atmosphere and heme state on the color and visible reflectance spectra of salmon (Salmo salar) fillets. J. Agric. Food Chem. 2011, 59, 7825–7831. [Google Scholar] [CrossRef]
- Tintchev, F.; Kuhlmann, U.; Wackerbarth, H.; Töpfl, S.; Heinz, V.; Knorr, D.; Hildebrandt, P. Redox processes in pressurised smoked salmon studied by resonance Raman spectroscopy. Food Chem. 2009, 112, 482–486. [Google Scholar] [CrossRef]
- Mancini, R.A.; Ramanathan, R. Effects of postmortem storage time on color and mitochondria in beef. Meat Sci. 2014, 98, 65–70. [Google Scholar] [CrossRef] [PubMed]
- Tang, J.; Faustman, C.; Hoagland, T.A.; Mancini, R.A.; Seyfert, M.; Hunt, M.C. Postmortem oxygen consumption by mitochondria and its effects on myoglobin form and stability. J. Agric. Food Chem. 2005, 53, 1223–1230. [Google Scholar] [CrossRef] [PubMed]
- Banerjee, R.; Vlasie, M. Controlling the reactivity of radical intermediates by coenzyme B12-dependent methylmalonyl-CoA mutase. Biochem. Soc. Trans. 2002, 30, 621–624. [Google Scholar] [CrossRef] [PubMed] [Green Version]
- Yabuuchi, H.; Tanaka, K.; Maeda, M.; Takemura, M.; Oka, M.; Ohashi, R.; Tamai, I. Cloning of the dog bile salt export pump (BSEP.; ABCB11) and functional comparison with the human and rat proteins. Biopharm. Drug Dispos. 2008, 29, 441–448. [Google Scholar] [CrossRef] [PubMed]
- Paulusma, C.C.; de Waart, D.R.; Kunne, C.; Mok, K.S.; Elferink, R.P.O. Activity of the bile salt export pump (ABCB11) is critically dependent on canalicular membrane cholesterol content. J. Biol. Chem. 2009, 284, 9947–9954. [Google Scholar] [CrossRef] [PubMed] [Green Version]
- Hayashi, H.; Inamura, K.; Aida, K.; Naoi, S.; Horikawa, R.; Nagasaka, H.; Takatani, T.; Fukushima, T.; Hattori, A.; Yabuki, T.; et al. AP2 adaptor complex mediates bile salt export pump internalization and modulates its hepatocanalicular expression and transport function. Hepatology 2012, 55, 1889–1900. [Google Scholar] [CrossRef]
- Bellanti, F.; Villani, R.; Facciorusso, A.; Vendemiale, G.; Serviddio, G. Lipid oxidation products in the pathogenesis of non-alcoholic steatohepatitis. Free Radic. Biol. Med. 2017, 111, 173–185. [Google Scholar] [CrossRef]
- Stofan, M.; Guo, G.L. Bile Acids and FXR: Novel Targets for Liver Diseases. Front. Med. 2020, 7, 544. [Google Scholar] [CrossRef]
- Faustman, C.; Sun, Q.; Mancini, R.; Suman, S.P. Myoglobin and lipid oxidation interactions: Mechanistic bases and control. Meat Sci. 2010, 86, 86–94. [Google Scholar] [CrossRef]
- Liu, F.; Dai, R.; Zhu, J.; Li, X. Optimizing color and lipid stability of beef patties with a mixture design incorporating with tea catechins, carnosine, and α-tocopherol. J. Food Eng. 2010, 98, 170–177. [Google Scholar] [CrossRef]
- Chen, C.; Yu, Q.; Han, L.; Zhang, J.; Guo, Z. Effects of aldehyde products of lipid oxidation on the color stability and metmyoglobin reducing ability of bovine Longissimus muscle. Anim. Sci. J. 2018, 89, 810–816. [Google Scholar] [CrossRef] [PubMed]
- Esterbauer, H.; Schaur, R.J.; Zollner, H. Chemistry and biochemistry of 4-hydroxynonenal, malonaldehyde and related aldehydes. Free Radic. Biol. Med. 1991, 11, 81–128. [Google Scholar] [CrossRef]
- Grattagliano, I.; Ciampi, S.A.; Portincasa, P. Gallbladder disease: Relevance of oxidative stress. In Gastrointestinal Tissue; Elsevier: Amsterdam, The Netherlands, 2017; pp. 187–194. [Google Scholar]
- Arihara, K.; Cassens, R.G.; Greaser, M.L.; Luchansky, J.B.; Mozdziak, P.E. Localization of metmyoglobin-reducing enzyme (NADH-cytochrome b5 reductase) system components in bovine skeletal muscle. Meat Sci. 1995, 39, 205–213. [Google Scholar] [CrossRef]
- Seyfert, M.; Mancini, R.A.; Hunt, M.C.; Tang, J.; Faustman, C.; Garcia, M. Color stability, reducing activity, and cytochrome c oxidase activity of five bovine muscles. J. Agric. Food Chem. 2006, 54, 8919–8925. [Google Scholar] [CrossRef]
- Mora, L.; Gallego, M.; Aristoy, M.C.; Fraser, P.D.; Toldrá, F. Peptides naturally generated from ubiquitin-60S ribosomal protein as potential biomarkers of dry-cured ham processing time. Food Control 2015, 48, 102–107. [Google Scholar] [CrossRef] [Green Version]
- Liu, Y.; Du, M.; Li, X.; Chen, L.; Shen, Q.; Tian, J.; Zhang, D. Role of the ubiquitin-proteasome pathway on proteolytic activity in postmortem proteolysis and tenderisation of sheep skeletal muscle. Int. J. Food Sci. Technol. 2016, 51, 2353–2359. [Google Scholar] [CrossRef]
- Fayemi, P.; Muchenje, V. Expression of ovine ubiquitin C-terminal hydroxylase 1, pH and colour of variety meats from head-stunned Dohne Merino sheep. S. Afr. J. Anim. Sci. 2018, 48, 88–97. [Google Scholar] [CrossRef] [Green Version]
- Zheng, Q.; Zhang, Y.; Chen, Y.; Yang, N.; Wang, X.J.; Zhu, D. Systematic identification of genes involved in divergent skeletal muscle growth rates of broiler and layer chickens. BMC Genom. 2009, 10, 87. [Google Scholar] [CrossRef] [Green Version]
- Harrigan, J.A.; Jacq, X.; Martin, N.M.; Jackson, S.P. Deubiquitylating enzymes and drug discovery: Emerging opportunities. Nat. Rev. Drug Discov. 2018, 17, 57–78. [Google Scholar] [CrossRef]
- Damon, M.; Wyszynska-Koko, J.; Vincent, A.; Herault, F.; Lebret, B. Comparison of muscle transcriptome between pigs with divergent meat quality phenotypes identifies genes related to muscle metabolism and structure. PLoS ONE 2012, 7, e33763. [Google Scholar] [CrossRef] [PubMed] [Green Version]
- Gao, H.; Antony, R.; Srinivasan, R.; Wu, P.; Wang, X.; Li, Y. UCHL1 regulates oxidative activity in skeletal muscle. PLoS ONE 2020, 15, e0241716. [Google Scholar] [CrossRef] [PubMed]
- Gao, H.; Hartnett, S.; Li, Y. Ubiquitin C-Terminal Hydrolase L1 regulates myoblast proliferation and differentiation. Biochem. Biophys. Res. Commun. 2017, 492, 96–102. [Google Scholar] [CrossRef] [PubMed]
- Wu, W.; Gao, X.-G.; Dai, Y.; Fu, Y.; Li, X.-M.; Dai, R.-T. Post-mortem changes in sarcoplasmic proteome and its relationship to meat color traits in M. semitendinosus of Chinese Luxi yellow cattle. Food Res. Int. 2015, 72, 98–105. [Google Scholar] [CrossRef]
- Zhang, Y.-M.; Zhang, X.-Z.; Wang, T.-T.; Hopkins, D.L.; Mao, Y.-W.; Liang, R.-R.; Yang, G.-F.; Xin, L.; Zhu, L.-X. Implications of step-chilling on meat color investigated using proteome analysis of the sarcoplasmic protein fraction of beef longissimus lumborum muscle. J. Integr. Agric. 2018, 17, 2118–2125. [Google Scholar] [CrossRef] [Green Version]
- Joseph, P.; Suman, S.P.; Rentfrow, G.; Li, S.; Beach, C.M. Proteomics of muscle-specific beef color stability. J. Agric. Food Chem. 2012, 60, 3196–3203. [Google Scholar] [CrossRef]
- Cartwright, G.M.; Scott, B. Redox regulation of an AP-1-like transcription factor, YapA, in the fungal symbiont Epichloe festucae. Eukaryot. Cell 2013, 12, 1335–1348. [Google Scholar] [CrossRef] [Green Version]
- Takahashi, M.; Yamashita, K.; Shiozawa, A.; Ichiishi, A.; Fukumori, F.; Fujimura, M. An AP-1-like transcription factor, NAP-1, regulates expression of the glutathione S-transferase and NADH: Flavin oxidoreductase genes in Neurospora crassa. Biosci. Biotechnol. Biochem. 2010, 74, 746–752. [Google Scholar] [CrossRef] [Green Version]
- Jia, X.; Veiseth-Kent, E.; Grove, H.; Kuziora, P.; Aass, L.; Hildrum, K.; Hollung, K. Peroxiredoxin-6—A potential protein marker for meat tenderness in bovine longissimus thoracis muscle. J. Anim. Sci. 2009, 87, 2391–2399. [Google Scholar] [CrossRef] [Green Version]
- Subramaniyan, S.A.; Kang, D.R.; Jung, Y.C.; Jung, J.H.; Choi, Y.I.; Lee, M.J.; Choe, H.S.; Shim, K.S. Comparative studies of meat quality traits and the proteome profile between low-and high-pH muscles in longissimus dorsi of Berkshire. Can. J. Anim. Sci. 2017, 97, 640–649. [Google Scholar] [CrossRef] [Green Version]
- Wu, W.; Yu, Q.-Q.; Fu, Y.; Tian, X.-J.; Jia, F.; Li, X.-M.; Dai, R.-T. Towards muscle-specific meat color stability of Chinese Luxi yellow cattle: A proteomic insight into post-mortem storage. J. Proteom. 2016, 147, 108–118. [Google Scholar] [CrossRef] [PubMed]
- Yang, X.; Wu, S.; Hopkins, D.L.; Liang, R.; Zhu, L.; Zhang, Y.; Luo, X. Proteomic analysis to investigate color changes of chilled beef longissimus steaks held under carbon monoxide and high oxygen packaging. Meat Sci. 2018, 142, 23–31. [Google Scholar] [CrossRef] [PubMed]
- Jia, W.; Zhang, R.; Liu, L.; Zhu, Z.; Xu, M.; Shi, L. Molecular mechanism of protein dynamic change for Hengshan goat meat during freezing storage based on high-throughput proteomics. Food Res. Int. 2021, 143, 110289. [Google Scholar] [CrossRef] [PubMed]
- Grant, C.M.; Collinson, L.P.; Roe, J.H.; Dawes, I.W. Yeast glutathione reductase is required for protection against oxidative stress and is a target gene for yAP-1 transcriptional regulation. Mol. Microbiol. 1996, 21, 171–179. [Google Scholar] [CrossRef] [PubMed]
- Lee, J.; Godon, C.; Lagniel, G.; Spector, D.; Garin, J.; Labarre, J.; Toledano, M.B. Yap1 and Skn7 control two specialized oxidative stress response regulons in yeast. J. Biol. Chem. 1999, 274, 16040–16046. [Google Scholar] [CrossRef] [PubMed] [Green Version]
- Chan, K.M.; Decker, E.A. Endogenous skeletal muscle antioxidants. Crit. Rev. Food Sci. Nutr. 1994, 34, 403–426. [Google Scholar] [CrossRef]
- Nohl, H.; Breuninger, V.; Hegner, D. Influence of mitochondrial radical formation on energy-linked respiration. Eur. J. Biochem. 1978, 90, 385–390. [Google Scholar] [CrossRef]
- Gao, X.; Wu, W.; Ma, C.; Li, X.; Dai, R. Postmortem changes in sarcoplasmic proteins associated with color stability in lamb muscle analyzed by proteomics. Eur. Food Res. Technol. 2016, 242, 527–535. [Google Scholar] [CrossRef]
- Lee, T.T.; Ciou, J.Y.; Chen, C.L.; Yu, B. Effect of Echinacea purpurea L. on oxidative status and meat quality in Arbor Acres broilers. J. Sci. Food Agric. 2013, 93, 166–172. [Google Scholar] [CrossRef]
- Budanov, A.V.; Shoshani, T.; Faerman, A.; Zelin, E.; Kamer, I.; Kalinski, H.; Gorodin, S.; Fishman, A.; Chajut, A.; Einat, P.; et al. Identification of a novel stress-responsive gene Hi95 involved in regulation of cell viability. Oncogene 2002, 21, 6017–6031. [Google Scholar] [CrossRef] [Green Version]
- Sablina, A.A.; Budanov, A.V.; Ilyinskaya, G.V.; Agapova, L.S.; Kravchenko, J.E.; Chumakov, P.M. The antioxidant function of the p53 tumor suppressor. Nat. Med. 2005, 11, 1306–1313. [Google Scholar] [CrossRef] [PubMed] [Green Version]
- Budanov, A.V.; Sablina, A.A.; Feinstein, E.; Koonin, E.V.; Chumakov, P.M. Regeneration of peroxiredoxins by p53-regulated sestrins, homologs of bacterial AhpD. Science 2004, 304, 596–600. [Google Scholar] [CrossRef] [PubMed] [Green Version]
- Hanan, T.; Shaklai, N. Peroxidative interaction of myoglobin and myosin. Eur. J. Biochem. 1995, 233, 930–936. [Google Scholar] [CrossRef]
- Chaijan, M.; Benjakul, S.; Visessanguan, W.; Faustman, C. Interaction between fish myoglobin and myosin in vitro. Food Chem. 2007, 103, 1168–1175. [Google Scholar] [CrossRef]
- Sellers, J.R. Myosins: A diverse superfamily. Biochim. Biophys. Acta 2000, 1496, 3–22. [Google Scholar] [CrossRef] [Green Version]
- Nonhoff, U.; Ralser, M.; Welzel, F.; Piccini, I.; Balzereit, D.; Yaspo, M.-L.; Lehrach, H.; Krobitsch, S. Ataxin-2 interacts with the DEAD/H-box RNA helicase DDX6 and interferes with P-bodies and stress granules. Mol. Biol. Cell 2007, 18, 1385–1396. [Google Scholar] [CrossRef]
- Kobayashi, T.; Winslow, S.; Sunesson, L.; Hellman, U.; Larsson, C. PKCα binds G3BP2 and regulates stress granule formation following cellular stress. PLoS ONE 2012, 7, e35820. [Google Scholar] [CrossRef] [Green Version]
- Byrd, A.K.; Zybailov, B.L.; Maddukuri, L.; Gao, J.; Marecki, J.C.; Jaiswal, M.; Bell, M.R.; Griffin, W.C.; Reed, M.R.; Chib, S. Evidence that G-quadruplex DNA accumulates in the cytoplasm and participates in stress granule assembly in response to oxidative stress. J. Biol. Chem. 2016, 291, 18041–18057. [Google Scholar] [CrossRef] [Green Version]
- Chen, L.; Liu, B. Relationships between stress granules, oxidative stress, and neurodegenerative diseases. Oxidative Med. Cell. Longev. 2017, 2017, 1809592. [Google Scholar] [CrossRef] [Green Version]
- Gupta, V.A.; Beggs, A.H. Kelch proteins: Emerging roles in skeletal muscle development and diseases. Skelet Muscle 2014, 4, 11. [Google Scholar] [CrossRef] [Green Version]
- Gupta, V.A.; Ravenscroft, G.; Shaheen, R.; Todd, E.J.; Swanson, L.C.; Shiina, M.; Ogata, K.; Hsu, C.; Clarke, N.F.; Darras, B.T. Identification of KLHL41 mutations implicates BTB-Kelch-mediated ubiquitination as an alternate pathway to myofibrillar disruption in nemaline myopathy. Am. J. Hum. Genet. 2013, 93, 1108–1117. [Google Scholar] [CrossRef] [Green Version]
- Kiessling, A.; Espe, M.; Ruohonen, K.; Mørkøre, T. Texture, gaping and colour of fresh and frozen Atlantic salmon flesh as affected by pre-slaughter iso-eugenol or CO2 anaesthesia. Aquaculture 2004, 236, 645–657. [Google Scholar] [CrossRef]
- Gagaoua, M.; Bonnet, M.; De Koning, L.; Picard, B. Reverse Phase Protein array for the quantification and validation of protein biomarkers of beef qualities: The case of meat color from Charolais breed. Meat Sci. 2018, 145, 308–319. [Google Scholar] [CrossRef] [PubMed]
- Hughes, J.; Oiseth, S.; Purslow, P.; Warner, R. A structural approach to understanding the interactions between colour, water-holding capacity and tenderness. Meat Sci. 2014, 98, 520–532. [Google Scholar] [CrossRef] [PubMed]
- Ramirez-Martinez, A.; Cenik, B.K.; Bezprozvannaya, S.; Chen, B.; Bassel-Duby, R.; Liu, N.; Olson, E.N. KLHL41 stabilizes skeletal muscle sarcomeres by nonproteolytic ubiquitination. Elife 2017, 6, e26439. [Google Scholar] [CrossRef] [PubMed]
- Ravenscroft, G.; Miyatake, S.; Lehtokari, V.L.; Todd, E.J.; Vornanen, P.; Yau, K.S.; Hayashi, Y.K.; Miyake, N.; Tsurusaki, Y.; Doi, H.; et al. Mutations in KLHL40 are a frequent cause of severe autosomal-recessive nemaline myopathy. Am. J. Hum. Genet. 2013, 93, 6–18. [Google Scholar] [CrossRef] [Green Version]
- Kong, H.R.; Anthony, N.B.; Rowland, K.C.; Khatri, B.; Kong, B.C. Genome re-sequencing to identify single nucleotide polymorphism markers for muscle color traits in broiler chickens. Asian-Australas J. Anim Sci. 2018, 31, 13–18. [Google Scholar] [CrossRef] [Green Version]
- Bailey, A.J.; Light, N.D. Connective Tissue in Meat and Meat Products; Elsevier Applied Science: Amsterdam, The Netherlands, 1989. [Google Scholar]
- McCormick, R.J. Extracellular modifications to muscle collagen: Implications for meat quality. Poult. Sci. 1999, 78, 785–791. [Google Scholar] [CrossRef]
- Ogasawara, S.; Cheng, X.W.; Inoue, A.; Hu, L.; Piao, L.; Yu, C.; Goto, H.; Xu, W.; Zhao, G.; Lei, Y.; et al. Cathepsin K activity controls cardiotoxin-induced skeletal muscle repair in mice. J. Cachexia Sarcopenia Muscle 2018, 9, 160–175. [Google Scholar] [CrossRef]
- Kwon, H.-S.; Lee, H.-S.; Rubin, J.; Tomarev, S. Myocilin May Regulate Actin Cytoskeleton Through Components of Wnt Signaling Pathway. Investig. Ophthalmol. Vis. Sci. 2008, 49, 5111. [Google Scholar]
- Wu, H.; Yesilyurt, H.G.; Yoon, J.; Terman, J.R. The MICALs are a family of F-actin dismantling oxidoreductases conserved from Drosophila to humans. Sci. Rep. 2018, 8, 937. [Google Scholar] [CrossRef] [PubMed]
- Lundquist, M.R.; Storaska, A.J.; Liu, T.-C.; Larsen, S.D.; Evans, T.; Neubig, R.R.; Jaffrey, S.R. Redox modification of nuclear actin by MICAL-2 regulates SRF signaling. Cell 2014, 156, 563–576. [Google Scholar] [CrossRef] [PubMed] [Green Version]
- Ługowska, A.; Hetmańczyk-Sawicka, K.; Iwanicka-Nowicka, R.; Fogtman, A.; Cieśla, J.; Purzycka-Olewiecka, J.K.; Sitarska, D.; Płoski, R.; Filocamo, M.; Lualdi, S. Gene expression profile in patients with Gaucher disease indicates activation of inflammatory processes. Sci. Rep. 2019, 9, 6060. [Google Scholar] [CrossRef] [PubMed] [Green Version]
- Tarique, T.; Yang, S.; Mohsina, Z.; Qiu, J.; Yan, Z.; Chen, G.; Chen, A. Identification of genes involved in regulatory mechanism of pigments in broiler chickens. Genet. Mol. Res. 2014, 13, 7201–7216. [Google Scholar] [CrossRef]
- Bartel, D.P. MicroRNAs: Genomics, biogenesis, mechanism, and function. Cell 2004, 116, 281–297. [Google Scholar] [CrossRef] [Green Version]
- Kutter, C.; Svoboda, P. miRNA, siRNA, piRNA: Knowns of the Unknown; Taylor & Francis: Oxfordshire, UK, 2008. [Google Scholar]
- He, L.; Hannon, G.J. MicroRNAs: Small RNAs with a big role in gene regulation. Nat. Rev. Genet. 2004, 5, 522–531. [Google Scholar] [CrossRef]
- Clop, A.; Marcq, F.; Takeda, H.; Pirottin, D.; Tordoir, X.; Bibe, B.; Bouix, J.; Caiment, F.; Elsen, J.M.; Eychenne, F.; et al. A mutation creating a potential illegitimate microRNA target site in the myostatin gene affects muscularity in sheep. Nat. Genet. 2006, 38, 813–818. [Google Scholar] [CrossRef]
- Shi, J.; Sun, G. Effect of pre-miRNA-1658 gene polymorphism on chicken growth and carcass traits. Asian-Australas J. Anim. Sci. 2017, 30, 455–461. [Google Scholar] [CrossRef] [PubMed]
- Li, H.; Jiang, K.; Wang, S.; Liu, X.; Kang, X.; Jiang, R.; Li, Z.; Sun, G. Assessment of correlation between pre-miRNA-1757 polymorphism and chicken performance traits. Genet. Mol. Res. 2015, 14, 12184–12195. [Google Scholar] [CrossRef]
- Morimoto, R.I. Regulation of the heat shock transcriptional response: Cross talk between a family of heat shock factors, molecular chaperones, and negative regulators. Genes Dev. 1998, 12, 3788–3796. [Google Scholar] [CrossRef] [Green Version]
- Arya, R.; Mallik, M.; Lakhotia, S.C. Heat shock genes—Integrating cell survival and death. J. Biosci. 2007, 32, 595–610. [Google Scholar] [CrossRef] [PubMed]
- Kaźmierczuk, A.; Kiliańska, Z.M. Plejotropowa aktywność białek szoku cieplnego The pleiotropic activity of heat-shock proteins. Postepy Hig. Med. Dosw. 2009, 63, 502–521. [Google Scholar]
- Zychowska, M.; Jastrzebski, Z.; Chruscinski, G.; Michalowska-Sawczyn, M.; Nowak-Zaleska, A. Vitamin C, A and E supplementation decreases the expression of HSPA1A and HSPB1 genes in the leukocytes of young polish figure skaters during a 10-day training camp. J. Int. Soc. Sports Nutr. 2015, 12, 9. [Google Scholar] [CrossRef] [Green Version]
- Alexander, C.C.; Munkascy, E.; Tillmon, H.; Fraker, T.; Scheirer, J.; Holstein, D.; Lozano, D.; Khan, M.; Gidalevitz, T.; Lechleiter, J.D.; et al. HspB1 Overexpression Improves Life Span and Stress Resistance in an Invertebrate Model. J. Gerontol. A Biol. Sci. Med. Sci. 2022, 77, 268–275. [Google Scholar] [CrossRef] [PubMed]
- Terra, L.F.; Wailemann, R.A.; Dos Santos, A.F.; Gomes, V.M.; Silva, R.P.; Laporte, A.; Meotti, F.C.; Terra, W.R.; Palmisano, G.; Lortz, S. Heat shock protein B1 is a key mediator of prolactin-induced beta-cell cytoprotection against oxidative stress. Free Radic. Biol. Med. 2019, 134, 394–405. [Google Scholar] [CrossRef] [PubMed]
- Liu, X.; Xiao, W.; Jiang, Y.; Zou, L.; Chen, F.; Xiao, W.; Zhang, X.; Cao, Y.; Xu, L.; Zhu, Y. Bmal1 Regulates the Redox Rhythm of HSPB1, and Homooxidized HSPB1 Attenuates the Oxidative Stress Injury of Cardiomyocytes. Oxidative Med. Cell. Longev. 2021, 2021, 5542815. [Google Scholar] [CrossRef]
- Liu, X.; Liu, Y.; Jiang, Y.; Zou, L.; Liu, K.; Liu, M.; Zou, J.; Tan, S.; Wang, K.; Chen, F. Homo-oxidized HSPB1 protects cardiomyocytes against oxidative stress via targeting Keap1/Nrf-2 signaling pathway. J. Mol. Cell. Cardiol. 2020, 140, 37–38. [Google Scholar] [CrossRef]
- Zhang, Y.; Johnson, K.; Russell, R.G.G.; Wordsworth, B.P.; Carr, A.J.; Terkeltaub, R.A.; Brown, M.A. Association of sporadic chondrocalcinosis with a− 4-basepair G-to-A transition in the 5′-untranslated region of ANKH that promotes enhanced expression of ANKH protein and excess generation of extracellular inorganic pyrophosphate. Arthritis Rheum. 2005, 52, 1110–1117. [Google Scholar] [CrossRef]
- Wu, H.J.; Seib, K.L.; Srikhanta, Y.N.; Edwards, J.; Kidd, S.P.; Maguire, T.L.; Hamilton, A.; Pan, K.T.; Hsiao, H.H.; Yao, C.W.; et al. Manganese regulation of virulence factors and oxidative stress resistance in Neisseria gonorrhoeae. J. Proteom. 2010, 73, 899–916. [Google Scholar] [CrossRef] [Green Version]
- Yuan, F.L.; Xu, R.S.; Ye, J.X.; Zhao, M.D.; Ren, L.J.; Li, X. Apoptotic bodies from endplate chondrocytes enhance the oxidative stress-induced mineralization by regulating PPi metabolism. J. Cell. Mol. Med. 2019, 23, 3665–3675. [Google Scholar] [CrossRef]
- Gutiérrez-Luna, F.M.; Hernández-Domínguez, E.E.; Valencia-Turcotte, L.G.; Rodríguez-Sotres, R. Pyrophosphate and pyrophosphatases in plants, their involvement in stress responses and their possible relationship to secondary metabolism. Plant Sci. 2018, 267, 11–19. [Google Scholar] [CrossRef] [PubMed]


| Trait | N | Mean | SD | Min | Max | CV (%) | h2 (SE) | |||
|---|---|---|---|---|---|---|---|---|---|---|
| Redness | 878 | 1.98 | 1.06 | −0.17 | 5.833 | 0.54 | 0.08 | 0.04 | 0.38 | 0.16 ± 0.06 |
| Yellowness | 878 | 4.41 | 1.31 | −0.79 | 8.123 | 0.30 | 0.52 | 0.16 | 0.67 | 0.39 ± 0.07 |
| Lightness | 878 | 44.54 | 2.74 | 38.17 | 54.81 | 0.06 | 1.23 | 0.33 | 4.13 | 0.22 ± 0.07 |
| Whiteness | 878 | 44.3 | 2.64 | 38.11 | 54.22 | 0.06 | 1.13 | 0.31 | 3.92 | 0.21 ± 0.06 |
| Redness | |||||
|---|---|---|---|---|---|
| Chr | POS | %Var | Gene ID | Gene Annotation | Region/Effect |
| 7 | 10,996,914 | 2.43 | LOC110527401 | Radixin | CDS/syn |
| 7 | 11,138,396 | 2.49 | LOC110527405 | Calsequestrin-2 | CDS/Syn |
| 7 | 11,312,252 | 2.73 | LOC110527407 | Zinc finger protein Dzip1 | CDS/syn |
| 7 | 11,399,310 | 3.45 | LOC110527414 | Kelch protein 41b | CDS/syn |
| 7 | 11,402,881 | 3.47 | LOC110527413 | Collagen α-1(XXVIII) chain | 3’UTR |
| 7 | 11,438,574 | 3.29 | LOC100136600 | ATP synthase subunit β, mitochondrial | CDS/syn |
| 7 | 11,444,638 | 3.02 | LOC110527417 | Retinol dehydrogenase 7 | CDS/syn |
| 7 | 11,459,018 | 2.98 | abcb11 | Bile salt export pump | CDS/syn |
| 7 | 11,477,215 | 2.88 | LOC100136260 | Cathepsin K | CDS/syn |
| 9 | 52,063,734 | 2.27 | LOC110532529 | Tyrosine-protein phosphatase non-receptor type 1 | 3’UTR |
| 9 | 52,106,708 | 2.26 | LOC110532530 | Ubiquitin-conjugating enzyme E2 variant 1 | 3’UTR |
| 9 | 52,291,239 | 2.28 | LOC110532539 | Partner of Y14 and mago A | CDS/syn |
| 12 | 53,800,425 | 1.1 | hspb1 | Heat-shock protein, α-crystallin-related-1 | 3’UTR/miRNA target |
| Yellowness | |||||
| 4 | 22,957,625 | 2.09 | prdx6 | Peroxiredoxin 6 | CDS/syn |
| 4 | 22,973,619 | 2.11 | plpp6 | Phospholipid phosphatase 6 | 5’UTR |
| 4 | 23,074,540 | 2 | LOC110521622 | Protein PRRC2C | 3’UTR |
| 4 | 23,103,208 | 1.92 | vamp4 | Vesicle-associated membrane protein 4 | 3’UTR |
| 4 | 23,115,313 | 1.95 | LOC110521624 | Myocilin | CDS/Syn |
| 6 | 61,578,946 | 1.9 | LOC110526379 | F-actin-methionine Sulfoxide oxidase MICAL2 | 5’UTR |
| 6 | 61,592,297 | 1.99 | LOC110526380 | Ubiquitin carboxyl-terminal hydrolase 47 | CDS/syn |
| 6 | 61,666,093 | 2.25 | LOC110526946 | β,β-carotene 15,15′-dioxygenase-l | CDS/Non-syn |
| 6 | 61,805,211 | 2.11 | LOC110526388 | Nuclear factor of activated T-cells 5 | CDS/syn |
| 6 | 61,837,913 | 2.39 | LOC110526389 | Lysine-tRNA ligase | 3’UTR |
| 6 | 61,847,413 | 2.38 | LOC110526390 | 60S ribosomal protein L13 | CDS/syn |
| 6 | 61,998,041 | 2.36 | LOC110526393 | Cytochrome b5 | 3’UTR |
| 6 | 62,768,347 | 2.45 | LOC110526402 | Cysteine-rich Secretory protein LCCL domain-containing 2 | 3’UTR |
| 6 | 62,812,905 | 2.32 | LOC110526403 | Ubiquitin carboxyl-terminal hydrolase 10 | CDS/Non-syn |
| 6 | 62,896,859 | 2.24 | LOC110526405 | AP-1 complex subunit γ-1 | 3’UTR |
| 6 | 62,961,238 | 2.26 | LOC110526408 | Myotubularin-related Protein 10 | 3’UTR |
| 6 | 63,056,828 | 2.39 | LOC100136691 | Cyclin B2 | CDS/syn |
| Whiteness | |||||
|---|---|---|---|---|---|
| Chr | POS | %Var | Gene ID | Gene Annotation | Region/Effect |
| 8 | 34,097,292 | 1.17 | LOC110529884 | Peptidyl-prolyl cis-trans isomerase FKBP1B | CDS/Syn |
| 8 | 34,136,112 | 1.29 | mut | Methylmalonyl-CoA mutase | 3’UTR |
| 8 | 34,495,040 | 1.49 | sod2 | Superoxide dismutase 2 | 3’UTR |
| 8 | 34,936,875 | 1.57 | LOC110529892 | cGMP-dependent protein kinase 1 | 3’UTR |
| 8 | 36,538,411 | 1.42 | LOC110529899 | SAM and SH3 domain-containing protein 1 | 3’UTR |
| 8 | 37,290,793 | 1.54 | LOC110529911 | Sialomucin core protein 24 | 3’UTR |
| 8 | 37,412,186 | 1.38 | LOC110529910 | Sestrin-1 | 3’UTR |
| 8 | 37,829,107 | 1.38 | ostm1 | Osteopetrosis-associated transmembrane protein 1 | 3’UTR |
| 8 | 38,254,068 | 1.3 | LOC110529920 | Poly(U)-binding-splicing factor PUF60 | CDS/Syn |
| 8 | 39,295,098 | 1.37 | ankh | ANKH inorganic pyrophosphate transport regulator | 3UTR/miRNA target |
| 8 | 40,954,559 | 1.3 | myo10 | Myosin X | 3’UTR |
| 8 | 40,978,990 | 1.36 | znf622 | Zinc finger protein 622 | 3’UTR |
| 8 | 41,002,542 | 1.26 | retreg1 | Reticulophagy regulator 1 | 3’UTR/miRNA target |
| 19 | 41,952,271 | 1.18 | LOC110497982 | Uncharacterized protein C15orf52 | 3’UTR |
| 27 | 1,675,710 | 1.19 | LOC110507317 | Protein IWS1 homolog | 3’UTR |
| 27 | 3,976,684 | 1.18 | LOC110507360 | Serine/threonine-protein phosphatase 2A 65 kDa regulatory subunit A β isoform | CDS/Syn |
Publisher’s Note: MDPI stays neutral with regard to jurisdictional claims in published maps and institutional affiliations. |
© 2022 by the authors. Licensee MDPI, Basel, Switzerland. This article is an open access article distributed under the terms and conditions of the Creative Commons Attribution (CC BY) license (https://creativecommons.org/licenses/by/4.0/).
Share and Cite
Ahmed, R.O.; Ali, A.; Al-Tobasei, R.; Leeds, T.; Kenney, B.; Salem, M. Weighted Single-Step GWAS Identifies Genes Influencing Fillet Color in Rainbow Trout. Genes 2022, 13, 1331. https://doi.org/10.3390/genes13081331
Ahmed RO, Ali A, Al-Tobasei R, Leeds T, Kenney B, Salem M. Weighted Single-Step GWAS Identifies Genes Influencing Fillet Color in Rainbow Trout. Genes. 2022; 13(8):1331. https://doi.org/10.3390/genes13081331
Chicago/Turabian StyleAhmed, Ridwan O., Ali Ali, Rafet Al-Tobasei, Tim Leeds, Brett Kenney, and Mohamed Salem. 2022. "Weighted Single-Step GWAS Identifies Genes Influencing Fillet Color in Rainbow Trout" Genes 13, no. 8: 1331. https://doi.org/10.3390/genes13081331