Article

Identification of the Core Promoter and Variants Regulating Chicken CCKAR Expression

1
College of Animal Science and Technology, Northwest A&F University, Yangling 712100, China
2
Royal (Dick) School of Veterinary Studies, Roslin Institute, University of Edinburgh, Midlothian EH25 9RG, UK
*
Author to whom correspondence should be addressed.
Genes 2022, 13(6), 1083; https://doi.org/10.3390/genes13061083
Submission received: 26 May 2022 / Revised: 15 June 2022 / Accepted: 15 June 2022 / Published: 18 June 2022
(This article belongs to the Special Issue Advances in Poultry Genetics and Breeding)

Abstract

:
Decreased expression of chicken cholecystokinin A receptor (CCKAR) attenuates satiety, which contributes to increased food intake and growth for modern broilers. The study aims to define the core promoter of CCKAR, and to identify variants associated with expression activity. A 21 kb region around the CCKAR was re-sequenced to detect sequence variants. A series of 5′-deleted promoter plasmids were constructed to define the core promoter of CCKAR. The effects of sequence variants located in promoter (PSNP) and conserved (CSNP) regions on promoter activity were analyzed by comparing luciferase activity between haplotypes. A total of 182 variants were found in the 21 kb region. There were no large structural variants around CCKAR. pNL−328/+183, the one with the shortest insertion, showed the highest activity among the six promoter constructs, implying that the key cis elements regulating CCKAR expression are mainly distributed 328 bp upstream. We detected significant activity differences between high- and low-growth associated haplotypes in four of the six promoter constructs. The high-growth haplotypes of constructs pNL−1646/+183, pNL−799/+183 and pNL−528/+183 showed lower activities than the low-growth haplotypes, which is consistent with decreased expression of CCKAR in high-growth chickens. Lower expression of the high-growth allele was also detected for the CSNP5-containing construct. The data suggest that the core promoter of CCKAR is located the 328 bp region upstream from the transcription start site. Lower expression activities shown by the high-growth haplotypes in the reporter assay suggest that CSNP5 and variants located between 328 bp and 1646 bp upstream form a promising molecular basis for decreased expression of CCKAR and increased growth in chickens.

1. Introduction

Regulation of appetite is a homeostatic process featuring reciprocal shifts between hunger and satiety sensations in response to energy state, which normally results in an appropriate growth rate and adult bodyweight [1]. The arcuate nucleus of the hypothalamus is the control center for hunger and satiety in mammals [2]. Here, orexigenic neuropeptide Y/agouti-related protein neurons and anorectic pro-opiomelanocortin/cocaine- and amphetamine-regulated transcript neurons integrate peripheral signals from vagal afferents and circulating factors to regulate food intake and energy expenditure [3]. A series of neurohormonal signals that are produced by the gut and adipose tissue are involved in appetite control. Ghrelin is the only known peptide hormone that stimulates hunger [4]. In contrast, there are many hormones that are associated with satiety. Of these, leptin and cholecystokinin (CCK) are two well-established satiety signals. Leptin is produced by adipose tissue and acts directly at the arcuate of the hypothalamus to regulate long-term energy homeostasis [3]. The gut peptide CCK not only acts as a short-term satiety signal, but is a key signaling molecule responsible for long-term regulation of feeding and energy balance by interacting with leptin [5]. In birds, CCK signaling may play an enhanced role in appetite control, as limited expression of leptin in adipose tissue and autocrine/paracrine mode suggest that leptin may not serve as an adiposkine involved in nutritional feedback [6,7,8].
Cholecystokinin initiates satiety by binding to receptors on the vagus nerve and the hypothalamus [3]. More localized effects of CCK on digestive activities occur through binding to receptors throughout the gastrointestinal tract in mammals [9]. Two G-protein coupled receptors—CCKAR and CCKBR—are responsible for transduction of CCK signaling in the mammals [9,10]. CCKBR binds CCK and gastrin with almost equal affinities and stimulates gastric acid secretion [9]. CCKAR exhibits a 500-fold higher affinity for CCK than for gastrin in pancreatic acinar cells and is the primary receptor mediating satiety signals in the mammals [4,9]. Loss of CCKAR due to spontaneous mutations decreased satiety and increased food intake and obesity in humans and rats [11,12]. Administration of a CCKAR antagonist similarly produced an appetite-promoting effect in broilers, pigs and rats [13,14,15].
Our previous studies found that high-growth chickens expressed less CCKAR transcripts than low-growth chickens in an Advanced Intercross Line (AIL) [16]. This finding points to one molecular basis underlying increased appetite and growth rate in modern chickens. An allele-specific expression assay showed that the abundance of CCKAR transcripts arising from the low-growth-associated allele was 3.5-fold higher than that of the high-growth associated allele, implying that the differential expression of CCKAR is caused by cis-acting mutations instead of a trans action [16]. The A allele of G.420C > A, a SNP in the 5′UTR of the CCKAR gene, was associated with higher bodyweight and average daily gain of chickens, and was postulated to affect CCKAR expression through disrupting a YY1 binding site in the CCKAR promoter [17]. Other variants in exons and the downstream region of CCKAR were also reported to be associated with faster growth and higher feed efficiency of chickens, implying that there may be other cis-regulatory variants in this gene or adjacent regions affecting CCKAR expression and growth [16,18,19].
The aims of this study were to define the key region regulating CCKAR expression using serial 5′-deleted constructs, and to identify variants associated with expression activity by prediction analysis in silico of sequence variants and a reporter gene assay.

2. Materials and Methods

2.1. Re-Sequencing the CCKAR Locus

Four chickens were selected from generation 16 of the AIL, in which the CCKAR locus was identified as the largest QTL accounting for a 19% difference in bodyweight [16]. Variants at the CCKAR locus were found to be fixed into two haplotypes in the AIL. One associated with high growth was defined as the high-growth (HG) haplotype, and the other is named the low-growth (LG) haplotype [16]. Two of four birds carried the HG haplotype and the other two with the LGH haplotype. A 21 kb region (Galgal 6.0, chr4:73195458–73216805) flanking the CCKAR was re-sequenced. Genomic DNA was extracted from blood using DNAzol reagent (Thermo Fisher Scientific, Waltham, MA, USA) according to the manufacturer’s instructions. Thirty-five fragments covering the 21 kb region were amplified by PCR. PCR preparations comprised 2 μL of 10 × FastStart buffer, 2 μL of 10 × dNTP mix, 0.5 μL of forward primer (20 μM), 0.5 μL of reverse primer (20 μM), 0.1 μL of FastStart Taq polymerase (Roche, Basel, Switzerland), 1 μL of template gDNA and 13.9 μL of ddH2O. The PCR reaction was run in a BIO-RAD T100 thermal cycler (Bio-Rad, Hercules, CA, USA) under reaction conditions: 95 °C for 4 min, 40 cycles of (95 °C for 30 s, 58 °C for 30 s, 72 °C for 30 s), and 72 °C for 7 min. Primers were designed using Primer3. Primers and amplicons are detailed in Table S1. After the specificity of PCR was verified by agarose gel electrophoresis, PCR products were bi-directionally sequenced using the Sanger sequencing method. Contiguous sequences were assembled using SeqBuilder (DNASTAR, Madison, WI, USA). The resulting sequences were deposited in the GenBank database (https://www.ncbi.nlm.nih.gov/Genbank/ (26 August 2020): accession number MT522011 for the HG haplotype and MT522012 for the LG haplotype. Genetic variants were called by multiple alignment using DNAMAN 6.0 (Lynnon BioSoft, San Ramon, CA, USA).

2.2. Identification of Conserved Element Variants

Sequence conservation of the 21 kb re-sequenced region was analyzed by aligning homologous regions of 76 vertebrate species consisting of 52 birds, 9 reptiles and 15 other species using the MULTIZ program in the UCSC database [20]. Conserved element variants were identified by the PhastCons program in the UCSC database [21]. CCKAR variants were displayed in the UCSC genome browser using the “Add Custom Tracks” tool in order to allow visual identification of conserved element variants (CSNP).

2.3. Construction of Reporter Gene Plasmids

To identify key cis-elements controlling CCKAR expression, five serial 5′-deletion and one intragenic fragments from the 5′ upstream region of CCKAR were fused into the upstream region of a nanoluciferase reporter gene (Figure 1). In addition, regulatory effect analysis of five SNPs (CSNP1–CSNP5) located in conserved elements was also included in this reporter assay. Serial 5′-deleted and CSNP-contained regions were amplified using the HG and LG templates. Primer sequences are listed in the Table 1. PCR products were purified using a QIAquick® PCR Purification Kit (QIAGEN, Venlo, The Netherlands). Each purified PCR product and pNL1.1 stock plasmid were digested with KpnI and XhoI restriction endonucleases (New England BioLabs Inc., Ipswich, MA, USA). Digested products were purified using a QIAEX II Gel Extraction Kit (QIAGEN, Venlo, The Netherlands) according to the Quick-Start Protocol. Target fragments were fused into upstream regions of the nanoluciferase reporter gene of the pNL1.1 plasmid (Promega, Madison, WI, USA) using T4 ligase (Promega, Madison, WI, USA). These constructs were transformed into Subcloning Efficiency™ DH5α™ Competent Cells (Invitrogen, Waltham, MA, USA) by heat shock according to the manufacturer’s instructions. Transformants were incubated at 37 °C overnight on a selective LB agar plate containing 100 μg/mL ampicillin. Plasmid DNA was extracted from bacterial cultures made from single colonies using the QIAGEN Plasmid Midi kit (QIAGEN, Venlo, The Netherlands) according to the product handbook. Concentrations of plasmids were measured using a NanoDrop™ 2000 spectrophotometer (Thermo Fisher Scientific, Waltham, MA, USA). All plasmid constructs were verified by Sanger sequencing prior to use.
Five-prime deletion and one intragenic fragment fused into the upstream region of the nanoluciferase gene to define the core promoter for transcription and to analyze the regulatory effects of variants. A total of 19 SNPs were found in the −1646/+734 region and grouped into the high- and low-growth haplotypes (HG/LG) in the Advanced Intercross Line. Information on these SNPs is summarized in Table S2.

2.4. Cell Culture, Transfection and Dual-Luciferase Reporter Assay

Chicken DF-1 cells were used for transient transfection of reporter plasmids. This cell line was kindly gifted by D. B. Zhao at the Roslin Institute, UK. DF-1 cells were seeded in 12-well culture plates at 3 × 10⁴ cells/well and cultured in high-glucose DMEM (Thermo Fisher Scientific, Waltham, MA, USA) supplemented with 1% (v/v) chicken serum (Sigma-Aldrich, St. Louis, MO, USA), 10% (v/v) fetal bovine serum (Sigma-Aldrich, St. Louis, MO, USA) and 1% (v/v) L-glutamine–penicillin–streptomycin (Sigma-Aldrich, St. Louis, MO, USA). At 70–80% confluence, target and pGL3-control (Promega, Madison, WI, USA) plasmids were co-transfected into DF-1 using Lipofectamine LTX reagent (Invitrogen, Waltham, MA, USA). One hundred microliters of transfection mixture was prepared for each well by diluting pNL1.1 constructs (1 μg) and pGL3-control plasmids (100 ng), 3 μL of Lipofectamine LTX and 2 μL of PLUSTM reagent into Opti-MEM (Thermo Fisher Scientific, Waltham, MA, USA). After gentle mixing and incubation for 5 min at room temperature, 100 μL of transfection mixture was added per well into 1 mL of culture medium.
Dual-Luciferase reporter assay was performed 24 h after transfection using the Nano-Glo® Dual-Luciferase Reporter Assay System (Promega, Madison, WI, USA) according to the product instructions. Luminescence intensity was detected using a LB-96V Microplate Luminometer (Berthold Technologies GmbH & Co. KG, Bad Wildbad, Germany). Empty pNL1.1 plasmid served as the negative control. Raw luminescence intensity values were divided by the input molar mass of each plasmid to normalized differences in plasmid size. The relative luciferase activity of each pNL1.1 construct was reported by dividing activity of each pNL1.1 construct by that of co-transfected pGL3-control plasmid. All reporter assays were repeated 6 times.

2.5. Predicting Disrupting Effects of Variants on TF Binding Motifs

The disrupting effects of variants on transcription factor (TF) binding motifs were predicted using the “Differential TF Binding” tool in CIS-BP database [22] under default conditions, with Gallus gallus selected as the species of interest for TF prediction. Effects of promoter variants on FOXO1 binding motifs were further predicted with 8 FOXO1-related entries deposited in the JASPAR database [23].

2.6. Statistical Analysis

Activities of promoter constructs were compared using ANOVA. The model for ANOVA was developed as follows: y = μ + construct + haplotype (construct) + e, where “y” is the relative luc activity, “μ” is the overall mean, “construct” is the construct effect (six levels: six serial 5′-deleted promoter plasmids were constructed) and “haplotype” is the haplotype effect (two levels: HG and LG) nested in the construct effect. Multiple comparison of activities between constructs was performed using Duncan’s test. Activity difference between HG and LG haplotypes was tested using t-test. A p value <0.05 was considered statistically significant. Statistical analysis was conducted using the SAS University Edition software.

3. Results

3.1. Identification of Variants in the 21 kb Region Flanking CCKAR

Over 300 variants were found within the region when all sequences were aligned to the Red Junglefowl reference genome. The HG haplotype differed from the LG haplotype by 182 variants (Figure 2; Table S2). The alleles of the remainder were shared between HG and LG haplotypes, but were different from the reference genome. There were no non-synonymous and structural variants in the re-sequenced region except a 136 bp retrotransposable element (CR1) located 6.2 kb downstream of CCKAR (Table S2). This CR1 represents a potential regulatory mutation because the elements are associated with genome stability and have the potential for acting as regulatory and coding sequences [24]. However, our previous study failed to detect an association of the CR1 with body weight (data not shown) and excluded the possibility that the CR1 element may affect CCKAR expression and the growth of chickens.
The screenshot of UCSC Genome Browser shows the distribution of 182 variants and the results of 76-way vertebrate conservation analysis in the 21 kb region around the CCKAR gene. The two alleles of each SNP are highlighted in two colors. The upper base is the allele contained in the low-growth haplotype, and the lower is present in the high-growth haplotype. Beneath the distribution plot of variants, this screenshot shows PhastCons score, PhastCons Conserved Element and Multiz Align tracts. Five variants are located in conserved noncoding regions. These variants are shown as insets seen when zooming in to the base level.

3.2. Defining the Core Promoter of Chicken CCKAR

Five 5′-deletion constructs showed higher promoter activities than the negative control. The pNL−328/+183 that contained the shortest fragment proximal to the transcription start site (TSS) showed the highest promoter activity among all constructs (Figure 3). With the increasing of insertion sizes, activities of promoter constructs generally decreased. However, the pNL−1646/183 showed promoter activity approaching that of pNL−799/183 (Figure 3), implying that transcriptional repression may exist between −1185 and −799 bp. pNL+303/+734 with a deleted proximal sequence around the TSS completely lost promoter activity (Figure 3).

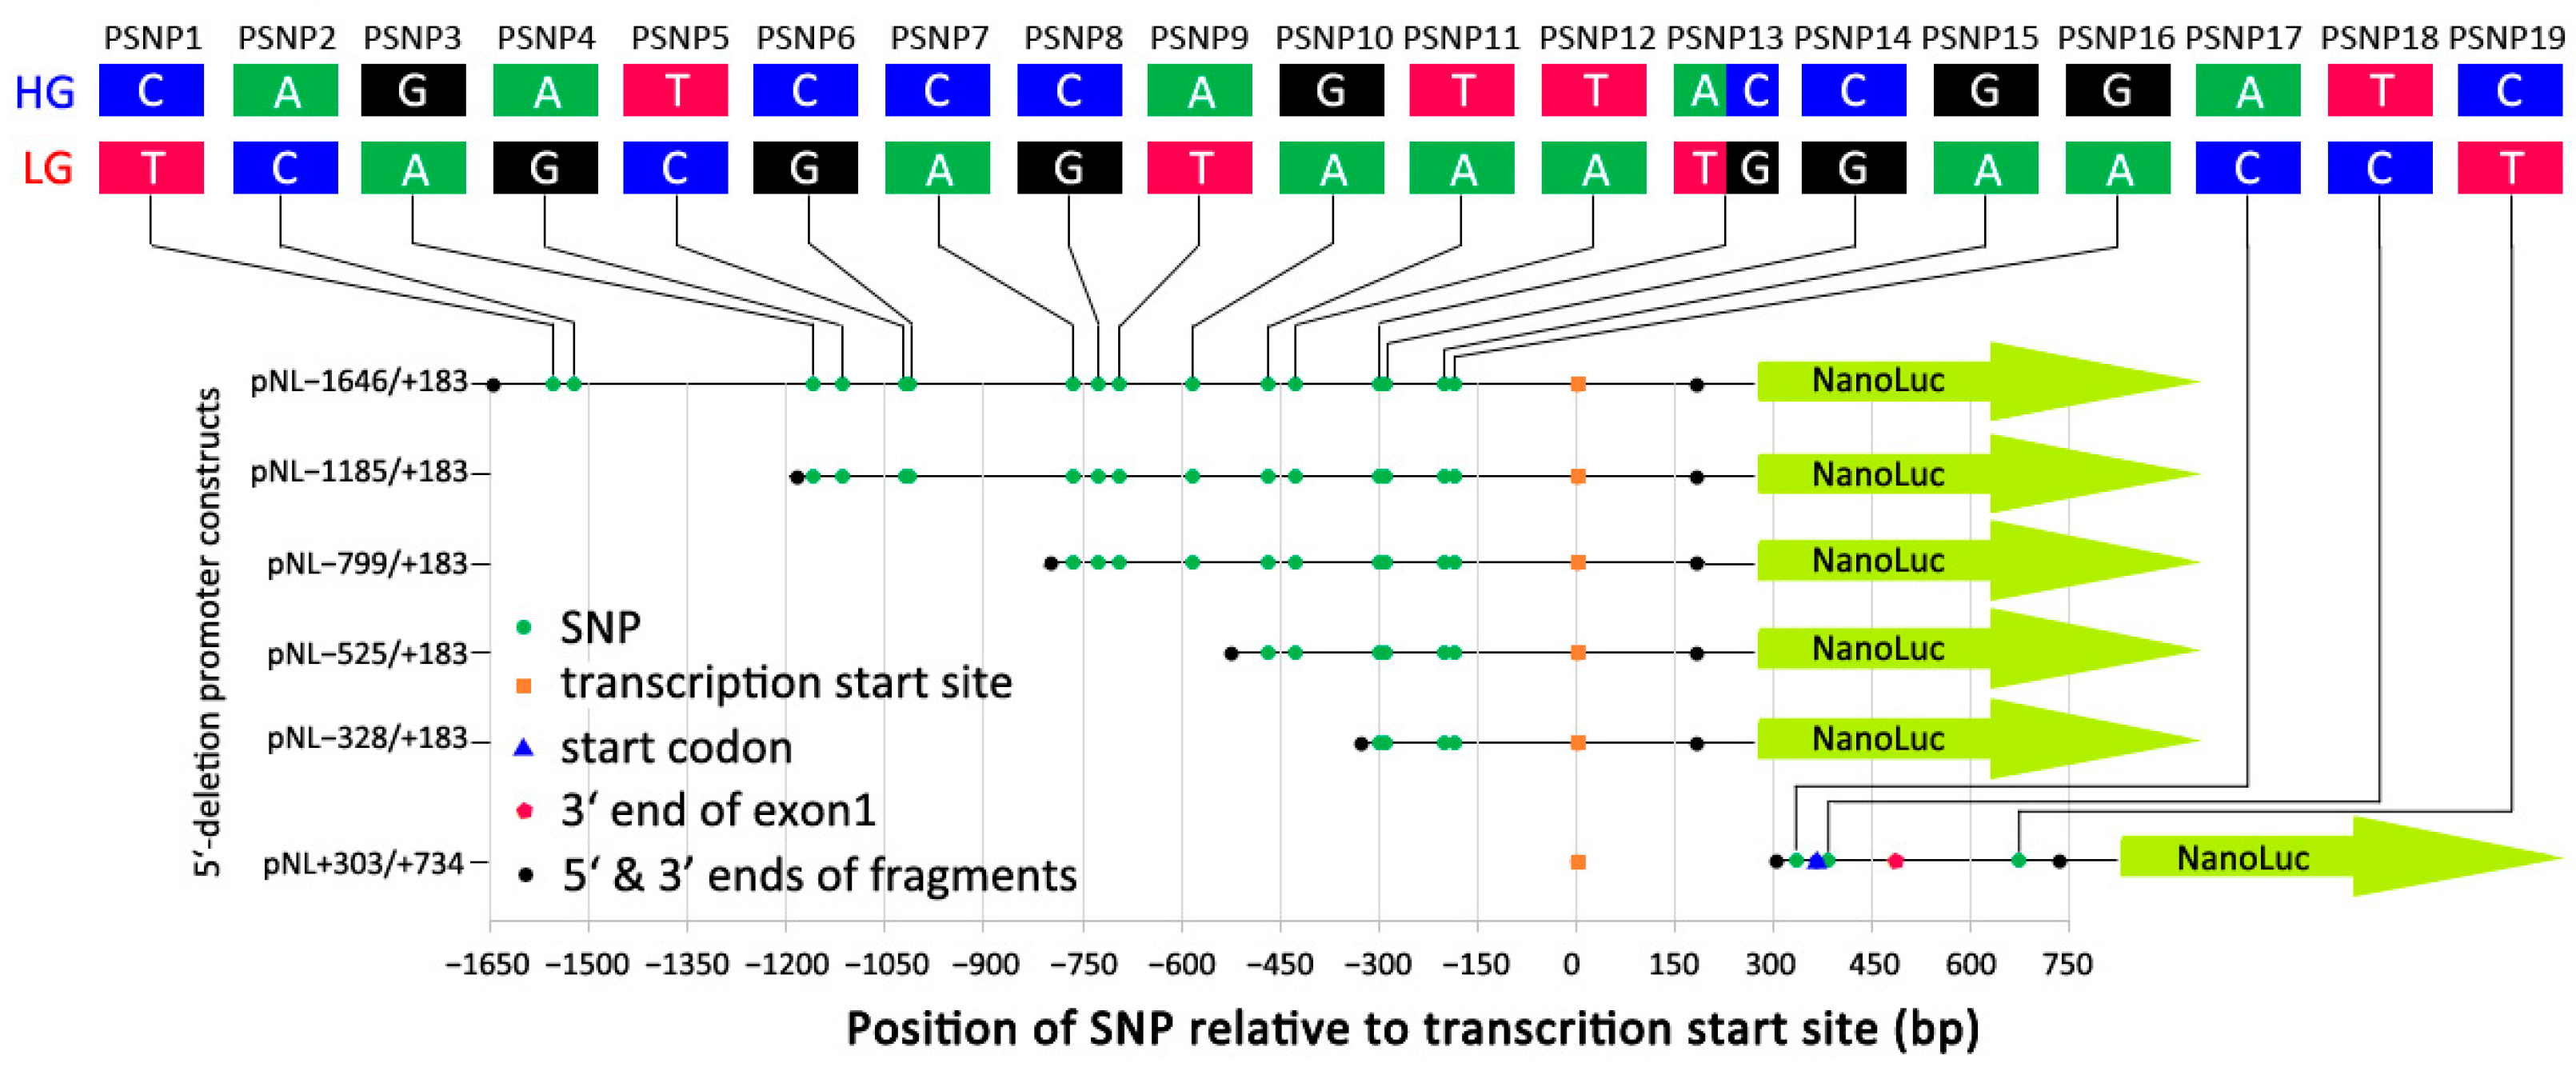
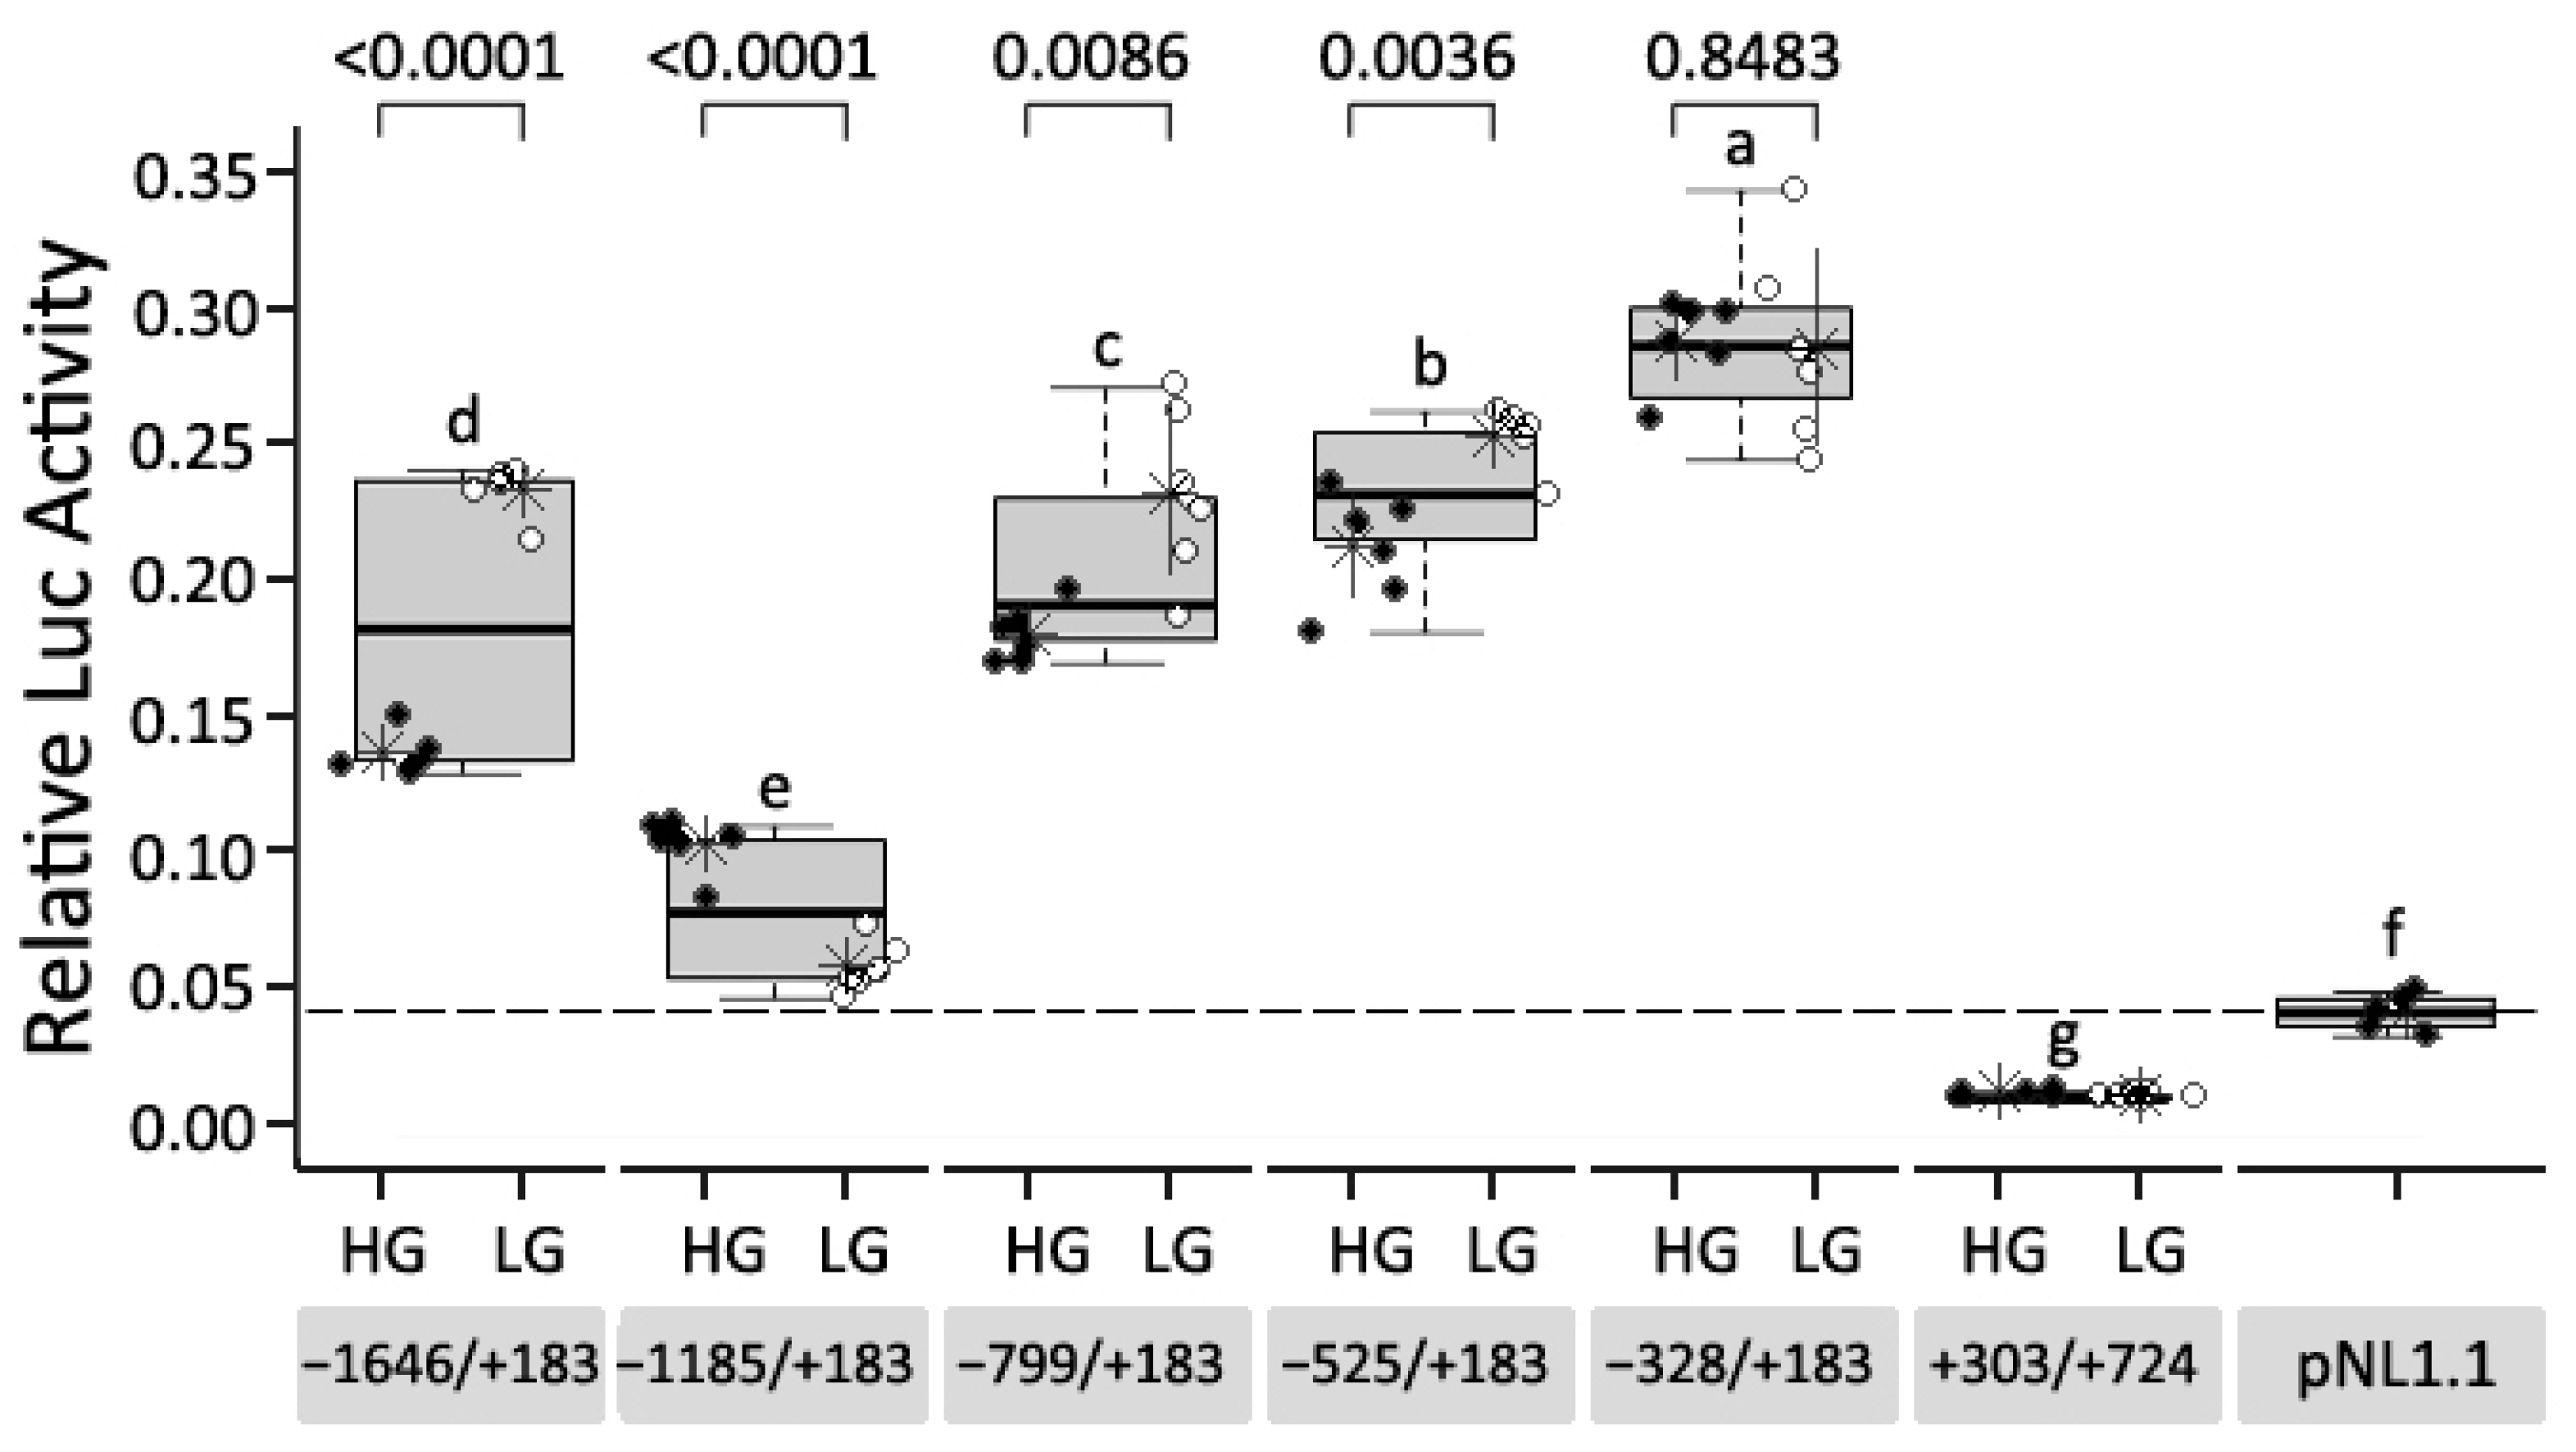
3.3. Effects of Sequence Variants in the Promoter Region of CCKAR on Promoter Activity

A total of 19 SNPs were found in the −1646/+734 region, and formed into HG and LG haplotypes in the AIL (Figure 1). The HG had lower expression levels of CCKAR than the LG in vivo [16]. In the reporter assay, the HG showed 68% lower promoter activity than the LG on the construct pNL−1646/+183, which was in the line with expression difference in vivo (Figure 3). However, when PSNP1 and PSNP2 were deleted, the difference between HG and LG was inverted when the two haplotypes of pNL−1185/+183 were expressed (Figure 3). With deletion of PSNP3–PSNP6, the HG version had lower activity levels than the LG when the constructs pNL−799/+183 and pNL−525/+183 were expressed (Figure 3). There was no significant difference between haplotypes for the pNL−328/+183 construct (Figure 3).

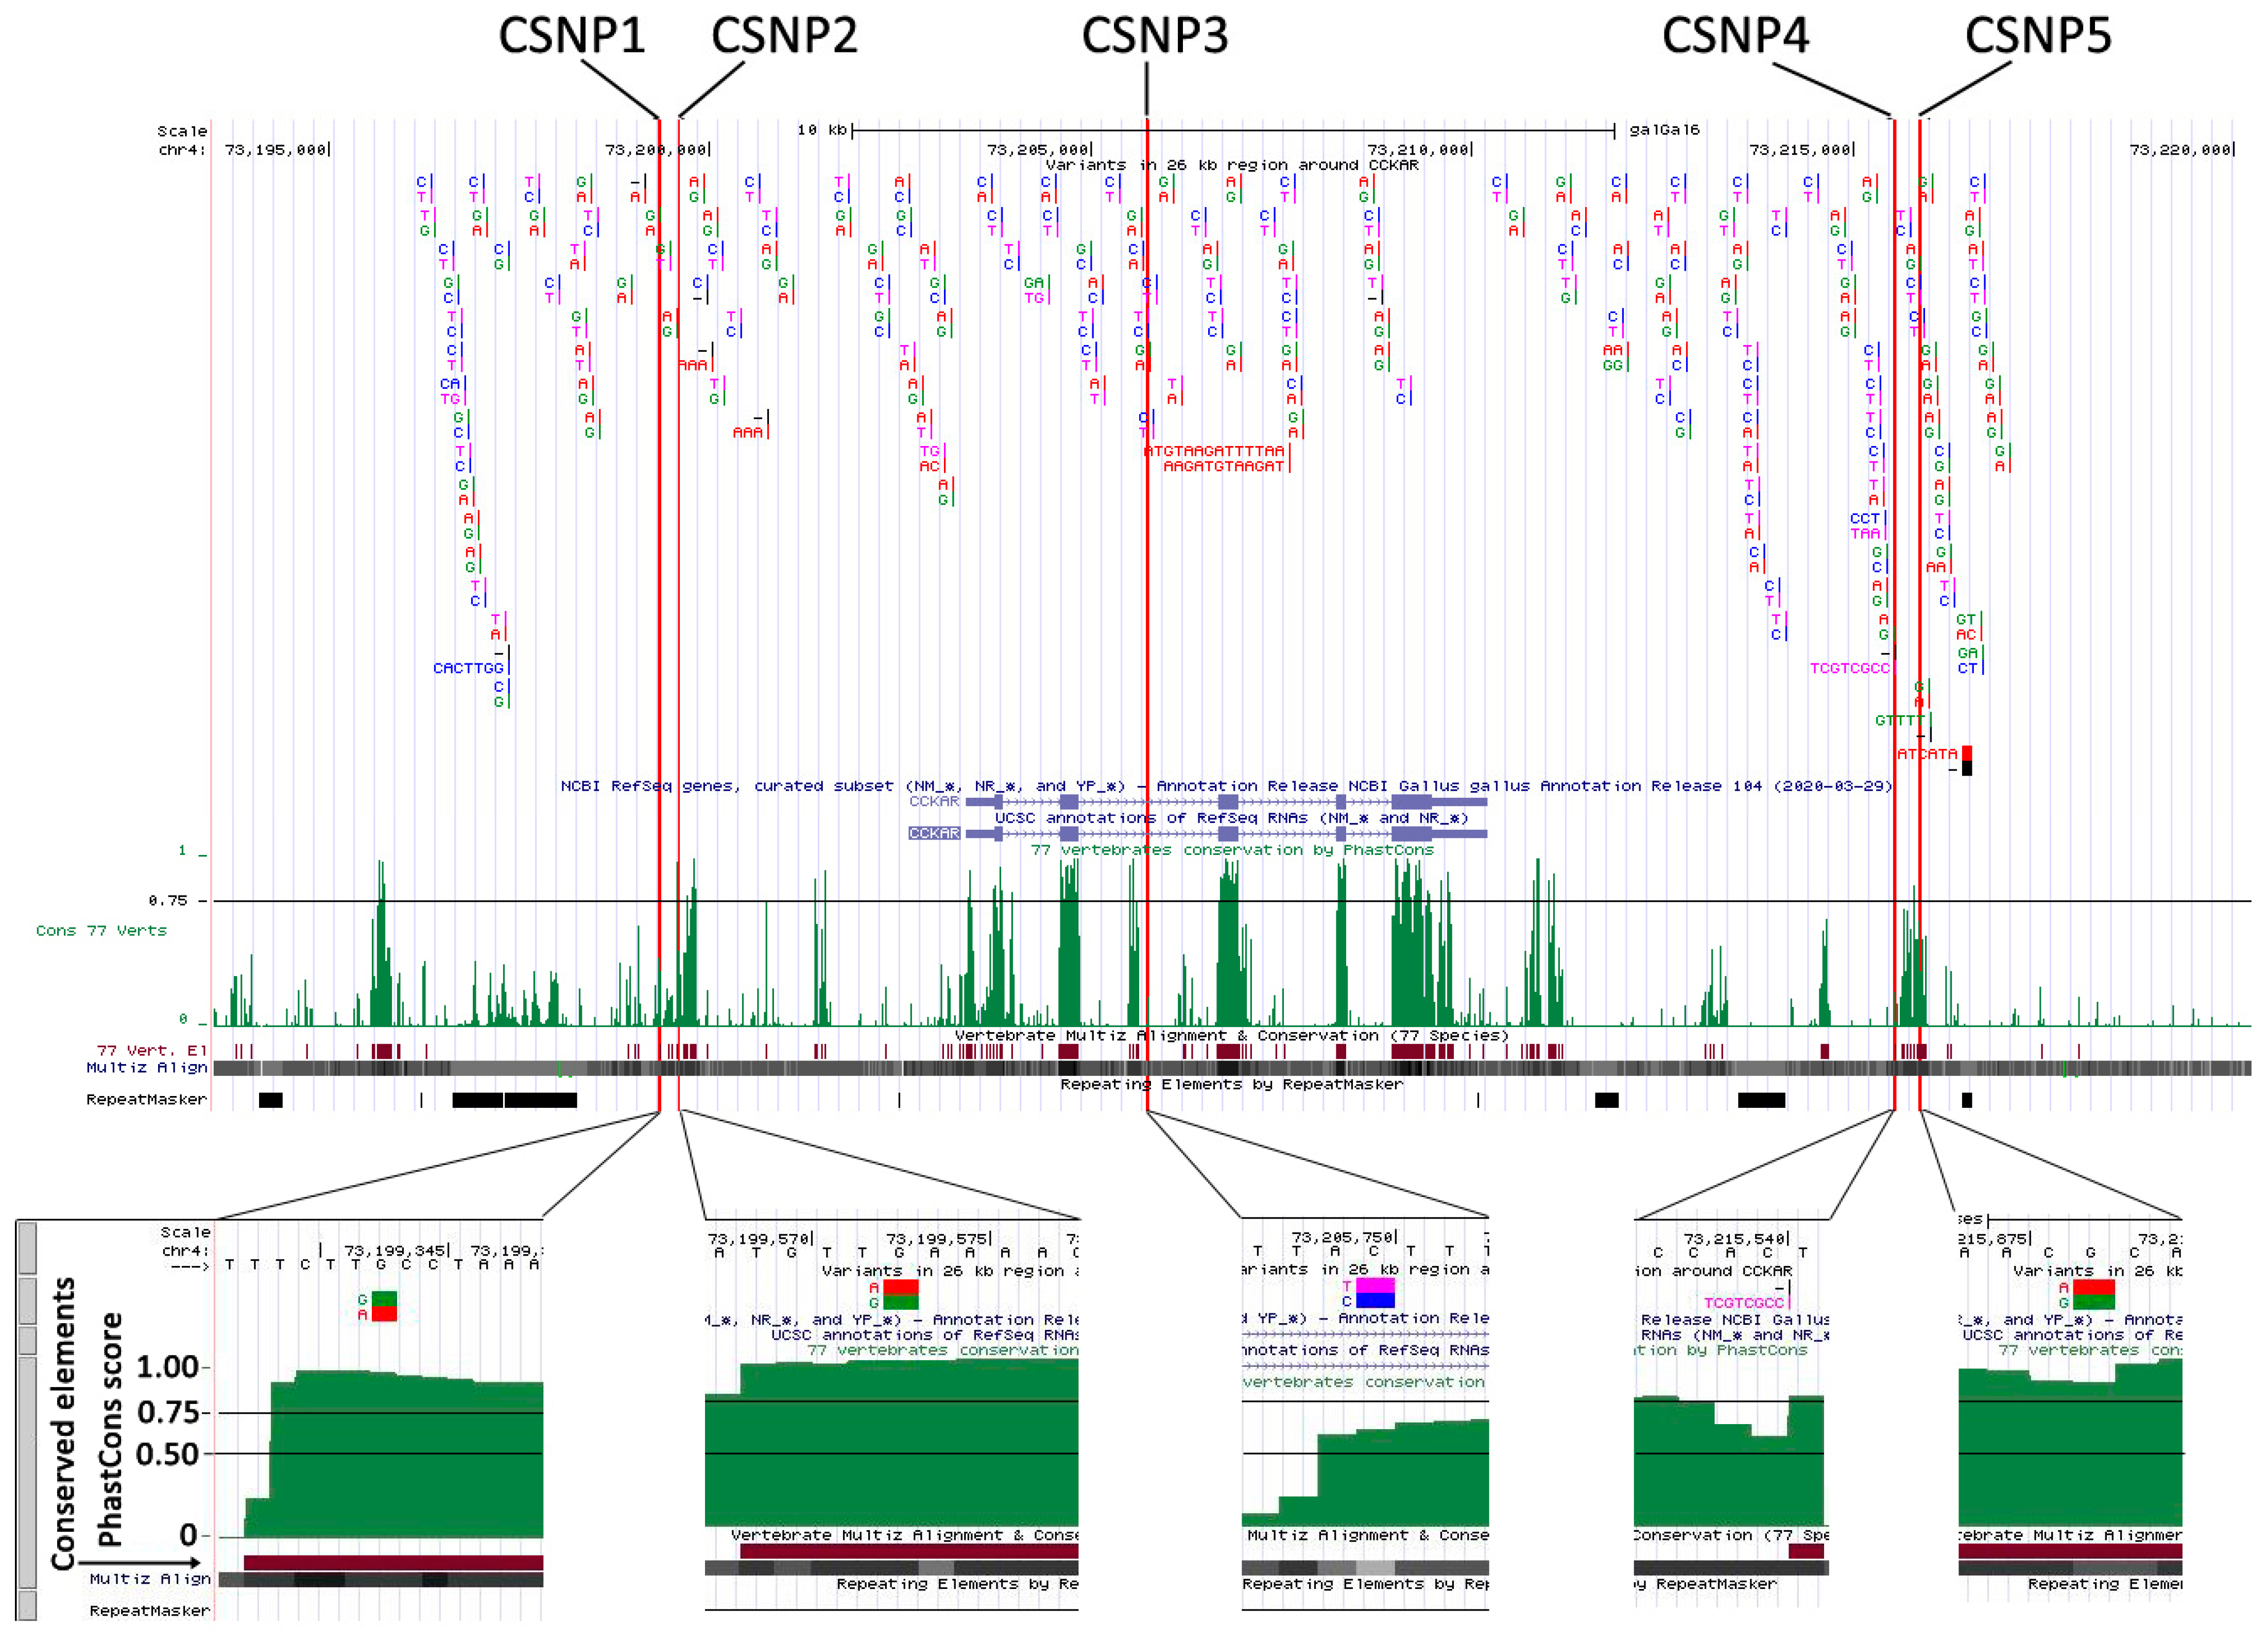
3.4. Discovery of Conserved Sequence Variants Affecting Promoter Activity

Of 182 variants, five SNPs (CSNP1–CSNP5) were located in conserved regions with PhastCons scores of more than 0.5. Especially, CSNP1, CSNP2 and CSNP5 were embedded in the conserved elements and had PhastCons scores almost equal to 1 (Figure 2). CSNP3 alone was located in Intron 2 of CCKAR (Table 2; Figure 2). The others were located outside of the CCKAR locus (Table 2; Figure 2). The LG versions of the alleles of these SNPs were highly conserved among bird species, except CSNP4 (Table 2). Through TF prediction in silico, the five CSNP can disrupt TF motifs (Figure S1). However, promoter activity of pNLCSNP5 alone was higher than that of the negative control in the reporter assay (Figure 4). The A allele of CSNP5 was contained in the LG haplotype and was highly conserved among 52 bird species (Table 2). The activity of the A allele (LG) was 1.75-fold higher than that of the G allele (HG) (Figure 4).

4. Discussion

Our previous studies recognized that genetic differences in growth rate were associated with reduced satiety caused by lower expression of CCKAR [16]. Therefore, to identify the key cis elements and variants affecting CCKAR expression is of significance for understanding to molecular basis underlying the appetite and growth rate changes of modern chickens. This study defined the core promoter of chicken CCKAR and found the directions of the activity differences of three promoter and one CSNP-containing constructs were consistent with the in vivo expression patterns. These results provide an important basis for further identification of cis-regulatory variants affecting CCKAR expression and chicken growth.

4.1. Core Promoter of Chicken CCKAR Gene

A key region responsible for human CCKAR expression was located within 622 bp upstream from the TSS [25]. Similarly, we observed that the proximal region (−328/+183) around the TSS had the highest promoter activity in the reporter assay. Upon deleting this sequence, the pNL+303/+734 completely lost expression activity. These results suggest that the −328/+183 region is important for promoting CCKAR expression. In addition, we observed a significant repressive effect on expression by the −1185/+183 region. When deleting the −1185/−799 sequence, expression of pNL−799/+183 was significantly increased, implying that the −1185/−799 region should contain repressive elements. An AT-rich region between −359 and −622 bp upstream of the TSS with a repressive effect was reported in the promoter region of human CCKAR [25]. Similarly, an AT-rich region exists between −1378 and −776 bp upstream of the chicken CCKAR gene (AT contents: 71% vs. approximately 60% in adjacent regions; Figure S2). An AT-rich sequence serving as a repressive element was widely involved in the inhibition of gene expression in humans, drosophila and bacteria [26,27,28]. Coexistence of activating and repressive sequences implies that proper maintenance of CCKAR expression may result from the antagonistic coordination of activating and repressive effects.

4.2. Expression Regulation Effects of Sequence Variants in the Promoter Region of CCKAR

We detected that the HG haplotype had lower promoter activities than the LG haplotype for the pNL−1646/+183, pNL−799/+183 and pNL−525/+183 constructs—the difference being in the same direction as the results in vivo [16]. A contrary direction of haplotype difference was detected for the pNL−1185/+183 construct. This contradiction suggests that low expression of CCKAR in high-growth chickens may be caused by a balanced effect of expression-activating and suppressing variants. The variants located in the −1646/−1185 and −799/−328 regions contributed to low activity of the HG, and thus formed a plausible molecular basis for low expression of CCKAR in high-growth chickens.
A number of putative TF motifs were disrupted by these promoter variants (Figure S3). Given the roles of CCK signaling in the regulation of appetite and fat metabolism, TFs associated with energy balance may regulate CCKAR expression. Fork head box class O1 (FOXO1) is a well-known TF involved in appetite regulation [29]. It can stimulate appetite by activating AgRP expression and suppressing POMC transcription in hypothalamic neurons [29]. FOXO1 phosphorylation induced by the PI3K/AKT-FOXO1 pathway reverses the orexigenic effect [29]. PSNP1, PSNP3 and PSNP18 were located in the FOXO1 motif based on prediction in silico (Figure S3). Although almost nothing is known about the regulatory relationship between FOXO1 and CCKAR, it is possible that CCK induces satiety by the PI3K/AKT-FOXO1 signaling axis, as CCKAR triggers trophic effects through activating the PI3K/AKT pathways [30]. We found that low expression of CCKAR coincided with upregulated expression of AgRP and downregulated expression of POMC in the hypothalamus [16]. These data support an interrelationship model in which expression of CCKAR is downregulated due to disruption of the FOXO1 motif; absence of CCKAR diminishes phosphorylation of FOXO1 in hypothalamic neurons by the PI3K/AKT pathway and elicits an orexigenic effect (Figure S4).

4.3. Effects of Conserved Element Variants on Promoter Activity

Non-coding sequences that have critical functional roles are significantly more similar among species than would be expected under the neutral evolution model [31]. This provides a strategy for finding cis regulatory elements by conservation analysis of orthologous sequences. In this study we found five SNPs located in conserved sequences. These conserved sequence variants may affect CCKAR expression if they act as cis acting elements. We could not determine regulatory roles of CSNP1–CSNP4 because of the absence of activities of pNLCSNP1–pNLCSNP4 constructs in the reporter assay. However, pNLCSNP5 showed an activity difference between alleles in the expected direction in vivo [16]. Modern chicken breeds are two-fold larger in adult size than the Red Junglefowl, the ancestor of modern chickens [32]. Therefore, it is possible that functional variants affecting CCKAR expression and the growth of chickens derive from a recent mutation event and are exclusively present in the HG haplotype. The LG allele (A) of CSNP5 is highly conserved among 42 bird and 4 reptile species, but the HG allele (G) is rarely found in 6 bird species. Additionally, the HG allele of CSNP5 displayed a lower activity level than the LG allele in the reporter assay. Through TF prediction, we found that the HG allele can disrupt the androgen receptor (AR) motif. AR knockout was closely associated with food intake, leptin levels and adiposity in mice [33]. CCKAR has been developed as a promising target to treat obesity in humans [34]. The phenotypic parallels make CCKAR an attractive target regulated by AR. The HG allele of CSNP5 is therefore a promising candidate that may attenuate CCKAR expression and facilitate food intake and growth of chickens.

5. Conclusions

Results from serial 5′-deleted constructs suggest that the core promoter of CCKAR was distributed 328 bp upstream from the TSS. The parallel between results from the reporter assay and in vivo expression analysis suggests that CSNP5 and variants distributed between 328 and 1646 bp upstream form a promising molecular basis for low expression of CCKAR in high-growth chickens.

Supplementary Materials

The following supporting information can be downloaded at: https://www.mdpi.com/article/10.3390/genes13061083/s1. Figure S1: Effects of five conserved element variants on TF binding motifs. Figure S2: Distribution of GC content in the upstream region of the chicken CCKAR gene. Figure S3: Effects of promoter variants of CCKAR on TF binding motifs. Figure S4: An interrelationship model of CCKAR and FOXO1 in appetite regulation [16,29,35,36]. Table S1: Primers used to resequencing of 21 kb region around the CCKAR. Table S2: Information of sequence variants within the 21 kb region around the CCKAR.

Author Contributions

Z.W.: conceptualization, investigation, formal analysis and writing—original draft. A.M.A.R.: investigation and writing—review and editing. P.W.W.: investigation and resources. I.C.D.: conceptualization, methodology and writing—review and editing. All authors have read and agreed to the published version of the manuscript.

Funding

This research was funded by the Key Research and Development Program of Shaanxi Province, grant number 2021NY-028, and the BBSRC Institute strategic program grant, grant number BB/P013759/1.

Institutional Review Board Statement

The study was conducted in accordance with the Declaration of the Roslin Institute, and approved by the Institutional Animal Welfare and Ethical Review Body (approval code: 70/7909; date: 14 June 2019).

Informed Consent Statement

Not applicable.

Data Availability Statement

Not applicable.

Acknowledgments

The authors would also like to thank Graeme Robertson and the late Paul Hocking (Roslin Institute, Midlothian, Scotland) who provided the Multistrain DNA samples.

Conflicts of Interest

The authors declare no conflict of interest.

References

  1. Ahima, R.S.; Antwi, D.A. Brain regulation of appetite and satiety. Endocrin. Metab. Clin. 2008, 37, 811–823. [Google Scholar] [CrossRef] [PubMed] [Green Version]
  2. Wynne, K.; Stanley, S.; McGowan, B.; Bloom, S. Appetite control. J. Endocrinol. 2005, 184, 291–318. [Google Scholar] [CrossRef] [PubMed] [Green Version]
  3. Wren, A.M.; Bloom, S.R. Gut hormones and appetite control. Gastroenterology 2007, 132, 2116–2130. [Google Scholar] [CrossRef] [PubMed]
  4. Austin, J.; Marks, D. Hormonal regulators of appetite. Int. J. Pediatr. Endocrinol. 2009, 2009, 141753. [Google Scholar] [CrossRef] [PubMed]
  5. Owyang, C.; Heldsinger, A. Vagal control of satiety and hormonal regulation of appetite. J. Neurogastroenterol. Motil. 2011, 17, 338–348. [Google Scholar] [CrossRef] [PubMed] [Green Version]
  6. Seroussi, E.; Cinnamon, Y.; Yosefi, S.; Genin, O.; Smith, J.G.; Rafati, N.; Bornelöv, S.; Andersson, L.; Friedman-Einat, M. Identification of the Long-Sought Leptin in Chicken and Duck, Expression Pattern of the Highly GC-Rich Avian leptin Fits an Autocrine/Paracrine Rather than Endocrine Function. Endocrinology 2016, 157, 737–751. [Google Scholar] [CrossRef] [PubMed] [Green Version]
  7. Boswell, T.; Dunn, I.C. Regulation of Agouti-Related Protein and Pro-Opiomelanocortin Gene Expression in the Avian Arcuate Nucleus. Front. Endocrinol. 2017, 8, 75. [Google Scholar] [CrossRef] [PubMed] [Green Version]
  8. Seroussi, E.; Knytl, M.; Pitel, F.; Elleder, D.; Krylov, V.; Leroux, S.; Morisson, M.; Yosefi, S.; Miyara, S.; Ganesan, S.; et al. Avian Expression Patterns and Genomic Mapping Implicate Leptin in Digestion and TNF in Immunity; Suggesting That Their Interacting Adipokine Role Has Been Acquired Only in Mammals. Int. J. Mol. Sci. 2019, 20, 4489. [Google Scholar] [CrossRef] [Green Version]
  9. Guilloteau, P.; Le Meuth-Metzinger, V.; Morisset, J.; Zabielski, R. Gastrin; cholecystokinin and gastrointestinal tract functions in mammals. Nutr. Res. Rev. 2006, 19, 254–283. [Google Scholar] [CrossRef] [Green Version]
  10. Rehfeld, J.F. Cholecystokinin-From Local Gut Hormone to Ubiquitous Messenger. Front. Endocrinol. 2017, 8, 47. [Google Scholar] [CrossRef] [PubMed] [Green Version]
  11. Moran, T.H.; Bi, S. Hyperphagia and obesity in OLETF rats lacking CCK-1 receptors. Philos. Trans. R. Soc. Lond. B Biol. Sci. 2006, 361, 1211–1218. [Google Scholar] [CrossRef] [PubMed] [Green Version]
  12. Miller, L.J.; Holicky, E.L.; Ulrich, C.D.; Wieben, E.D. Abnormal processing of the human cholecystokinin receptor gene in association with gallstones and obesity. Gastroenterology 1995, 109, 1375–1380. [Google Scholar] [CrossRef]
  13. Covasa, M.; Forbes, J.M. Effects of the CCK receptor antagonist MK-329 on food intake in broiler chickens. Pharmacol. Biochem. Behav. 1994, 48, 479–486. [Google Scholar] [CrossRef]
  14. Ebenezer, I.S.; de la Riva, C.; Baldwin, B.A. Effects of the CCK receptor antagonist MK-329 on food intake in pigs. Physiol. Behav. 1990, 47, 145–148. [Google Scholar] [CrossRef]
  15. Hewson, G.; Leighton, G.E.; Hill, R.G.; Hughes, J. The cholecystokinin receptor antagonist L364;718 increases food intake in the rat by attenuation of the action of endogenous cholecystokinin. Br. J. Pharmacol. 1988, 93, 79–84. [Google Scholar] [CrossRef] [PubMed] [Green Version]
  16. Dunn, I.C.; Meddle, S.L.; Wilson, P.W.; Wardle, C.A.; Law, A.S.; Bishop, V.R.; Hindar, C.; Robertson, G.W.; Burt, D.W.; Ellison, S.J.; et al. Decreased expression of the satiety signal receptor CCKAR is responsible for increased growth and body weight during the domestication of chickens. Am. J. Physiol. Endocrinol. Metab. 2013, 304, E909–E921. [Google Scholar] [CrossRef] [PubMed] [Green Version]
  17. Rikimaru, K.; Takeda, H.; Uemoto, Y.; Komatsu, M.; Takahashi, D.; Suzuki, K.; Takahashi, H. Effect of a single-nucleotide polymorphism in the cholecystokinin type A receptor gene on growth traits in the Hinai-dori chicken breed. J. Poult. Sci. 2013, 50, 206–211. [Google Scholar] [CrossRef] [Green Version]
  18. Yi, Z.; Li, X.; Luo, W.; Xu, Z.; Ji, C.; Zhang, Y.; Nie, Q.; Zhang, D.; Zhang, X. Feed conversion ratio; residual feed intake and cholecystokinin type A receptor gene polymorphisms are associated with feed intake and average daily gain in a Chinese local chicken population. J. Anim. Sci. Biotechnol. 2018, 9, 50. [Google Scholar] [CrossRef]
  19. Wang, Z.; Zhou, W. Research Note, Fine mapping of sequence variants associated with body weight of Lueyang black-boned chicken in the CCKAR gene. Poult. Sci. 2021, 100, 101448. [Google Scholar] [CrossRef] [PubMed]
  20. Blanchette, M.; Kent, W.J.; Riemer, C.; Elnitski, L.; Smit, A.F.; Roskin, K.M.; Baertsch, R.; Rosenbloom, K.; Clawson, H.; Green, E.D.; et al. Aligning multiple genomic sequences with the threaded blockset aligner. Genome Res. 2004, 14, 708–715. [Google Scholar] [CrossRef] [PubMed] [Green Version]
  21. Felsenstein, J.; Churchill, G.A. A Hidden Markov Model approach to variation among sites in rate of evolution. Mol. Biol. Evol. 1996, 13, 93–104. [Google Scholar] [CrossRef] [PubMed] [Green Version]
  22. Weirauch, M.T.; Yang, A.; Albu, M.; Cote, A.G.; Montenegro-Montero, A.; Drewe, P.; Najafabadi, H.S.; Lambert, S.A.; Mann, I.; Cook, K.; et al. Determination and inference of eukaryotic transcription factor sequence specificity. Cell 2014, 158, 1431–1443. [Google Scholar] [CrossRef] [PubMed] [Green Version]
  23. Castro-Mondragon, J.A.; Riudavets-Puig, R.; Rauluseviciute, I.; Berhanu Lemma, R.; Turchi, L.; Blanc-Mathieu, R.; Lucas, J.; Boddie, P.; Khan, A.; Khan, N.M.; et al. JASPAR 2022, the 9th release of the open-access database of transcription factor binding profiles. Nucleic Acids Res. 2022, 50, D165–D173. [Google Scholar] [CrossRef]
  24. Galbraith, J.D.; Kortschak, R.D.; Suh, A.; Adelson, D.L. Genome Stability Is in the Eye of the Beholder: CR1 Retrotransposon Activity Varies Significantly across Avian Diversity. Genome Biol. Evol. 2021, 13, evab259. [Google Scholar] [CrossRef]
  25. Takata, Y.; Takeda, S.; Kawanami, T.; Takiguchi, S.; Yoshida, Y.; Miyasaka, K.; Funakoshi, A. Promoter analysis of human cholecystokinin type-A receptor gene. J. Gastroenterol. 2002, 37, 815–820. [Google Scholar] [CrossRef]
  26. Thomas, B.E.; Thekkumkara, T.J. Glucose mediates transcriptional repression of the human angiotensin type-1 receptor gene: Role for a novel cis-acting element. Mol. Biol. Cell 2004, 15, 4347–4355. [Google Scholar] [CrossRef] [Green Version]
  27. Ding, P.; McFarland, K.A.; Jin, S.; Tong, G.; Duan, B.; Yang, A.; Hughes, T.R.; Liu, J.; Dove, S.L.; Navarre, W.W.; et al. A Novel AT-Rich DNA Recognition Mechanism for Bacterial Xenogeneic Silencer MvaT. PLoS Pathog. 2015, 11, e1004967. [Google Scholar] [CrossRef]
  28. Courey, A.J.; Jia, S. Transcriptional repression: The long and the short of it. Genes Dev. 2001, 15, 2786–2796. [Google Scholar] [CrossRef] [PubMed]
  29. Peng, S.; Li, W.; Hou, N.; Huang, N. A Review of FoxO1-Regulated Metabolic Diseases and Related Drug Discoveries. Cells 2020, 9, 184. [Google Scholar] [CrossRef] [PubMed] [Green Version]
  30. Zeng, Q.; Ou, L.; Wang, W.; Guo, D.Y. Gastrin; Cholecystokinin; Signaling; and Biological Activities in Cellular Processes. Front. Endocrinol. 2020, 11, 112. [Google Scholar] [CrossRef] [PubMed]
  31. Siepel, A.; Bejerano, G.; Pedersen, J.S.; Hinrichs, A.S.; Hou, M.; Rosenbloom, K.; Clawson, H.; Spieth, J.; Hillier, L.W.; Richards, S.; et al. Evolutionarily conserved elements in vertebrate, insect, worm, and yeast genomes. Genome Res. 2005, 15, 1034–1050. [Google Scholar] [CrossRef] [Green Version]
  32. Kerje, S.; Carlborg, O.; Jacobsson, L.; Schütz, K.; Hartmann, C.; Jensen, P.; Andersson, L. The twofold difference in adult size between the red junglefowl and White Leghorn chickens is largely explained by a limited number of QTLs. Anim Genet. 2003, 34, 264–274. [Google Scholar] [CrossRef] [Green Version]
  33. Rana, K.; Fam, B.C.; Clarke, M.V.; Pang, T.P.; Zajac, J.D.; MacLean, H.E. Increased adiposity in DNA binding-dependent androgen receptor knockout male mice associated with decreased voluntary activity and not insulin resistance. Am. J. Physiol. Endocrinol. Metab. 2011, 301, E767–E778. [Google Scholar] [CrossRef]
  34. Miller, L.J.; Desai, A.J. Metabolic Actions of the Type 1 Cholecystokinin Receptor, Its Potential as a Therapeutic Target. Trends Endocrinol. Metab. 2016, 27, 609–619. [Google Scholar] [CrossRef] [Green Version]
  35. Cao, Y.; Nakata, M.; Okamoto, S.; Takano, E.; Yada, T.; Minokoshi, Y.; Hirata, Y.; Nakajima, K.; Iskandar, K.; Hayashi, Y.; et al. PDK1-Foxo1 in agouti-related peptide neurons regulates energy homeostasis by modulating food intake and energy expenditure. PLoS ONE 2011, 6, e18324. [Google Scholar] [CrossRef] [Green Version]
  36. Iskandar, K.; Cao, Y.; Hayashi, Y.; Nakata, M.; Takano, E.; Yada, T.; Zhang, C.; Ogawa, W.; Oki, M. PDK-1/FoxO1 pathway in POMC neurons regulates Pomc expression and food intake. Am. J. Physiol. Endocrinol. Metab. 2010, 298, E787–E798. [Google Scholar] [CrossRef] [Green Version]
Figure 1. Schematic diagram of 5′-deletion constructs and distribution of variants.
Genes 13 01083 g001
Figure 2. Distribution of sequence variants and results of 76-way vertebrate conservation analysis in the 21 kb region around the CCKAR.
Genes 13 01083 g002
Figure 3. Identification of the core promoter of chicken CCKAR and regulatory effect analysis of sequence variants. The boxplots indicate the distribution of data from each construct. The letters on the boxplots indicate the results of multiple comparison among constructs. Different letters represent that there is significant difference (p < 0.05) between two constructs. Numbers at the top of each boxplot are p-values of significance tests for differences between haplotypes. An asterisk represents the mean of data from each haplotype, and the short lines on both sides of each asterisk represent SD. The dashed line represents background signal produced by empty pNL1.1. HG = high-growth haplotype, LG = low-growth haplotype.
Genes 13 01083 g003
Figure 4. Comparison of luciferase activities of pNLCSNP between alleles. An asterisk represents the mean for each group, and the short lines on both sides of each asterisk represent SD. The number at the top of the pNLCSNP5 column is the p-value of the significance test. The dashed line represents the background signal produced by empty pNL1.1. HG = high-growth allele, LG = low-growth allele.
Genes 13 01083 g004
Table 1. Annotations of promoter and conserved regions analyzed in the reporter assay, and primers for PCR amplification of target sequences.
AnnotationPositions Relative to CCKAR 1Primer Sequence (5′-3′) 2Size (bp)
Serial 5′-deleted promoter fragments−1646/+183F: GGGGGTACCTAGAAAGGCAGGTATGTGCT
R: GTTCACTCGAGTATGCCACACGAGGCAGTTT
1829
−1185/+1832F: GGGGGTACCAAGCCGAATTAGGCAGCTAA
R: GTTCACTCGAGTATGCCACACGAGGCAGTTT
1369
−799/+183F: GGGGGTACCGAAATCAGAACTTTTCAATC
R: GTTCACTCGAGTATGCCACACGAGGCAGTTT
983
−525/+183F: GGGGGTACCCTTTTAAACAGTCAAGGCTG
R: GTTCACTCGAGTATGCCACACGAGGCAGTTT
709
−328/+183F: GGGGGTACCGGCTTTGGATCAGGGACATG
R: GTTCACTCGAGTATGCCACACGAGGCAGTTT
512
Intragenic fragment+303/+734F: GGGGGTACCATGGGCAGATAGTTACAAAC
R: GTTCACTCGAGAAGCTGTTTACATTTTGTAC
432
CSNP-contained fragmentsUpstream 4.0 kb (CSNP1)F: GGGGGTACCCCTGCAGAGGTTCACTATGCT
R:GTTCACTCGAGACCATTATTTGGGATGTTGGGA
141
Upstream 3.8 kb (CSNP2)F: GGGGGTACCTGATCAGCCTGAGAGAGAGTGA
R: GTTCACTCGAGACTCAGCTCCCCTTTTGGAG
210
Intron 2 (CSNP3)F: GGGGGTACCTCACAATTTGTAAGGTTATA
R: GTTCACTCGAGTCTTAAAATTCAAGAGTAAG
191
Downstream 5.3 kb (CSNP4)F: GGGGGTACCTCACCAACAGCCCACTACAC
R: GTTCACTCGAGGGAGCTCAGACGCAACATGA
189
Downstream 5.6 kb (CSNP5)F: GGGGGTACCCTGCTATCTGCTGGCGTTGT
R: GTTCACTCGAGGCCCTTCCAACCGCTATCTA
124
1 Positions are relative to the TSS or the 3′ end of CCKAR. 2 The underlined bases are KpnI and XhoI restriction sites.
Table 2. Information of five conserved sequence variants.
NameDescription 1Position Relative to CCKARLG Allele 2HG Allele 2Conserved Alleles among Bird Species
CSNP1g.73199343G > AUpstream 3.8 kbGAG
CSNP2g.73199573A > GUpstream 4.0 kbAGA
CSNP3g.73205750T > CIntron 2TCT
CSNP4g.73215540_73215541insTCGTCGGCCDownstream 5.3 kb-TCGTCGGCCTCGTCGGCC
CSNP5g.73215877A > GDownstream 5.6 kbAGA
1 Genomic positions of SNP are given according to Galgal 6.0 chicken genome assembly. 2 The allele contained in the LG haplotype is defined as the LG allele, and the other in the HG haplotype is named the HG allele.
Publisher’s Note: MDPI stays neutral with regard to jurisdictional claims in published maps and institutional affiliations.

