1. Introduction
Type 2 diabetes mellitus (T2D) is the seventh leading cause of morbidity and mortality in the US and is responsible for
$327 billion annually in economic damage [
1]. T2D is diagnosed in the presence of sustained hyperglycemia that is above the threshold that predisposes to microvascular complications [
2]. However, hyperglycemia is the end product of several pathophysiological processes that eventually converge on the inability of the pancreatic β cells to produce enough insulin to meet the demands of target tissues. Our inability to identify and adequately understand this etiological heterogeneity underpins the diagnostic and prognostic challenges faced in clinical practice. Thus, novel precision diagnostic methods that refine the characterization of diabetes to optimize prognostication and therapies are highly desired to improve clinical decisions and patient outcomes.
T2D has a complex genetic and environmental architecture that underlies its development and clinical presentation [
3]. Genome-wide association studies (GWAS) have identified more than 500 common genetic variants associated with the disease. However, in aggregate, these explain less than 20% of the heritability [
4]. Other attempts to elucidate the disease etiology include identifying epigenetic alterations that mediate environmental influences on aberrant gene expression. DNA methylation (DNAm) is the most widely studied and characterized epigenetic modification due to its scalability and its potential for clinical translation. Several investigators have demonstrated that the DNAm status at cg19693031 is highly correlated with both HbA1c values and T2D [
5,
6,
7]. However, these prior studies failed to account for potential confounding genetic influences. Given the dynamic cross-talk between genetic variation, DNA methylation and environmental exposures, these factors should not be considered as self-standing layers of pathophysiological regulation but should only be interpreted in light of each other [
8]. For example, several genetic variants for common complex diseases are not detected in GWAS analyses when the environmental influences are not included. Thus, this partially informed approach of traditional GWAS/EWAS analyses fails to adequately explain the interconnected network that underlies the development and progression of diabetes, which limits our ability to prevent and treat the disease.
In this communication, we use an omni-genic approach in an attempt to explain how the interactions between cg19693031 methylation and common variants in the cellular context of hyperglycemia can increase disease susceptibility. We then implement functional analyses to investigate possible mechanisms explaining the association between the methylation status of TXNIP’s 3′UTR and prevalent T2D. Finally, we examine if correcting for genetic confounding improves the ability of cg19693031 to detect T2D.
3. Results
3.1. Clinical and Demographic Characteristics
The key demographic and clinical characteristics of the 506 subjects are given in
Table 1. The subjects in each group were almost exclusively African American, and predominantly female. Congruent with the clinical observations, the diabetic subjects were significantly older and more obese than the normoglycemic and prediabetic subjects (
p = 1.29 × 10
−9 and
p = 1.12 × 10
−6, respectively). While the systolic and diastolic blood pressures were not significantly different between the groups, there was a higher prevalence of self-reported hypertension and anti-hypertensive therapy in the diabetic subjects. A total of 73 subjects self-reported a history of diabetes, with 70% of these subjects having an HbA1c ≥ 6.5% despite only 4% reporting anti-diabetic pharmacological treatment.
3.2. Identification of HbA1c-Associated DNA Methylation Loci
A total of 514,292 methylation probes survived the data cleaning and quality control measures. To identify HbA1c-associated DNAm loci, each probe was regressed against HbA1c values, controlling for age, sex and BMI. A total of 23 DNAm probes were associated with HbA1c at a false-discovery rate (FDR) of <5% (
Table 2). Consistent with prior studies, cg19693031 was the most highly associated probe (R
2 = 0.1976,
p = 4.43 × 10
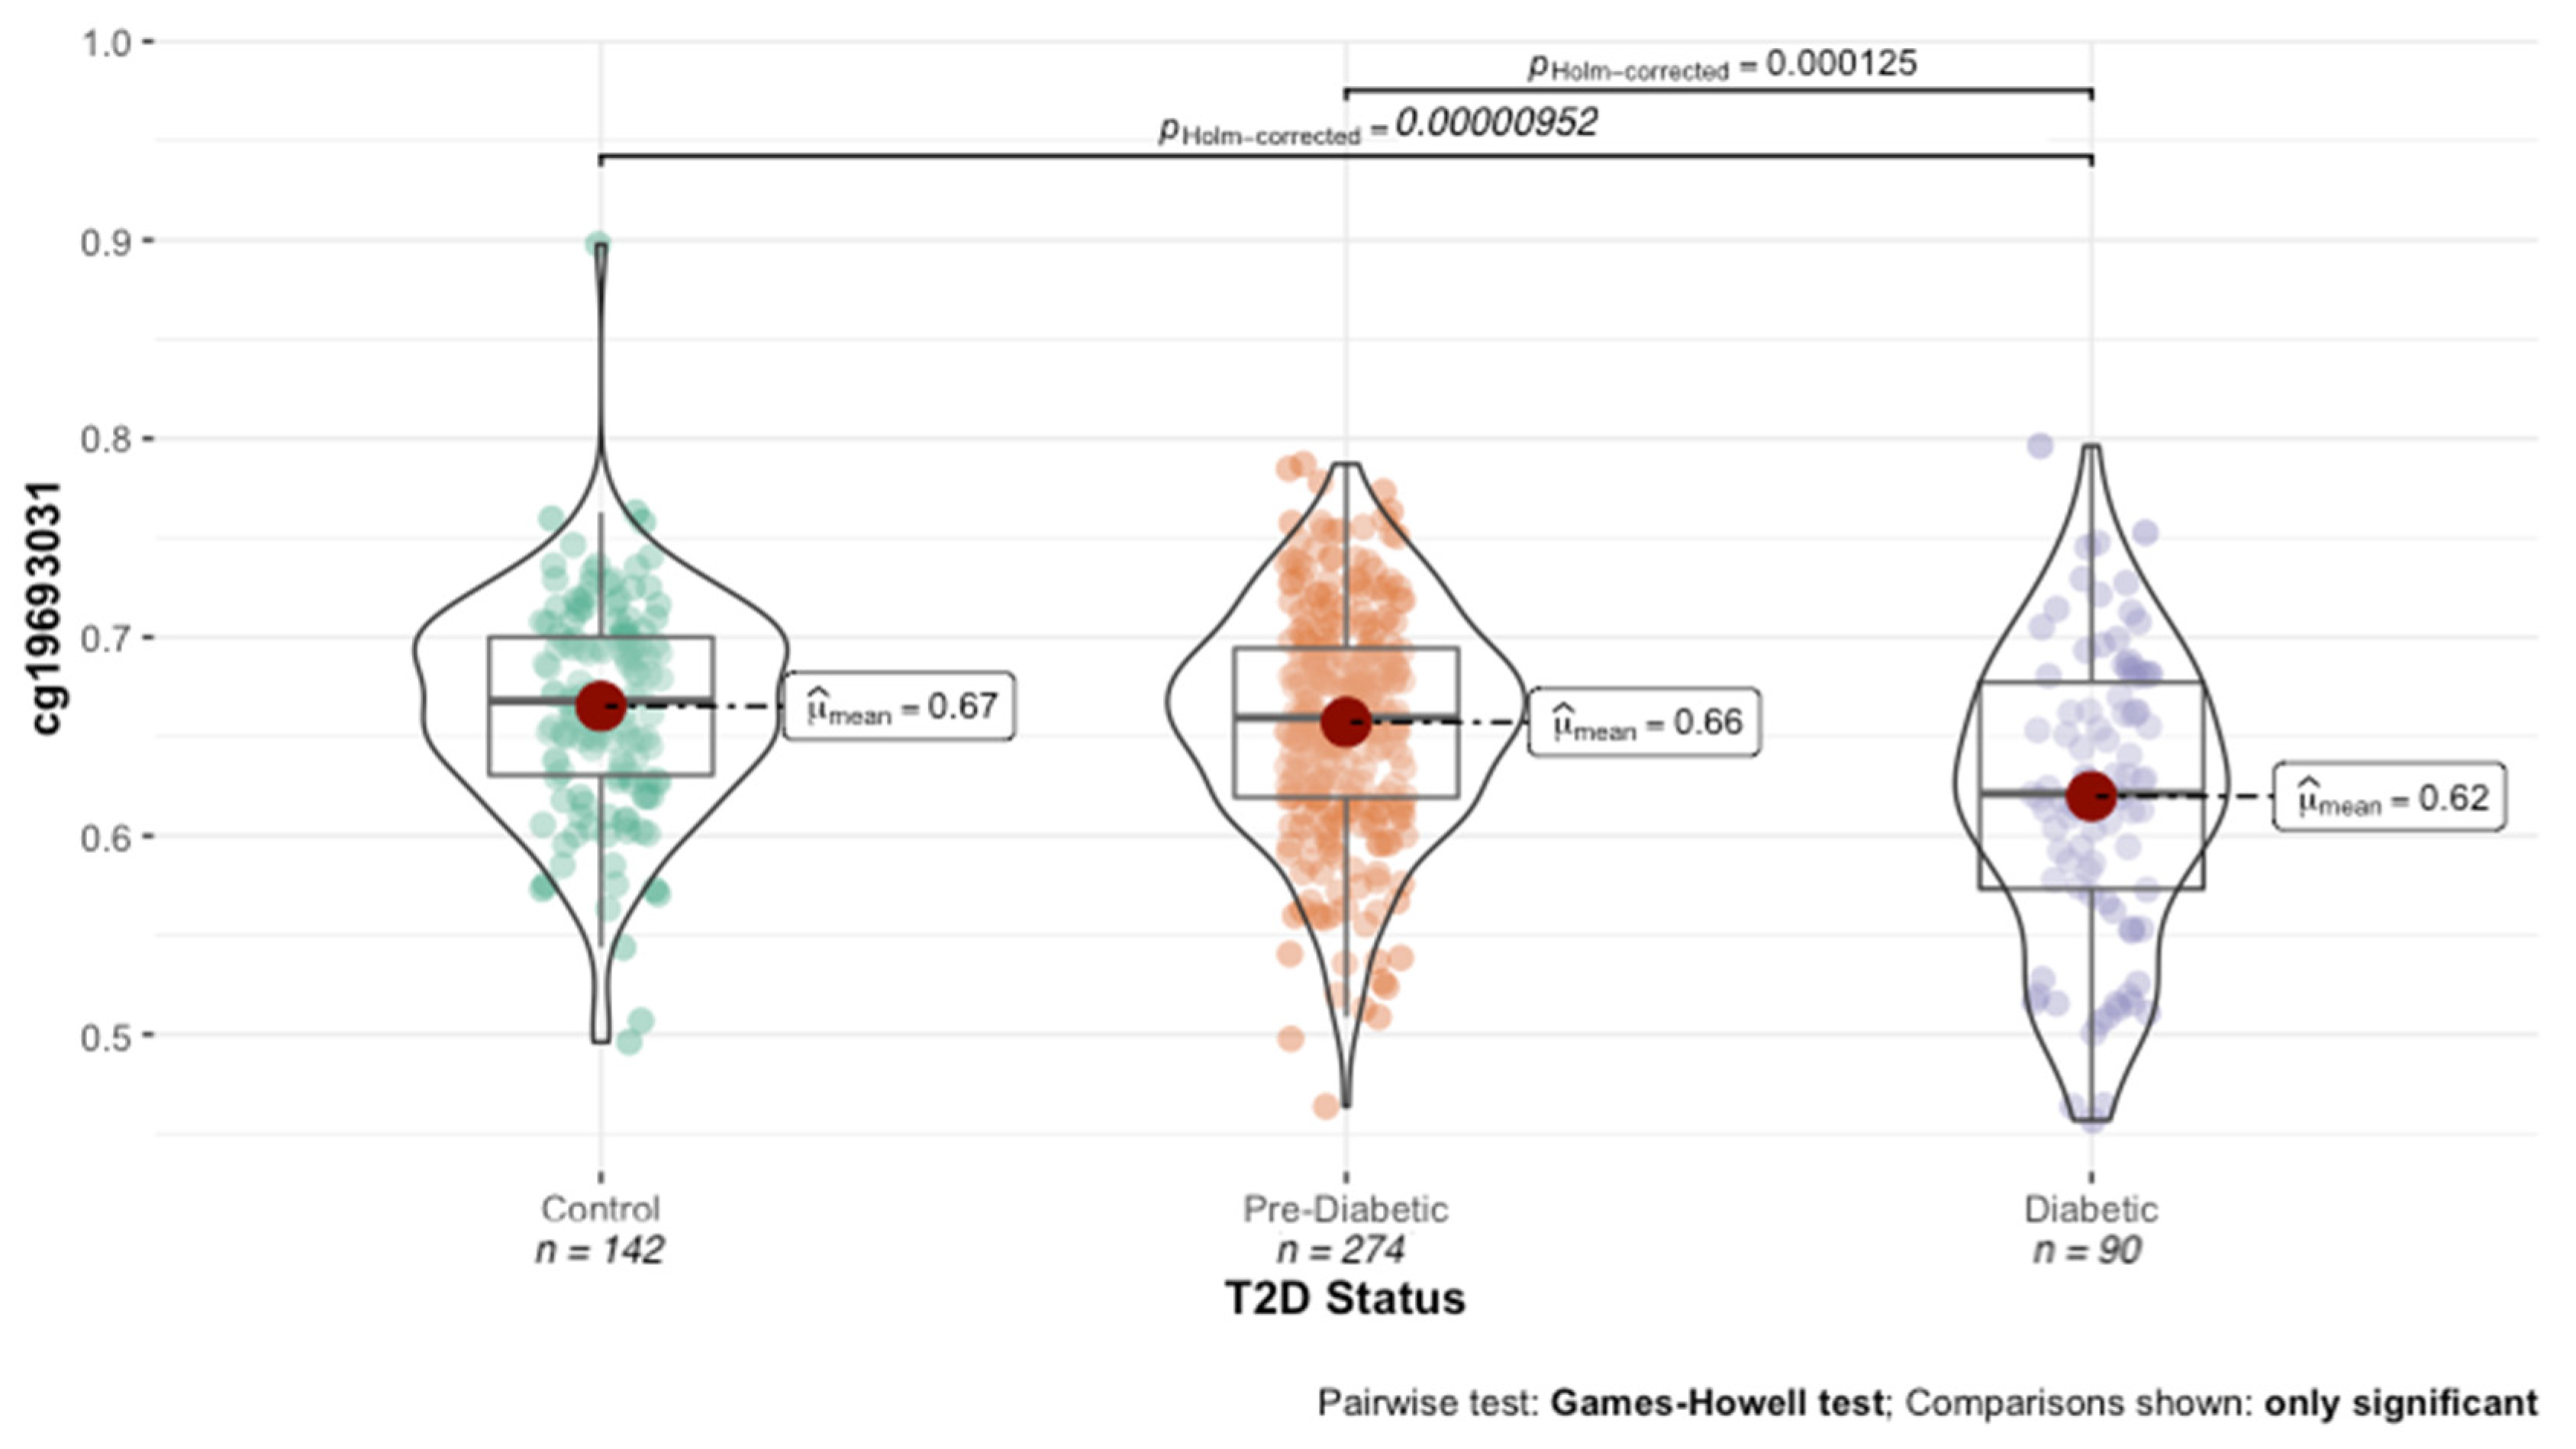
−12). As illustrated in
Figure 1, cg19693031 was significantly demethylated in diabetic subjects compared to both normoglycemic controls (62% vs. 66%; t = 5.089,
p = 1.06 × 10
−6) and prediabetic subjects (62% vs. 66%; t = −4.4165,
p = 2.12 × 10
−5).
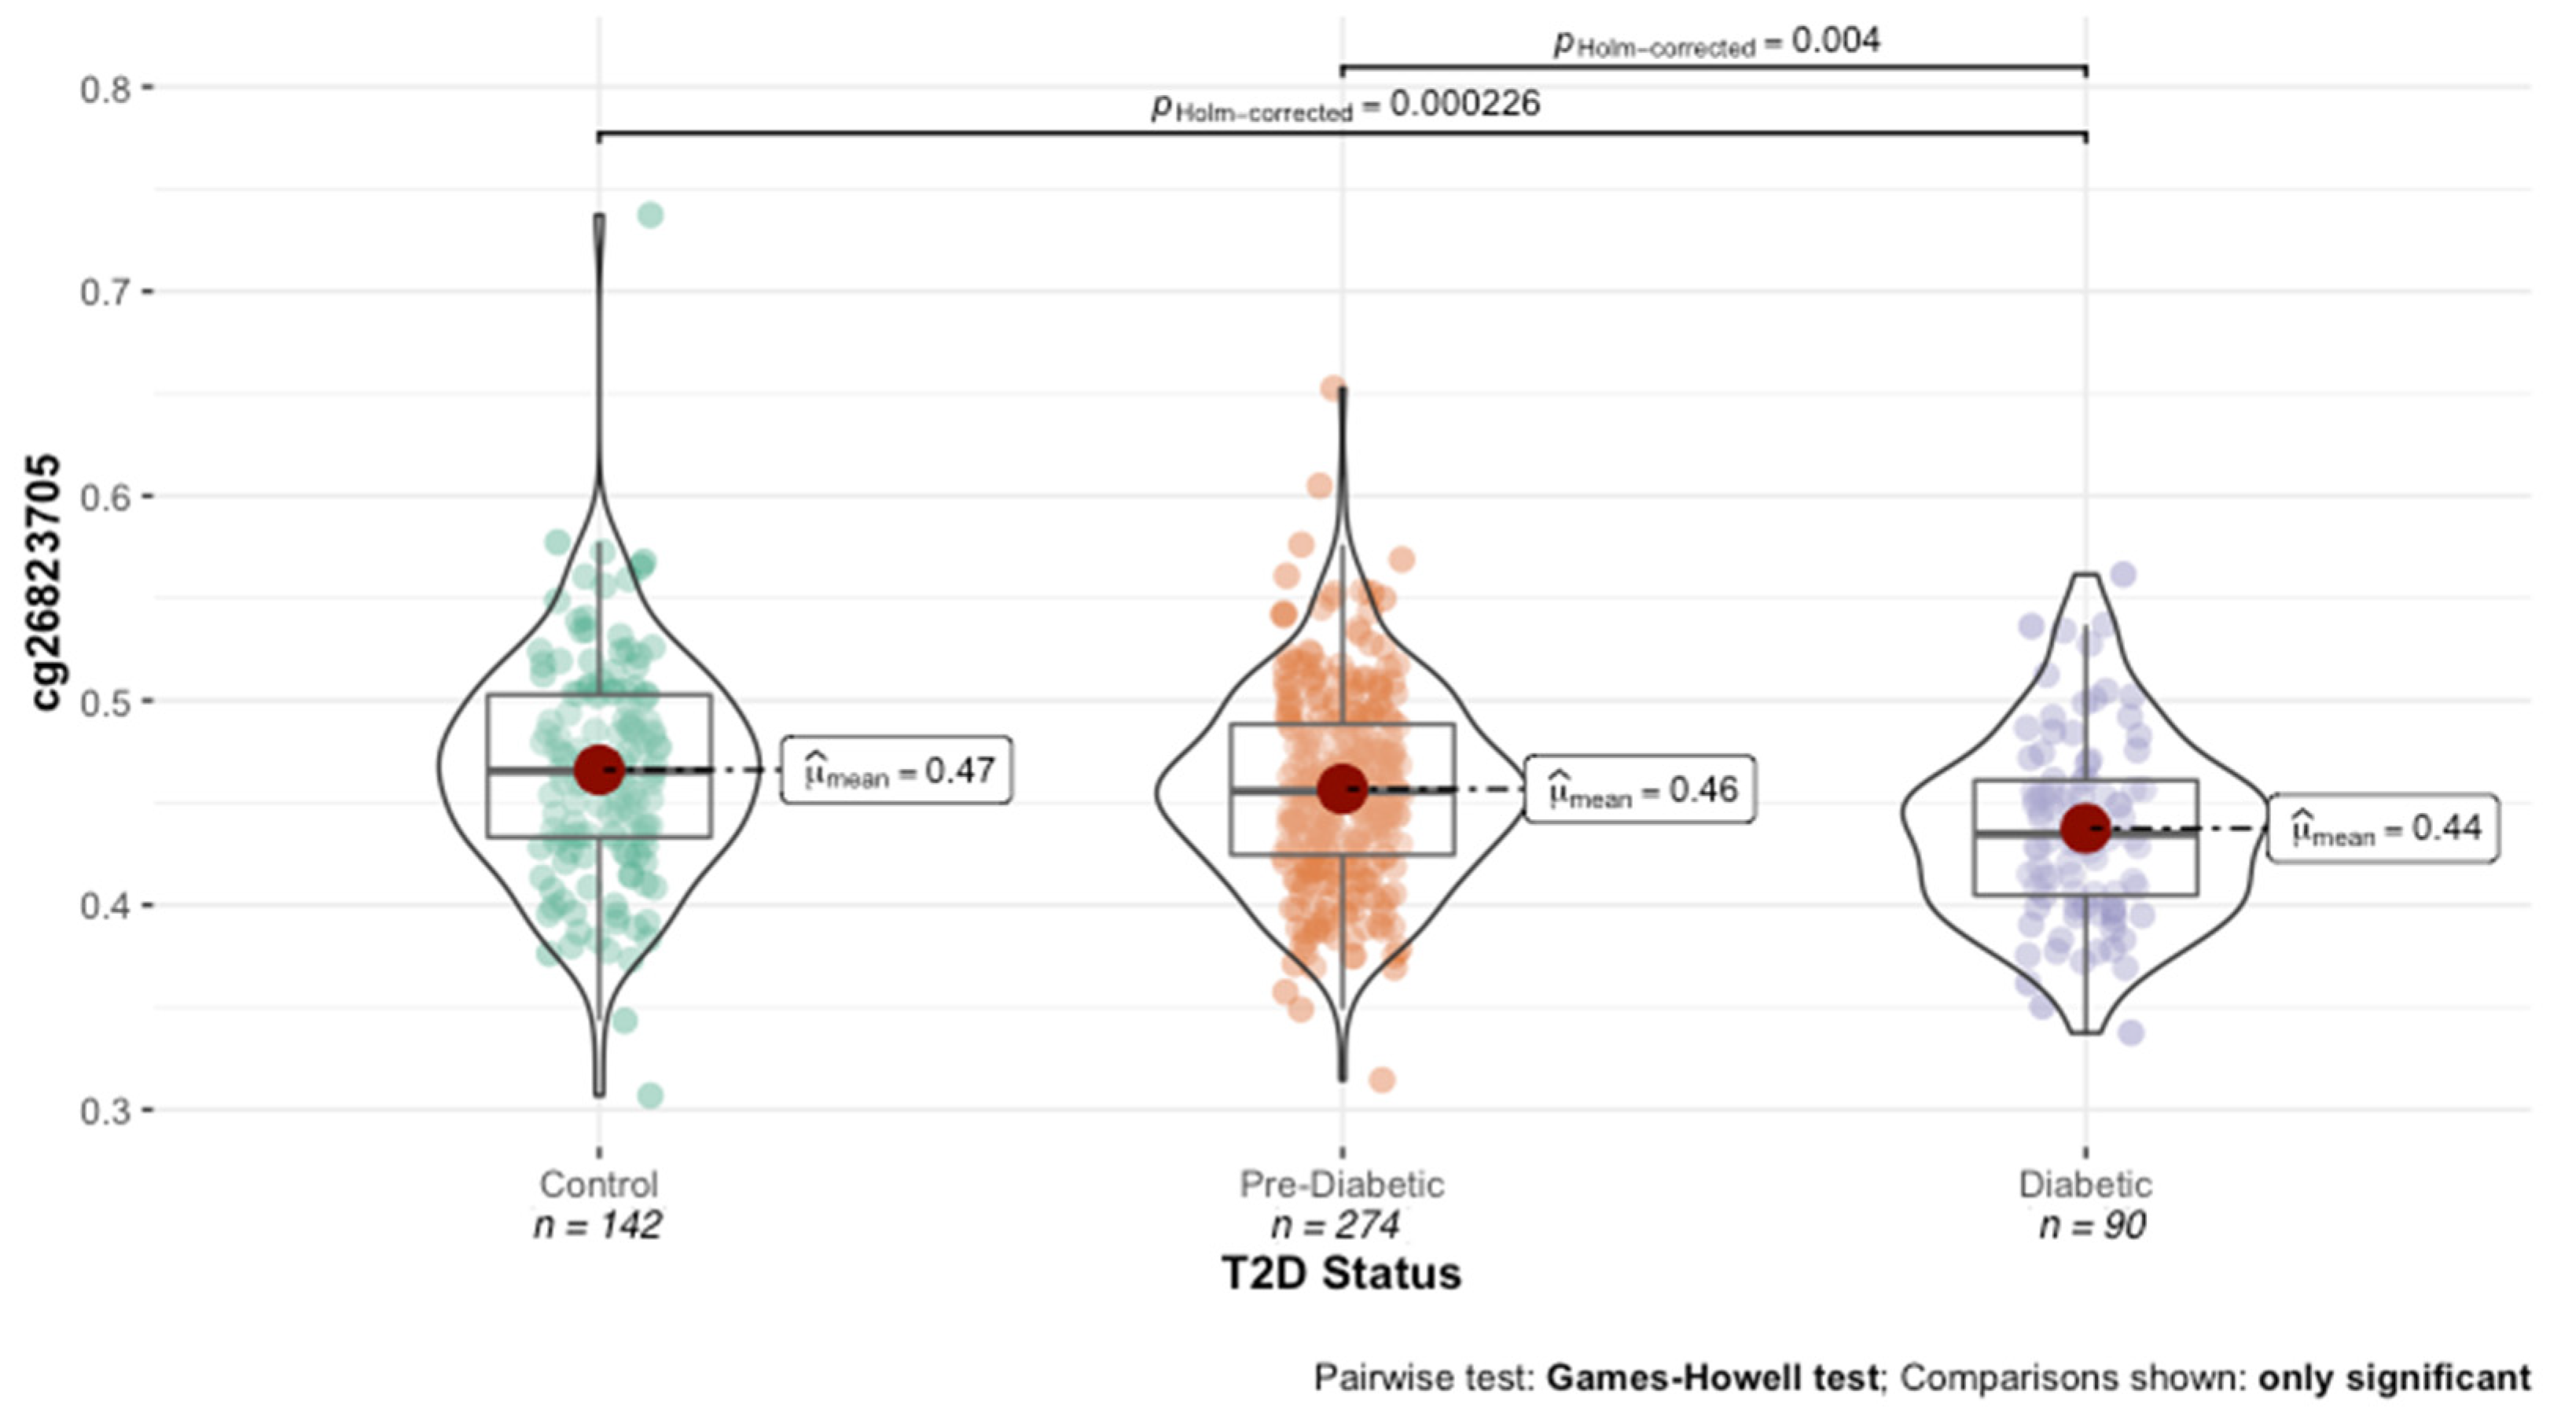
The distribution and variability of the methylation values were evaluated for each of the identified HbA1c-associated DNAm loci. With the exception of cg19693031 and cg26823705 (
Figure 2), the associations to HbA1c were driven by outliers. Consistent with the definition by Gentilini and colleagues, a total of 49 stochastic epimutations (SEMs) were identified in 27 subjects across the 23 DNAm loci. With the exception of cg1963031, SEMs were observed in each probe. The SEMs were significantly enriched in diabetic subjects (OR = 0.135, 95% CI = 0.072–0.248,
p-value = 1.40 × 10
−11, two-tailed Fischer’s exact test), with 30 of the 49 total number of SEMs found in diabetic subjects. Further, six subjects had more than one SEM across the twenty-three probes, four of whom were diabetic.
The SEMs were further classified into two groups based on the methylation value compared to the population. A total of 26 SEMs were hypermethylated and classified as high methylation outliers (HMO), and a total of 23 SEMs were hypomethylated and classified as low methylation outliers (LMO). Each of the 22 probes contained either HMOs (n = 11) or LMOs (n = 11); however, none contained both. Notably, 14 (54%) and 23 (70%) of the identified HMOs and LMOs were observed in diabetic subjects.
To further characterize the HMOs and LMOs, we examined their locations in relation to CpG island regions. The majority of DNAm loci with HMOs resided in CpG islands (
n = 7), with the remainder in open seas (
n = 3). Notably, the Hidden Markov Model predicts an additional three of these loci are located within an island. Comparatively, the majority of DNAm loci with LMOs resided in the open sea (
n = 8), with the remainder in subsequent shores (
n = 1), shelves (
n = 1) and islands (
n = 1). These findings are consistent with those previously reported by Wang et al. [
17]. All the DNAm loci with SEMs were excluded from further analyses.
A total of 37009 SEMs were detected in 64% (n = 13,528) of the 21269 HbA1c-associated DNAm probes with nominal significance. The total number of SEMs per probe ranged from 0 (n = 7740) to 102 across the 506 subjects. Of the 13,528 probes with SEMs detected, a majority (84%) contained less than five SEMs across the cohort. Additionally, a majority of the SEMs detected were HMOs (n = 25,620). The total number of SEMs per subject ranged from 3 to 7271 across the 21,269 probes, with a median of 20 ± 410 SEMs per subject. No relationship was observed in the number of SEMs with T2D status, age, gender or BMI. With the exception of cg19693031 and cg26823705, the association of each probe to HbA1c diminished after the removal of SEM observations.
3.3. Identification of HbA1c-Associated Polymorphic DNAm Loci
A total of 302,943 polymorphic probes were identified using the EPIC manifest file. Each probe was regressed against HbA1c values adjusted for age, sex and BMI. A total of 54 polymorphic probes were associated with HbA1c at an FDR < 5%. The top 30 ranked HbA1c-associated polymorphic probes are described in
Table 3.
Of the 54 polymorphic DNAm probes, the island status of 11 were identified. The majority resided in shores (n = 7), with the remainder in subsequent islands (n = 3) and shelves (n = 1). The 54 probes mapped to 37 unique genes, with functional enrichment using UniProt for alternative splicing (FDR p-value = 0.0016). These genes also mapped to several relevant KEGG pathways, including type 1 diabetes mellitus, insulin secretion, PI3K-Akt signaling and diabetic cardiomyopathy.
3.4. Genome-Wide cg19693031 meQTL Analyses
Methylation quantitative trait loci (meQTL) analyses were conducted in both cis and trans to identify genetic factors that confound the methylation status of cg19693031. As underlying genomic mechanisms may differ according to proximity, our analyses were separated into: (1) cis meQTL (SNP-CpG distance < 1 Mb,
n = 117), (2) long-range cis meQTL (>1 Mb intra-chromosomal,
n = 38,750) and (3) trans meQTL (inter-chromosomal,
n = 459,464). A total of 7 and 2052 meQTLs acting in cis and long-range cis were detected with nominal significance, with the degree of explained methylation variance ranging from 0.45% to 1.35% and 0.41% to 4.16%, respectively. While the cis long-range meQTLs explained more variance than those acting in cis, the magnitude of explained variance did not correlate with the SNP’s proximity to cg19693031. The meQTLs acting in cis are described in
Table 4, while the top 30 long-range cis-meQTLs are described in
Table 5. A total of 23,734 meQTLs acting in trans were also detected with nominal significance, with the degree of explained methylation variance ranging from 0.39% to 4.35%. Similar to those acting in cis, there were no observable differences between the chromosomes. The top 30 trans meQTLs are described in
Table 6.
To determine the magnitude of meQTL effects on cg19693031 methylation, a multivariate linear regression model was built using meQTLs that demonstrated an R2 ≥ 0.03 (long-range cis (n = 5) and trans (n = 18)). Using an additive step-wise approach, genetic factors were ranked and fed into the model based on their adj R2. The associations between two meQTLs and cg19693031 methylation were no longer observed when incorporated into the model and were dropped from further analyses. The final meQTL model captured 43.23% of the variance of cg19693031 methylation (p < 2.2 × 10⁻¹⁶).
It has been previously suggested that some of the meQTL effects may in fact be occurrences of genetic and environmental interactions (GxE). To better understand the genetic and environmental confounding architecture influencing the methylation of cg19693031, we assessed whether additive or interactive effects explain the variability of cg19693031 methylation better than genetic factors alone. As a means of comparison, HbA1c was first regressed against cg19693031 methylation adjusted for age (R2 = 0.1314, p < 2.2 × 10⁻¹⁶). With the incorporation of HbA1c values to the final meQTL model (G + E), the amount of variance captured increased by 6% (R2 = 0.4968, p < 2.2 × 10⁻¹⁶). Using ANOVA, the additive G + E model significantly outperformed the genetic factors alone (p = 2.62 × 10⁻¹⁴).
Next, GxE analyses were conducted and compared to the G + E effects for each of the 21 retained meQTLs. Only one meQTL, rs74439, demonstrated a significant GxE term (
p = 0.0146). The GxE effect explained ~ 1% more variance than the G + E model (R
2 = 0.1712 vs. R
2 = 0.1630) and demonstrated a significantly better fit (ANOVA:
p = 0.0156). Incorporating the rs74439 GxE term to the final G + E meQTL model captured an additional 1% of the variance (
Table 7: R
2 = 0.5077,
p < 2.2 × 10
−16), and explained the variability of cg19693031 methylation better than genetic or additive G + E factors alone (ANOVA:
p = 8.896 × 10
−16 and
p = 7.49 × 10
−4, respectively).
3.5. Functional Mapping of meQTL SNPs
Next, we performed secondary analyses to better characterize the functional effects of genetic variation on cg19693031 methylation. The leading hypothesis to explain cis-meQTL effects is that, if a meQTL is located in a TFBS and hinders the TF from binding, the methylation of surrounding CpGs can be altered directly (recruitment of DNMT or TET enzymes) or indirectly.
Of the 25,792 meQTLs, a total of 21 had confirmed associations with T2D via genome-wide association studies. Additionally, a total of 986 are located within exons and 335 are missense mutations. The meQTL SNPs mapped to 4687 genes, with enrichment of two or more SNPs found within 2075 genes. These genes functionally map to several processes, including: alternative splicing (p = 2.09 × 10⁻²⁵), ABC transporters (p = 1.7 × 10⁻⁴), insulin secretion (p = 8.1 × 10⁻⁴), lymphocyte mediated immunity (p = 2.61 × 10⁻⁴), immunoglobulin production (p = 1.19 × 10⁻⁴), complement activation (p = 2.50 × 10⁻⁶), immune system process (p = 2.32 × 10⁻⁷) and calcium ion transmembrane transporter activity (p = 6.23 × 10⁻⁴).
To gain insights into the molecular networks involved in nuclear regulation underlying the relationship between genetic variation and cg19693031 methylation, we assessed whether the proximal candidate gene at a trans-acting locus showed covariation with cg19693031 methylation. Using data from the eQTLGen Consortium (n = 31,684 samples), a total of 14,826 cis-eQTL associations with 5955 unique trans-meQTLs were identified with Bonferroni-corrected significance, with 3249 meQTL SNPs influencing the expression of 2+ genes. The identified cis-eQTLs mapped to 6861 unique genes, with enrichment of two or more cis-eQTLs influencing 3542 genes.
While the biological mechanisms underlying cis-meQTLs are easily understood and experimentally demonstrated, few clear examples for trans have been uncovered. The simplest hypothesis is that SNPs that act as eQTLs of global methylation regulators have downstream effects as trans-acting meQTLs. A similar potential mechanism is that an SNP residing in the coding region of methyl-specific-binding-proteins could alter their specificity and function and, therefore, modify the DNAm of their binding sites. To that end, several of the identified eQTL genes are known methylomic regulators, including: DNAm writers (DNMT1 and DNMT3a), readers (MBD2, MBD5, UHRF1, UHRF2 and BAZ2B) and erasers (TDF and SMUG1). Further, several of the eQTL genes are known regulators of TXNIP, including: transcription factors (FOXO1, HSF2, RXRA and KLF6), chromatin modifications (HDACs and NF-YA) and factors regulating mRNA turnover (mir-17, ZFP36, NEDD1, NEDD4, NEDD9, WWP1, SMURF2 and HECW2). Provided that distal residues can be brought into physical proximity by 3D structures, an SNP could affect DNAm levels at CpG sites in trans by acting either through cis-meQTL mechanisms or by disrupting the formation of structural loops. To that end, two of the three cohesion subunits were identified as an eQTL gene (SMC3 and RAD21).
To gain insights into the potential role of trans meQTL effects on cg19693031 in the pleiotropic functions of TXNIP, functional gene mapping was conducted utilizing KEGG and GO. The eQTL genes mapped to key pathways that are associated with TXNIP’s pathophysiological role in diabetes and coronary heart disease, including: metabolic pathways (
n = 504), PI3K-Akt signaling (
n = 95), MAPK signaling (
n = 81), cytokine-cytokine receptor interaction (
n = 72), Rap1 signaling (
n = 66), lipid and atherosclerosis (
n = 65), ras signaling (
n = 59), calcium signaling (
n = 56), mTOR (
n = 55), cAMP signaling (
n = 52), diabetic cardiomyopathy (
n = 49), insulin signaling pathway (
n = 48), apoptosis (
n = 46), Wnt signaling (
n = 45), insulin resistance (
n = 45), AMPK signaling (
n = 45), FoxO signaling (
n = 44), natural killer cell mediated cytotoxicity (
n = 44), non-alcoholic fatty liver disease (
n = 43), TNF signaling (
n = 39), leukocyte transendothelial migration (
n = 37), NK-kappa B signaling (
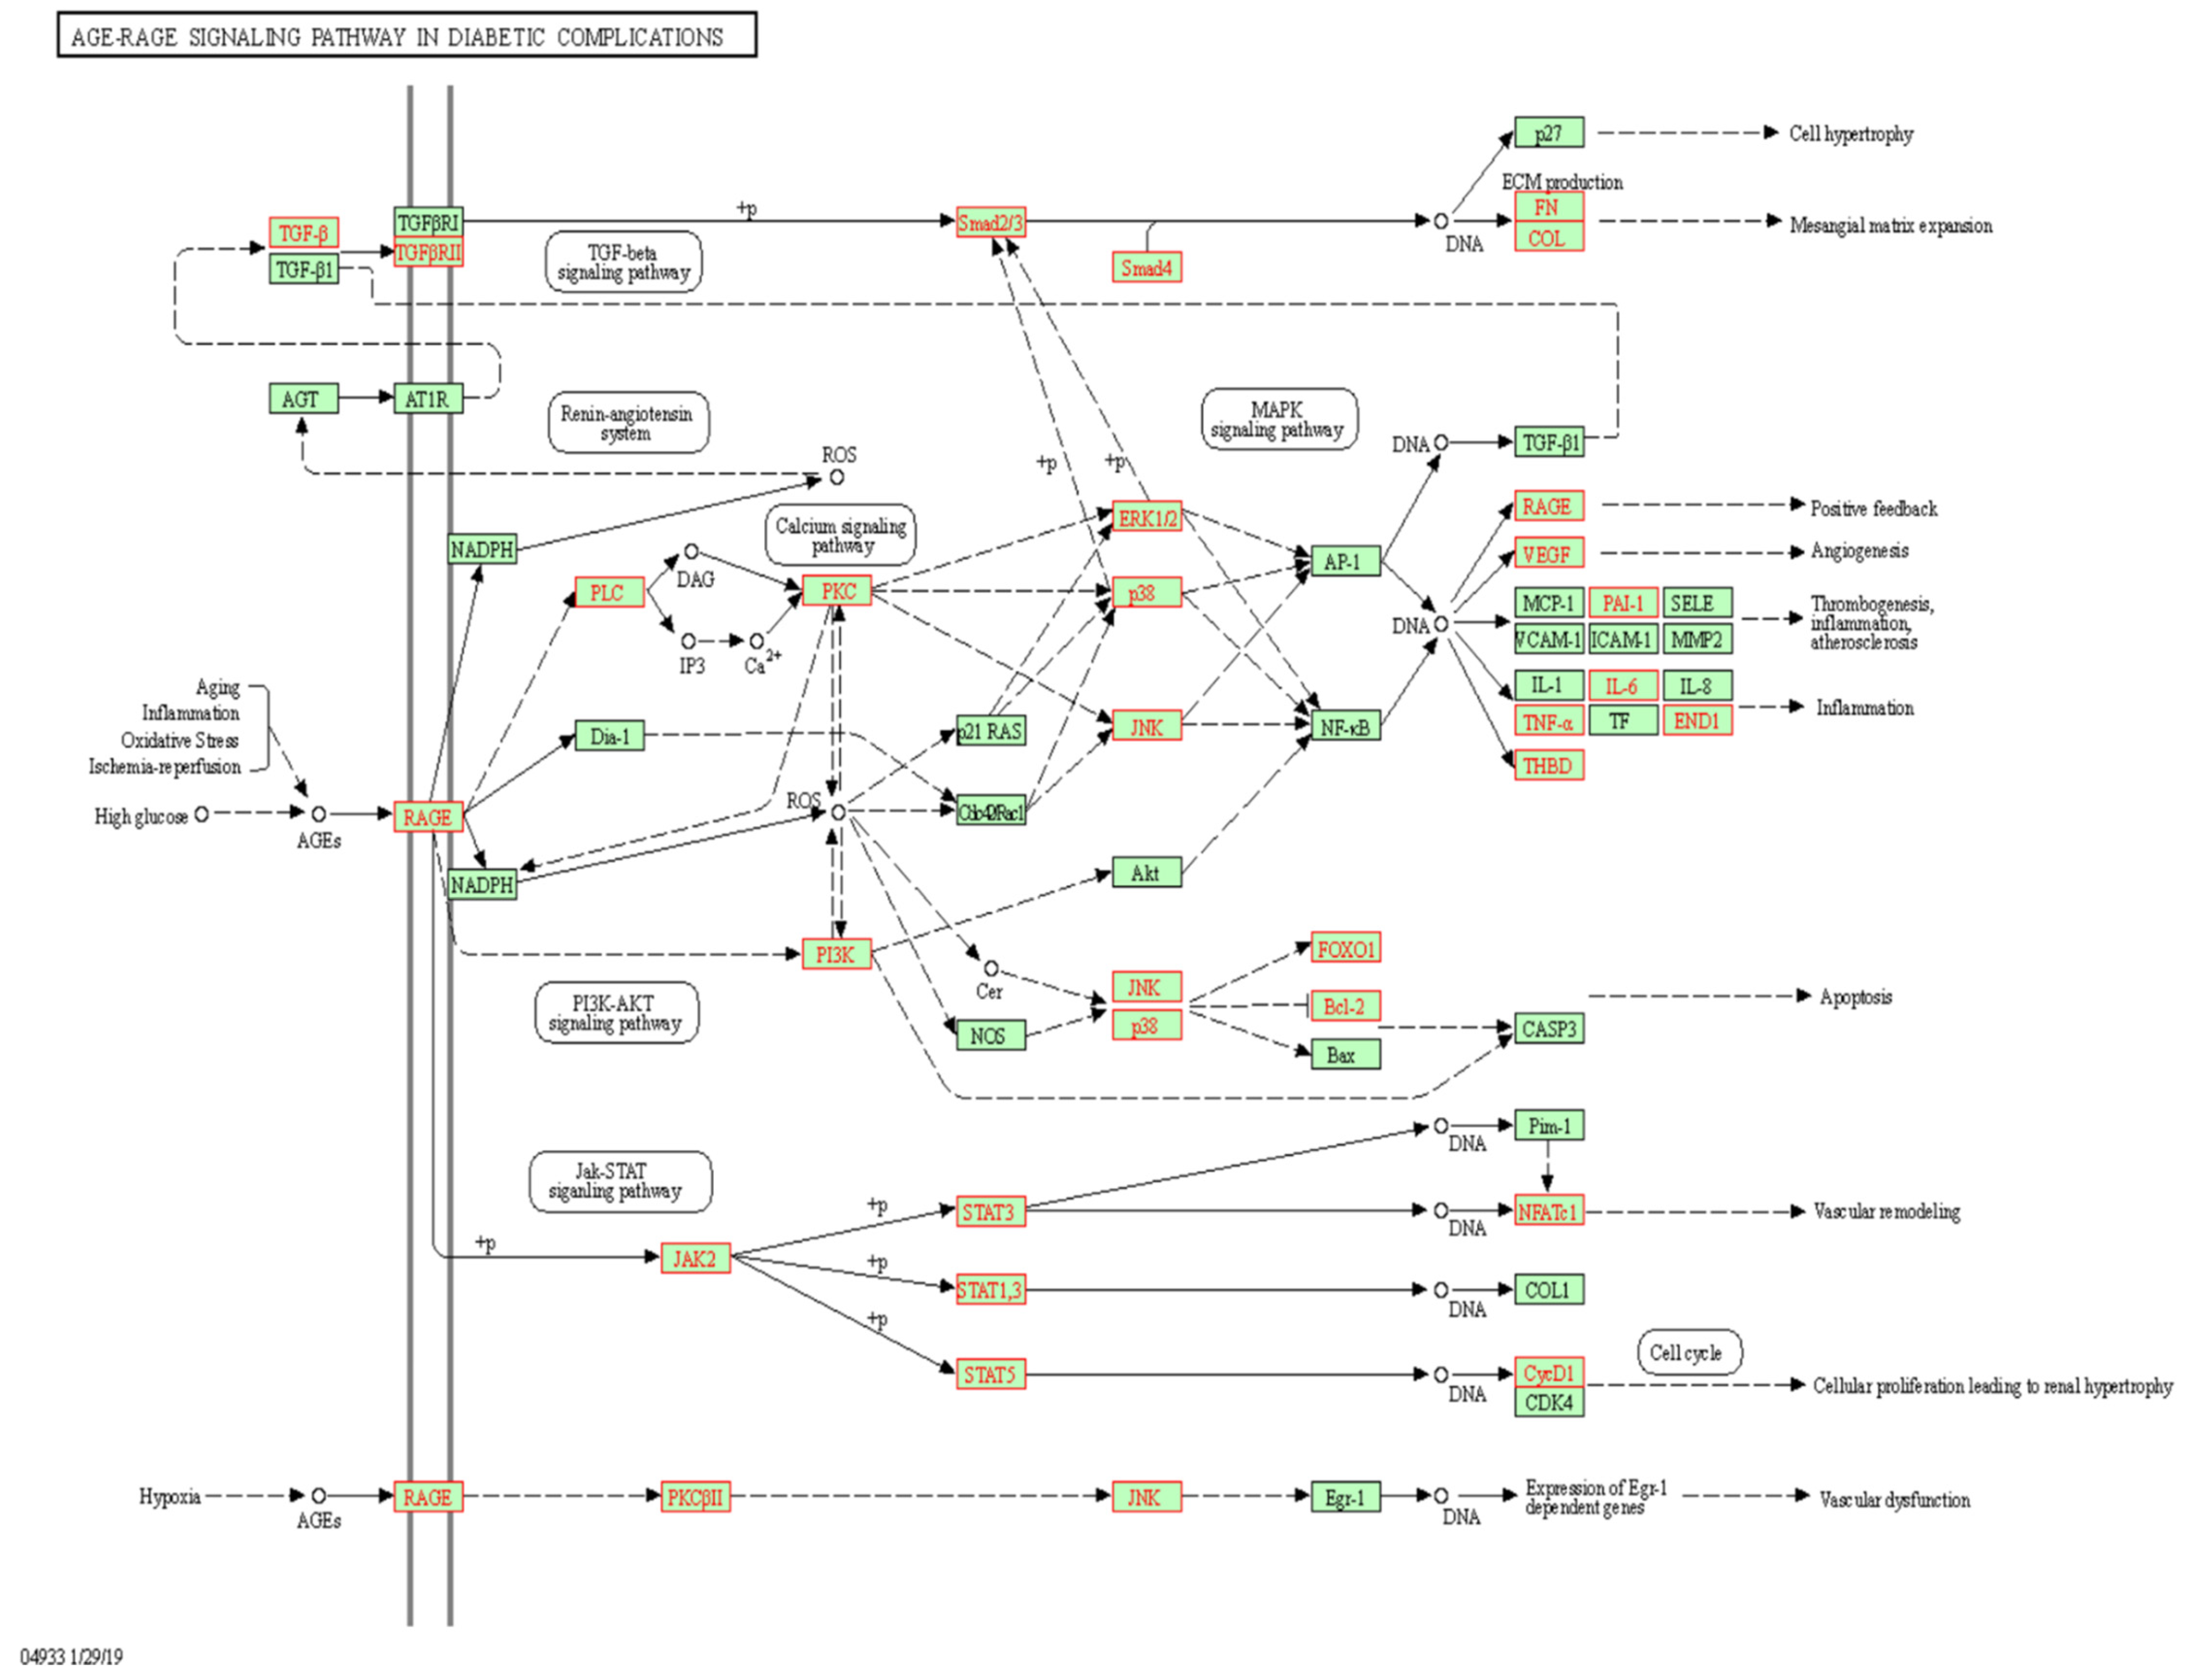
n = 35), AGE-RAGE signaling pathway in diabetic complications (
n = 34), TGF-β signaling (
n = 33), b cell receptor signaling (
n = 33), glucagon signaling (
n = 27), type 1 diabetes (
n = 23), PPAR signaling (
n = 21), hypertrophic cardiomyopathy (
n = 21), regulation of lipolysis in adipocytes (
n = 18), glycolysis and gluconeogenesis (
n = 18), insulin secretion (
n = 18), ABC transporters (
n = 17) and type 2 diabetes (
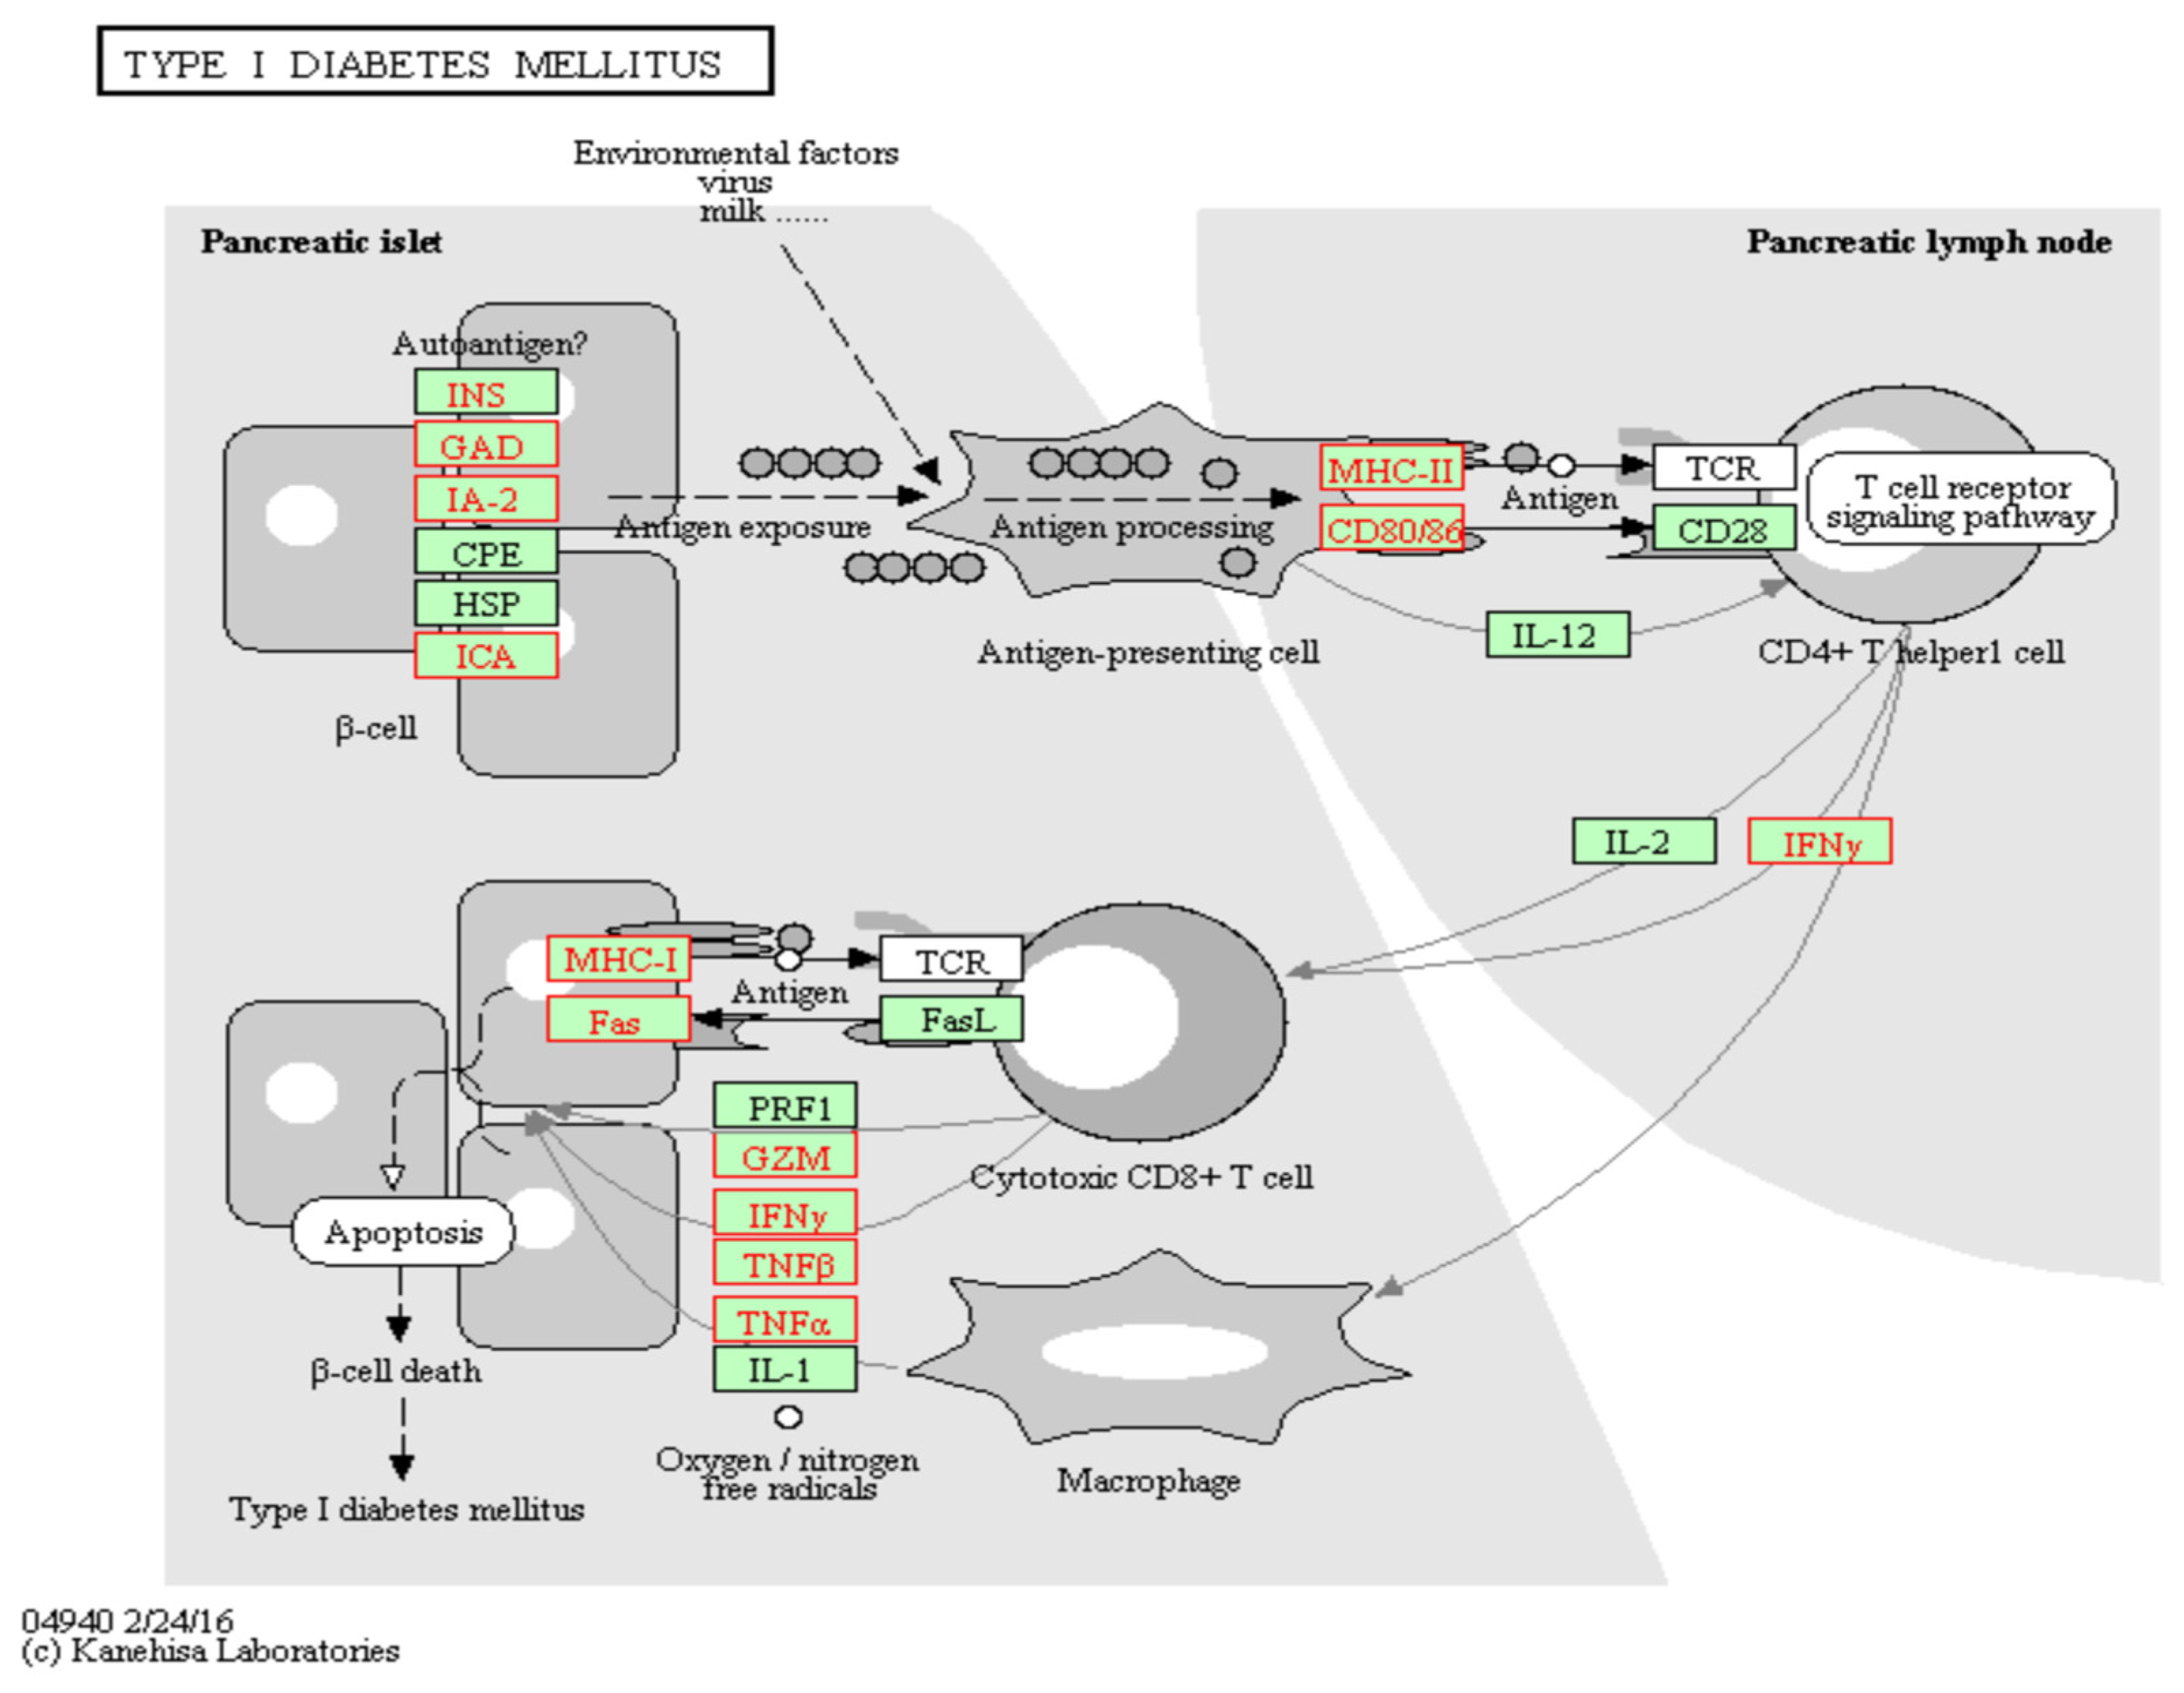
n = 12). The eQTLs identified in type I diabetes and AGE-RAGE signaling in diabetic complications are illustrated in
Figure 3 and
Figure 4, respectively. TXNIP exerts its effects, in part, through the negative regulation of thioredoxin, which both TXN and TXN2 were identified as eQTL genes. Further, the eQTL genes also mapped to pathways associated with TXNIP’s pathophysiological role in cancer and neurodegenerative diseases, including: pathways in cancer (
n = 159), pathways in neurodegeneration (
n = 135), Alzheimer’s disease (
n = 105), Huntington disease (
n = 81), Parkinson’s disease (
n = 68), microRNAs in cancer (
n = 66), proteoglycans in cancer (
n = 65), chemical carcinogenesis—ROS (
n = 60), transcriptional regulation in cancer (
n = 59), hepatocellular carcinoma (
n = 52), Hippo signaling pathway (
n = 50), cellular senescence (
n = 49), breast cancer (
n = 34) and p53 pathway (
n = 29).
3.6. Genome-Wide cg19693031 GxE Analysis
To gain a better understanding of the genetically contextual effect of HbA1c levels on cg19693031 methylation, genome-wide GxE analyses were conducted. A total of seven and 1355 GxE terms acting in cis and long-range cis were detected with nominal significance, with the degree of explained methylation variance ranging from 13.31% to 14.05% and 12.32% to 16.67%, respectively. A total of 16,760 GxE terms acting in trans were detected with nominal significance, with the degree of explained variance ranging from 10.98% to 17.80%. Of the 18,797 GxE terms, a total of 964 were identified in our meQTL analyses (long-range cis: n = 81; trans: n = 883).
To determine the magnitude of GxE effects on cg19693031 methylation, an additive step-wise linear regression was fit using GxE terms that demonstrated an adj R
2 ≥ 0.1550 and did not contain missing values (
n = 44). Notably, a majority of the retained GxE terms were previously identified as meQTLs (
n = 32). The features were ranked and fed into the model based on their adj R
2, with retainment dependent on each feature remaining significant and a significant increase in the captured variance. A total of six GxE terms were retained for the final GxE model. The final model explained 27.78% of the variance of cg19693031 methylation (
Table 8:
p < 2.2 × 10
−16), and significantly improved the fit compared to HbA1c alone (ANOVA:
p < 2.2 × 10
−16).
Next, we performed secondary analyses to better characterize the functional effects of the genetic variation of the GxE loci on cg19693031 methylation. Of the 18,797 SNPs, a total of nine had confirmed associations with T2D via genome-wide association studies. Additionally, a total of 681 are located within exons and 261 are missense mutations. The 18,797 GxE SNPs mapped to 3808 genes, with enrichment of two or more SNPs found within 1533 genes. Interestingly, these genes functionally mapped to alternative splicing (p = 1.183 × 10−36, the same as the HbA1c-associated polymorphic DNAm probes and meQTLs. Similar to the meQTLs, the GxE network mapped to several key TXNIP mechanistic pathways, including the cell adhesion (p = 1.74 × 10⁻¹¹), glutamatergic synapse (p = 1.89 × 10⁻⁵), calcium signaling pathway (p = 1.7 × 10⁻⁴), insulin secretion (p = 1.6 × 10⁻³) and PI3K-Akt signaling pathway (p = 1.6 × 10⁻³).
3.7. Integrated Model of Genetic and Environmental Effects for cg19693031
Next, we assessed whether an integrated genetic and environmental model accounting for additive and interactive effects explains cg19693031 methylation variability better than either alone. Using a similar step-wise approach, a total of 20 G + E and 6 GxE terms were used to build the integrated model. The final integrated model captured 55.15% of the methylation variance (
Table 9:
p < 2.2 × 10
−16) and performed significantly better than the genetic factors alone (ANOVA: 3.79 × 10
−8).
3.8. cg19693031 Methylation Classifier for Predicting T2D Status
To determine the ability of cg19693031 to predict T2D status, a series of logistic regression classifiers were built, adjusting for age, sex and BMI. The covariate and cg19693031 models performed equally well in distinguishing diabetic from normoglycemic subjects (
Table 10A: AUC = 0.72 and AUC = 0.73, respectively), and prediabetic from normoglycemic subjects (
Table 10B: AUC = 0.52 and AUC = 0.53, respectively). However, the model incorporating cg1963031 performed better than the covariate model alone in distinguishing diabetic from prediabetic subjects (
Table 10C: AUC = 0.68 and AUC = 0.72, respectively).
To determine if correcting for confounding local TXNIP genetic variation improves the predictive ability of the cg19693031 models for T2D status, a series of logistic regression classifiers were built, adjusting for age, sex and BMI. Three SNPS located within TXNIP that were previously identified as being associated with diabetes and cardiovascular disease were assessed. Of these, two were located near cg19693031 in the 3′UTR (rs7211 and rs7212), and one SNP was located in the 5′UTR. The incorporation of any local SNP or the addition of all three did not significantly improve the cg19693031 models for T2D status (
Table 10).
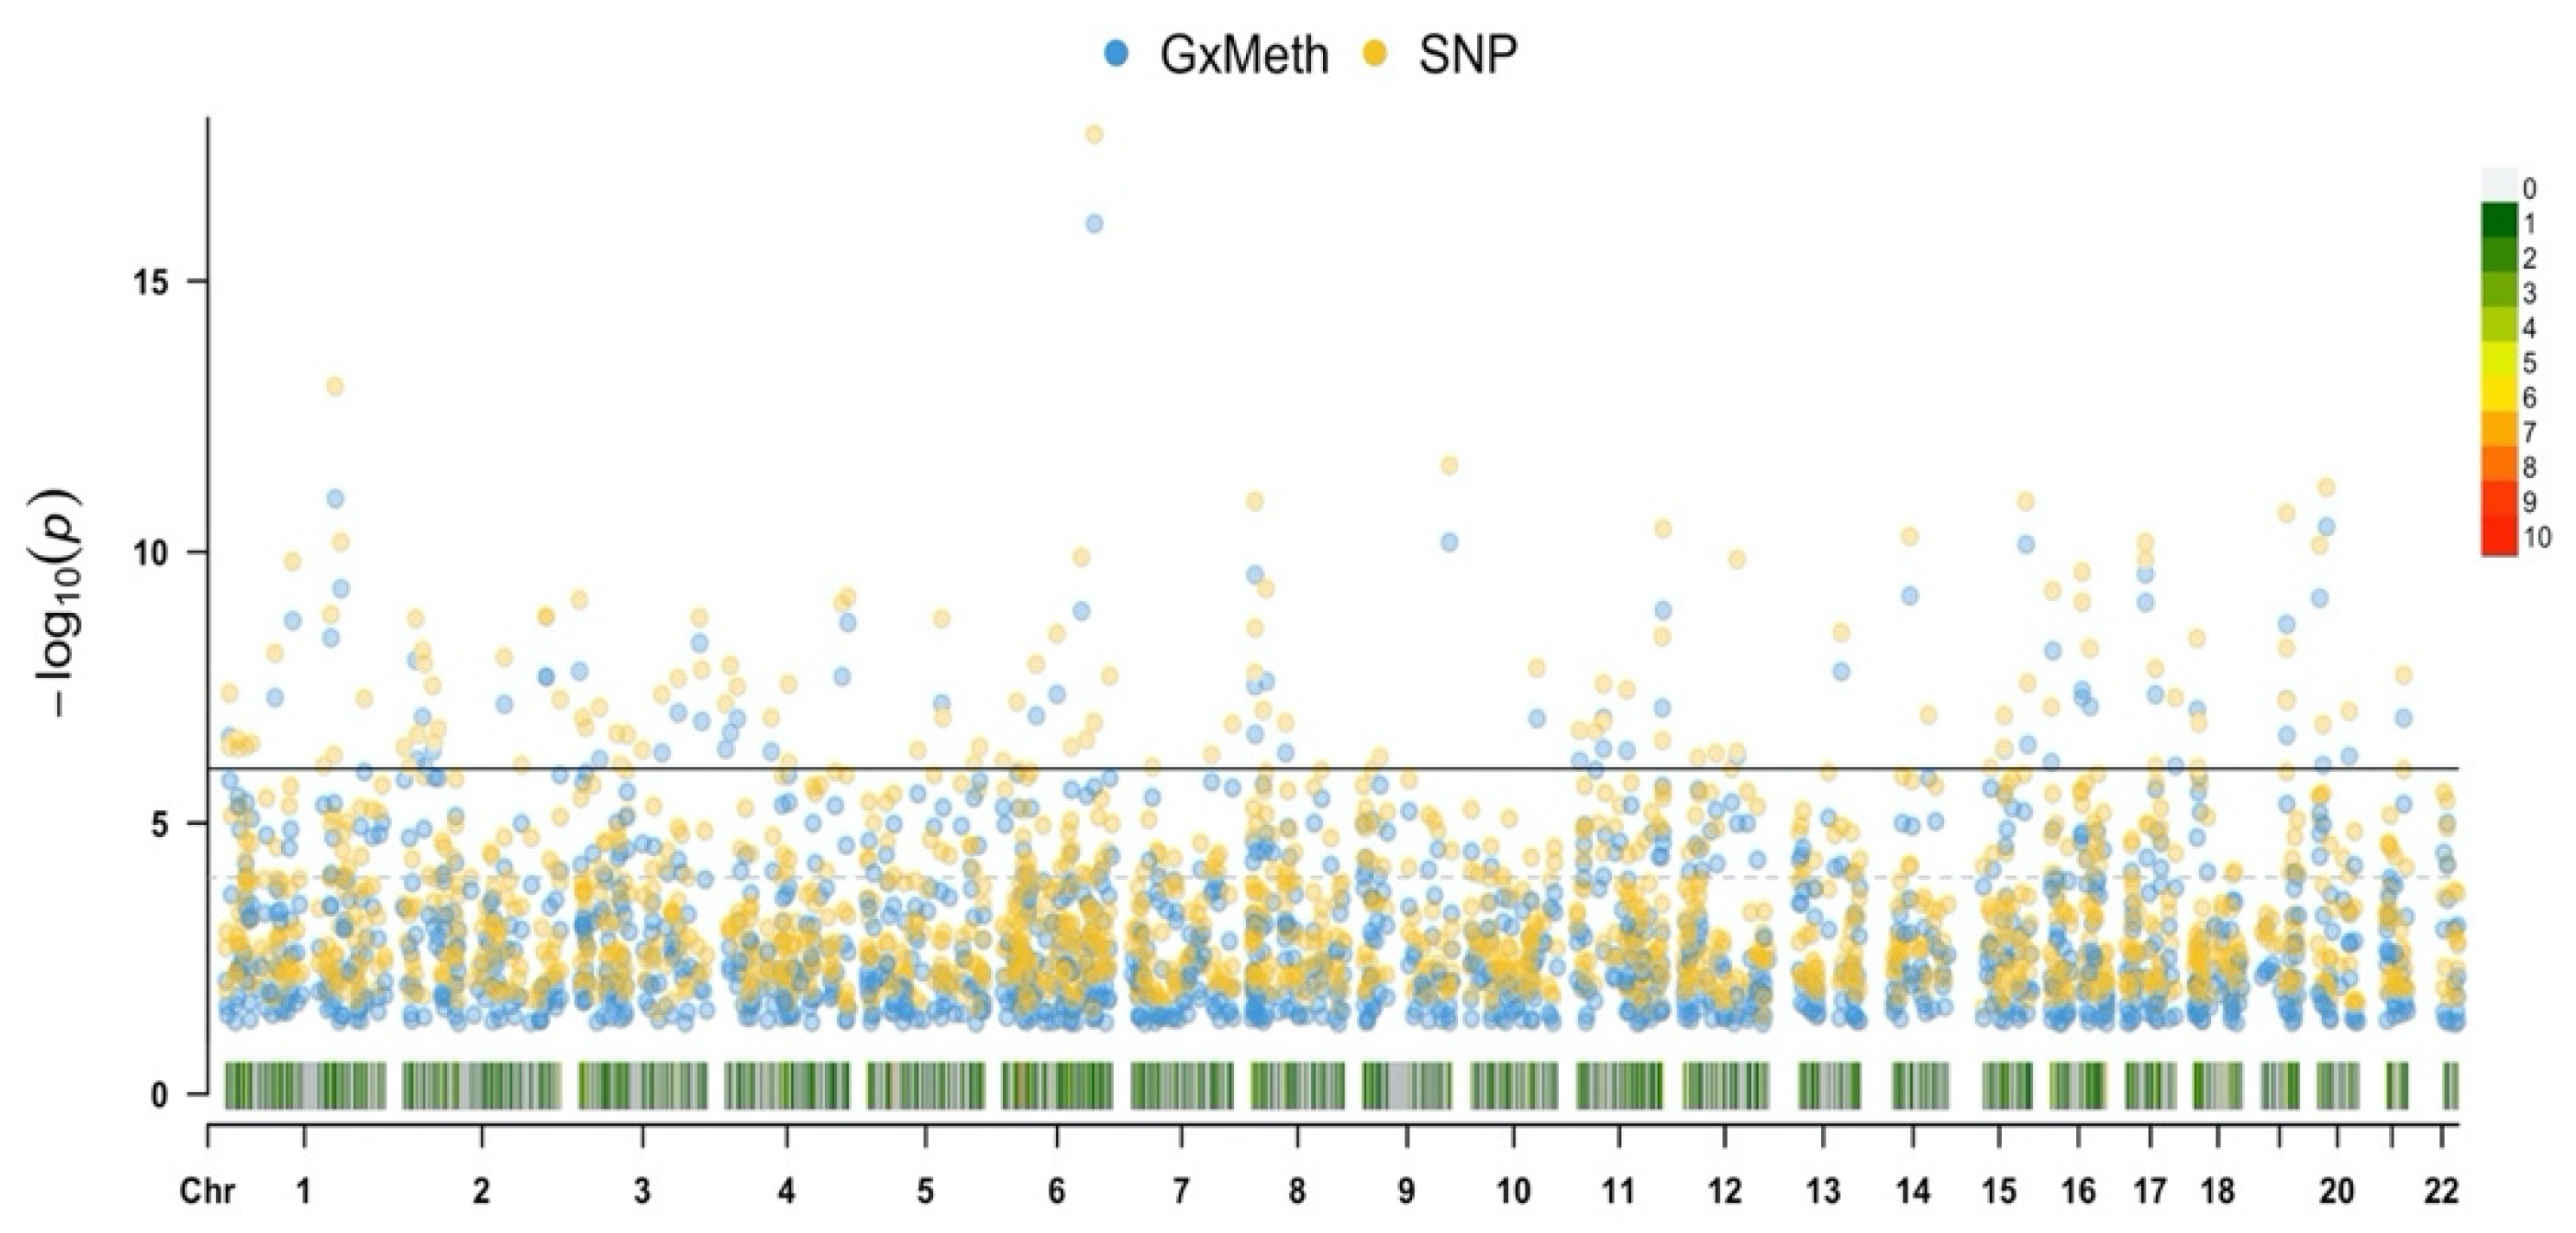
3.9. Genome-Wide cg19693031 GxMeth Analyses for HbA1c
Based on the understanding that trans genetic variation can confound DNA methylation status, we conducted a genome-wide analysis of SNP interactions with cg19693031 using the Multi-Ethnic Beadchip. The HbA1c values were regressed against additive and interactive GxMeth terms for each SNP, controlling for age, sex and BMI, with a total of 614,729 independent analyses conducted. After correcting for multiple comparisons, a total of 1476 and 1987 SNPs had significant GxMeth and additive effects, respectively (
Figure 5). The top-25-ranked GxMeth SNPs are provided in
Table 11.
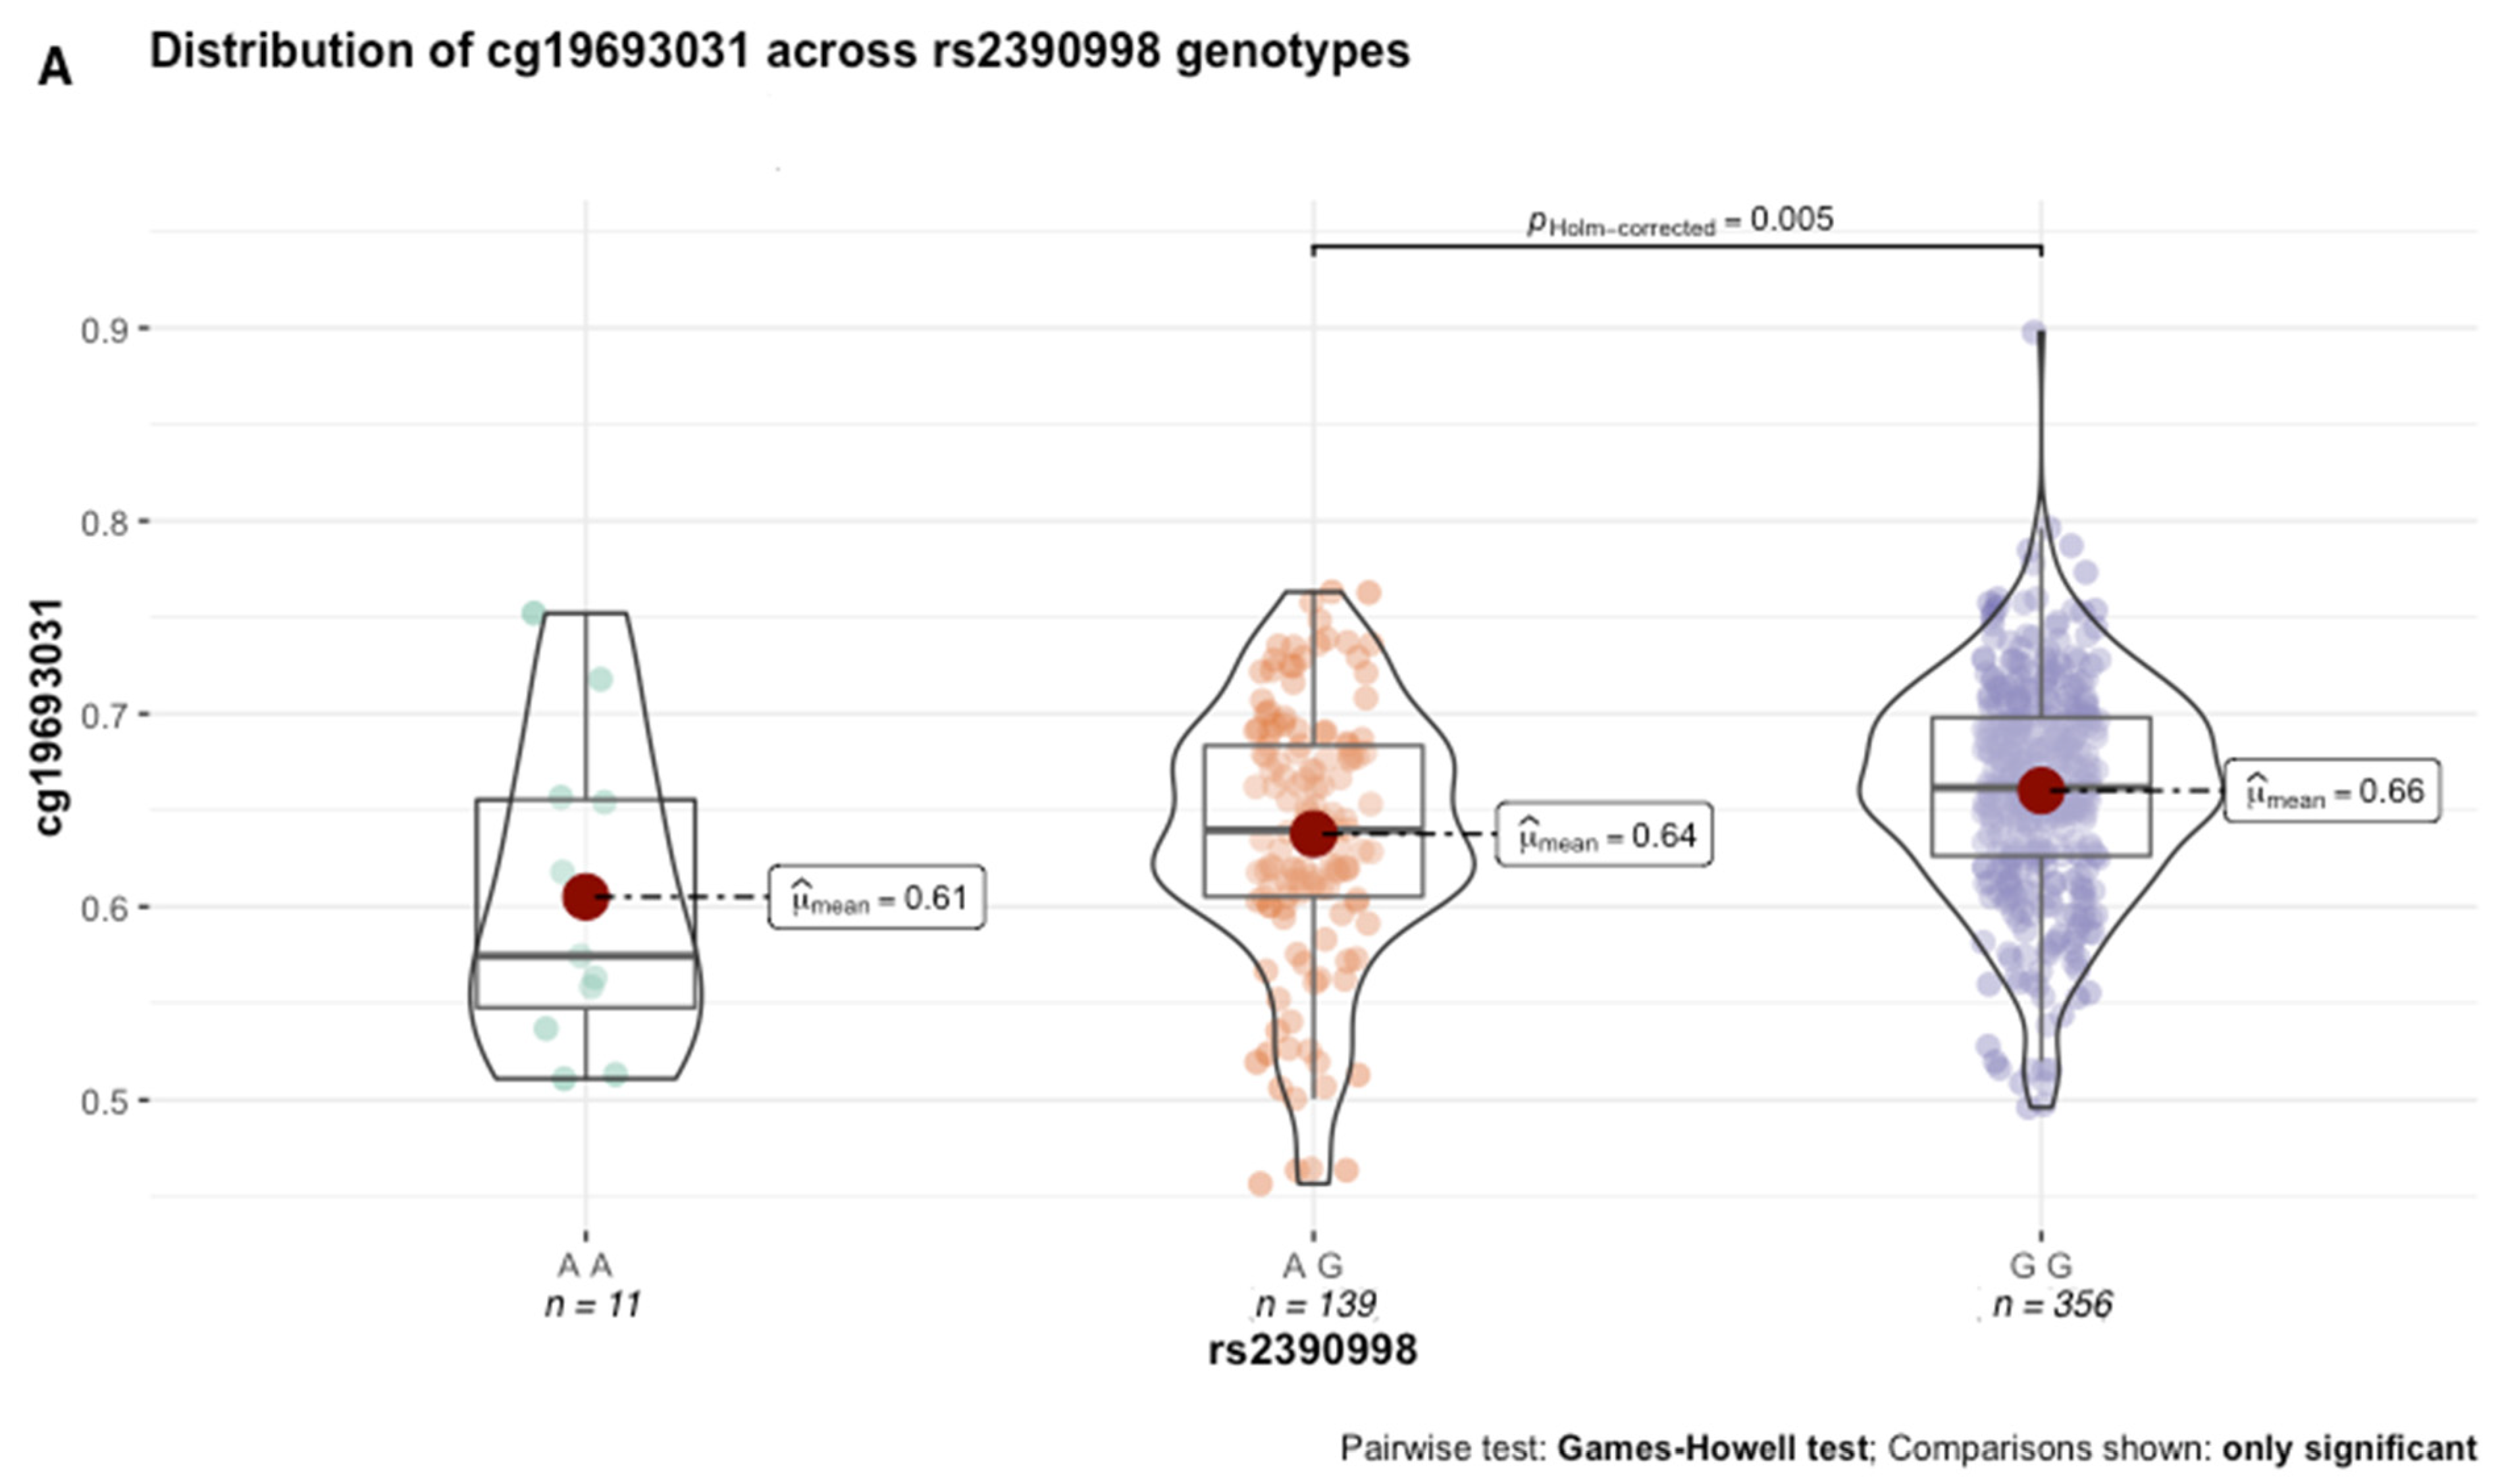
Next, we performed secondary analyses to better characterize the functional effects of genetic variation in the GxMeth loci on cg19693031 methylation. First, we conducted methylation quantitative trait loci (meQTL) analysis to determine the extent to which genetic variation in the GxMeth loci influences cg19693031 methylation. After Bonferroni correction, rs2390998 was identified as a meQTL (
p = 0.045) with a small effect size (0.04, 95% CI = [0.01, 0.08]). As illustrated in
Figure 6A, the average methylation across the 506 subjects was significantly lower in rs2390998 heterozygotes (AG) than major allele homozygotes (GG) (p
Holm-corrected = 0.005, Δ
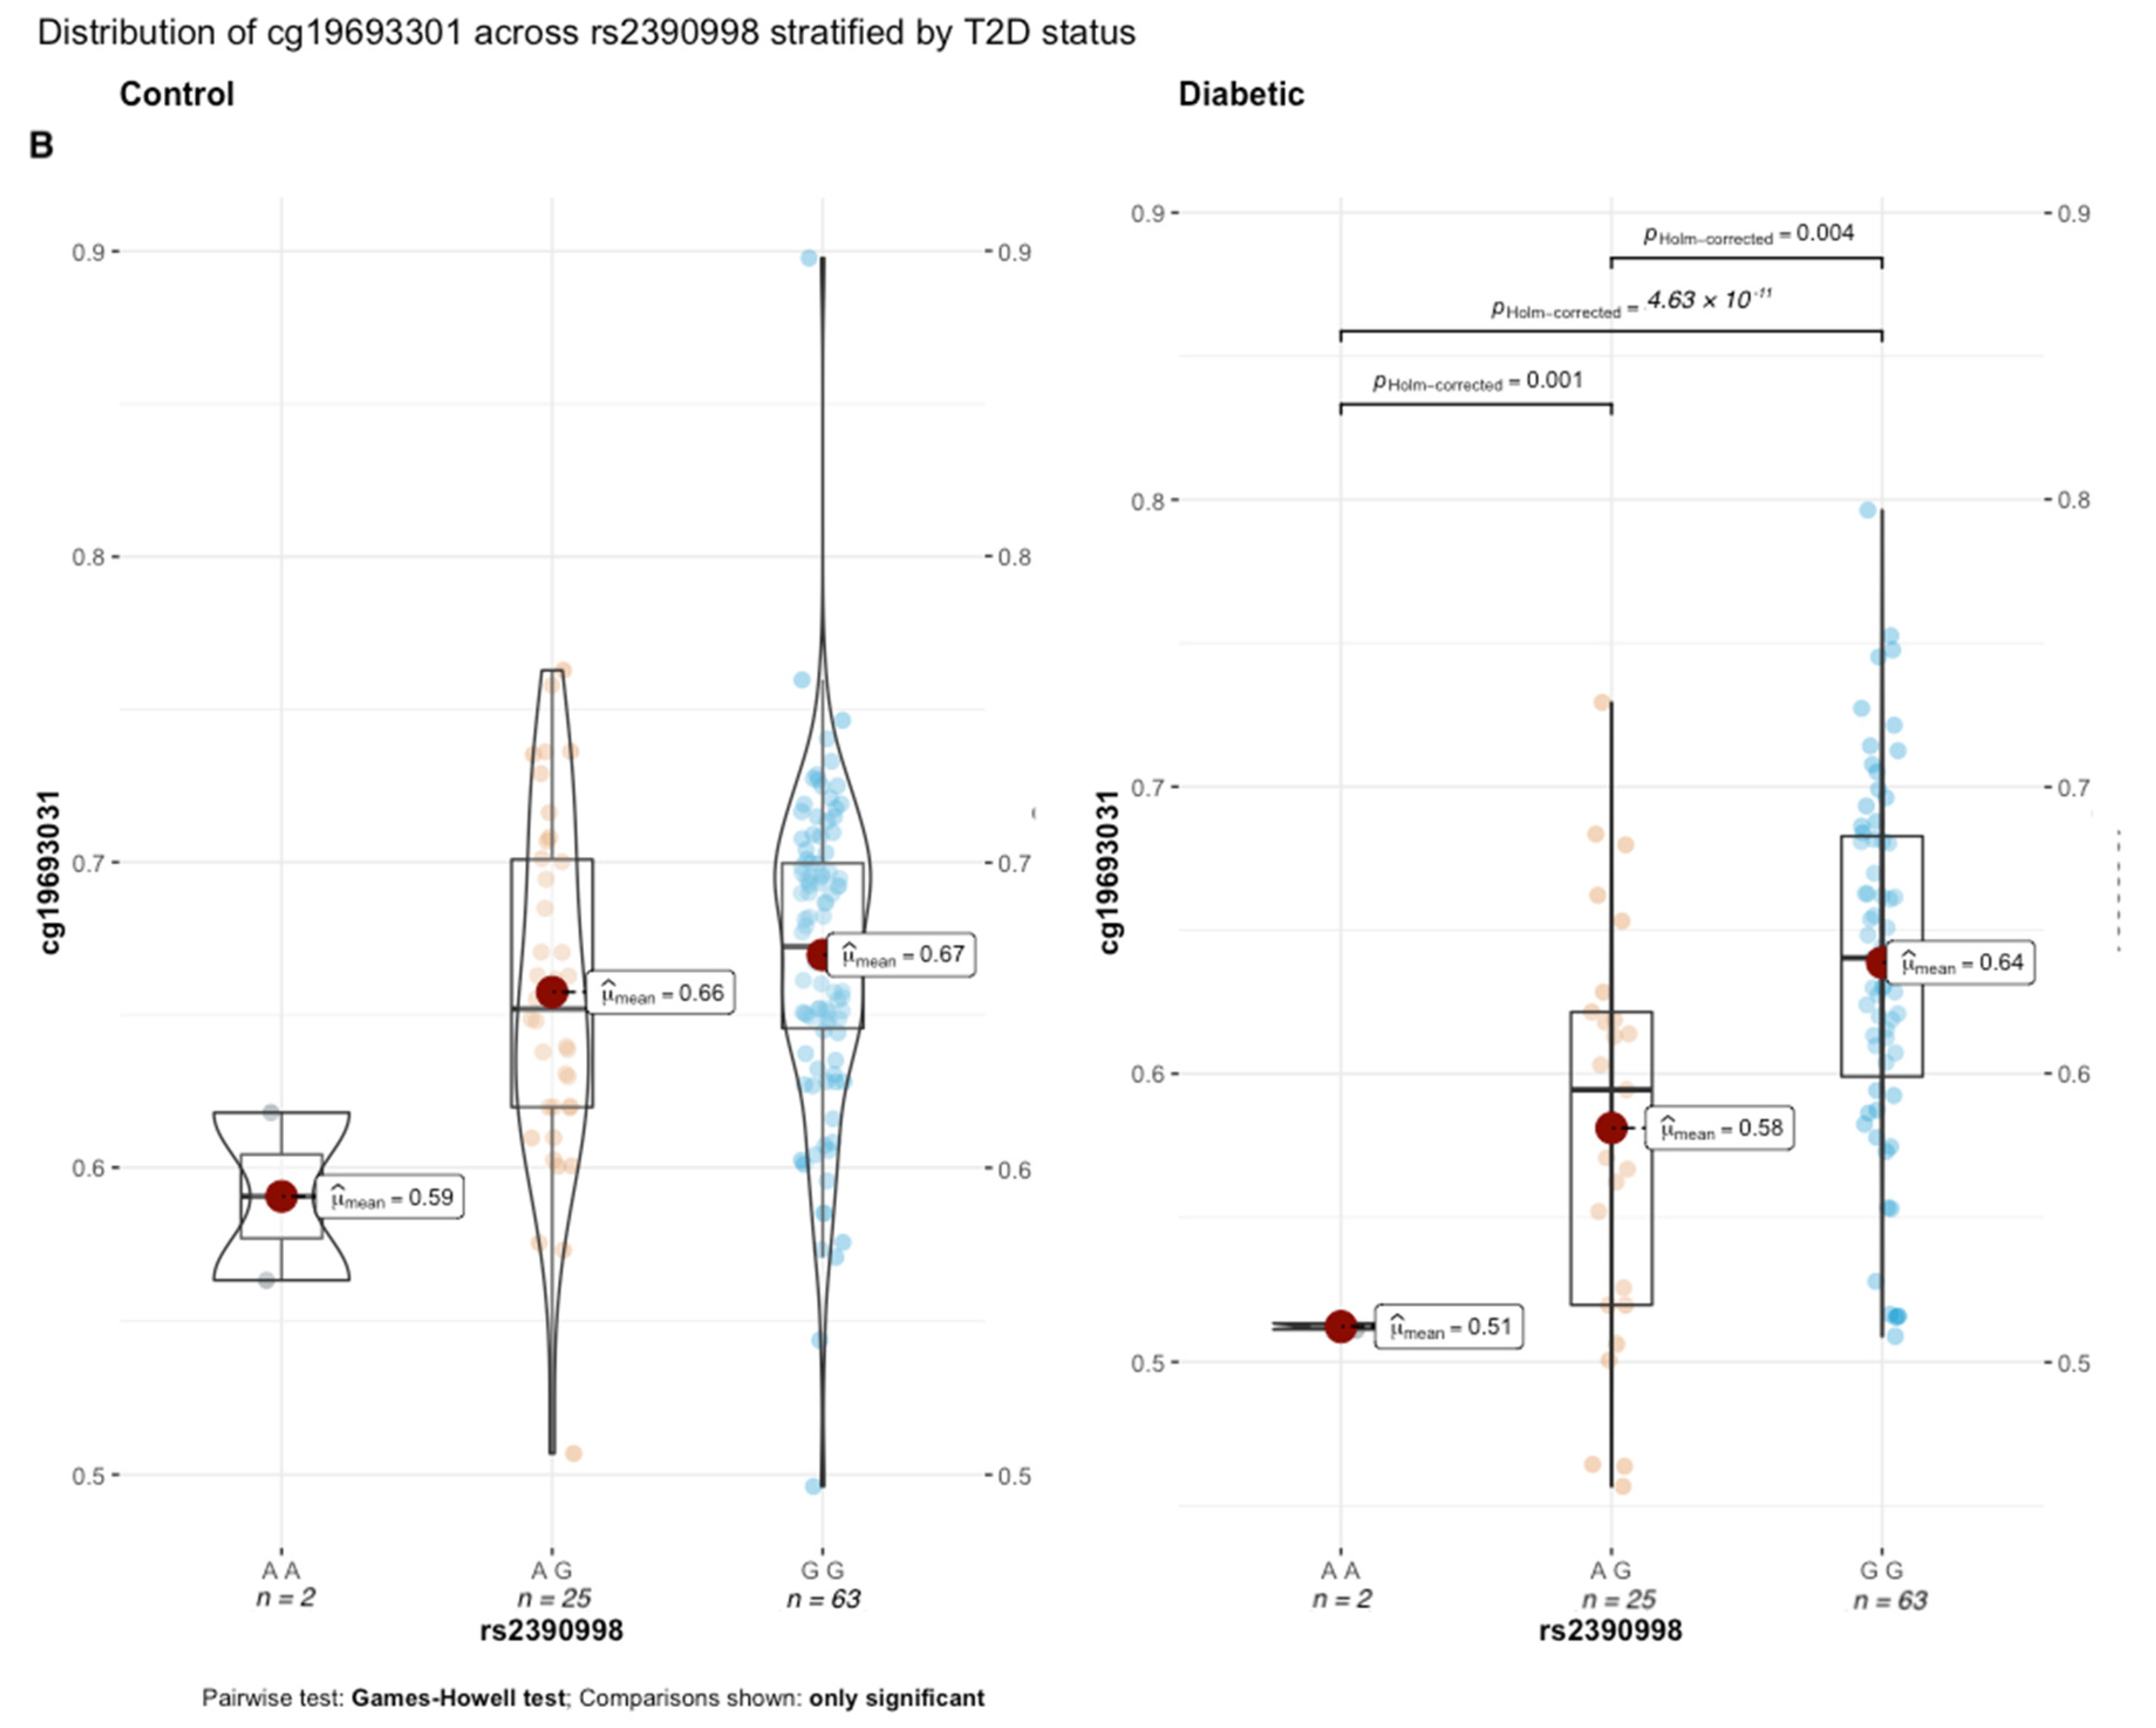
β = 2%). Notably, the genetic influence of rs2390998 on methylation was only prominent in diabetic subjects, with the most significant difference in methylation seen between the homozygote genotypes (
Figure 6B; p
Holm-corrected = 4.63 × 10
−11, Δ
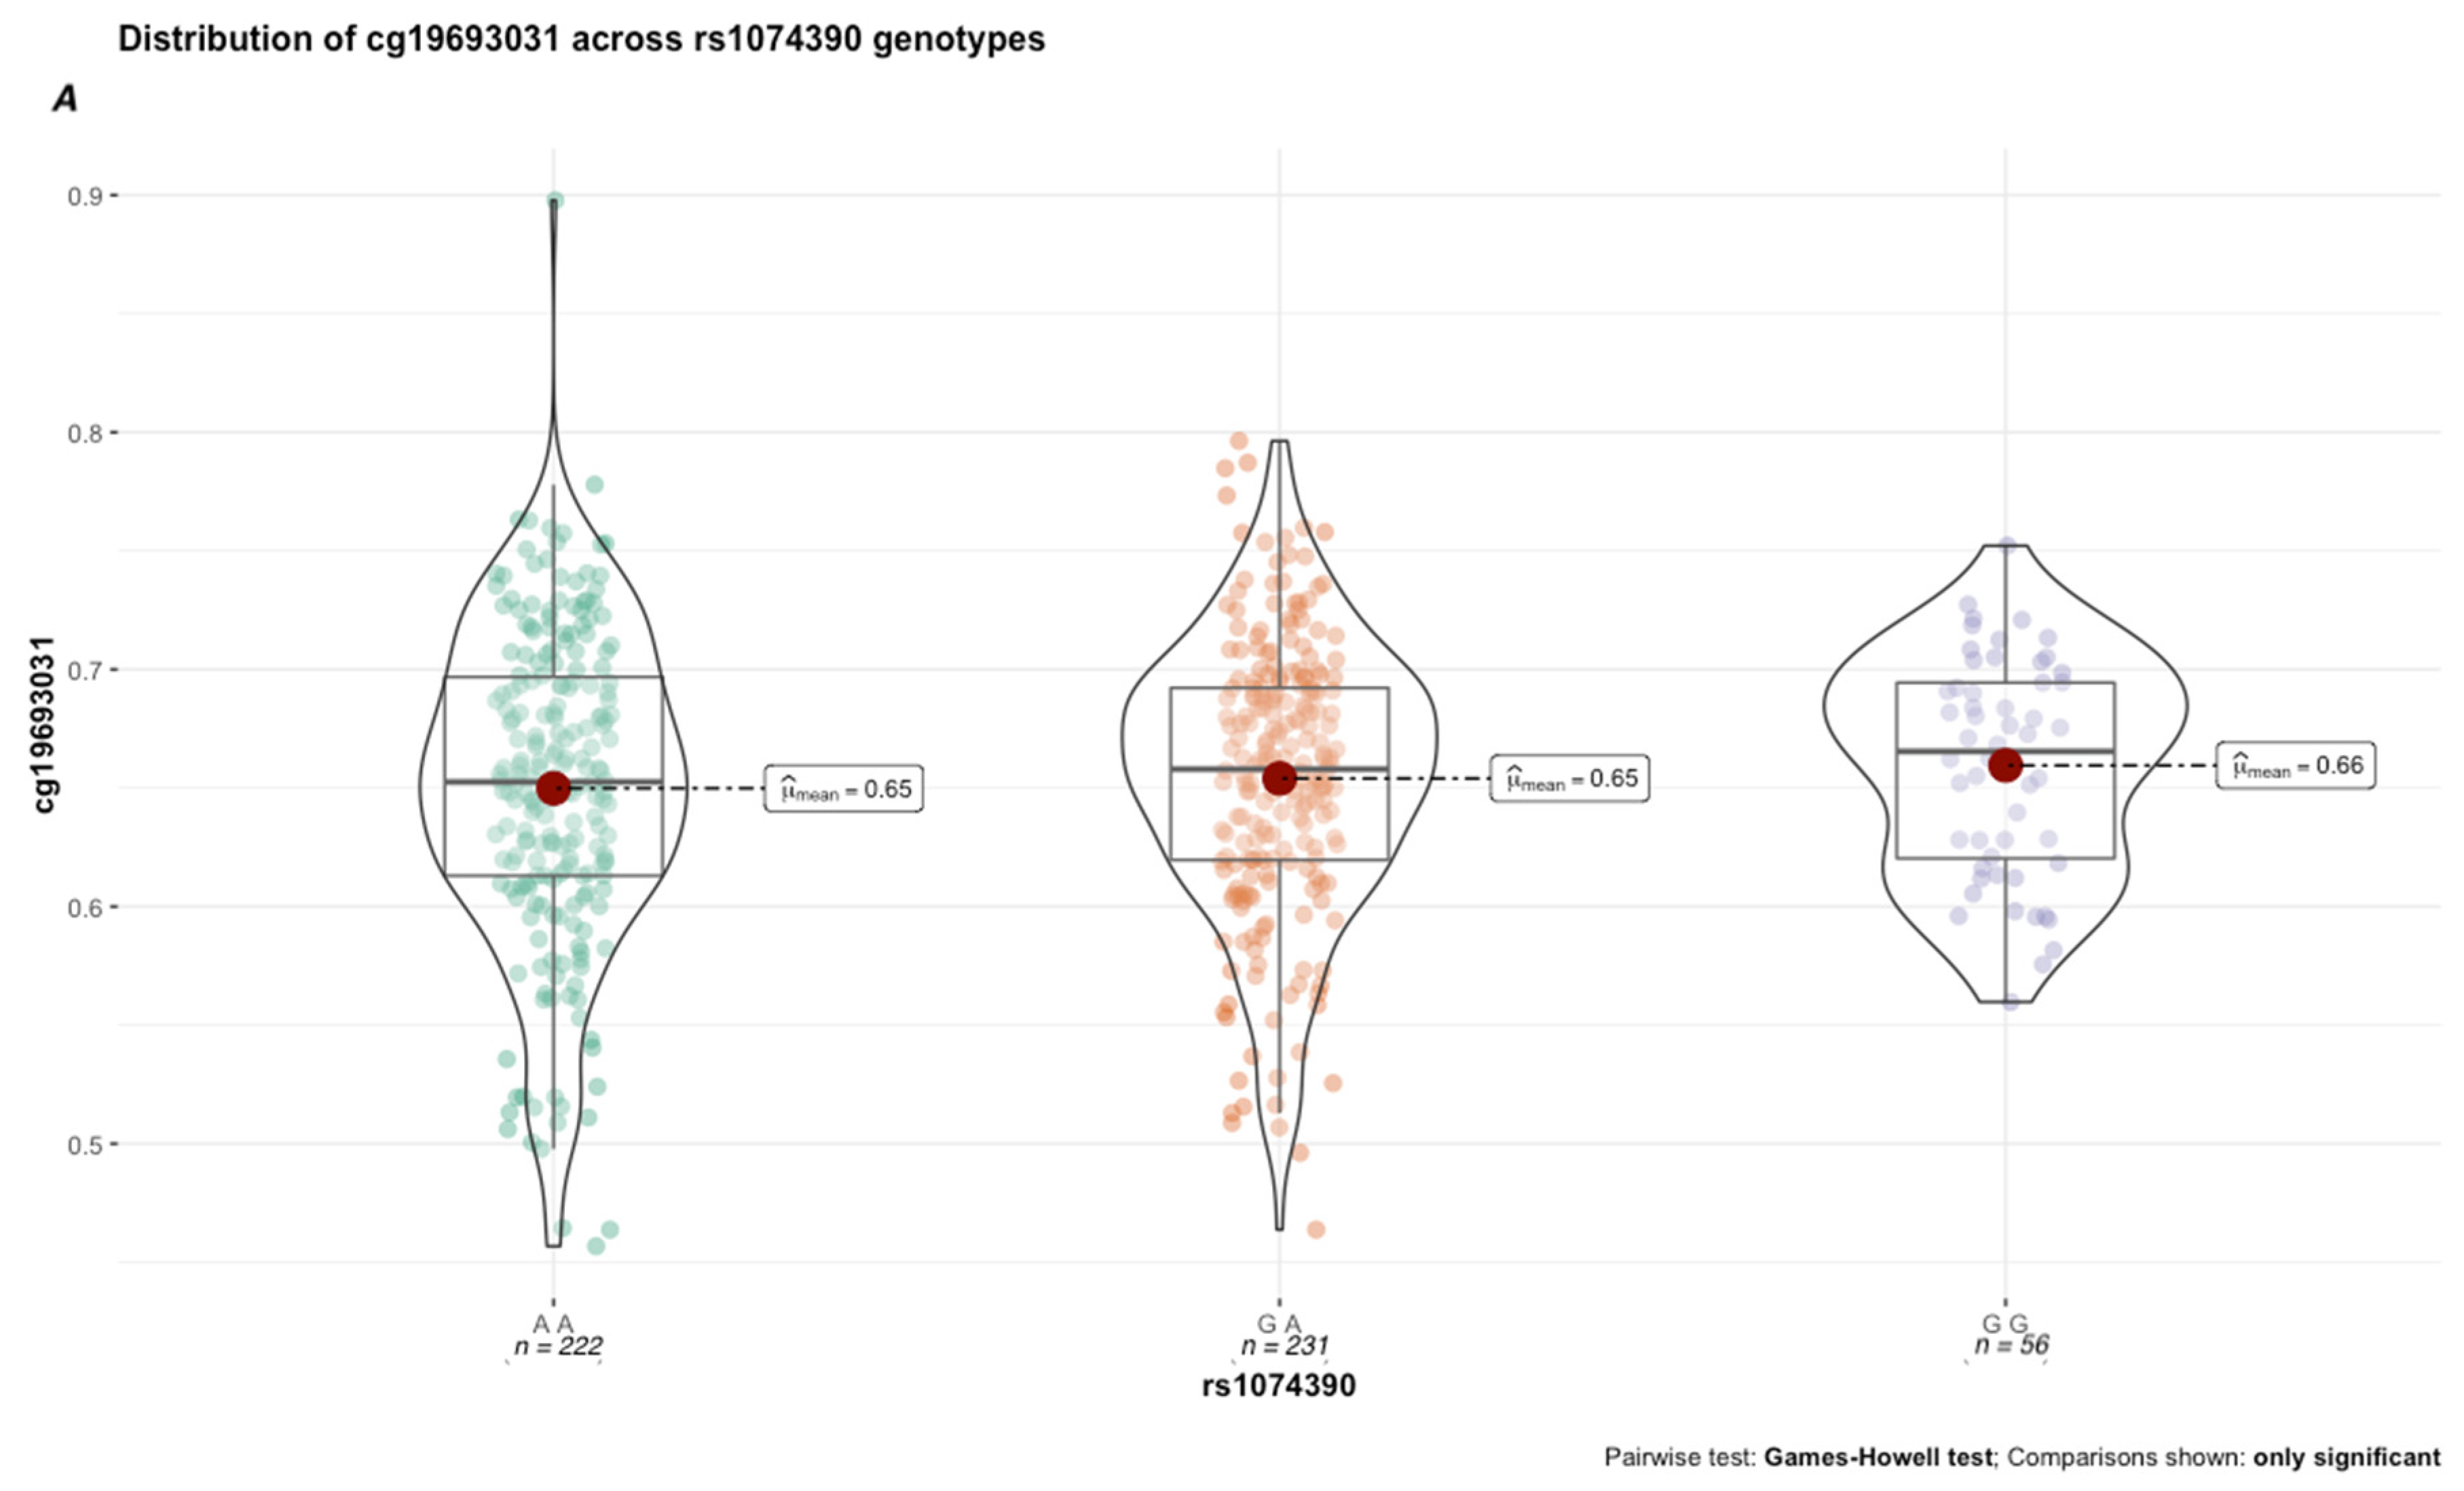
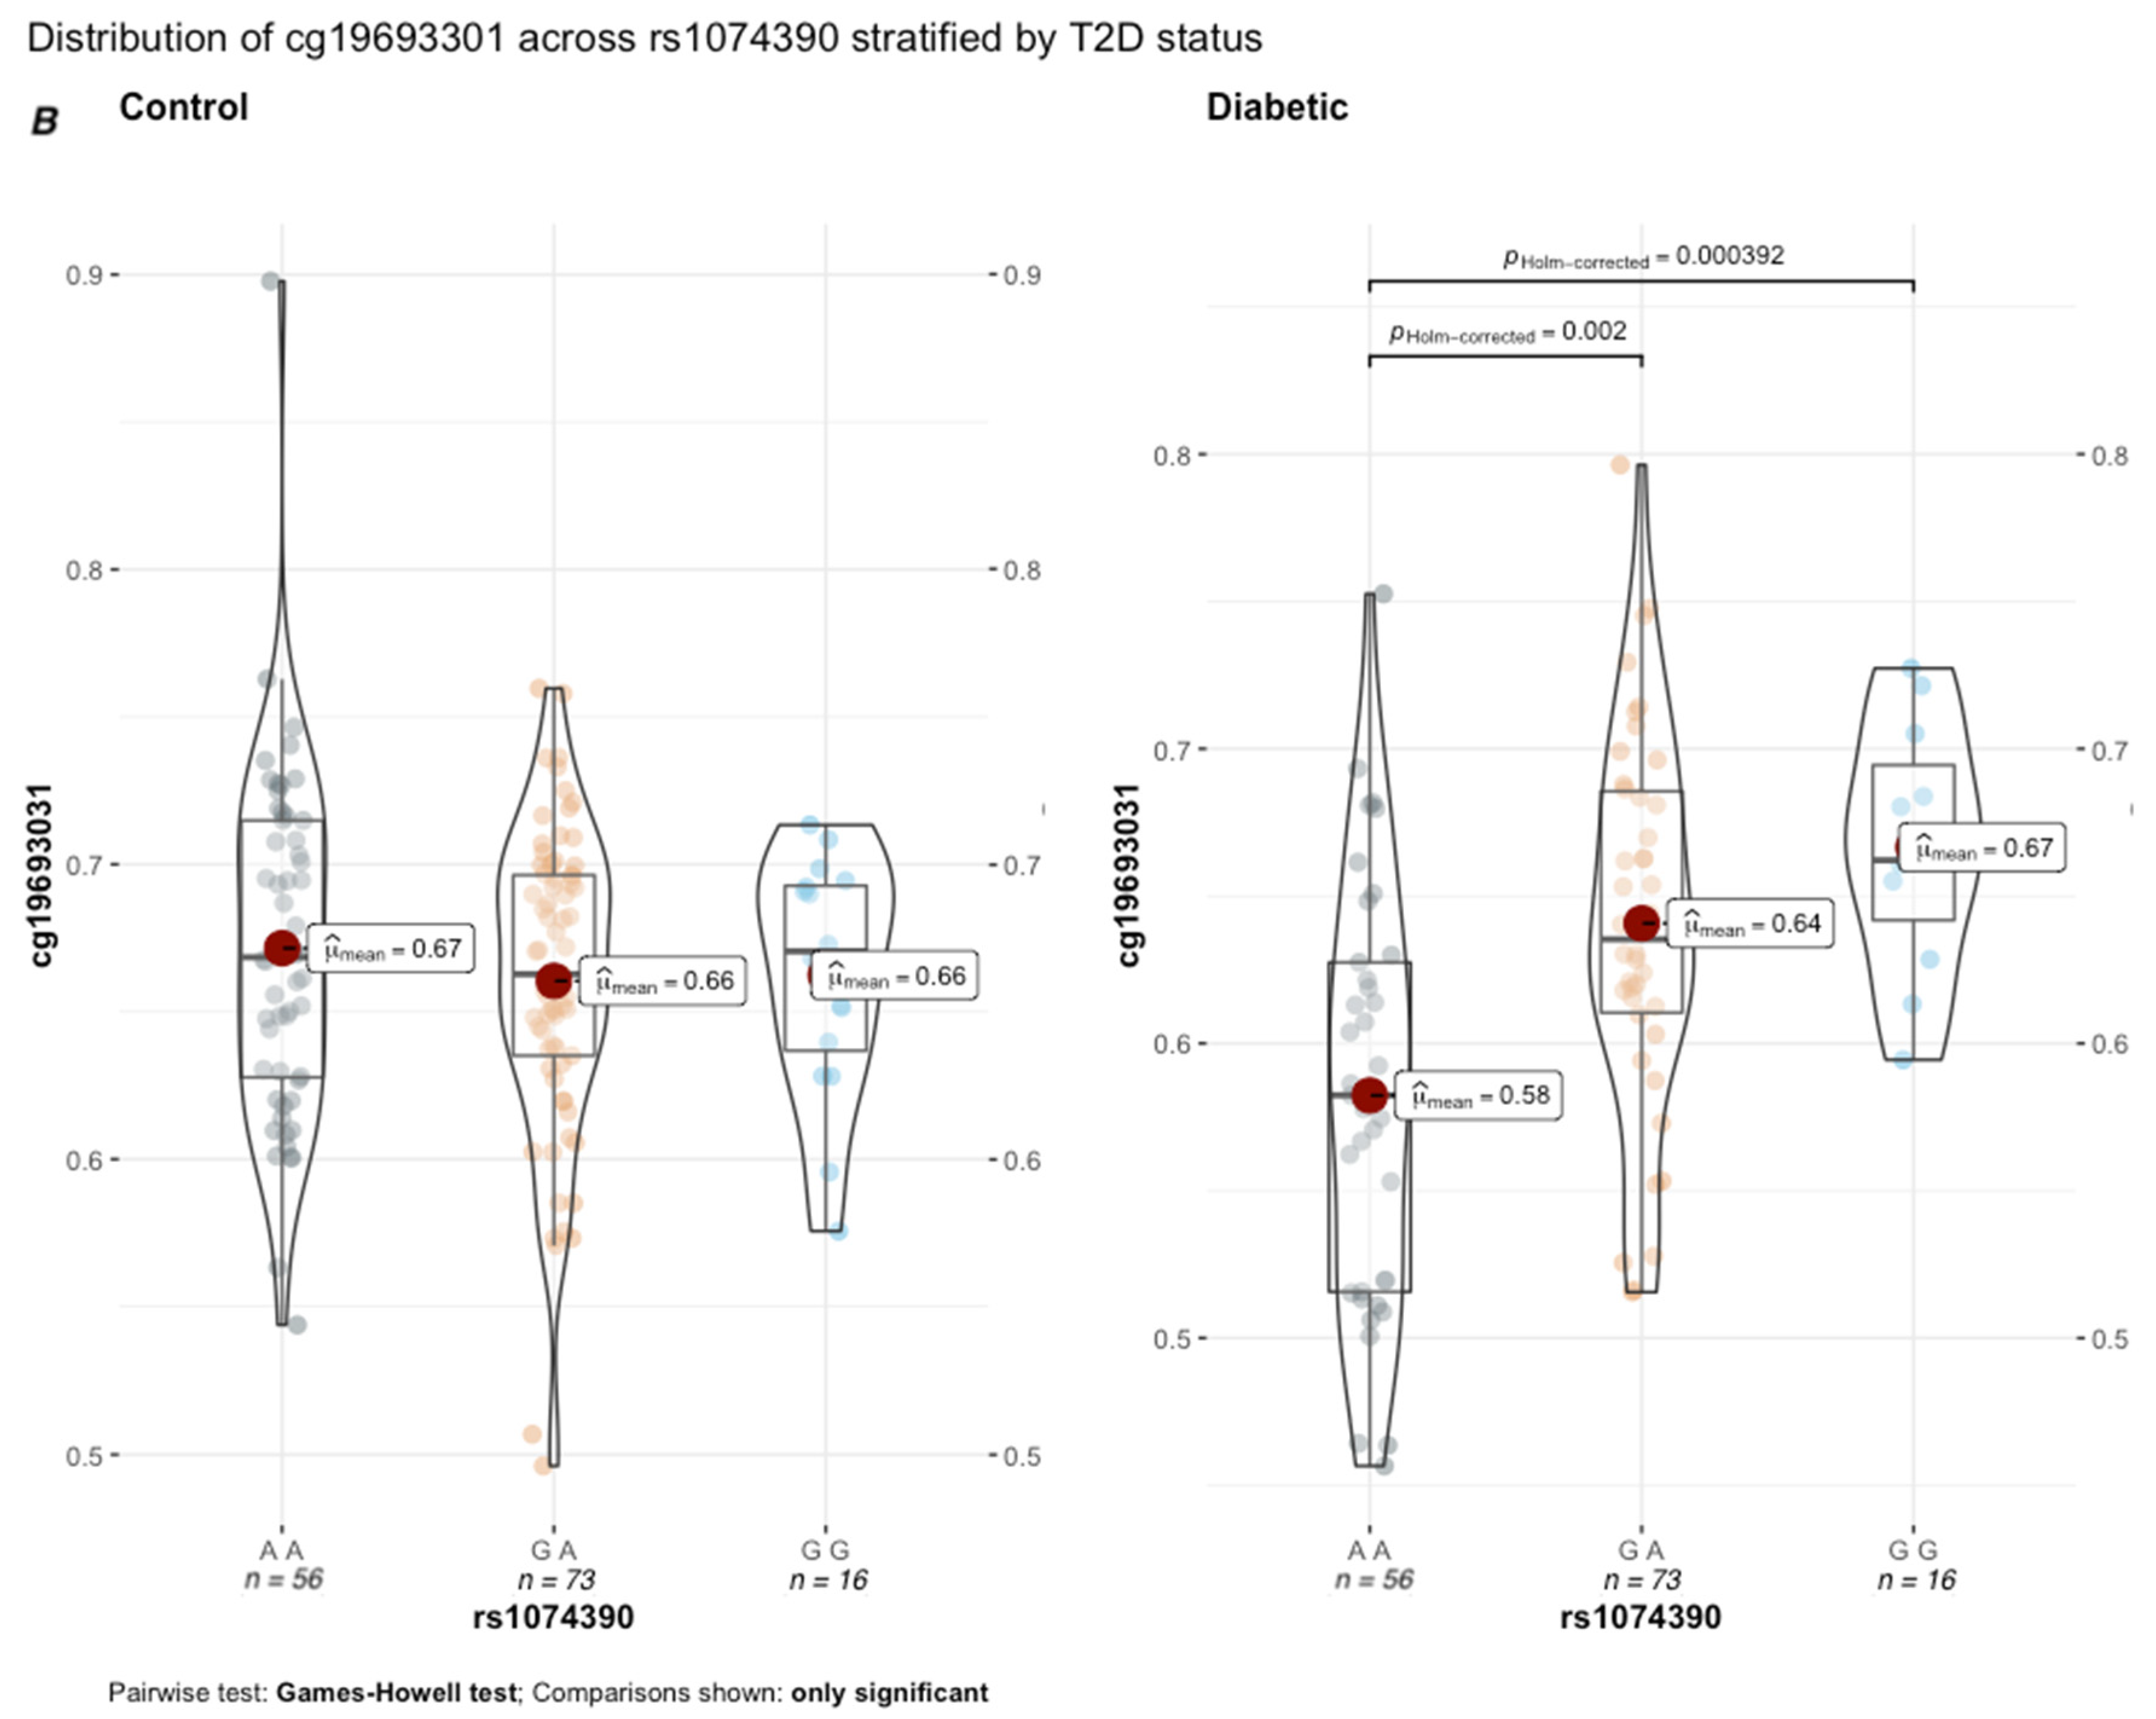
β = 13%; effect size = 0.16, 95% CI = [0.05, 0.32]). Next, we conducted a genetic x environment analysis (GxE) to determine the genetically contextual effect of HbA1c levels on cg19693031 methylation. After Bonferroni correction, rs1074390 had a significant GxE effect (
p = 0.048; effect size = 0.165, 95% CI [0.11, 0.22]. While the average cg19693031 methylation did not significantly differ as a function of rs1074390 genotype across the cohort (Δ
β = 1%), a significant difference was seen when stratified by T2D status (
Figure 7). Similar to rs2390998, differences in methylation across the rs1074390 genotype were observed only in diabetic subjects, with the most significant difference in methylation observed between the homozygote genotypes (p
Holm-corrected = 3.92 × 10
−4; Δ
β = 9%; effect size = 0.38, 95% CI [0.12, 0.56].
The significant GxMeth SNPs mapped to 560 unique genes, with enrichment of two or more SNPs found within 103 genes. Of those 560 genes, 167, 144 and 22 genes had confirmed associations to metabolic and cardiovascular disorders and type 2 diabetes, respectively [
4,
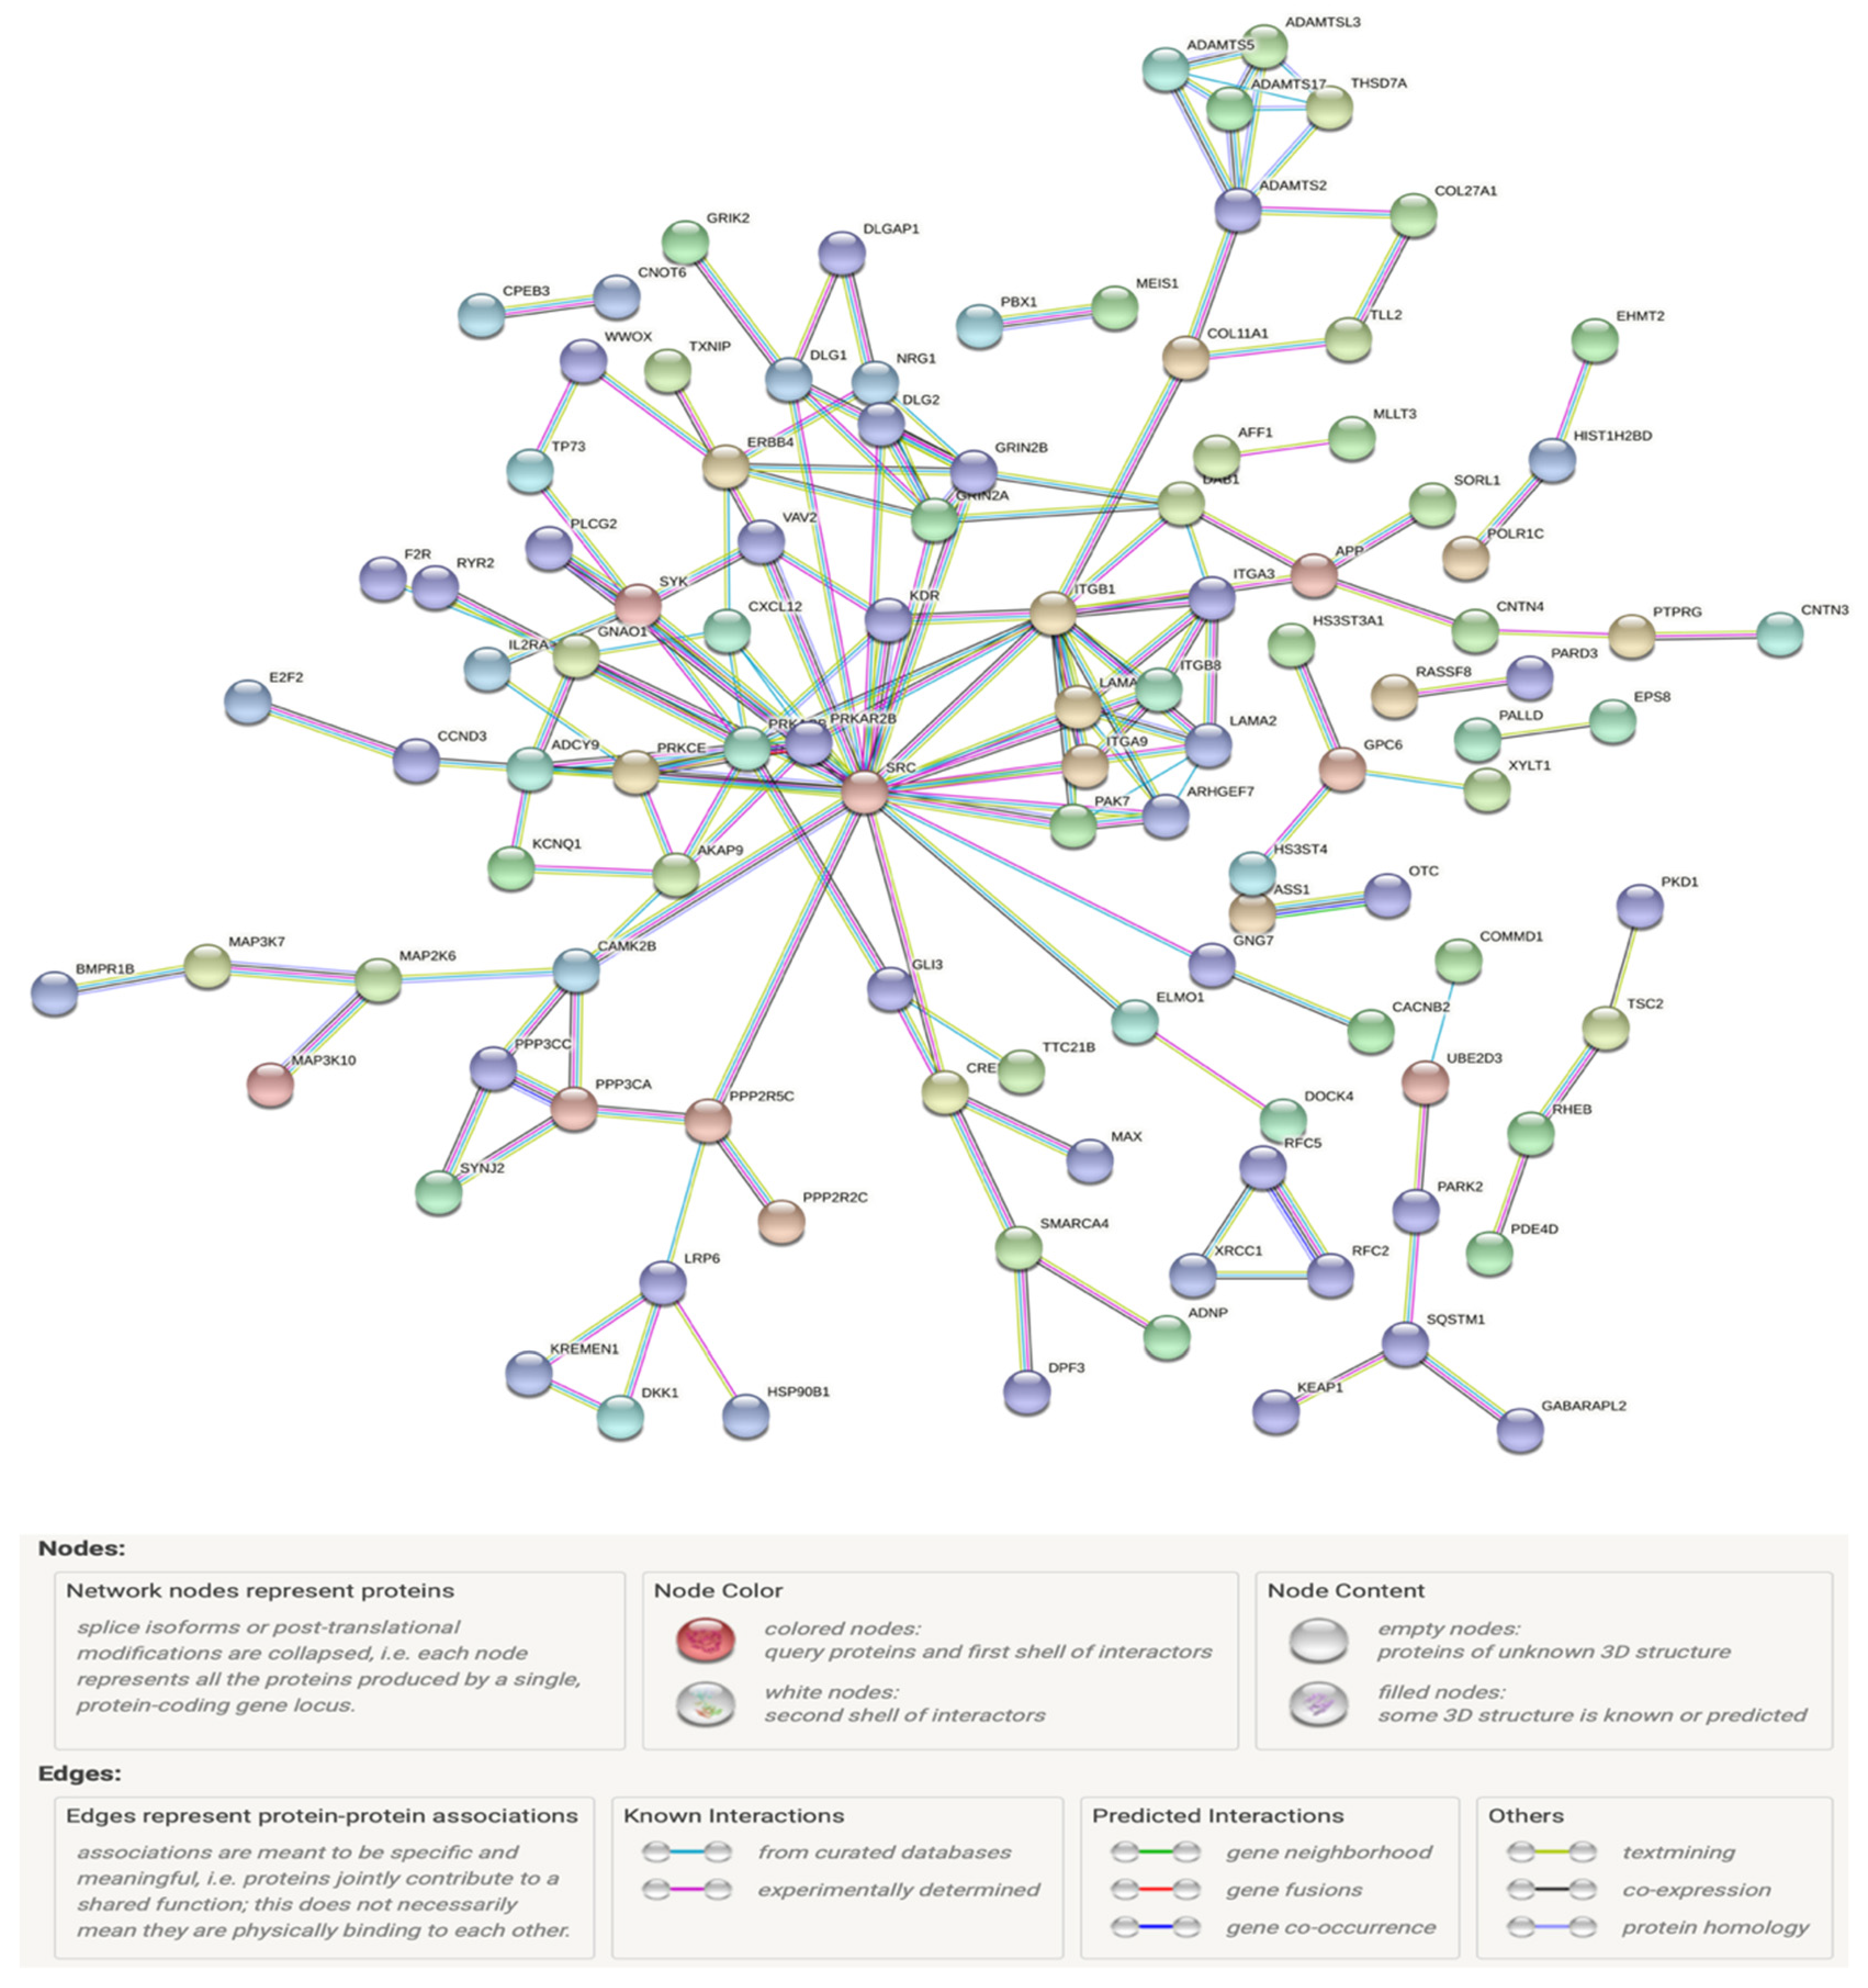
22]. To gain functional insights into these significant GxMeth interactions, a protein–protein interaction network (PPI) was generated using data from the STRING database. A total of 487 genes were correctly matched to the database.
Figure 8 illustrates this network, with nodes only shown if they have an edge with a minimum interaction score of 0.9. This network consisted of 477 nodes with 158 edges (PPI enrichment
p = 4.1 × 10
−9), with an average node degree of 0.662. This network mapped to several biological process GO pathways that are highly associated with the development and complications of T2D, including regulation of voltage-gated sodium channel activity (
p = 1.33 × 10
−2), protein kinase C-activating G protein-coupled receptor signaling pathway (
p = 1.26 × 10
−2), cell communication involved in cardiac conduction (
p = 1.41 × 10
−2), cardiac muscle cell action potential involved in contraction (
p = 3.65 × 10
−2), regulation of heart rate (
p = 6.63 × 10
−3), calcium-mediated signaling (
p = 2.30 × 10
−2) and angiogenesis (
p = 1.13 × 10
−2). This network also mapped to several KEGG pathways, including glutamatergic synapse (
p = 3.8 × 10
−3), dilated cardiomyopathy (
p = 7.5 × 10
−3), Rap1 signaling pathway (
p = 8.1 × 10
−3), PI3K-Akt signaling pathway (
p = 1.56 × 10
−2), phospholipase D signaling pathway (
p = 2.2 × 10
−2), hypertrophic cardiomyopathy (
p = 2.27 × 10
−2) and Wnt signaling pathway (
p = 2.42 × 10
−2).
3.10. Integrated Genetic–Epigenetic Classifier for Predicting T2D Status
To determine if correcting for genetic factors with significant GxMeth effects improves the predictive ability of cg19693031 for T2D status, a series of balanced random forest (BRF) classifiers were built, adjusting for age, sex and BMI (
Table 12). Using a repeated stratified k-fold cross-validation approach, each BRF classifier with random under-sampling was built to evaluate the features’ ability to discriminate between control and diabetic subjects. Similar to the logistic regression modeling, two base classifiers were built using the covariate variables solely and another incorporating cg19693031 (AUC = 0.68 and AUC = 0.71, respectively). Next, the 1476 GxMeth genetic factors were incorporated into the model, with a decrease in performance observed in comparison to the base models (AUC = 0.67). This decrease in performance is reflective of the random forest’s known vulnerability to overfitting due to correlated features with little discriminatory value.
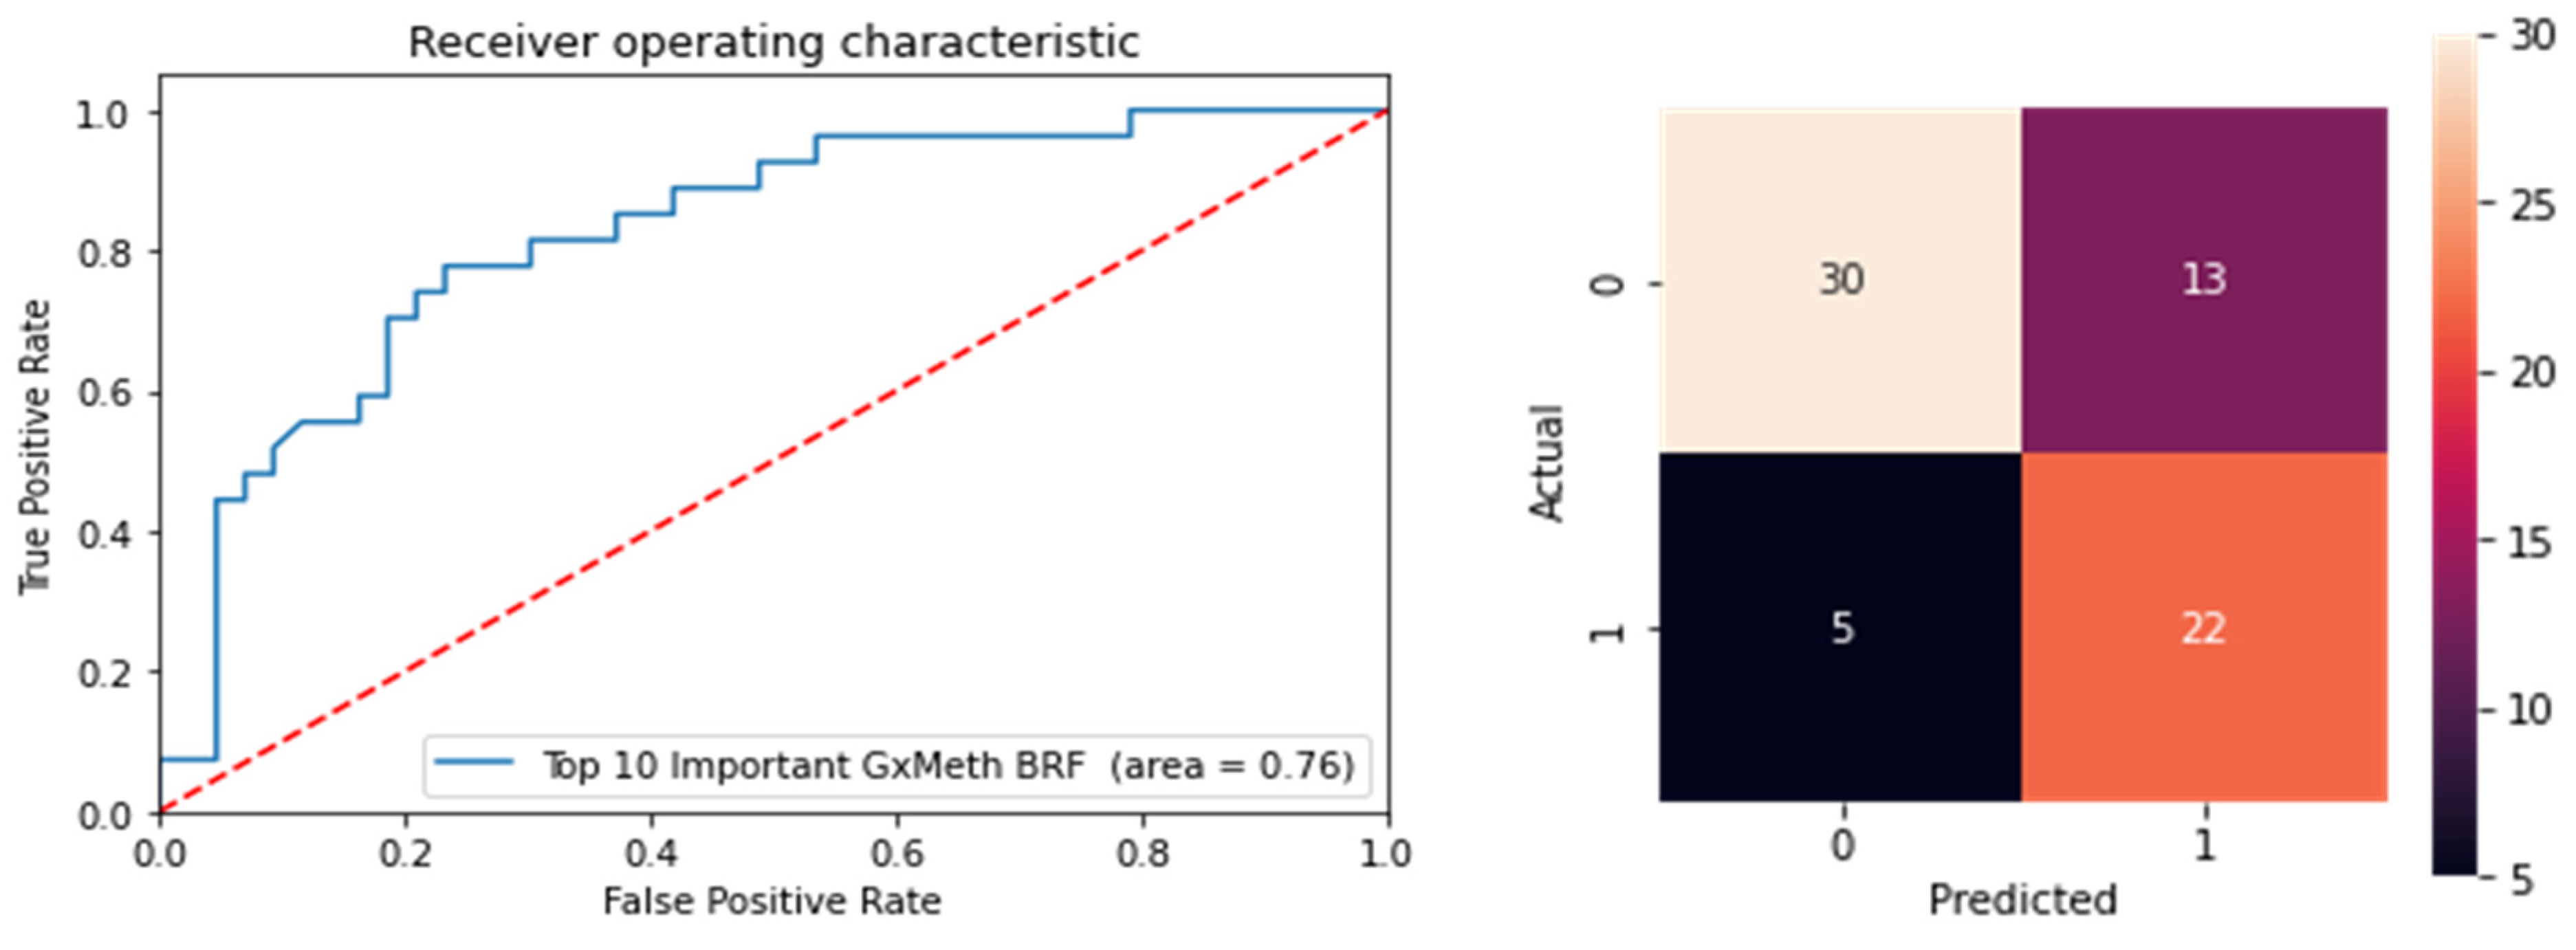
To resolve this, we performed multivariate ensemble feature selection using random forest with a subsequent BRF classifier to reduce the dimensionality of the dataset. Multivariate approaches consider conditional higher-order interactions between several or all features simultaneously when measuring each feature’s relevance to the overall classification task. A total of 554 features were selected by the random forest learner, including the covariates, cg19693031 and 550 non-local GxMeth SNPs. Using a repeated stratified k-fold cross-validation approach with random under-samplings of the minority class to counteract class imbalance, a BRF model was built to evaluate the selected features for predicting control versus diabetic subjects. The performance of the model improved, with an AUC of 0.74. To further reduce the dimensionality of the dataset, we used the Gini importance to select the top-ranked relevant features. The selected features were ranked according to their Gini Importance, and the top 13 features were retained (
Table 13). Using these features, a final BRF classifier was built. The classifier performed better than the previous models, with an AUC of 0.76 (81% sensitivity, 70% specificity). The confusion matrix and ROC curve are illustrated in
Figure 9.
4. Discussion
Using data from a group of African American adults, we confirm and extend the prior findings, showing that the methylation of cg19693031 has a significant dose-dependent relationship with HbA1c. We identify confounding genetic variations influencing the methylation status of cg19693031 both independent of and in combination with HbA1c. The pathway analyses identified the regulatory mechanisms related to the 3D genomic structure and TXNIP’s role in disease susceptibility. Finally, we demonstrate that correcting for genetic confounding improves the ability of cg19693031 to detect type 2 diabetes. Collectively, our analyses suggest that the demethylation response of cg19693031 to sustained hyperglycemia in white blood cells may play a pivotal role in the regulatory network effects that underlie several clinical phenotypes, with insights into TXNIP’s pleiotropic functions for disease onset and progression.
To the best of our knowledge, our study is the first full integration of genetic and hyperglycemia effects on cg19693031 methylation, laying the groundwork for a more comprehensive understanding of the molecular mechanisms linking the methylation status of TXNIP’s 3′UTR to disease. Collectively, we identify 11,240 genes that participated in significant interactions. The enrichment and functional genomic analyses suggest the crosstalk between genetic variants and the demethylation response of cg19693031 may contribute to the dysregulation of gene expression seen in diabetes. For example, TXNIP has been shown to be induced by glucose and overexpressed in diabetic patients [
23]. In addition, the TXNIP locus is complexly regulated by multilayered mechanisms, including transcriptional regulation, microRNA, mRNA stabilization and protein degradation [
24]. Our analyses identified several of these regulators, including transcription factors (FOX01, HSF2, RXRA and KLF6) and modulators of mRNA stability (mir-17, ZFP36, NEDD1, NEDD4, NEDD9 and WWP1). In addition, several factors known to influence genome and epigenome plasticity were identified, including methylome regulators, histone modifiers and subunits of the cohesion complex. While our analyses suggest that the interplay between cg1963031 methylation and genetic variation may influence the transcriptional program of leukocytes in the context of hyperglycemia, external validation with expression data is needed.
Prior studies have suggested the utility of TXNIP as a biomarker for diabetes due to its hyperglycemia-induced overexpression and the strong association of cg19693031 with HbA1c [
7]. While the demethylation of cg19693031 correlates to an increase in TXNIP transcription [
5], this upregulation cannot be adequately explained by the demethylation of a 3′UTR CpG site as others have suggested. Whereas methylation within the CpG islands and shores near promoter regions correlates to transcriptional repression [
25], the literature to support the same conclusion within gene bodies is lacking. Indeed, the recent work by Albao and colleagues suggests that the demethylation of cg19693031 promotes spurious transcription of the 3′UTR [
26]. Prior studies have demonstrated the regulation of TXNIP via miRNA directed degradation of the mRNA, notably miR-17 [
27]. Therefore, the spurious transcription of the 3′UTR intragenic region could potentially sequester the miRNA degradation by acting as a competitive endogenous RNA, resulting in an increase in TXNIP mRNA stability. Our findings further support the hypothesis that the demethylation response of cg19693031 may increase the mRNA stability of TXNIP. Further research is needed to validate and extend upon the role of the methylome in the regulation of TXNIP.
Our findings will be particularly useful for those seeking to better understand the pathophysiological function of TXNIP in order to optimize diabetes medicine. For example, several cg19693031 interacting genes were enriched in both type 1 (
n = 27) and type 2 diabetes (
n = 26). In addition, biological pathways related to diabetes were identified, including: insulin section, downstream signaling of insulin and glucagon and sensory perception of chemical stimulus. TXNIP emerged as a viable therapeutic target for diabetes due to its role in pancreatic β-cell apoptosis via activation of the mitochondrial death pathway [
28]. The activation of the NLRP3 inflammasome results in the release of proinflammatory cytokines and apoptosis [
29]. Critical to this report, TXNIP-induced inflammasome activation and IL-1β production are primarily observed in resident innate immune cells and not the islet β cells themselves [
30,
31,
32]. Pathway analyses identified several mechanisms related to β-cell destruction, such as T-cell signaling and cytotoxic effects and ROS-induced apoptosis. Remarkably, strong interactions were observed with five major islet autoantigens (INS, GAD, IA-2, CPE and ICA). A total of 88 and 66 confounding genetic variants mapped to the NOD-like receptor signaling pathway and apoptosis. In particular, cg19693031 interacted with key loci for inflammasome activation (TRX, regulators of NLRP3 expression and NLRP3 itself), proinflammatory effects (IL-1β, IL-18, IL-6 and TNFα), death receptors (TRAIL-R, Fas and FADD) and other pro-apoptotic genes (BCL-2, BAD, JNK, BAK, ATM and PUMA). Further, TXNIP has been implicated in the development of diabetes-induced complications, including coronary heart disease. In this report, we identified loci mapping to lipids and atherosclerosis (
n = 102), diabetic cardiomyopathy (
n = 73), insulin resistance (
n = 66) and AGE-RAGE diabetic complications (
n = 59). This suggests that the pathophysiological role of the demethylation response of cg19693031 may generalize across the diabetes subtypes. As the diagnosis of diabetes mellitus is based on clinical presentation rather than specific molecular defects, overlaps in their etiologies have been documented. Indeed, prior studies have demonstrated the association of cg19693031 methylation and T1D. Further, current clinical trials are investigating the use of Verapamil for treatment of T1D, which has been shown to decrease the expression of TXNIP.
Altered TXNIP activity has been implicated in the development of several diseases aside from diabetes, including atherosclerosis, cancer and neurodegenerative diseases [
33,
34,
35,
36]. Our functional analyses identified enrichment in several of these diseases, including pathways in cancer (
n = 274), pathways in neurodegeneration (
n = 205), Alzheimer’s disease (
n = 155), microRNAs in cancer (
n = 106), transcriptional misregulation in cancer (
n = 100) and the Hippo signaling pathway (
n = 84). Moreover, prior studies have demonstrated an association between cg19693031 methylation and chylomicrons (Class A), triglycerides, hexose, α-hydrobutyrate, systolic hypertension, waist circumference, gender, metabolic syndrome, type 1 diabetes, coronary heart disease, breast cancer and colon cancer [
7,
37,
38,
39,
40]. Taken together, this suggests that the demethylation response of cg19693031 in white blood cells is not specific to diabetes, let alone T2D. Therefore, the clinical use of cg19693031 methylation status in its current form as a biomarker for T2D diabetes may lead to inappropriate clinical decisions and poor patient outcomes. Extensive follow-up studies will be required to demonstrate the ability of cg19693031 methylation to accurately stratify diabetes risk in spite of the non-specific demethylation response.
We also note that, among those with HbA1c confirmed diabetes, only 57% had come to clinical attention, and less than 1% were on diabetic medications. This observation is reflective of the long asymptomatic phase of the disease, and health disparities seen in African American communities, resulting in a high rate of undiagnosed T2D. Additionally, control and pre-diabetic subjects reported a DM diagnosis, 3% and 9%, respectively, but they did not report the use of anti-diabetic pharmacological therapy. This discordance may be reflective of subjects reporting a pre-diabetic diagnosis, or lowered glucose levels due to lifestyle changes or bariatric surgery.
The findings of this study should be considered in the context of its limitations. First, it is important to note that the FACHS cohort is almost exclusively mature adult African American women. Further examinations using a larger number of subjects of other ethnicities, age groups and equal proportions of biological sexes will be required to demonstrate generalizability. Second, although the HbA1c test is the clinical gold standard, it is not sensitive to all pre-diabetes phenotypes [
41]. Therefore, replicating our findings with other glycemic indices is needed. Third, the SNPs identified with having significant interactions with cg19693031 DNAm may not be the polymorphism driving the interaction; instead, it may be a tag SNP in full or partial equilibrium with another SNP that is driving the interaction. Additionally, there are known limitations to the Illumina EPIC arrays, such as cross-reactive and polymorphic probes, and β-value skewing due to the normalization process [
42,
43]. Hence, a more precise method for measuring cg19693031 DNAm, such as digital PCR, should be used to validate and extend our findings. Finally, cg19693931 methylation is confounded by multiple disease processes and cellular contexts. Therefore, while cg19693031 methylation may be sensitive to sustained hyperglycemia, it is not specific to diabetes.
In summary, we confirm and extend the prior findings of the demethylation response of cg19693031 to increasing HbA1c values in an African American cohort. This study is the first to extensively examine the genetic and hyperglycemia contextual effects on cg19693031 methylation, laying the groundwork for a better understanding of TXNIP’s pleiotropic pathophysiological effects in the development of disease. Future studies examining the extent of non-diabetes cellular-context-confounding cg19693031 methylation are needed to assess the feasibility for translation and potential clinical utility.


 ,
, 


