
miRNome Profiling Detects miR-101-3p and miR-142-5p as Putative Blood Biomarkers of Frailty Syndrome

 , , ,
, , ,  , , , and
Abstract
:1. Introduction
2. Materials and Methods
2.1. Patients’ Recruitment and Clinical Assessment
2.2. Biochemical Analyses
2.3. miRNome Sequencing and Analysis
2.4. Validation of smRNA-Seq Expression Data by Quantitative PCR and Statistical Analyses
2.5. Bioinformatic Targets Prediction
3. Results
3.1. Patient Evaluation and Biochemical Analyses
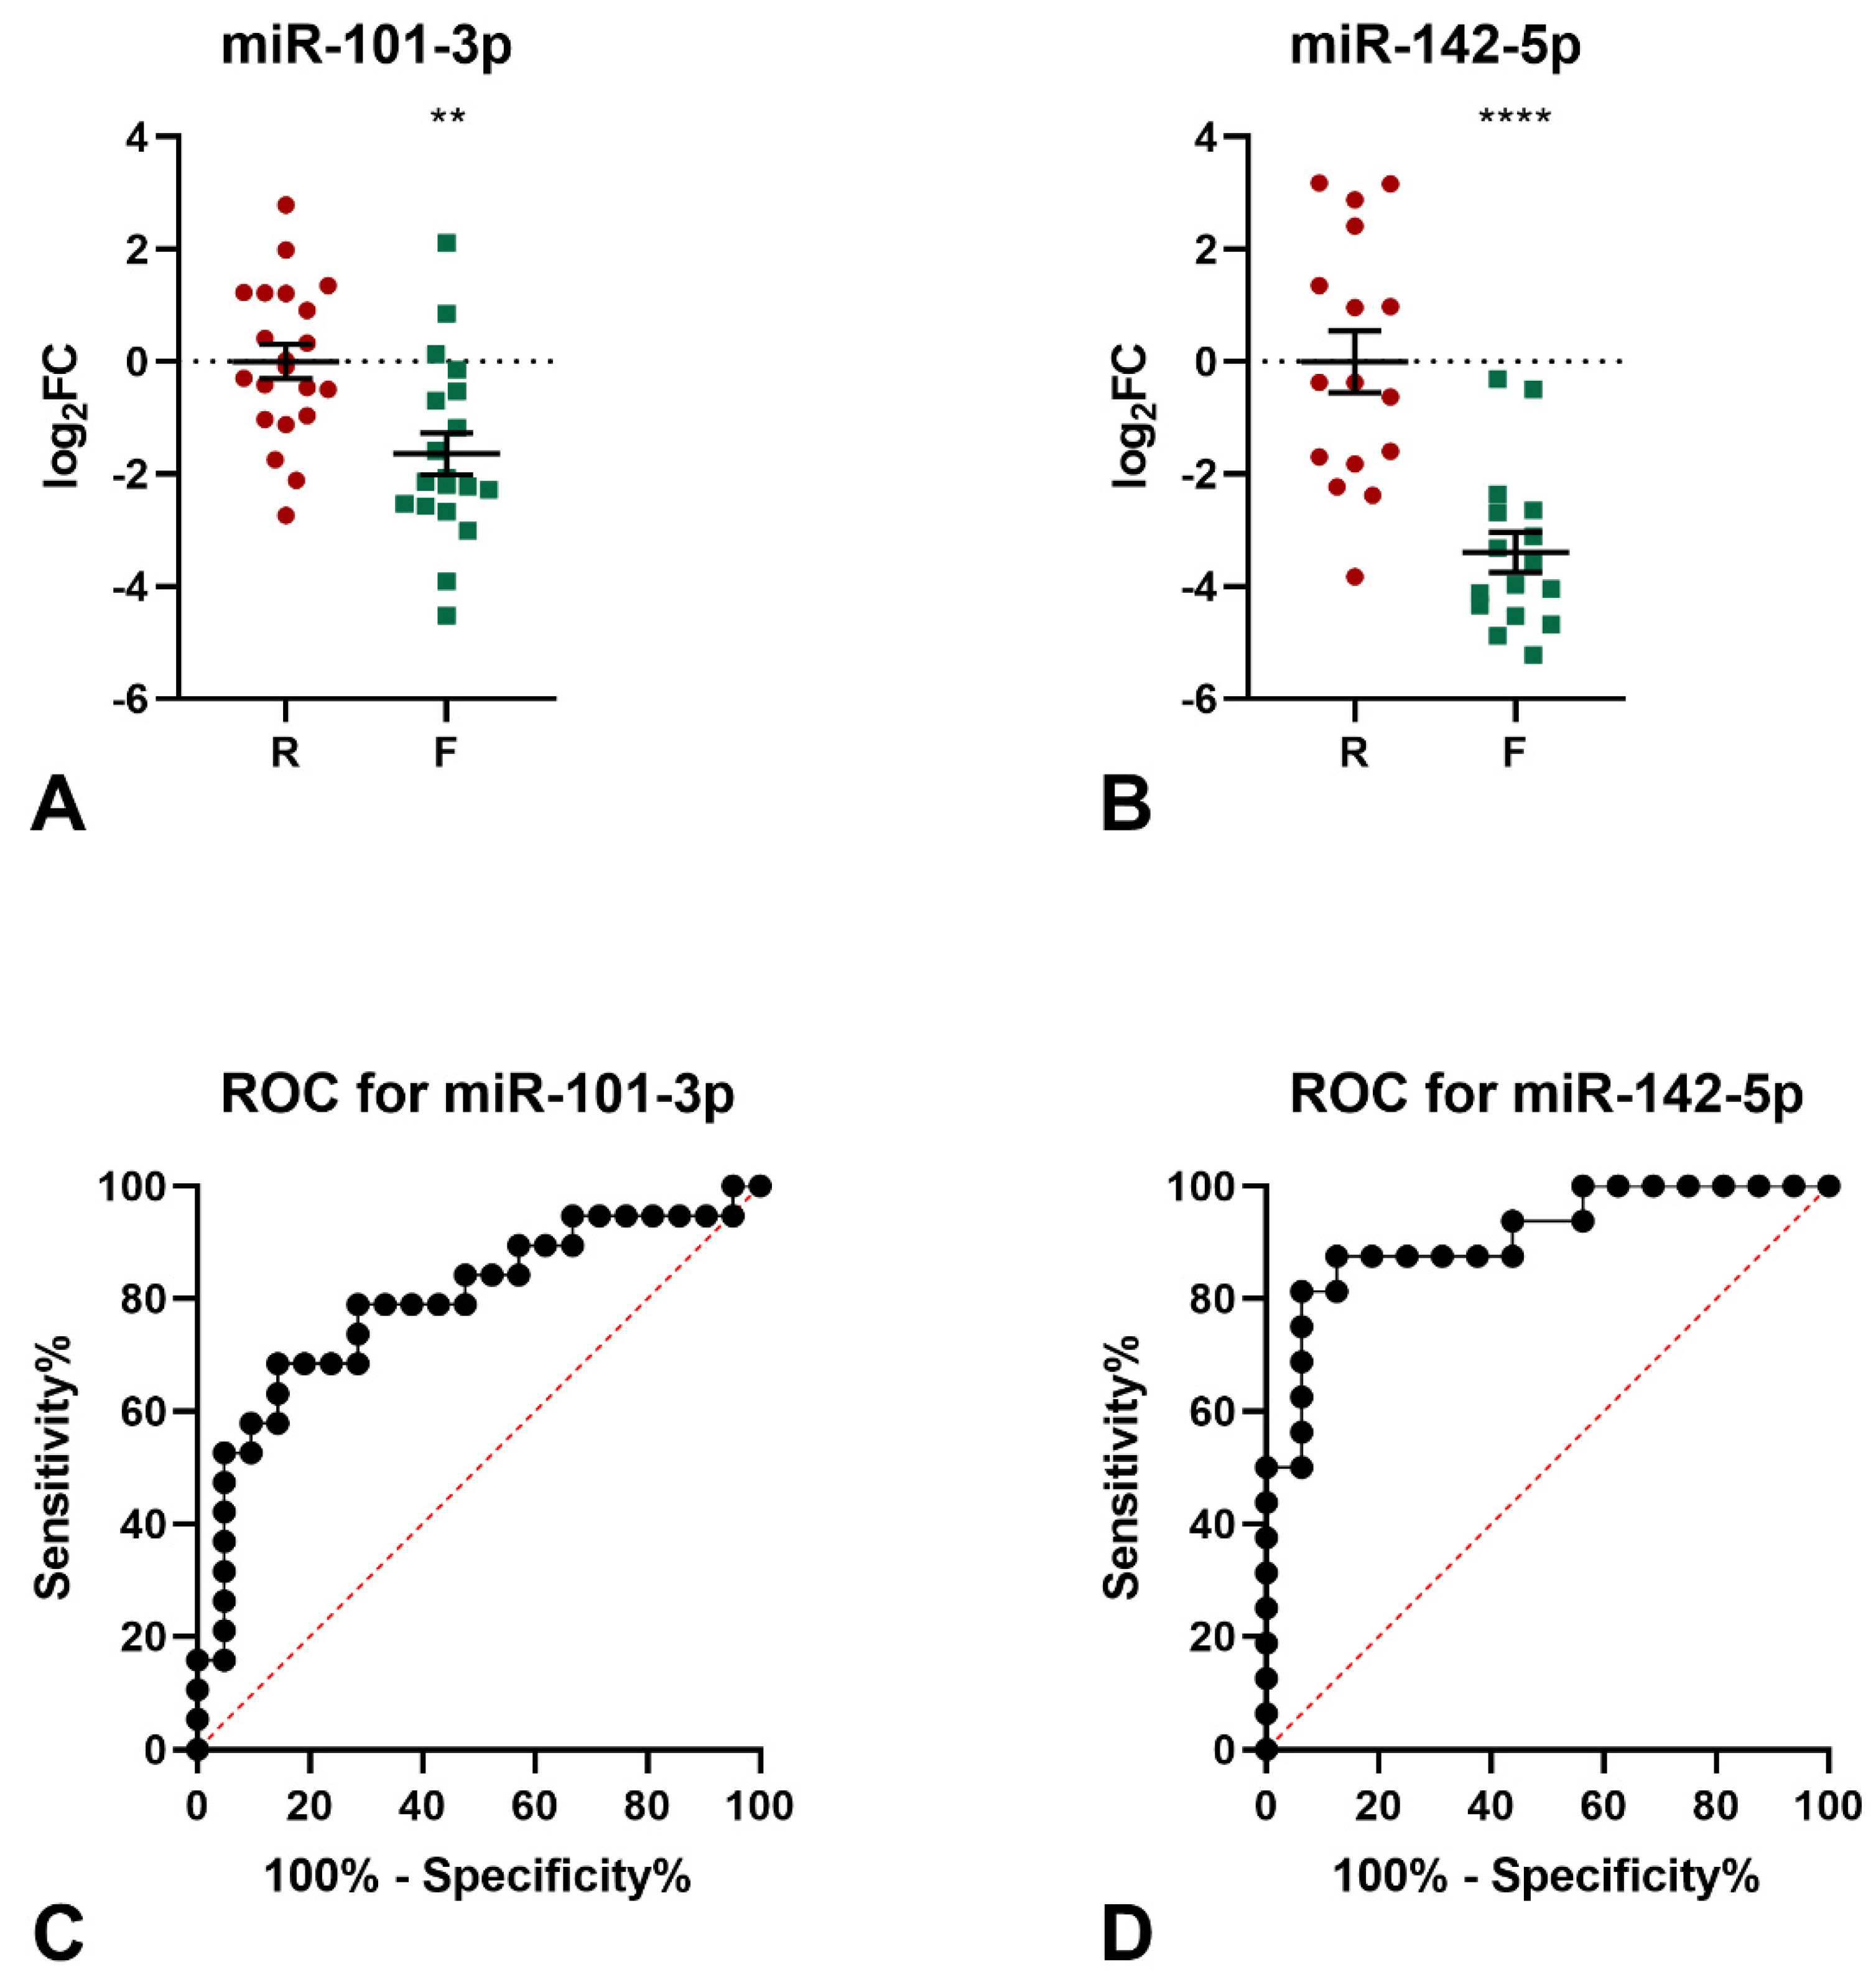
3.2. Human Blood miRNome Profiling Identifies 9 miRNAs Differentially Expressed in Frail Compared to Robust Subjects
3.3. Validation of RNA-Seq Expression Data by Quantitative PCR
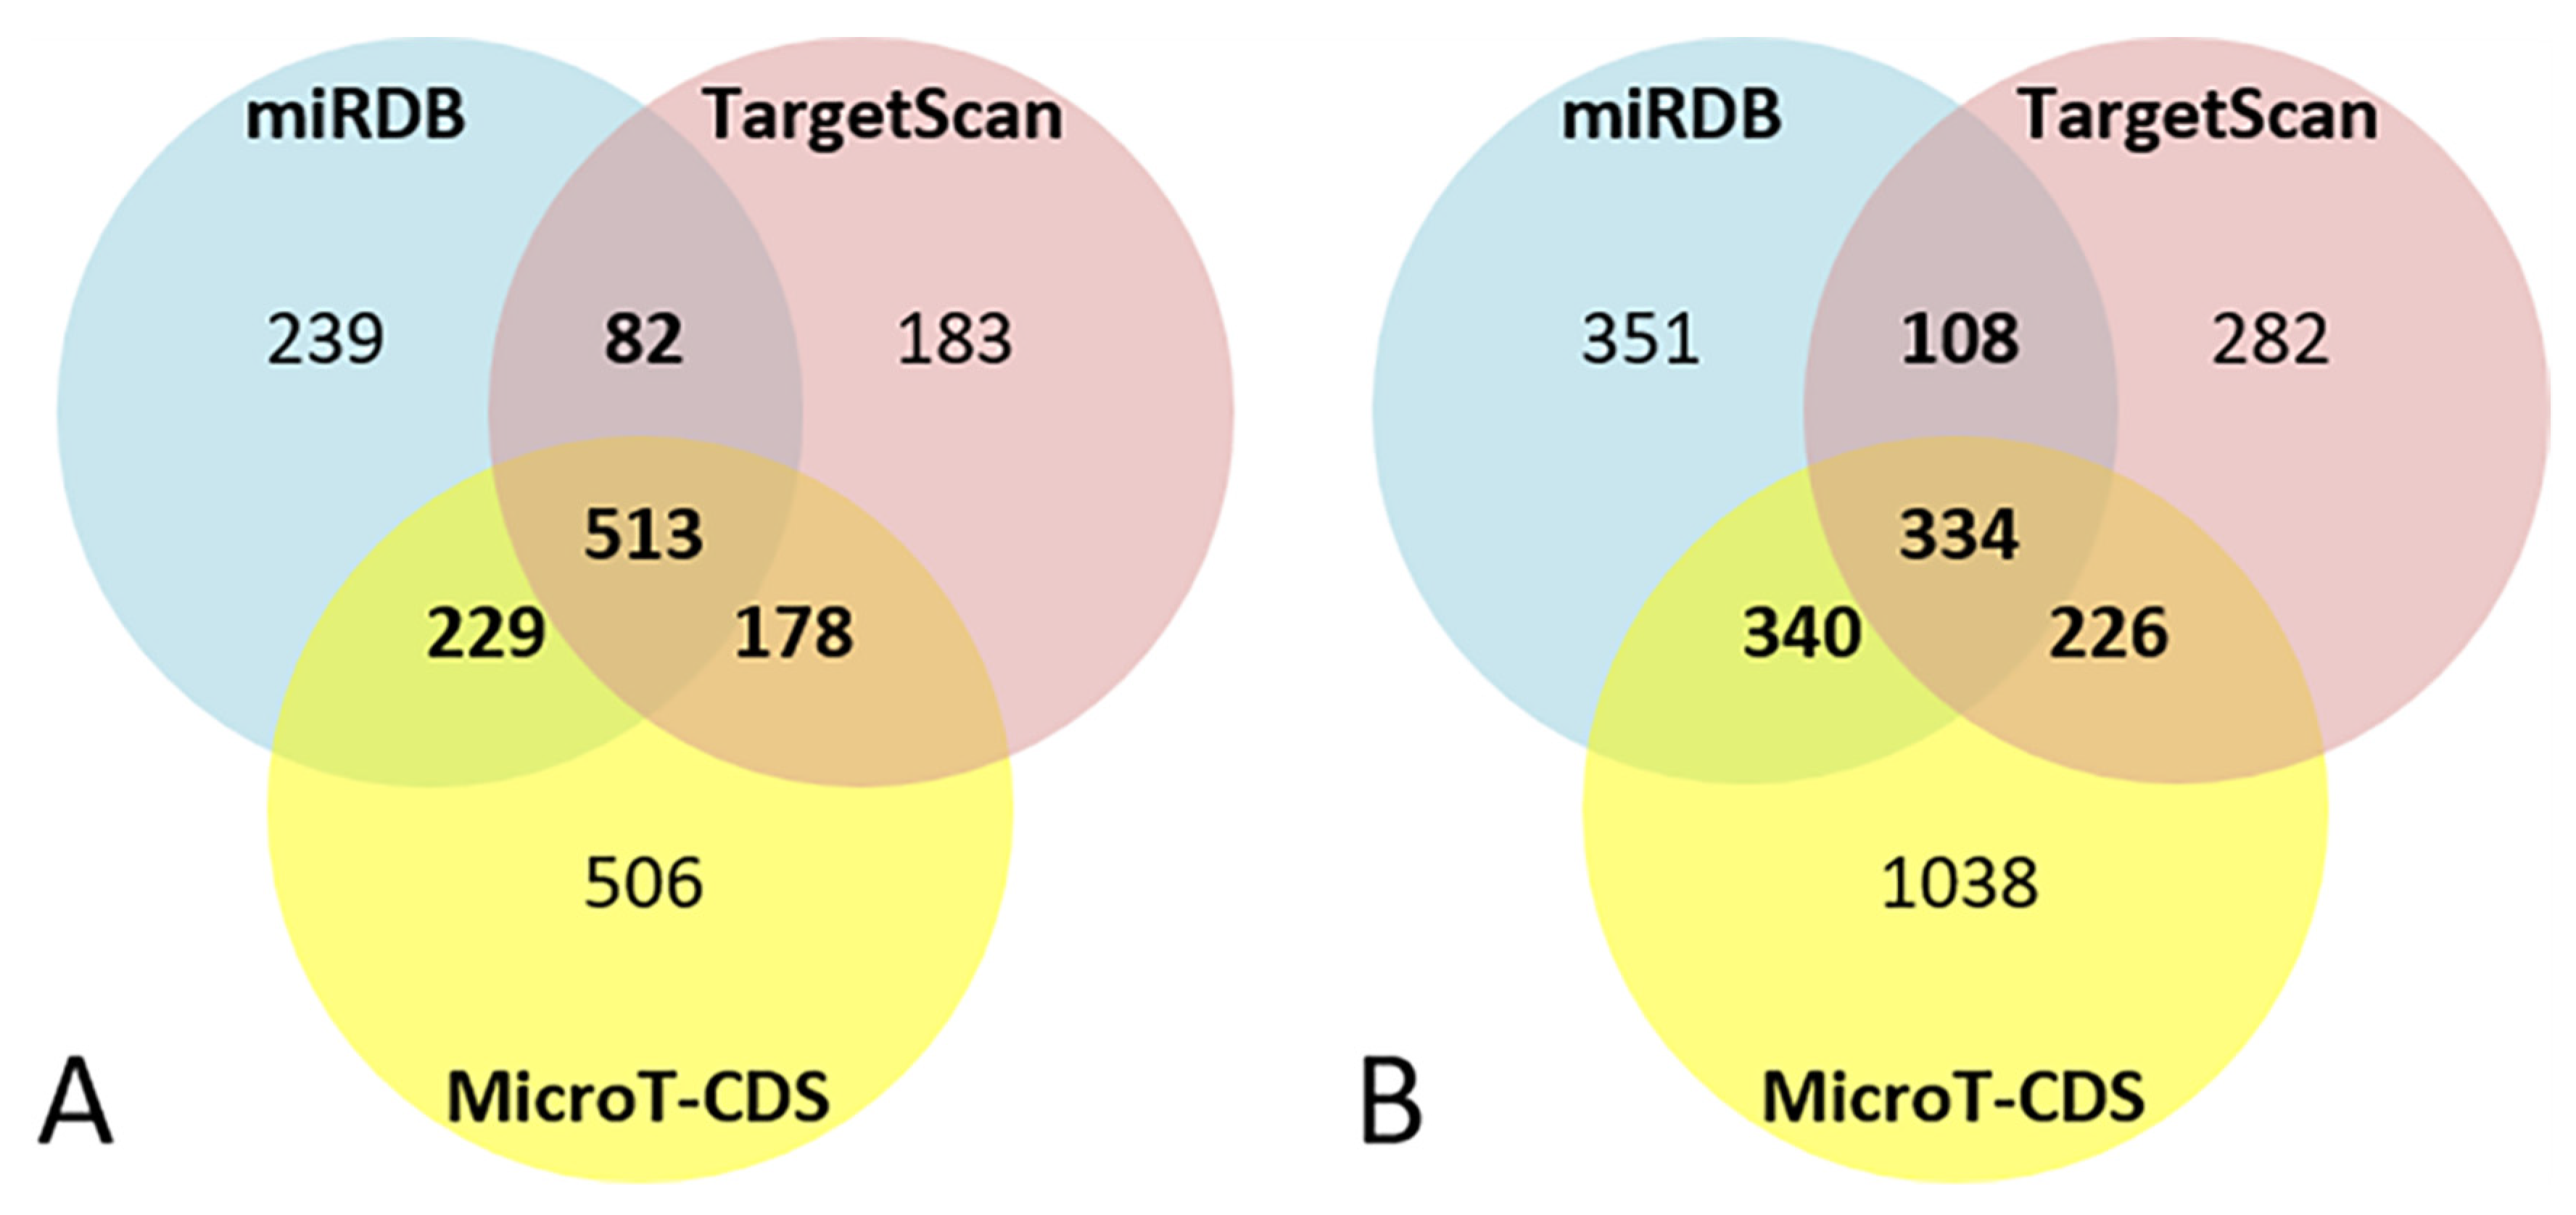
3.4. Bioinformatic Analysis of miR-101-3p Target Genes
3.5. Bioinformatic Analysis of miR-142-5p Target Genes
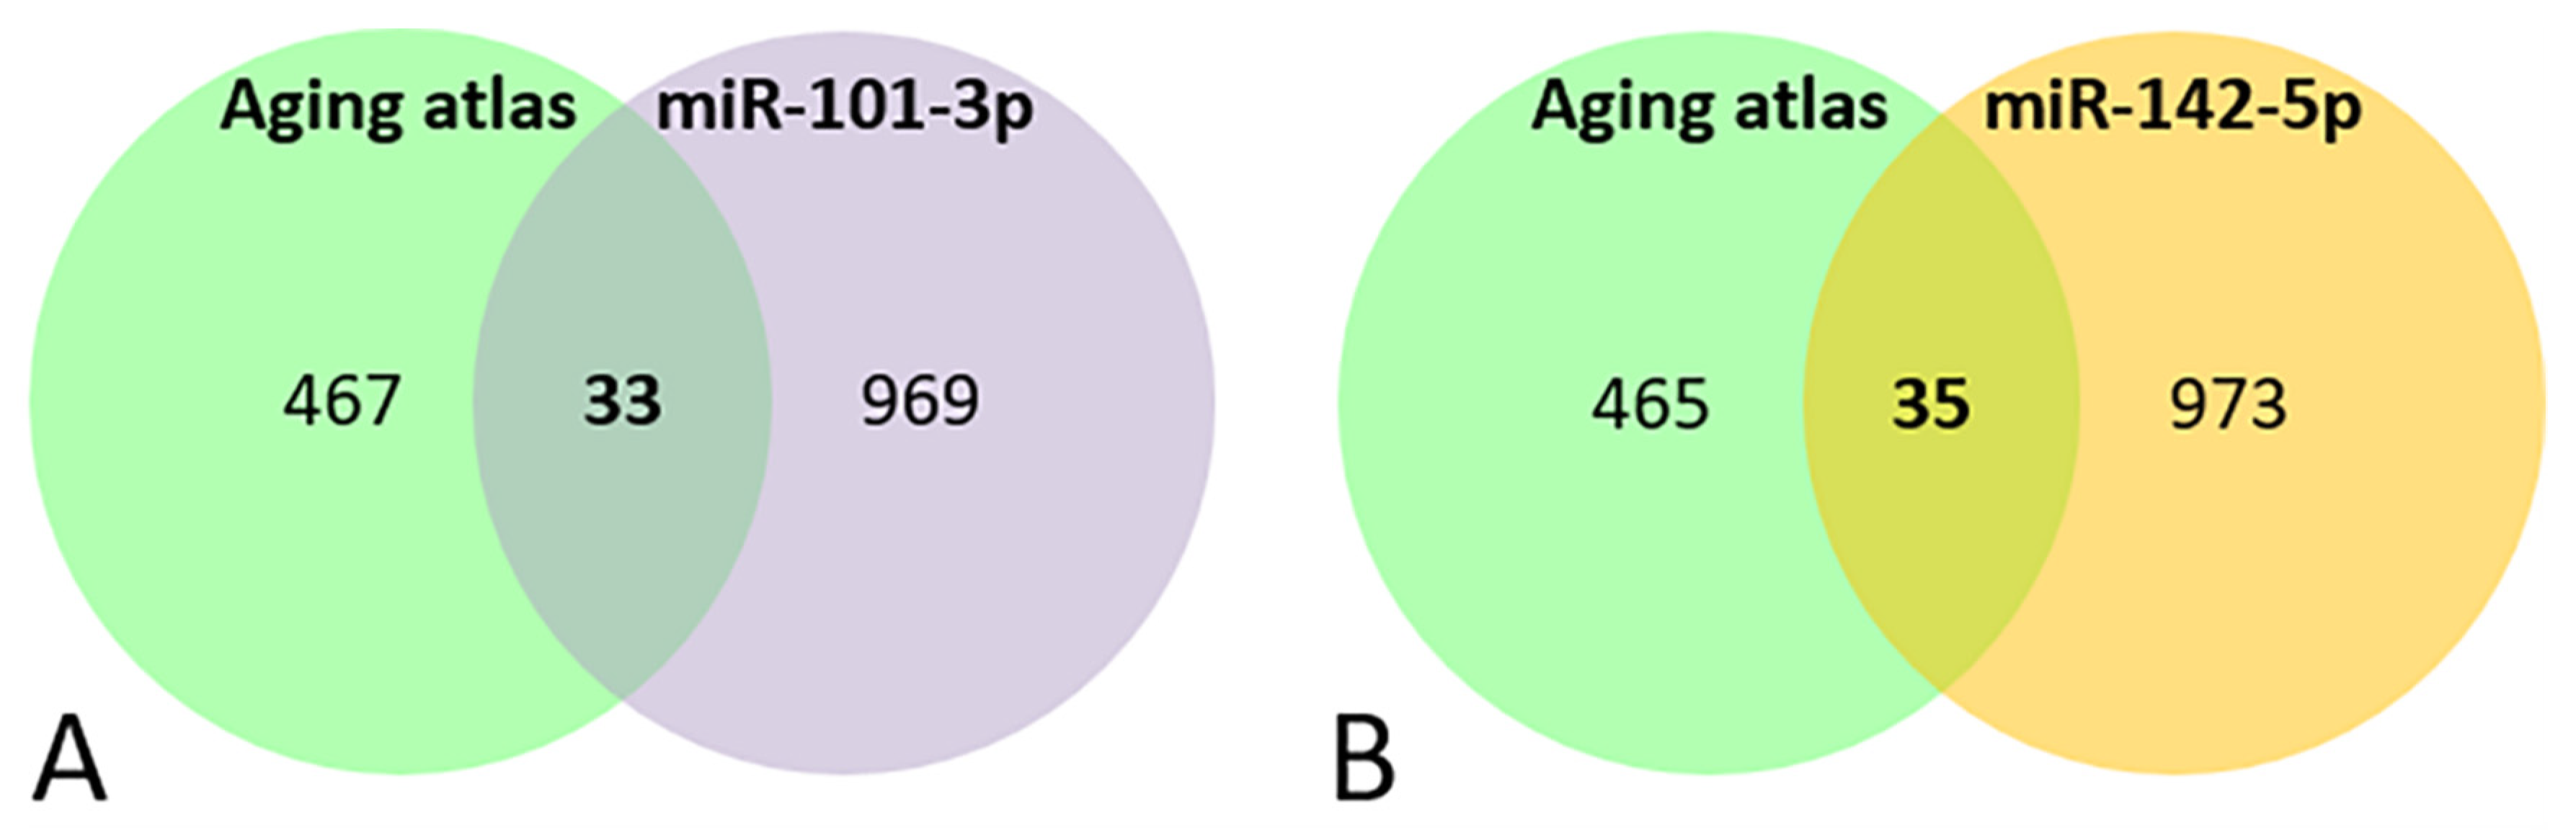
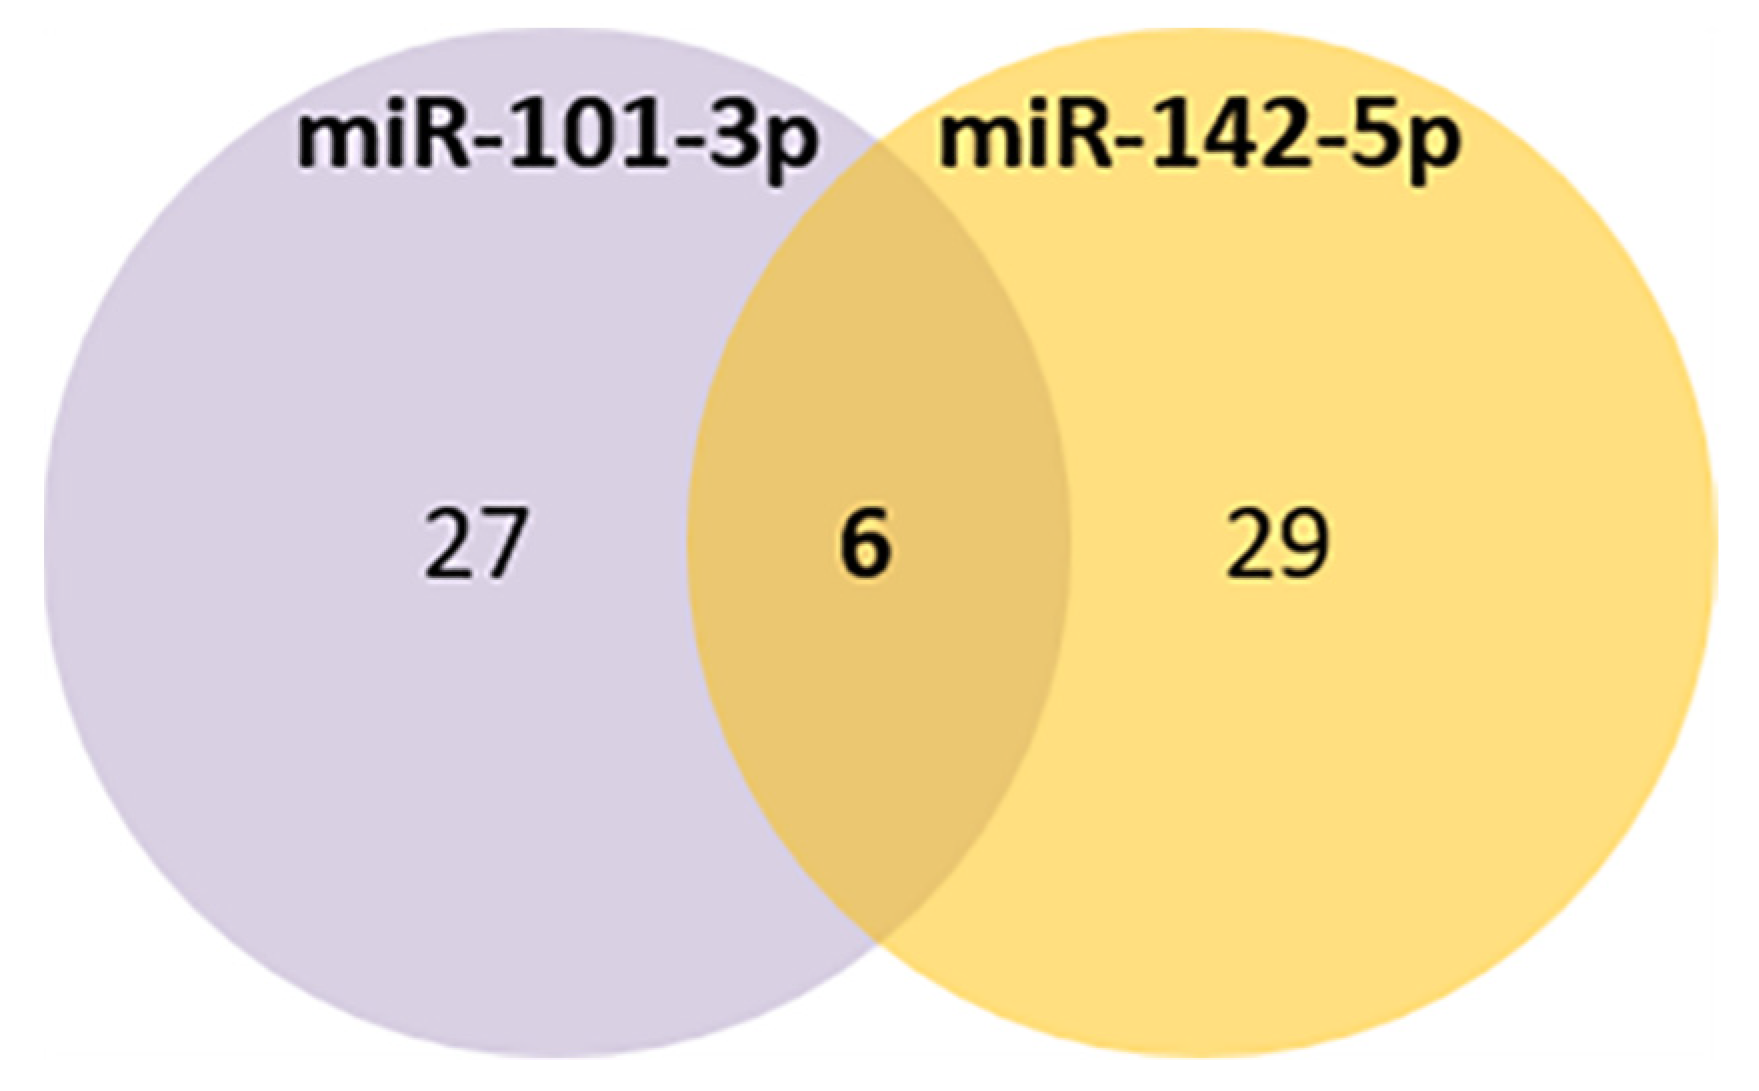
3.6. Bioinformatic Analysis of miRNAs’ Target Genes Related to Aging
4. Discussion
5. Conclusions
Supplementary Materials
Author Contributions
Funding
Institutional Review Board Statement
Informed Consent Statement
Data Availability Statement
Conflicts of Interest
References
- Proietti, M.; Cesari, M. Frailty: What Is It? Adv. Exp. Med. Biol. 2020, 1216, 1–7. [Google Scholar] [CrossRef] [PubMed]
- Fried, L.P.; Cohen, A.A.; Xue, Q.-L.; Walston, J.; Bandeen-Roche, K.; Varadhan, R. The physical frailty syndrome as a transition from homeostatic symphony to cacophony. Nat. Aging 2021, 1, 36–46. [Google Scholar] [CrossRef] [PubMed]
- Hoogendijk, E.O.; Afilalo, J.; Ensrud, K.E.; Kowal, P.; Onder, G.; Fried, L.P. Frailty: Implications for clinical practice and public health. Lancet 2019, 394, 1365–1375. [Google Scholar] [CrossRef]
- Rohrmann, S. Epidemiology of Frailty in Older People. Adv. Exp. Med. Biol. 2020, 1216, 21–27. [Google Scholar] [CrossRef] [PubMed]
- O’Caoimh, R.; Sezgin, D.; O’Donovan, M.R.; Molloy, D.W.; Clegg, A.; Rockwood, K.; Liew, A. Prevalence of frailty in 62 countries across the world: A systematic review and meta-analysis of population-level studies. Age Ageing 2021, 50, 96–104. [Google Scholar] [CrossRef] [PubMed]
- Collard, R.M.; Boter, H.; Schoevers, R.A.; Voshaar, R.O. Prevalence of Frailty in Community-Dwelling Older Persons: A Systematic Review. J. Am. Geriatr. Soc. 2012, 60, 1487–1492. [Google Scholar] [CrossRef]
- Fried, L.P.; Tangen, C.M.; Walston, J.; Newman, A.B.; Hirsch, C.; Gottdiener, J.; Seeman, T.; Tracy, R.; Kop, W.J.; Burke, G.; et al. Frailty in Older adults: Evidence for a phenotype. J. Gerontol. Ser. A Biol. Sci. Med. Sci. 2001, 56, M146–M157. [Google Scholar] [CrossRef]
- Pan, Y.; Ji, T.; Li, Y.; Ma, L. Omics biomarkers for frailty in older adults. Clin. Chim. Acta 2020, 510, 363–372. [Google Scholar] [CrossRef]
- Clegg, A.; Young, J.; Iliffe, S.; Rikkert, M.O.; Rockwood, K. Frailty in elderly people. Lancet 2013, 381, 752–762. [Google Scholar] [CrossRef] [Green Version]
- Bisset, E.S.; Howlett, S.E. The biology of frailty in humans and animals: Understanding frailty and promoting translation. Aging Med. 2019, 2, 27–34. [Google Scholar] [CrossRef]
- Sieber, C.C. Frailty—From concept to clinical practice. Exp. Gerontol. 2017, 87, 160–167. [Google Scholar] [CrossRef]
- Al Saedi, A.; Feehan, J.; Phu, S.; Duque, G. Current and emerging biomarkers of frailty in the elderly. Clin. Interv. Aging 2019, 14, 389–398. [Google Scholar] [CrossRef] [PubMed] [Green Version]
- Kane, A.E.; Sinclair, D.A. Frailty biomarkers in humans and rodents: Current approaches and future advances. Mech. Ageing Dev. 2019, 180, 117–128. [Google Scholar] [CrossRef] [PubMed]
- Condrat, C.E.; Thompson, D.C.; Barbu, M.G.; Bugnar, O.L.; Boboc, A.; Cretoiu, D.; Suciu, N.; Cretoiu, S.M.; Voinea, S.C. miRNAs as Biomarkers in Disease: Latest Findings Regarding Their Role in Diagnosis and Prognosis. Cells 2020, 9, 276. [Google Scholar] [CrossRef] [PubMed] [Green Version]
- Kinser, H.E.; Pincus, Z. MicroRNAs as modulators of longevity and the aging process. Hum. Genet. 2020, 139, 291–308. [Google Scholar] [CrossRef] [PubMed]
- Olivieri, F.; Capri, M.; Bonafè, M.; Morsiani, C.; Jung, H.J.; Spazzafumo, L.; Viña, J.; Suh, Y. Circulating miRNAs and miRNA shuttles as biomarkers: Perspective trajectories of healthy and unhealthy aging. Mech. Ageing Dev. 2017, 165, 162–170. [Google Scholar] [CrossRef] [PubMed] [Green Version]
- Kumar, S.; Vijayan, M.; Bhatti, J.S.; Reddy, P.H. MicroRNAs as Peripheral Biomarkers in Aging and Age-Related Diseases. Prog Mol. Biol. Transl. Sci. 2017, 146, 47–94. [Google Scholar] [CrossRef]
- Mohr, A.M.; Mott, J.L. Overview of MicroRNA Biology. Semin. Liver Dis. 2015, 35, 003–011. [Google Scholar] [CrossRef] [Green Version]
- Alvarez-Garcia, I.; Miska, E.A. MicroRNA functions in animal development and human disease. Development 2005, 132, 4653–4662. [Google Scholar] [CrossRef] [Green Version]
- Kloosterman, W.P.; Plasterk, R.H. The Diverse Functions of MicroRNAs in Animal Development and Disease. Dev. Cell 2006, 11, 441–450. [Google Scholar] [CrossRef] [Green Version]
- Rusanova, I.; Fernández-Martínez, J.; Fernández-Ortiz, M.; Aranda-Martínez, P.; Escames, G.; García-García, F.J.; Mañas, L.; Acuña-Castroviejo, D. Involvement of plasma miRNAs, muscle miRNAs and mitochondrial miRNAs in the pathophysiology of frailty. Exp. Gerontol. 2019, 124, 110637. [Google Scholar] [CrossRef] [PubMed]
- Ipson, B.R.; Fletcher, M.B.; Espinoza, S.E.; Fisher, A.L. Identifying exosome-derived micrornas as candidate biomarkers of frailty. J. Frailty Aging 2017, 7, 100–103. [Google Scholar] [CrossRef] [PubMed]
- Carini, G.; Musazzi, L.; Bolzetta, F.; Cester, A.; Fiorentini, C.; Ieraci, A.; Maggi, S.; Popoli, M.; Veronese, N.; Barbon, A. The Potential Role of miRNAs in Cognitive Frailty. Front. Aging Neurosci. 2021, 13, 763110. [Google Scholar] [CrossRef] [PubMed]
- Vatic, M.; von Haehling, S.; Ebner, N. Inflammatory biomarkers of frailty. Exp. Gerontol. 2020, 133, 110858. [Google Scholar] [CrossRef] [PubMed]
- Washburn, R.A.; McAuley, E.; Katula, J.; Mihalko, S.L.; Boileau, R.A. The Physical Activity Scale for the Elderly (PASE): Evidence for Validity. J. Clin. Epidemiol. 1999, 52, 643–651. [Google Scholar] [CrossRef]
- Tombaugh, T.N.; McIntyre, N.J. The Mini-Mental State Examination: A Comprehensive Review. J. Am. Geriatr. Soc. 1992, 40, 922–935. [Google Scholar] [CrossRef] [PubMed]
- Kozomara, A.; Birgaoanu, M.; Griffiths-Jones, S. miRBase: From microRNA sequences to function. Nucleic Acids Res. 2019, 47, D155–D162. [Google Scholar] [CrossRef] [PubMed]
- Agarwal, V.; Bell, G.W.; Nam, J.W.; Bartel, D.P. Predicting effective microRNA target sites in mammalian mRNAs. eLife 2015, 4, e05005. [Google Scholar] [CrossRef] [PubMed]
- Paraskevopoulou, M.D.; Georgakilas, G.; Kostoulas, N.; Vlachos, I.S.; Vergoulis, T.; Reczko, M.; Filippidis, C.; Dalamagas, T.; Hatzigeorgiou, A.G. DIANA-microT web server v5.0: Service integration into miRNA functional analysis workflows. Nucleic Acids Res. 2013, 41, W169–W173. [Google Scholar] [CrossRef] [Green Version]
- Chen, Y.; Wang, X. miRDB: An online database for prediction of functional microRNA targets. Nucleic Acids Res. 2020, 48, D127–D131. [Google Scholar] [CrossRef] [Green Version]
- Kuleshov, M.V.; Jones, M.R.; Rouillard, A.D.; Fernandez, N.F.; Duan, Q.; Wang, Z.; Koplev, S.; Jenkins, S.L.; Jagodnik, K.M.; Lachmann, A.; et al. Enrichr: A comprehensive gene set enrichment analysis web server 2016 update. Nucleic Acids Res. 2016, 44, W90–W97. [Google Scholar] [CrossRef] [PubMed] [Green Version]
- Chen, E.Y.; Tan, C.M.; Kou, Y.; Duan, Q.; Wang, Z.; Meirelles, G.V.; Clark, N.R.; Ma’Ayan, A. Enrichr: Interactive and collaborative HTML5 gene list enrichment analysis tool. BMC Bioinform. 2013, 14, 128. [Google Scholar] [CrossRef] [PubMed] [Green Version]
- Kanehisa, M.; Goto, S. KEGG: Kyoto Encyclopedia of Genes and Genomes. Nucleic Acids Res. 2000, 28, 27–30. [Google Scholar] [CrossRef] [PubMed]
- Mi, H.; Muruganujan, A.; Thomas, P.D. PANTHER in 2013: Modeling the evolution of gene function, and other gene attributes, in the context of phylogenetic trees. Nucleic Acids Res. 2012, 41, D377–D386. [Google Scholar] [CrossRef] [Green Version]
- Aging Atlas Consortium; Liu, G.-H.; Bao, Y.; Qu, J.; Zhang, W.; Zhang, T.; Kang, W.; Yang, F.; Ji, Q.; Jiang, X.; et al. Aging Atlas: A multi-omics database for aging biology. Nucleic Acids Res. 2021, 49, D825–D830. [Google Scholar] [CrossRef]
- Lebrasseur, N.K.; de Cabo, R.; Fielding, R.; Ferrucci, L.; Rodriguez-Manas, L.; Viña, J.; Vellas, B. Identifying biomarkers for biological age: Geroscience and the icfsr task force. J. Frailty Aging 2021, 10, 196–201. [Google Scholar] [CrossRef]
- Calvani, R.; Picca, A.; Marini, F.; Biancolillo, A.; Gervasoni, J.; Persichilli, S.; Primiano, A.; Coelho-Junior, H.J.; Cesari, M.; Bossola, M.; et al. Identification of biomarkers for physical frailty and sarcopenia through a new multi-marker approach: Results from the BIOSPHERE study. GeroScience 2021, 43, 727–740. [Google Scholar] [CrossRef]
- Landino, K.; Tanaka, T.; Fantoni, G.; Candia, J.; Bandinelli, S.; Ferrucci, L. Characterization of the plasma proteomic profile of frailty phenotype. GeroScience 2021, 43, 1029–1037. [Google Scholar] [CrossRef]
- Van Epps, P.; Oswald, D.; Higgins, P.A.; Hornick, T.R.; Aung, H.; Banks, R.E.; Wilson, B.M.; Burant, C.; Gravenstein, S.; Canaday, D.H.; et al. Frailty has a stronger association with inflammation than age in older veterans. Immun. Ageing 2016, 13, 27. [Google Scholar] [CrossRef] [Green Version]
- McAdams-DeMarco, M.A.; Ying, H.; Thomas, A.; Warsame, F.; Shaffer, A.; Haugen, C.E.; Garonzik-Wang, J.M.; Desai, N.M.; Varadhan, R.; Walston, J.; et al. Frailty, Inflammatory Markers, and Waitlist Mortality among Patients with End-stage Renal Disease in a Prospective Cohort Study. Transplantation 2018, 102, 1740–1746. [Google Scholar] [CrossRef]
- Gough, P.; Myles, I.A. Tumor Necrosis Factor Receptors: Pleiotropic Signaling Complexes and Their Differential Effects. Front. Immunol. 2020, 11, 585880. [Google Scholar] [CrossRef] [PubMed]
- Chen, G.; Goeddel, D.V. TNF-R1 Signaling: A Beautiful Pathway. Science 2002, 296, 1634–1635. [Google Scholar] [CrossRef] [PubMed] [Green Version]
- Quinn, S.R.; O’Neill, L. A trio of microRNAs that control Toll-like receptor signalling. Int. Immunol. 2011, 23, 421–425. [Google Scholar] [CrossRef] [PubMed] [Green Version]
- Boldin, M.; Baltimore, D. MicroRNAs, new effectors and regulators of NF-κB. Immunol. Rev. 2012, 246, 205–220. [Google Scholar] [CrossRef]
- Olivieri, F.; Rippo, M.R.; Procopio, A.D.; Fazioli, F. Circulating inflamma-miRs in aging and age-related diseases. Front. Genet. 2013, 4, 121. [Google Scholar] [CrossRef] [Green Version]
- Bu, H.; Wedel, S.; Cavinato, M.; Jansen-Dürr, P. MicroRNA Regulation of Oxidative Stress-Induced Cellular Senescence. Oxid. Med. Cell. Longev. 2017, 2017, 2398696. [Google Scholar] [CrossRef]
- Geiger, J.; Dalgaard, L.T. Interplay of mitochondrial metabolism and microRNAs. Cell. Mol. Life Sci. 2017, 74, 631–646. [Google Scholar] [CrossRef]
- Suh, N. MicroRNA controls of cellular senescence. BMB Rep. 2018, 51, 493–499. [Google Scholar] [CrossRef] [Green Version]
- Sannicandro, A.J.; Soriano-Arroquia, A.; Goljanek-Whysall, K. Micro(RNA)-managing muscle wasting. J. Appl. Physiol. 2019, 127, 619–632. [Google Scholar] [CrossRef]
- Yin, J.; Qian, Z.; Chen, Y.; Li, Y.; Zhou, X. MicroRNA regulatory networks in the pathogenesis of sarcopenia. J. Cell. Mol. Med. 2020, 24, 4900–4912. [Google Scholar] [CrossRef]
- Rajman, M.; Schratt, G. MicroRNAs in neural development: From master regulators to fine-tuners. Development 2017, 144, 2310–2322. [Google Scholar] [CrossRef] [PubMed] [Green Version]
- Esteves, M.; Serra-Almeida, C.; Saraiva, C.; Bernardino, L. New insights into the regulatory roles of microRNAs in adult neurogenesis. Curr. Opin. Pharmacol. 2020, 50, 38–45. [Google Scholar] [CrossRef] [PubMed]
- Slota, J.; Booth, S.A. MicroRNAs in Neuroinflammation: Implications in Disease Pathogenesis, Biomarker Discovery and Therapeutic Applications. Non-Coding RNA 2019, 5, 35. [Google Scholar] [CrossRef] [PubMed] [Green Version]
- Sarkar, S.N.; Russell, A.E.; Engler-Chiurazzi, E.B.; Porter, K.N.; Simpkins, J.W. MicroRNAs and the Genetic Nexus of Brain Aging, Neuroinflammation, Neurodegeneration, and Brain Trauma. Aging Dis. 2019, 10, 329–352. [Google Scholar] [CrossRef] [Green Version]
- Rusanova, I.; Diaz-Casado, M.E.; Fernández-Ortiz, M.; Aranda-Martínez, P.; Guerra-Librero, A.; García-García, F.J.; Escames, G.; Mañas, L.; Acuña-Castroviejo, D. Analysis of Plasma MicroRNAs as Predictors and Biomarkers of Aging and Frailty in Humans. Oxidative Med. Cell. Longev. 2018, 2018, 7671850. [Google Scholar] [CrossRef] [Green Version]
- Zhang, H.; Yang, H.; Zhang, C.; Jing, Y.; Wang, C.; Liu, C.; Zhang, R.; Wang, J.; Zhang, J.; Zen, K.; et al. Investigation of MicroRNA Expression in Human Serum during the Aging Process. J. Gerontol. Ser. A 2015, 70, 102–109. [Google Scholar] [CrossRef] [Green Version]
- Dluzen, D.F.; Noren Hooten, N.; Evans, M.K. Extracellular RNA in aging. Wiley interdisciplinary reviews. RNA 2017, 8, e1385. [Google Scholar] [CrossRef] [Green Version]
- Wang, C.-Z.; Deng, F.; Li, H.; Wang, D.-D.; Zhang, W.; Ding, L.; Tang, J.-H. MiR-101: A potential therapeutic target of cancers. Am. J. Transl. Res. 2018, 10, 3310–3321. [Google Scholar]
- Yi, J.; Huang, W.-Z.; Wen, Y.-Q.; Yi, Y.-C. Effect of miR-101 on proliferation and oxidative stress-induced apoptosis of breast cancer cells via Nrf2 signaling pathway. Eur. Rev. Med. Pharmacol. Sci. 2019, 23, 8931–8939. [Google Scholar]
- Lin, S.; Shao, N.-N.; Fan, L.; Ma, X.-C.; Pu, F.-F.; Shao, Z.-W. Effect of microRNA-101 on proliferation and apoptosis of human osteosarcoma cells by targeting mTOR. J. Huazhong Univ. Sci. Technol. Med. Sci. 2014, 34, 889–895. [Google Scholar] [CrossRef]
- Xu, Y.; An, Y.; Wang, Y.; Zhang, C.; Zhang, H.; Huang, C.; Jiang, H.; Wang, X.; Li, X. miR-101 inhibits autophagy and enhances cisplatin-induced apoptosis in hepatocellular carcinoma cells. Oncol. Rep. 2013, 29, 2019–2024. [Google Scholar] [CrossRef] [PubMed] [Green Version]
- Xiaoping, L.; Zhibin, Y.; Wenjuan, L.; Zeyou, W.; Gang, X.; Zhaohui, L.; Ying, Z.; Minghua, W.; Guiyuan, L. CPEB1, a histone-modified hypomethylated gene, is regulated by miR-101 and involved in cell senescence in glioma. Cell Death Dis. 2013, 4, e675. [Google Scholar] [CrossRef] [PubMed] [Green Version]
- Manvati, S.; Mangalhara, K.C.; Kalaiarasan, P.; Srivastava, N.; Kumar, B.; Bamezai, R.N.K. MiR-101 Induces Senescence and Prevents Apoptosis in the Background of DNA Damage in MCF7 Cells. PLoS ONE 2014, 9, e111177. [Google Scholar] [CrossRef] [PubMed]
- Zhao, X.; Li, S.; Wang, Z.; Bai, N.; Feng, Y. miR-101-3p negatively regulates inflammation in systemic lupus erythematosus via MAPK1 targeting and inhibition of the NF-κB pathway. Mol. Med. Rep. 2021, 23, 359. [Google Scholar] [CrossRef]
- Zheng, Y.; Wang, Z.; Tu, Y.; Shen, H.; Dai, Z.; Lin, J.; Zhou, Z. miR-101a and miR-30b contribute to inflammatory cytokine-mediated β-cell dysfunction. Lab. Investig. 2015, 95, 1387–1397. [Google Scholar] [CrossRef] [Green Version]
- Santos, A.S.; Neto, E.C.; Fukui, R.T.; Ferreira, L.R.P.; Silva, M.E.R. Increased Expression of Circulating microRNA 101-3p in Type 1 Diabetes Patients: New Insights Into miRNA-Regulated Pathophysiological Pathways for Type 1 Diabetes. Front. Immunol. 2019, 10, 1637. [Google Scholar] [CrossRef] [Green Version]
- Bu, L.-L.; Xie, Y.-Y.; Lin, D.-Y.; Chen, Y.; Jing, X.-N.; Liang, Y.-R.; Peng, S.-D.; Huang, K.-X.; Tao, E.-X. LncRNA-T199678 Mitigates α-Synuclein-Induced Dopaminergic Neuron Injury via miR-101-3p. Front. Aging Neurosci. 2020, 12, 599246. [Google Scholar] [CrossRef]
- Sharma, S. Immunomodulation: A definitive role of microRNA-142. Dev. Comp. Immunol. 2017, 77, 150–156. [Google Scholar] [CrossRef]
- Berrien-Elliott, M.; Sun, Y.; Neal, C.; Ireland, A.; Trissal, M.C.; Sullivan, R.P.; Wagner, J.A.; Leong, J.W.; Wong, P.; Mah-Som, A.; et al. MicroRNA-142 Is Critical for the Homeostasis and Function of Type 1 Innate Lymphoid Cells. Immunity 2019, 51, 479–490.e6. [Google Scholar] [CrossRef]
- Talebi, F.; Ghorbani, S.; Chan, W.F.; Boghozian, R.; Masoumi, F.; Ghasemi, S.; Vojgani, M.; Power, C.; Noorbakhsh, F. MicroRNA-142 regulates inflammation and T cell differentiation in an animal model of multiple sclerosis. J. Neuroinflamm. 2017, 14, 55. [Google Scholar] [CrossRef] [Green Version]
- Zhu, J.; Zhang, Y.; Zhang, W.; Zhang, W.; Fan, L.; Wang, L.; Liu, Y.; Liu, S.; Guo, Y.; Wang, Y.; et al. MicroRNA-142-5p contributes to Hashimoto’s thyroiditis by targeting CLDN1. J. Transl. Med. 2016, 14, 166. [Google Scholar] [CrossRef] [PubMed] [Green Version]
- Fiorillo, A.A.; Tully, C.B.; Damsker, J.M.; Nagaraju, K.; Hoffman, E.; Heier, C.R. Muscle miRNAome shows suppression of chronic inflammatory miRNAs with both prednisone and vamorolone. Physiol. Genom. 2018, 50, 735–745. [Google Scholar] [CrossRef] [PubMed]
- Maciotta, S.; Meregalli, M.; Cassinelli, L.; Parolini, D.; Farini, A.; Del Fraro, G.; Gandolfi, F.; Forcato, M.; Ferrari, S.; Gabellini, D.; et al. Hmgb3 Is Regulated by MicroRNA-206 during Muscle Regeneration. PLoS ONE 2012, 7, e43464. [Google Scholar] [CrossRef] [PubMed] [Green Version]
- Wang, N.; Zhang, L.; Lu, Y.; Zhang, M.; Zhang, Z.; Wang, K.; Lv, J. Down-regulation of microRNA-142-5p attenuates oxygen-glucose deprivation and reoxygenation-induced neuron injury through up-regulating Nrf2/ARE signaling pathway. Biomed. Pharmacother. 2017, 89, 1187–1195. [Google Scholar] [CrossRef]
- Houri, K.; Mori, T.; Onodera, Y.; Tsujimoto, T.; Takehara, T.; Nakao, S.; Teramura, T.; Fukuda, K. miR-142 induces accumulation of reactive oxygen species (ROS) by inhibiting pexophagy in aged bone marrow mesenchymal stem cells. Sci. Rep. 2020, 10, 3735. [Google Scholar] [CrossRef] [Green Version]
- Cheng, D.; Li, J.; Zhang, L.; Hu, L. miR-142-5p suppresses proliferation and promotes apoptosis of human osteosarcoma cell line, HOS, by targeting PLA2G16 through the ERK1/2 signaling pathway. Oncol. Lett. 2018, 17, 1363–1371. [Google Scholar] [CrossRef] [Green Version]
- Yu, W.; Li, D.; Zhang, Y.; Li, C.; Zhang, C.; Wang, L. MiR-142-5p Acts as a Significant Regulator through Promoting Proliferation, Invasion, and Migration in Breast Cancer Modulated by Targeting SORBS1. Technol. Cancer Res. Treat. 2019, 18, 1533033819892264. [Google Scholar] [CrossRef] [Green Version]
- Wang, Z.; Liu, Z.; Fang, X.; Yang, H. MiR-142-5p Suppresses Tumorigenesis by Targeting PIK3CA in Non-Small Cell Lung Cancer. Cell. Physiol. Biochem. 2017, 43, 2505–2515. [Google Scholar] [CrossRef] [Green Version]
- Marzolo, M.-P.; Farfán, P. New Insights into the Roles of Megalin/LRP2 and the Regulation of its Functional Expression. Biol. Res. 2011, 44, 89–105. [Google Scholar] [CrossRef] [Green Version]
- Kozyraki, R.; Cases, O. Inherited LRP2 dysfunction in human disease and animal models. J. Rare Dis. Res. Treat. 2017, 2, 22–31. [Google Scholar] [CrossRef]
- Souder, D.C.; Anderson, R.M. An expanding GSK3 network: Implications for aging research. GeroScience 2019, 41, 369–382. [Google Scholar] [CrossRef] [PubMed]
- Duda, P.; Wiśniewski, J.; Wójtowicz, T.; Wójcicka, O.; Jaśkiewicz, M.R.; Drulis-Fajdasz, D.; Rakus, D.; McCubrey, J.A.; Gizak, A. Targeting GSK3 signaling as a potential therapy of neurodegenerative diseases and aging. Expert Opin. Ther. Targets 2018, 22, 833–848. [Google Scholar] [CrossRef] [PubMed]
- Krause, C.; Guzman, A.; Knaus, P. Noggin. Int. J. Biochem. Cell Biol. 2011, 43, 478–481. [Google Scholar] [CrossRef] [PubMed]
- Spehar, K.; Pan, A.; Beerman, I. Restoring aged stem cell functionality: Current progress and future directions. Stem Cells 2020, 38, 1060–1077. [Google Scholar] [CrossRef] [PubMed]
- Lin, P.-H.; Lin, L.-T.; Li, C.-J.; Kao, P.-G.; Tsai, H.-W.; Chen, S.-N.; Wen, Z.-H.; Wang, P.-H.; Tsui, K.-H. Combining Bioinformatics and Experiments to Identify CREB1 as a Key Regulator in Senescent Granulosa Cells. Diagnostics 2020, 10, 295. [Google Scholar] [CrossRef]
- Rolewska, P.; Simm, A.; Silber, R.-E.; Bartling, B. Reduced Expression Level of the cAMP Response Element-Binding Protein Contributes to Lung Aging. Am. J. Respir. Cell Mol. Biol. 2013, 50, 201–211. [Google Scholar] [CrossRef]
- Paramanik, V.; Thakur, M.K. Role of CREB signaling in aging brain. Arch. Ital. Biol. 2013, 151, 33–42. [Google Scholar]
- Chen, M.; Huang, J.-D.; Deng, H.K.; Dong, S.; Deng, W.; Tsang, S.L.; Huen, M.S.; Chen, L.; Zan, T.; Zhu, G.-X.; et al. Overexpression of eIF-5A2 in mice causes accelerated organismal aging by increasing chromosome instability. BMC Cancer 2011, 11, 199. [Google Scholar] [CrossRef] [Green Version]


| miRNA | logFC | p Value | FDR |
|---|---|---|---|
| hsa-miR-101-3p | −2.23 | 2.71 × 10⁻⁹ | 1.39 × 10⁻⁶ |
| hsa-miR-16-2-3p | −1.71 | 4.67 × 10⁻⁹ | 1.39 × 10⁻⁶ |
| hsa-miR-19a-3p | −1.69 | 3.17 × 10⁻⁸ | 6.28 × 10⁻⁶ |
| hsa-miR-144-5p | −1.67 | 2.92 × 10⁻⁷ | 4.33 × 10⁻⁵ |
| hsa-miR-126-5p | −1.21 | 2.20 × 10⁻⁴ | 2.09 × 10⁻² |
| hsa-miR-142-5p | −1.10 | 7.92 × 10⁻⁵ | 9.41 × 10⁻³ |
| hsa-miR-19b-3p | −1.01 | 2.47 × 10⁻⁴ | 2.09 × 10⁻² |
| hsa-miR-125b-5p | 1.09 | 8.28 × 10⁻⁴ | 5.47 × 10⁻² |
| hsa-miR-5690 | 1.20 | 4.23 × 10⁻⁴ | 3.14 × 10⁻² |
| TOP 20 KEGG Pathways | |||
|---|---|---|---|
| Term | Overlap | p Value | FDR |
| Axon guidance | 26/182 | 1.40 × 10⁻⁶ | 3.74 × 10⁻⁴ |
| PI3K-Akt signaling pathway | 35/354 | 1.04 × 10⁻⁴ | 0.006 |
| Focal adhesion | 23/201 | 1.93 × 10⁻⁴ | 0.007 |
| MAPK signaling pathway | 29/294 | 4.08 × 10⁻⁴ | 0.014 |
| Ras signaling pathway | 24/232 | 0.001 | 0.019 |
| TGF-β signaling pathway | 13/94 | 0.001 | 0.020 |
| Parathyroid hormone synthesis, secretion and action | 14/106 | 0.001 | 0.020 |
| Dopaminergic synapse | 16/132 | 0.001 | 0.021 |
| GnRH secretion | 10/64 | 0.001 | 0.021 |
| ErbB signaling pathway | 12/85 | 0.001 | 0.021 |
| cAMP signaling pathway | 22/216 | 0.001 | 0.021 |
| Sphingolipid signaling pathway | 14/119 | 0.003 | 0.038 |
| Inositol phosphate metabolism | 10/73 | 0.003 | 0.041 |
| Phosphatidylinositol signaling system | 12/97 | 0.003 | 0.041 |
| Thyroid hormone signaling pathway | 14/121 | 0.003 | 0.041 |
| AGE-RAGE signaling pathway in diabetic complications | 12/100 | 0.004 | 0.044 |
| Cholinergic synapse | 13/113 | 0.004 | 0.044 |
| Endocytosis | 23/252 | 0.004 | 0.044 |
| Signaling pathways regulating pluripotency of stem cells | 15/143 | 0.005 | 0.050 |
| Cellular senescence | 16/156 | 0.005 | 0.050 |
| TOP 20 PANTHER Pathways | |||
| Term | Overlap | p Value | FDR |
| EGF receptor signaling pathway Homo sapiens P00018 | 16/109 | 1.04 × 10⁻⁴ | 0.006 |
| Wnt signaling pathway Homo sapiens P00057 | 29/278 | 1.59 × 10⁻⁴ | 0.006 |
| FGF signaling pathway Homo sapiens P00021 | 14/99 | 4.09 × 10⁻⁴ | 0.007 |
| Integrin signaling pathway Homo sapiens P00034 | 19/156 | 3.07 × 10⁻⁴ | 0.007 |
| CCKR signaling map ST Homo sapiens P06959 | 19/165 | 0.001 | 0.009 |
| PI3 kinase pathway Homo sapiens P00048 | 7/42 | 0.005 | 0.046 |
| VEGF signaling pathway Homo sapiens P00056 | 8/54 | 0.005 | 0.047 |
| Alzheimer disease-amyloid secretase pathway Homo sapiens P00003 | 8/56 | 0.006 | 0.052 |
| Ras Pathway Homo sapiens P04393 | 9/69 | 0.007 | 0.053 |
| Alzheimer disease-presenilin pathway Homo sapiens P00004 | 11/99 | 0.011 | 0.064 |
| PDGF signaling pathway Homo sapiens P00047 | 12/112 | 0.010 | 0.064 |
| Oxytocin receptor mediated signaling pathway Homo sapiens P04391 | 6/39 | 0.012 | 0.064 |
| Endothelin signaling pathway Homo sapiens P00019 | 9/75 | 0.012 | 0.064 |
| Apoptosis signaling pathway Homo sapiens P00006 | 10/102 | 0.032 | 0.113 |
| Hypoxia response via HIF activation Homo sapiens P00030 | 4/24 | 0.030 | 0.113 |
| Insulin/IGF pathway-protein kinase B signaling cascade Homo sapiens P00033 | 5/34 | 0.026 | 0.113 |
| 5HT2 type receptor mediated signaling pathway Homo sapiens P04374 | 6/46 | 0.026 | 0.113 |
| T-cell activation Homo sapiens P00053 | 8/73 | 0.029 | 0.113 |
| Interleukin signaling pathway Homo sapiens P00036 | 9/86 | 0.028 | 0.113 |
| Cadherin signaling pathway Homo sapiens P00012 | 13/150 | 0.038 | 0.122 |
| TOP 20 GO Biological Process | |||
| Term | Overlap | p Value | FDR |
| regulation of transcription by RNA polymerase II (GO:0006357) | 209/2206 | 1.27 × 10⁻²⁰ | 4.68 × 10⁻¹⁷ |
| regulation of transcription, DNA-templated (GO:0006355) | 197/2244 | 8.24 × 10⁻¹⁶ | 7.61 × 10⁻¹³ |
| regulation of gene expression (GO:0010468) | 103/1079 | 1.67 × 10⁻¹⁰ | 6.87 × 10⁻⁸ |
| protein phosphorylation (GO:0006468) | 58/496 | 1.69 × 10⁻⁹ | 4.82 × 10⁻⁷ |
| cellular protein modification process (GO:0006464) | 96/1025 | 1.99 × 10⁻⁹ | 5.26 × 10⁻⁷ |
| epithelial to mesenchymal transition (GO:0001837) | 13/47 | 3.33 × 10⁻⁷ | 7.23 × 10⁻⁵ |
| negative regulation of transmembrane receptor protein serine/threonine kinase signaling pathway (GO:0090101) | 20/108 | 3.63 × 10⁻⁷ | 7.45 × 10⁻⁵ |
| mesenchymal cell differentiation (GO:0048762) | 13/51 | 9.34 × 10⁻⁷ | 1.73 × 10⁻⁴ |
| blood vessel morphogenesis (GO:0048514) | 13/56 | 2.94 × 10⁻⁶ | 4.93 × 10⁻⁴ |
| chromatin remodeling (GO:0006338) | 18/103 | 3.30 × 10⁻⁶ | 0.001 |
| regulation of BMP signaling pathway (GO:0030510) | 15/76 | 4.55 × 10⁻⁶ | 0.001 |
| regulation of transforming growth factor β receptor signaling pathway (GO:0017015) | 17/100 | 9.00 × 10⁻⁶ | 0.001 |
| negative regulation of cell migration (GO:0030336) | 21/144 | 1.02 × 10⁻⁵ | 0.001 |
| regulation of cellular macromolecule biosynthetic process (GO:2000112) | 46/468 | 1.05 × 10⁻⁵ | 0.001 |
| regulation of microtubule polymerization (GO:0031113) | 10/40 | 2.04 × 10⁻⁵ | 0.003 |
| protein localization to nucleus (GO:0034504) | 17/106 | 1.99 × 10⁻⁵ | 0.003 |
| neuron migration (GO:0001764) | 11/50 | 2.92 × 10⁻⁵ | 0.003 |
| chromatin organization (GO:0006325) | 20/142 | 2.76 × 10⁻⁵ | 0.003 |
| generation of neurons (GO:0048699) | 25/202 | 2.84 × 10⁻⁵ | 0.003 |
| axonogenesis (GO:0007409) | 28/240 | 2.89 × 10⁻⁵ | 0.003 |
| TOP 20 GO Molecular Function | |||
| Term | Overlap | p Value | FDR |
| protein serine/threonine kinase activity (GO:0004674) | 47/344 | 4.00 × 10⁻¹⁰ | 2.70 × 10⁻⁷ |
| sequence-specific double-stranded DNA binding (GO:1990837) | 75/712 | 8.63 × 10⁻¹⁰ | 2.88 × 10⁻⁷ |
| RNA polymerase II cis-regulatory region sequence-specific DNA binding (GO:0000978) | 105/1149 | 1.28 × 10⁻⁹ | 2.88 × 10⁻⁷ |
| cis-regulatory region sequence-specific DNA binding (GO:0000987) | 104/1149 | 2.61 × 10⁻⁹ | 4.39 × 10⁻⁷ |
| RNA polymerase II transcription regulatory region sequence-specific DNA binding (GO:0000977) | 117/1359 | 4.57 × 10⁻⁹ | 6.15 × 10⁻⁷ |
| sequence-specific DNA binding (GO:0043565) | 67/707 | 4.01 × 10⁻⁷ | 4.50 × 10⁻⁵ |
| transcription regulatory region nucleic acid binding (GO:0001067) | 29/212 | 8.81 × 10⁻⁷ | 8.47 × 10⁻⁵ |
| nuclear import signal receptor activity (GO:0061608) | 7/16 | 5.96 × 10⁻⁶ | 4.71 × 10⁻⁴ |
| DNA binding (GO:0003677) | 70/811 | 6.30 × 10⁻⁶ | 4.71 × 10⁻⁴ |
| transcription cis-regulatory region binding (GO:0000976) | 52/549 | 8.18 × 10⁻⁶ | 0.001 |
| DNA-binding transcription activator activity, RNA polymerase II-specific (GO:0001228) | 36/333 | 1.25 × 10⁻⁵ | 0.001 |
| double-stranded DNA binding (GO:0003690) | 58/651 | 1.58 × 10⁻⁵ | 0.001 |
| nuclear localization sequence binding (GO:0008139) | 7/24 | 1.27 × 10⁻⁴ | 0.007 |
| mRNA binding (GO:0003729) | 28/263 | 1.45 × 10⁻⁴ | 0.007 |
| nuclear receptor binding (GO:0016922) | 16/120 | 3.23 × 10⁻⁴ | 0.015 |
| DNA-binding transcription repressor activity, RNA polymerase II-specific (GO:0001227) | 26/256 | 0.001 | 0.022 |
| GTPase regulator activity (GO:0030695) | 24/233 | 0.001 | 0.027 |
| adenyl ribonucleotide binding (GO:0032559) | 29/306 | 0.001 | 0.029 |
| histone demethylase activity (H3-K27 specific) (GO:0071558) | 3/5 | 0.001 | 0.041 |
| zinc ion binding (GO:0008270) | 30/336 | 0.002 | 0.054 |
| TOP 20 KEGG Pathways | |||
|---|---|---|---|
| Term | Overlap | p Value | FDR |
| Axon guidance | 29/182 | 3.57 × 10⁻⁸ | 9.47 × 10⁻⁶ |
| Signaling pathways regulating pluripotency of stem cells | 20/143 | 3.33 × 10⁻⁵ | 0.003 |
| Endocytosis | 29/252 | 3.02 × 10⁻⁵ | 0.003 |
| Ubiquitin mediated proteolysis | 19/140 | 7.88 × 10⁻⁵ | 0.005 |
| Regulation of actin cytoskeleton | 25/218 | 1.10 × 10⁻⁴ | 0.006 |
| TGF-β signaling pathway | 14/94 | 2.51 × 10⁻⁴ | 0.007 |
| MAPK signaling pathway | 30/294 | 2.02 × 10⁻⁴ | 0.007 |
| Dopaminergic synapse | 16/132 | 0.001 | 0.022 |
| Cholinergic synapse | 14/113 | 0.002 | 0.031 |
| Oxytocin signaling pathway | 17/154 | 0.002 | 0.035 |
| Aldosterone-regulated sodium reabsorption | 7/37 | 0.002 | 0.037 |
| ErbB signaling pathway | 11/85 | 0.004 | 0.046 |
| Phosphatidylinositol signaling system | 12/97 | 0.003 | 0.046 |
| Thyroid hormone signaling pathway | 14/121 | 0.003 | 0.046 |
| Hippo signaling pathway | 17/163 | 0.004 | 0.046 |
| Glutamatergic synapse | 13/114 | 0.005 | 0.056 |
| mTOR signaling pathway | 16/154 | 0.005 | 0.056 |
| Long-term potentiation | 9/67 | 0.006 | 0.066 |
| Hedgehog signaling pathway | 8/56 | 0.007 | 0.068 |
| Sphingolipid signaling pathway | 13/119 | 0.007 | 0.069 |
| PANTHER Pathways | |||
| Term | Overlap | p Value | FDR |
| PDGF signaling pathway Homo sapiens P00047 | 15/112 | 4.98 × 10⁻⁴ | 0.040 |
| Ras Pathway Homo sapiens P04393 | 10/69 | 0.002 | 0.075 |
| Alzheimer disease-presenilin pathway Homo sapiens P00004 | 12/99 | 0.004 | 0.075 |
| CCKR signaling map ST Homo sapiens P06959 | 17/165 | 0.004 | 0.075 |
| Angiogenesis Homo sapiens P00005 | 15/142 | 0.005 | 0.075 |
| Hypoxia response via HIF activation Homo sapiens P00030 | 5/24 | 0.006 | 0.075 |
| Insulin/IGF pathway-protein kinase B signaling cascade Homo sapiens P00033 | 6/34 | 0.006 | 0.075 |
| Vasopressin synthesis Homo sapiens P04395 | 3/10 | 0.012 | 0.117 |
| TGF-β signaling pathway Homo sapiens P00052 | 10/88 | 0.013 | 0.117 |
| Inflammation mediated by chemokine and cytokine signaling pathway Homo sapiens P00031 | 17/188 | 0.014 | 0.117 |
| Metabotropic glutamate receptor group III pathway Homo sapiens P00039 | 7/54 | 0.018 | 0.134 |
| Ubiquitin proteasome pathway Homo sapiens P00060 | 6/43 | 0.020 | 0.135 |
| TOP 20 GO Biological Process | |||
| Term | Overlap | p Value | FDR |
| regulation of transcription by RNA polymerase II (GO:0006357) | 183/2206 | 3.58 × 10⁻¹² | 8.72 × 10⁻⁹ |
| regulation of transcription, DNA-templated (GO:0006355) | 185/2244 | 4.57 × 10⁻¹² | 8.72 × 10⁻⁹ |
| positive regulation of cell differentiation (GO:0045597) | 33/258 | 8.64 × 10⁻⁷ | 0.001 |
| regulation of cell migration (GO:0030334) | 43/408 | 4.15 × 10⁻⁶ | 0.002 |
| ubiquitin-dependent protein catabolic process (GO:0006511) | 38/354 | 9.75 × 10⁻⁶ | 0.005 |
| protein phosphorylation (GO:0006468) | 48/496 | 1.20 × 10⁻⁵ | 0.005 |
| actin cytoskeleton reorganization (GO:0031532) | 13/63 | 1.25 × 10⁻⁵ | 0.005 |
| phosphorylation (GO:0016310) | 41/400 | 1.35 × 10⁻⁵ | 0.005 |
| proteasome-mediated ubiquitin-dependent protein catabolic process (GO:0043161) | 35/321 | 1.55 × 10⁻⁵ | 0.005 |
| sensory organ development (GO:0007423) | 12/56 | 1.80 × 10⁻⁵ | 0.005 |
| regulation of BMP signaling pathway (GO:0030510) | 14/76 | 2.30 × 10⁻⁵ | 0.006 |
| visual system development (GO:0150063) | 10/41 | 2.71 × 10⁻⁵ | 0.007 |
| modification-dependent protein catabolic process (GO:0019941) | 25/201 | 2.88 × 10⁻⁵ | 0.007 |
| peptidyl-threonine phosphorylation (GO:0018107) | 12/60 | 3.74 × 10⁻⁵ | 0.008 |
| negative regulation of cellular response to growth factor stimulus (GO:0090288) | 14/80 | 4.18 × 10⁻⁵ | 0.008 |
| regulation of cytoskeleton organization (GO:0051493) | 17/112 | 4.46 × 10⁻⁵ | 0.008 |
| protein ubiquitination (GO:0016567) | 48/525 | 5.15 × 10⁻⁵ | 0.009 |
| positive regulation of RIG-I signaling pathway (GO:1900246) | 5/10 | 6.56 × 10⁻⁵ | 0.011 |
| nervous system development (GO:0007399) | 42/447 | 8.14 × 10⁻⁵ | 0.012 |
| mRNA destabilization (GO:0061157) | 9/38 | 8.78 × 10⁻⁵ | 0.012 |
| TOP 20 GO Molecular Function | |||
| Term | Overlap | p Value | FDR |
| ubiquitin-protein transferase activity (GO:0004842) | 46/392 | 8.92 × 10⁻⁸ | 6.15 × 10⁻⁵ |
| sequence-specific double-stranded DNA binding (GO:1990837) | 66/712 | 1.31 × 10⁻⁶ | 4.52 × 10⁻⁴ |
| ubiquitin protein ligase activity (GO:0061630) | 32/263 | 3.73 × 10⁻⁶ | 0.001 |
| protein serine/threonine kinase activity (GO:0004674) | 35/344 | 6.57 × 10⁻⁵ | 0.006 |
| mRNA 3′-UTR binding (GO:0003730) | 14/85 | 8.34 × 10⁻⁵ | 0.007 |
| myosin binding (GO:0017022) | 11/56 | 9.31 × 10⁻⁵ | 0.007 |
| nuclear receptor binding (GO:0016922) | 17/120 | 1.08 × 10⁻⁴ | 0.007 |
| purine ribonucleoside triphosphate binding (GO:0035639) | 42/460 | 1.53 × 10⁻⁴ | 0.010 |
| DNA-binding transcription activator activity, RNA polymerase II-specific (GO:0001228) | 33/333 | 1.73 × 10⁻⁴ | 0.010 |
| transcription cis-regulatory region binding (GO:0000976) | 47/549 | 2.87 × 10⁻⁴ | 0.015 |
| RNA polymerase II transcription regulatory region sequence-specific DNA binding (GO:0000977) | 97/1359 | 3.04 × 10⁻⁴ | 0.015 |
| RNA polymerase II cis-regulatory region sequence-specific DNA binding (GO:0000978) | 84/1149 | 3.70 × 10⁻⁴ | 0.017 |
| GDP binding (GO:0019003) | 11/67 | 4.85 × 10⁻⁴ | 0.020 |
| kinase activity (GO:0016301) | 15/112 | 4.98 × 10⁻⁴ | 0.020 |
| GTPase binding (GO:0051020) | 22/201 | 0.001 | 0.020 |
| cis-regulatory region sequence-specific DNA binding (GO:0000987) | 83/1149 | 0.001 | 0.021 |
| mRNA 3’-UTR AU-rich region binding (GO:0035925) | 6/22 | 0.001 | 0.021 |
| myosin V binding (GO:0031489) | 5/15 | 0.001 | 0.021 |
| guanylate kinase activity (GO:0004385) | 4/9 | 0.001 | 0.021 |
| mRNA binding (GO:0003729) | 26/263 | 0.001 | 0.024 |
| A | mir-101-3p targets present in aging atlas | PLCG1, ADH5, GCLM, KL, PIK3CB, FGFR3, PRKAA1, MTOR, ELN, JAK2, PTGS2, EIF5A2, ITGA2, GSK3B, FOXO1, GCLC, SESN3, LMNB1, RORA, TNFSF11, CREB1, FOS, CXCL12, LRP2, CEBPA, SOCS2, NOG, CXCL6, MXD1, AKT3, HGF, APP, TOP1 |
| B | miR-142-5p targets present in aging atlas | PRKCB, NRG1, IGF1, RPS6KA5, RICTOR, HSPA8, NFE2L2, BMP2, GSK3B, TNFAIP3, SIRT7, RB1CC1, CREB1, LRP2, PDGFRA, NBN, PTEN, ULK1, KRAS, PAPPA, SUN1, EIF5A2, TOPORS, CLOCK, PRKAA2, RORA, FGF7, MXI1, PIK3CA, PSAT1, TNFSF13B, IL6ST, NOG, APPL1, PRKCA |
| C | miR-101-3p and miR-142-5p targets present in aging atlas | LRP2, GSK3B, NOG, RORA, CREB1, EIF5A2 |
Publisher’s Note: MDPI stays neutral with regard to jurisdictional claims in published maps and institutional affiliations. |
© 2022 by the authors. Licensee MDPI, Basel, Switzerland. This article is an open access article distributed under the terms and conditions of the Creative Commons Attribution (CC BY) license (https://creativecommons.org/licenses/by/4.0/).
Share and Cite
Carini, G.; Mingardi, J.; Bolzetta, F.; Cester, A.; Bolner, A.; Nordera, G.; La Via, L.; Ieraci, A.; Russo, I.; Maggi, S.; et al. miRNome Profiling Detects miR-101-3p and miR-142-5p as Putative Blood Biomarkers of Frailty Syndrome. Genes 2022, 13, 231. https://doi.org/10.3390/genes13020231
Carini G, Mingardi J, Bolzetta F, Cester A, Bolner A, Nordera G, La Via L, Ieraci A, Russo I, Maggi S, et al. miRNome Profiling Detects miR-101-3p and miR-142-5p as Putative Blood Biomarkers of Frailty Syndrome. Genes. 2022; 13(2):231. https://doi.org/10.3390/genes13020231
Chicago/Turabian StyleCarini, Giulia, Jessica Mingardi, Francesco Bolzetta, Alberto Cester, Andrea Bolner, Giampietro Nordera, Luca La Via, Alessandro Ieraci, Isabella Russo, Stefania Maggi, and et al. 2022. "miRNome Profiling Detects miR-101-3p and miR-142-5p as Putative Blood Biomarkers of Frailty Syndrome" Genes 13, no. 2: 231. https://doi.org/10.3390/genes13020231