
Overview of the Americas’ First Peopling from a Patrilineal Perspective: New Evidence from the Southern Continent

 , , ,
, , ,  , , , , , , and
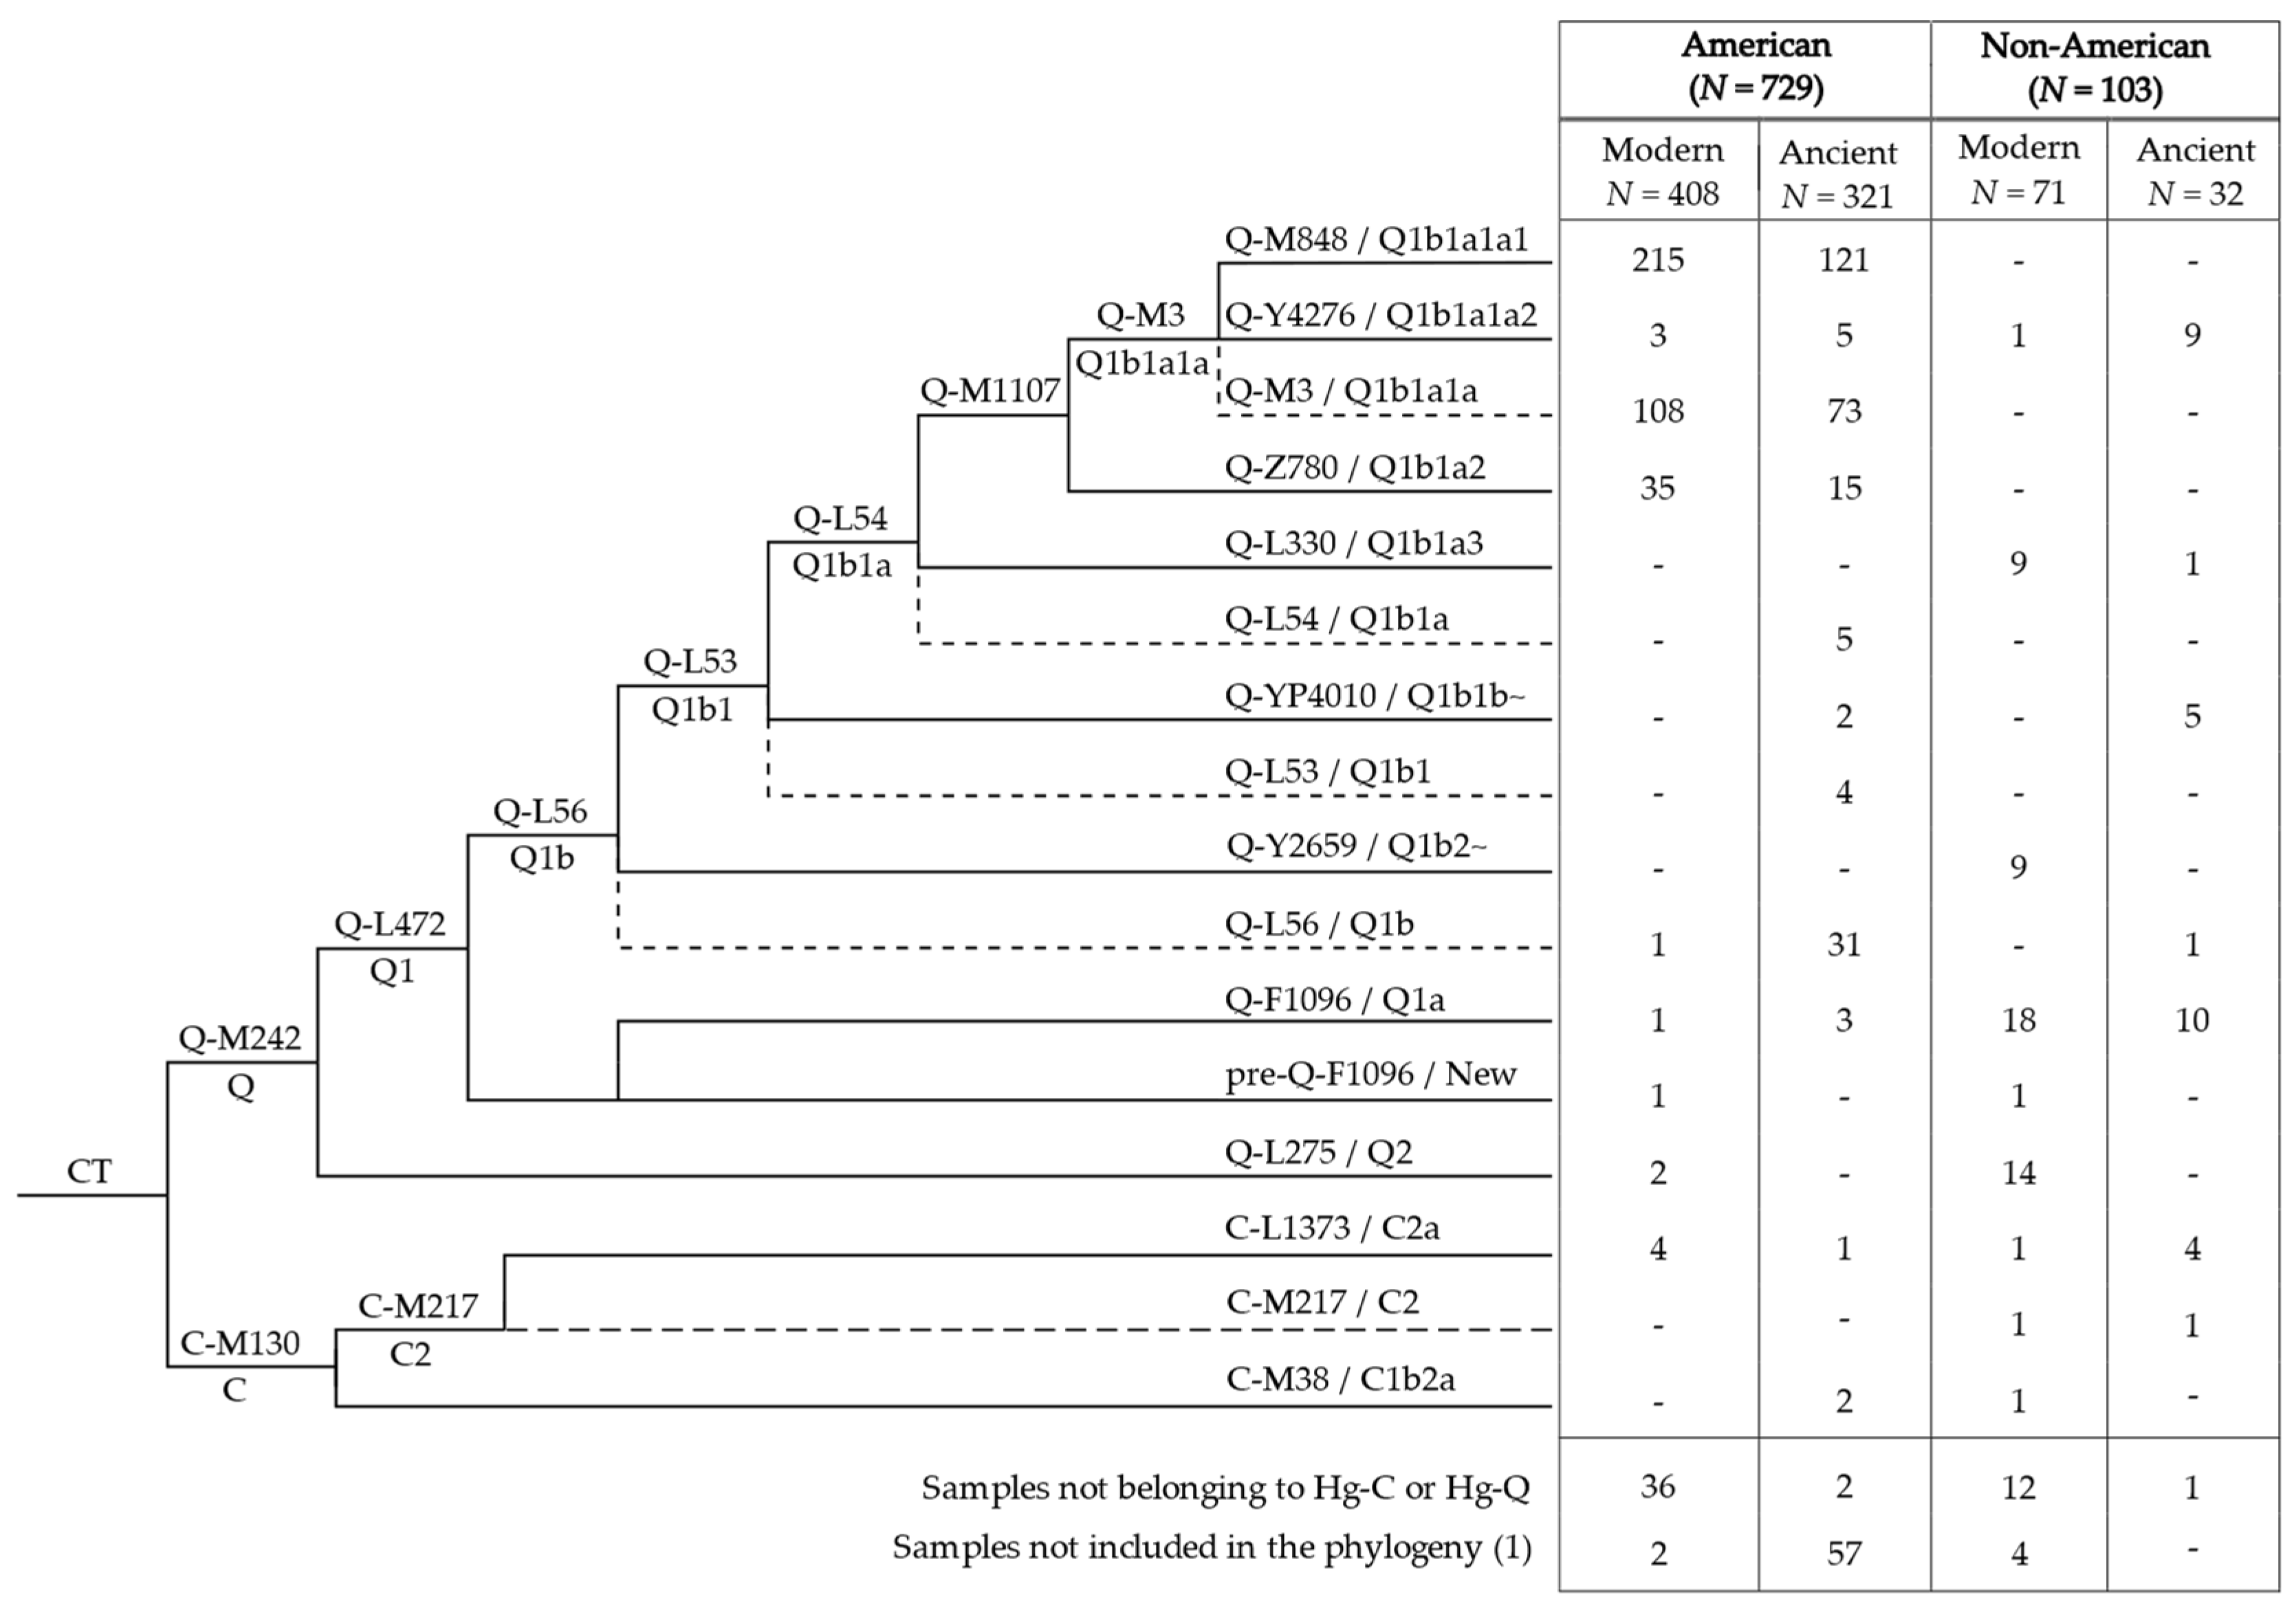
Abstract
:1. Introduction
2. Materials and Methods
2.1. Dataset Construction
2.2. Filtering and Coverage Estimation
2.3. Variant Calling, Merging, and Quality Control Filters
2.4. Phylogenetic Analysis
2.5. Time Estimates of Phylogenetic Nodes
3. Results
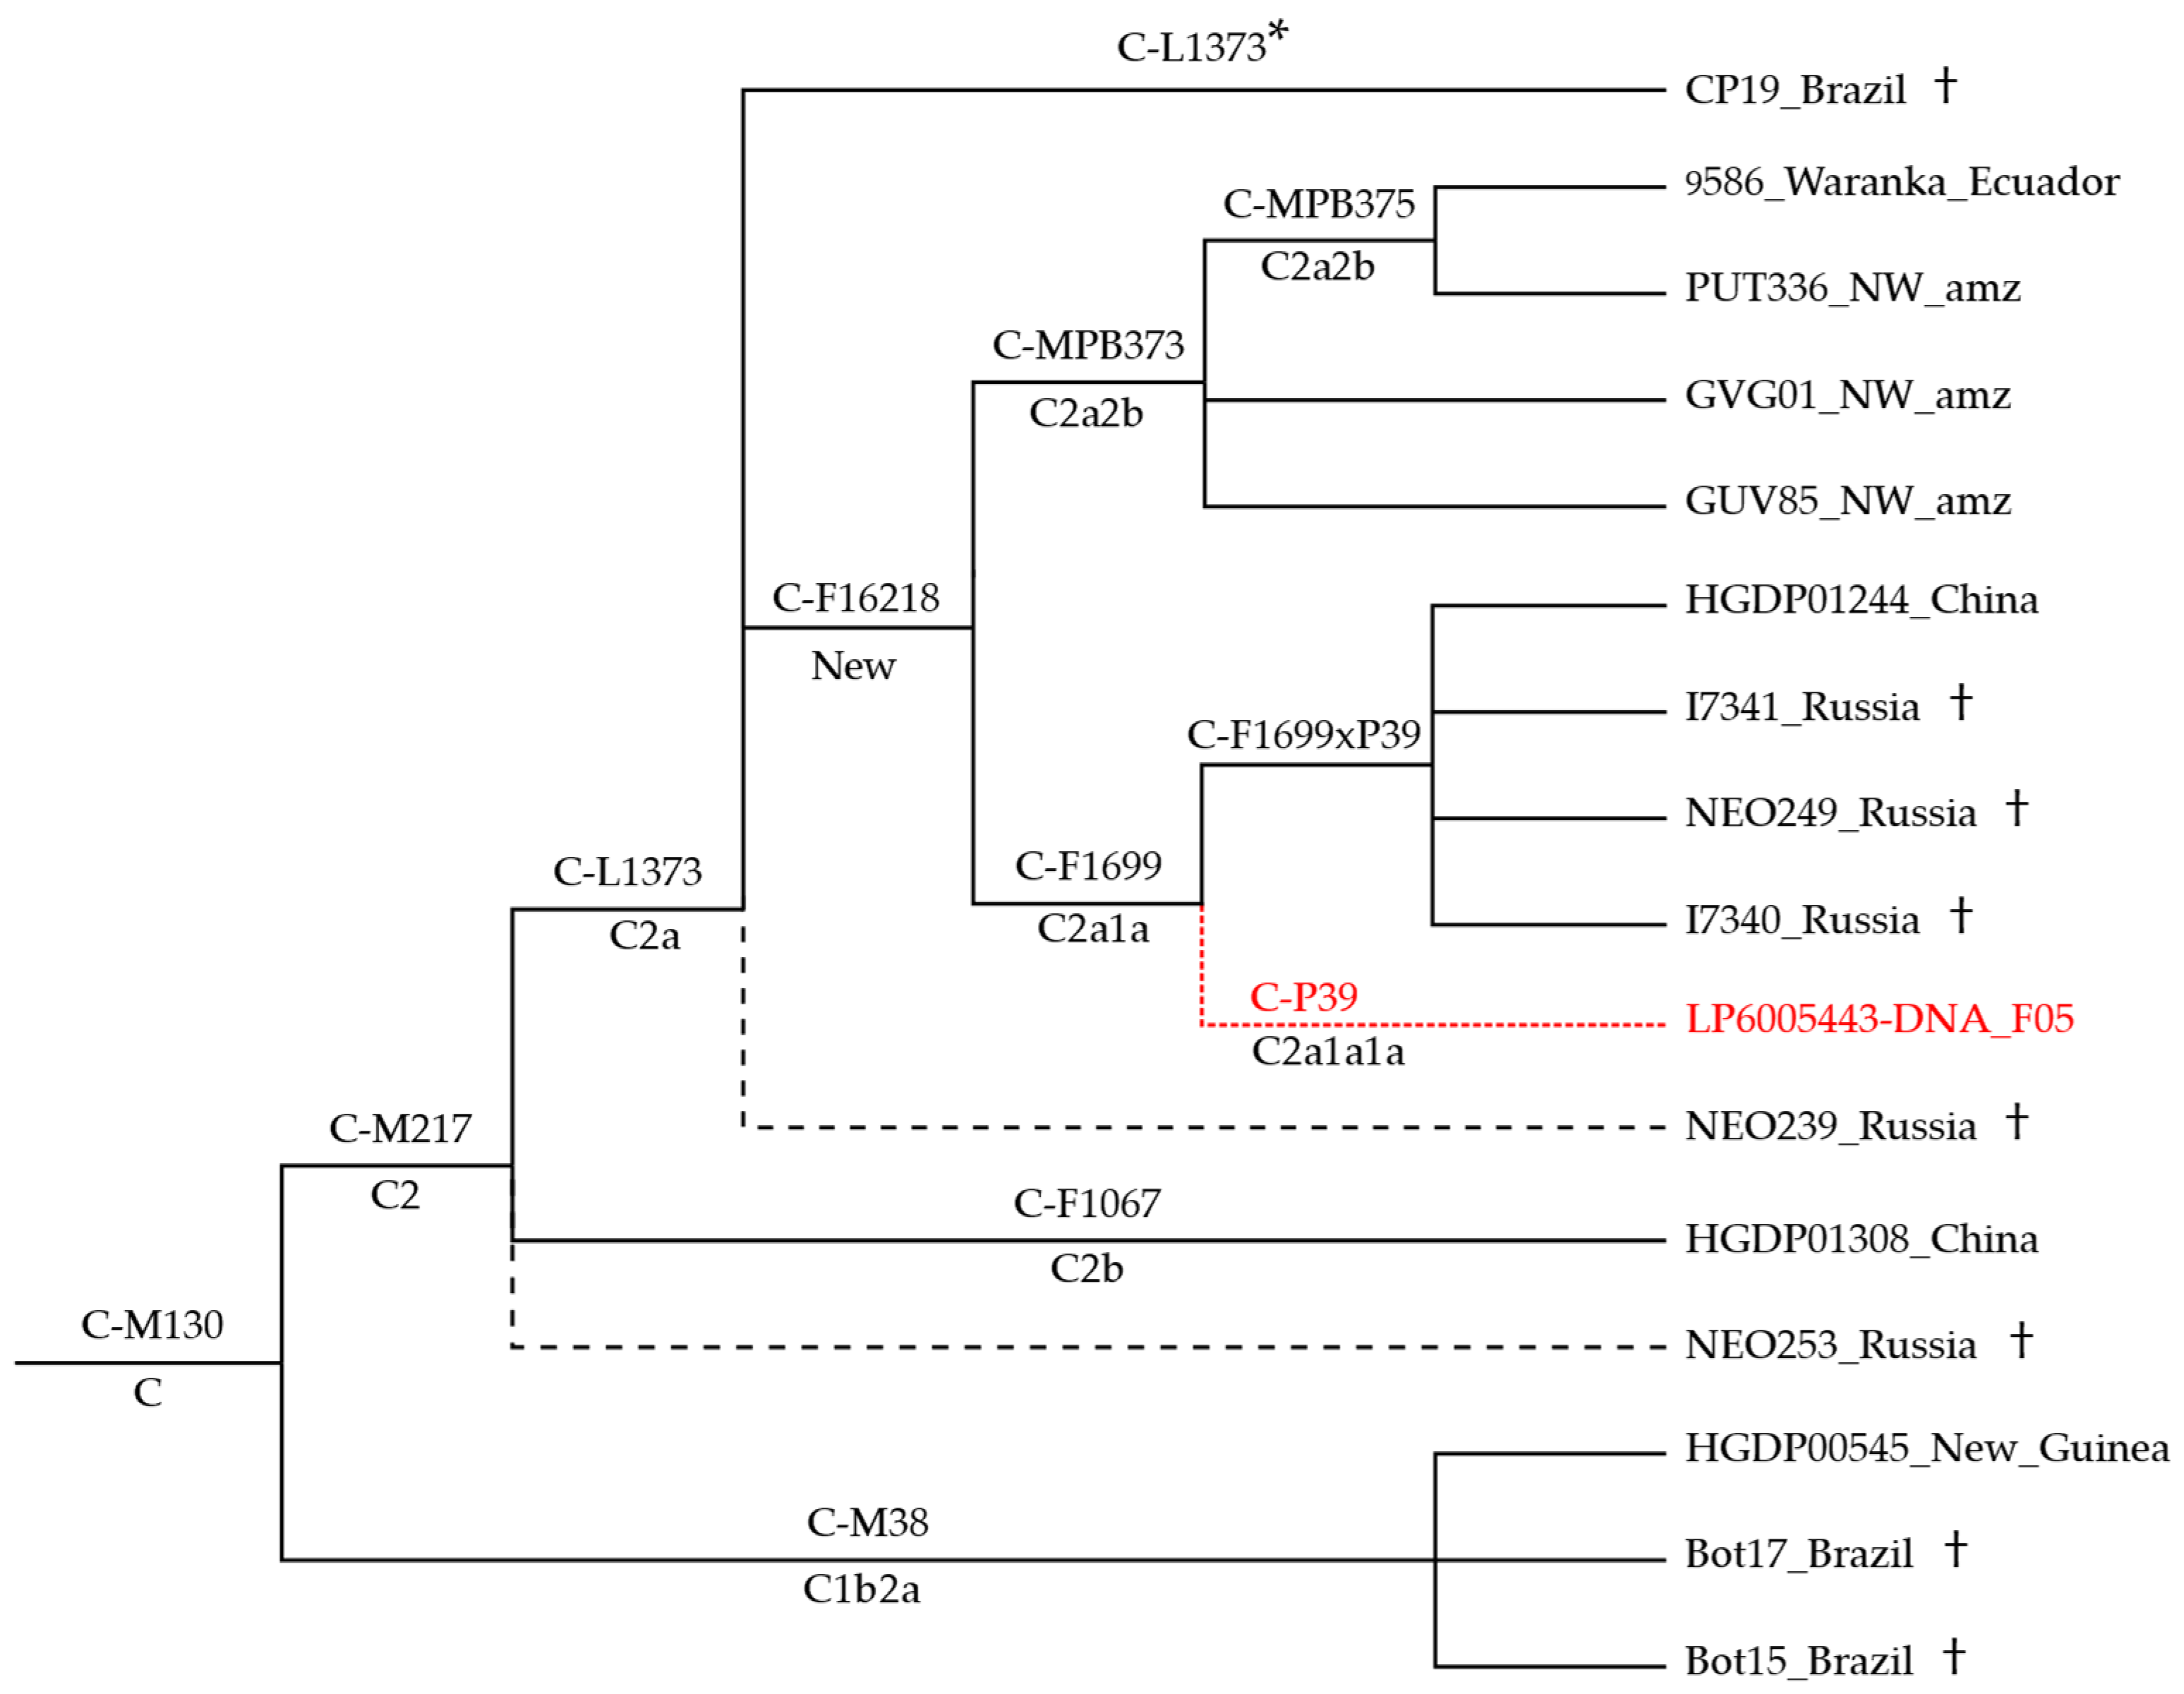
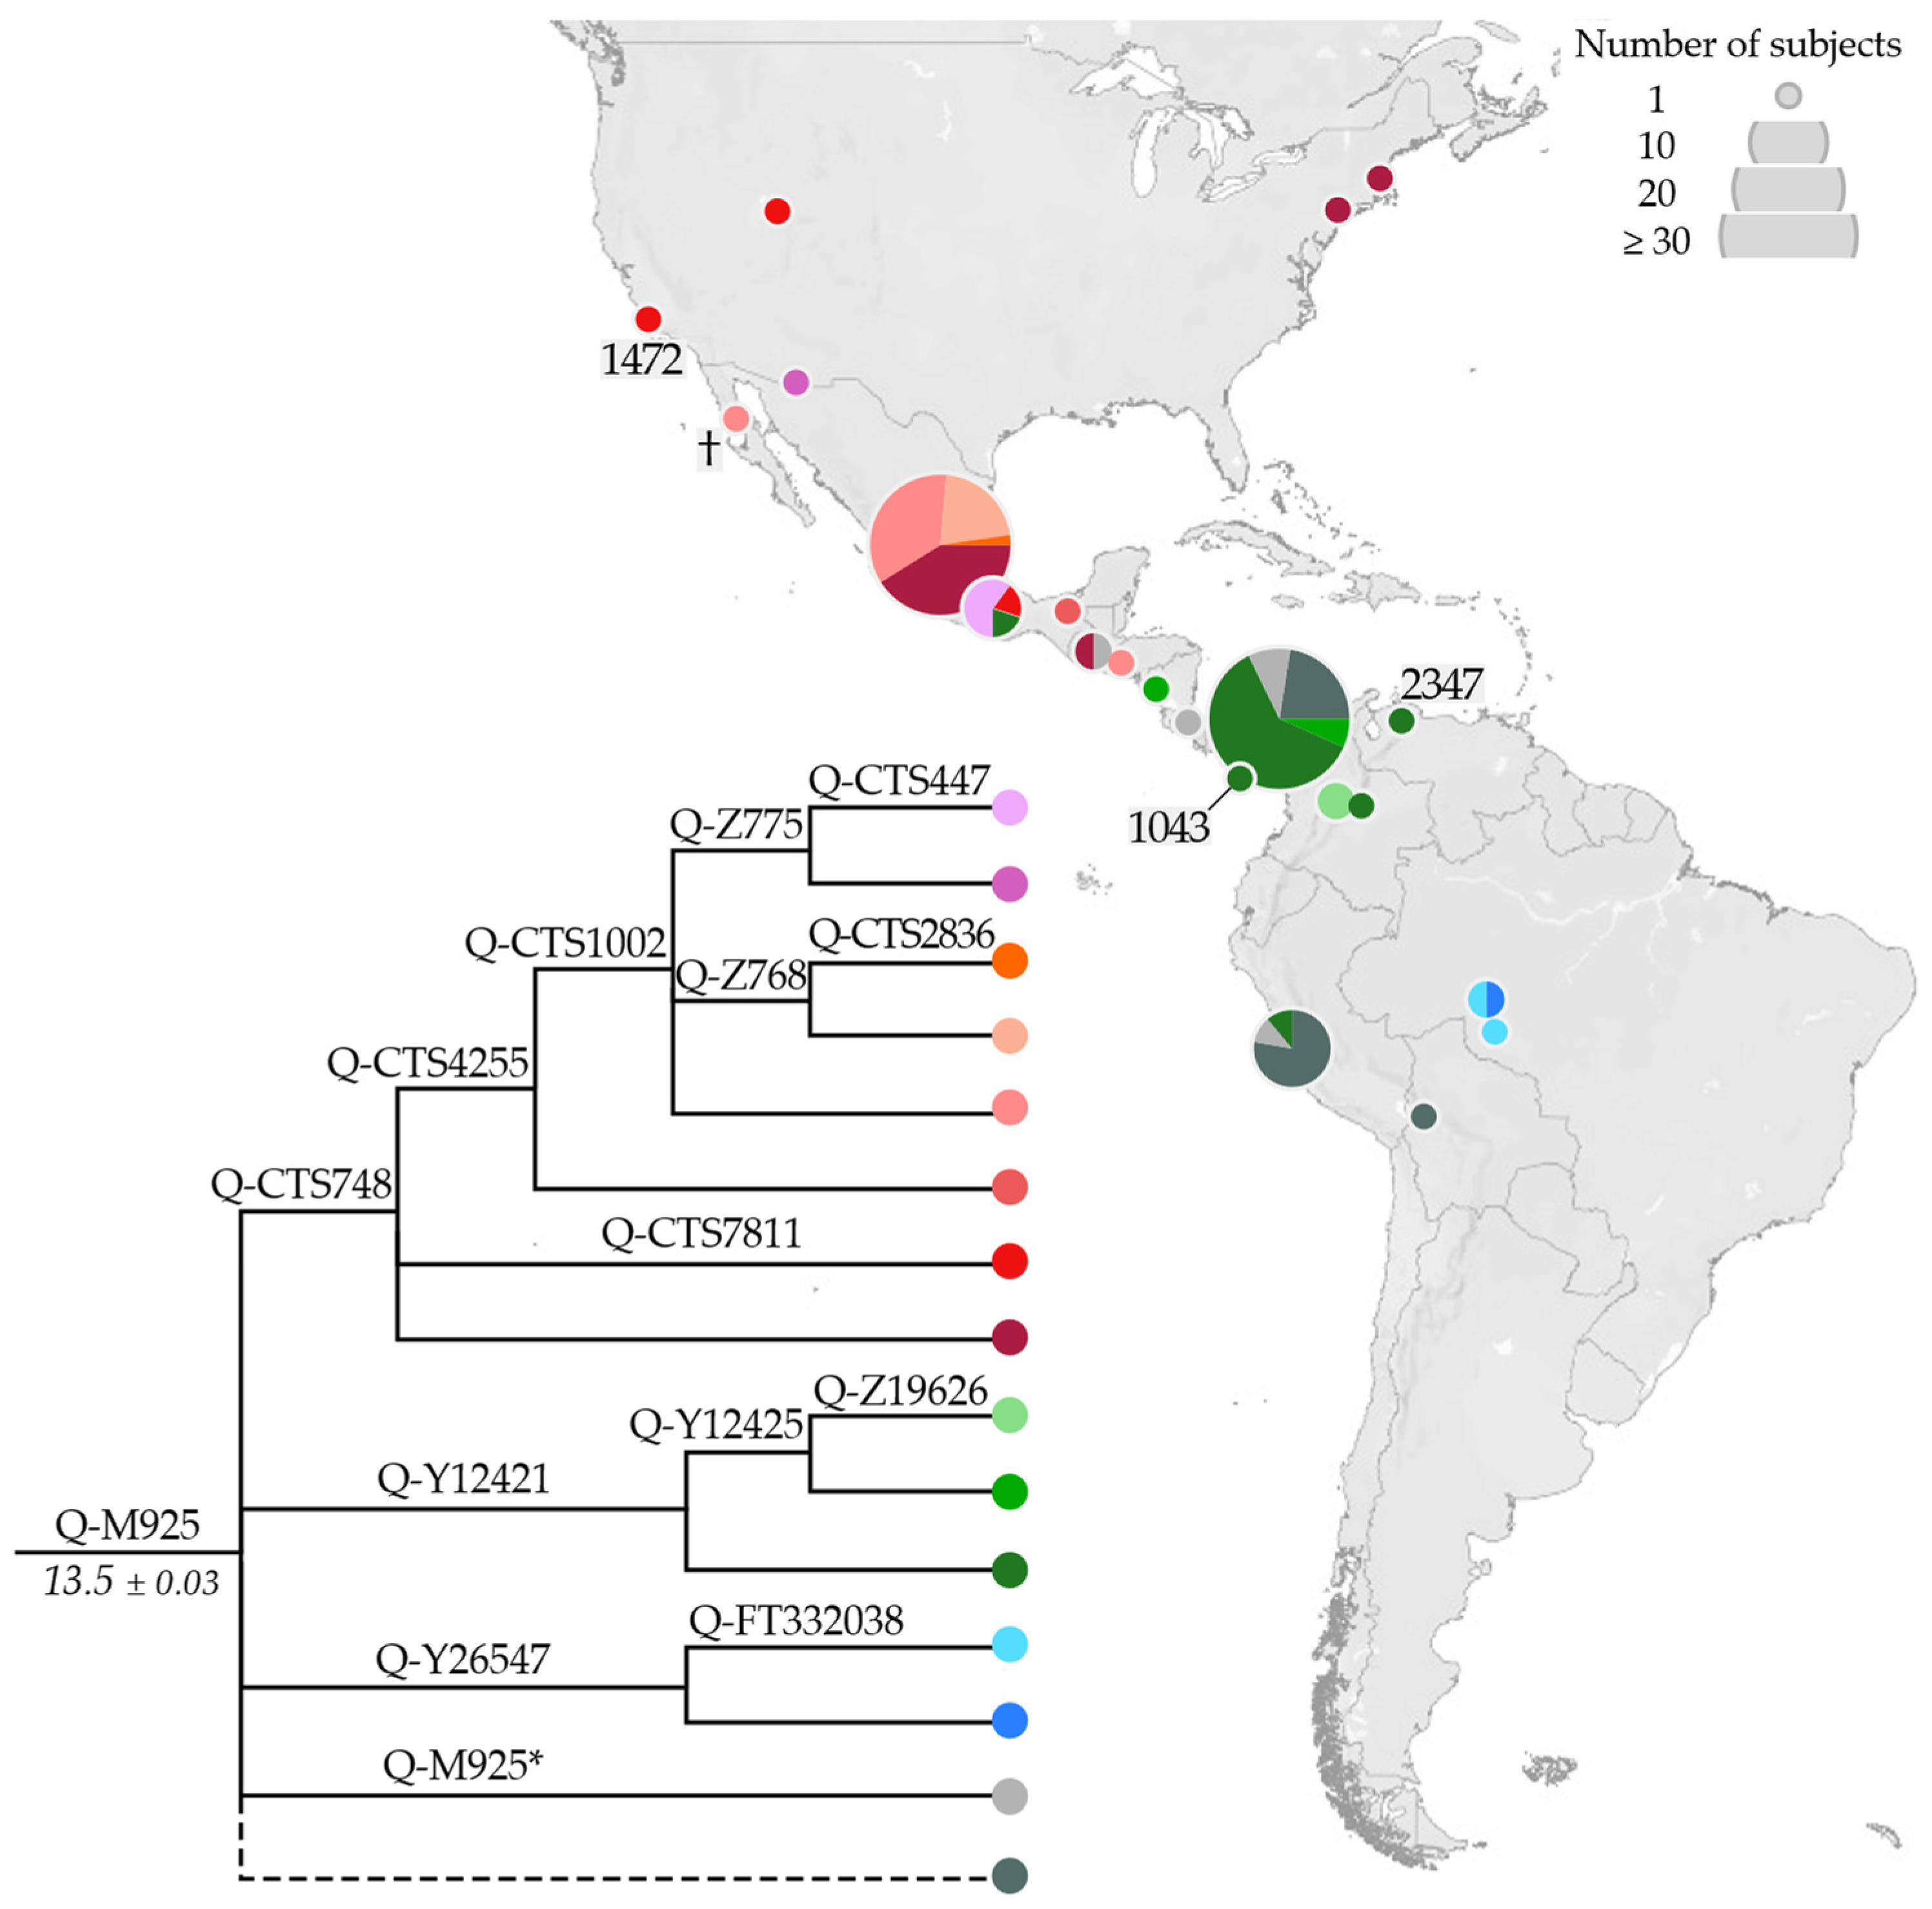
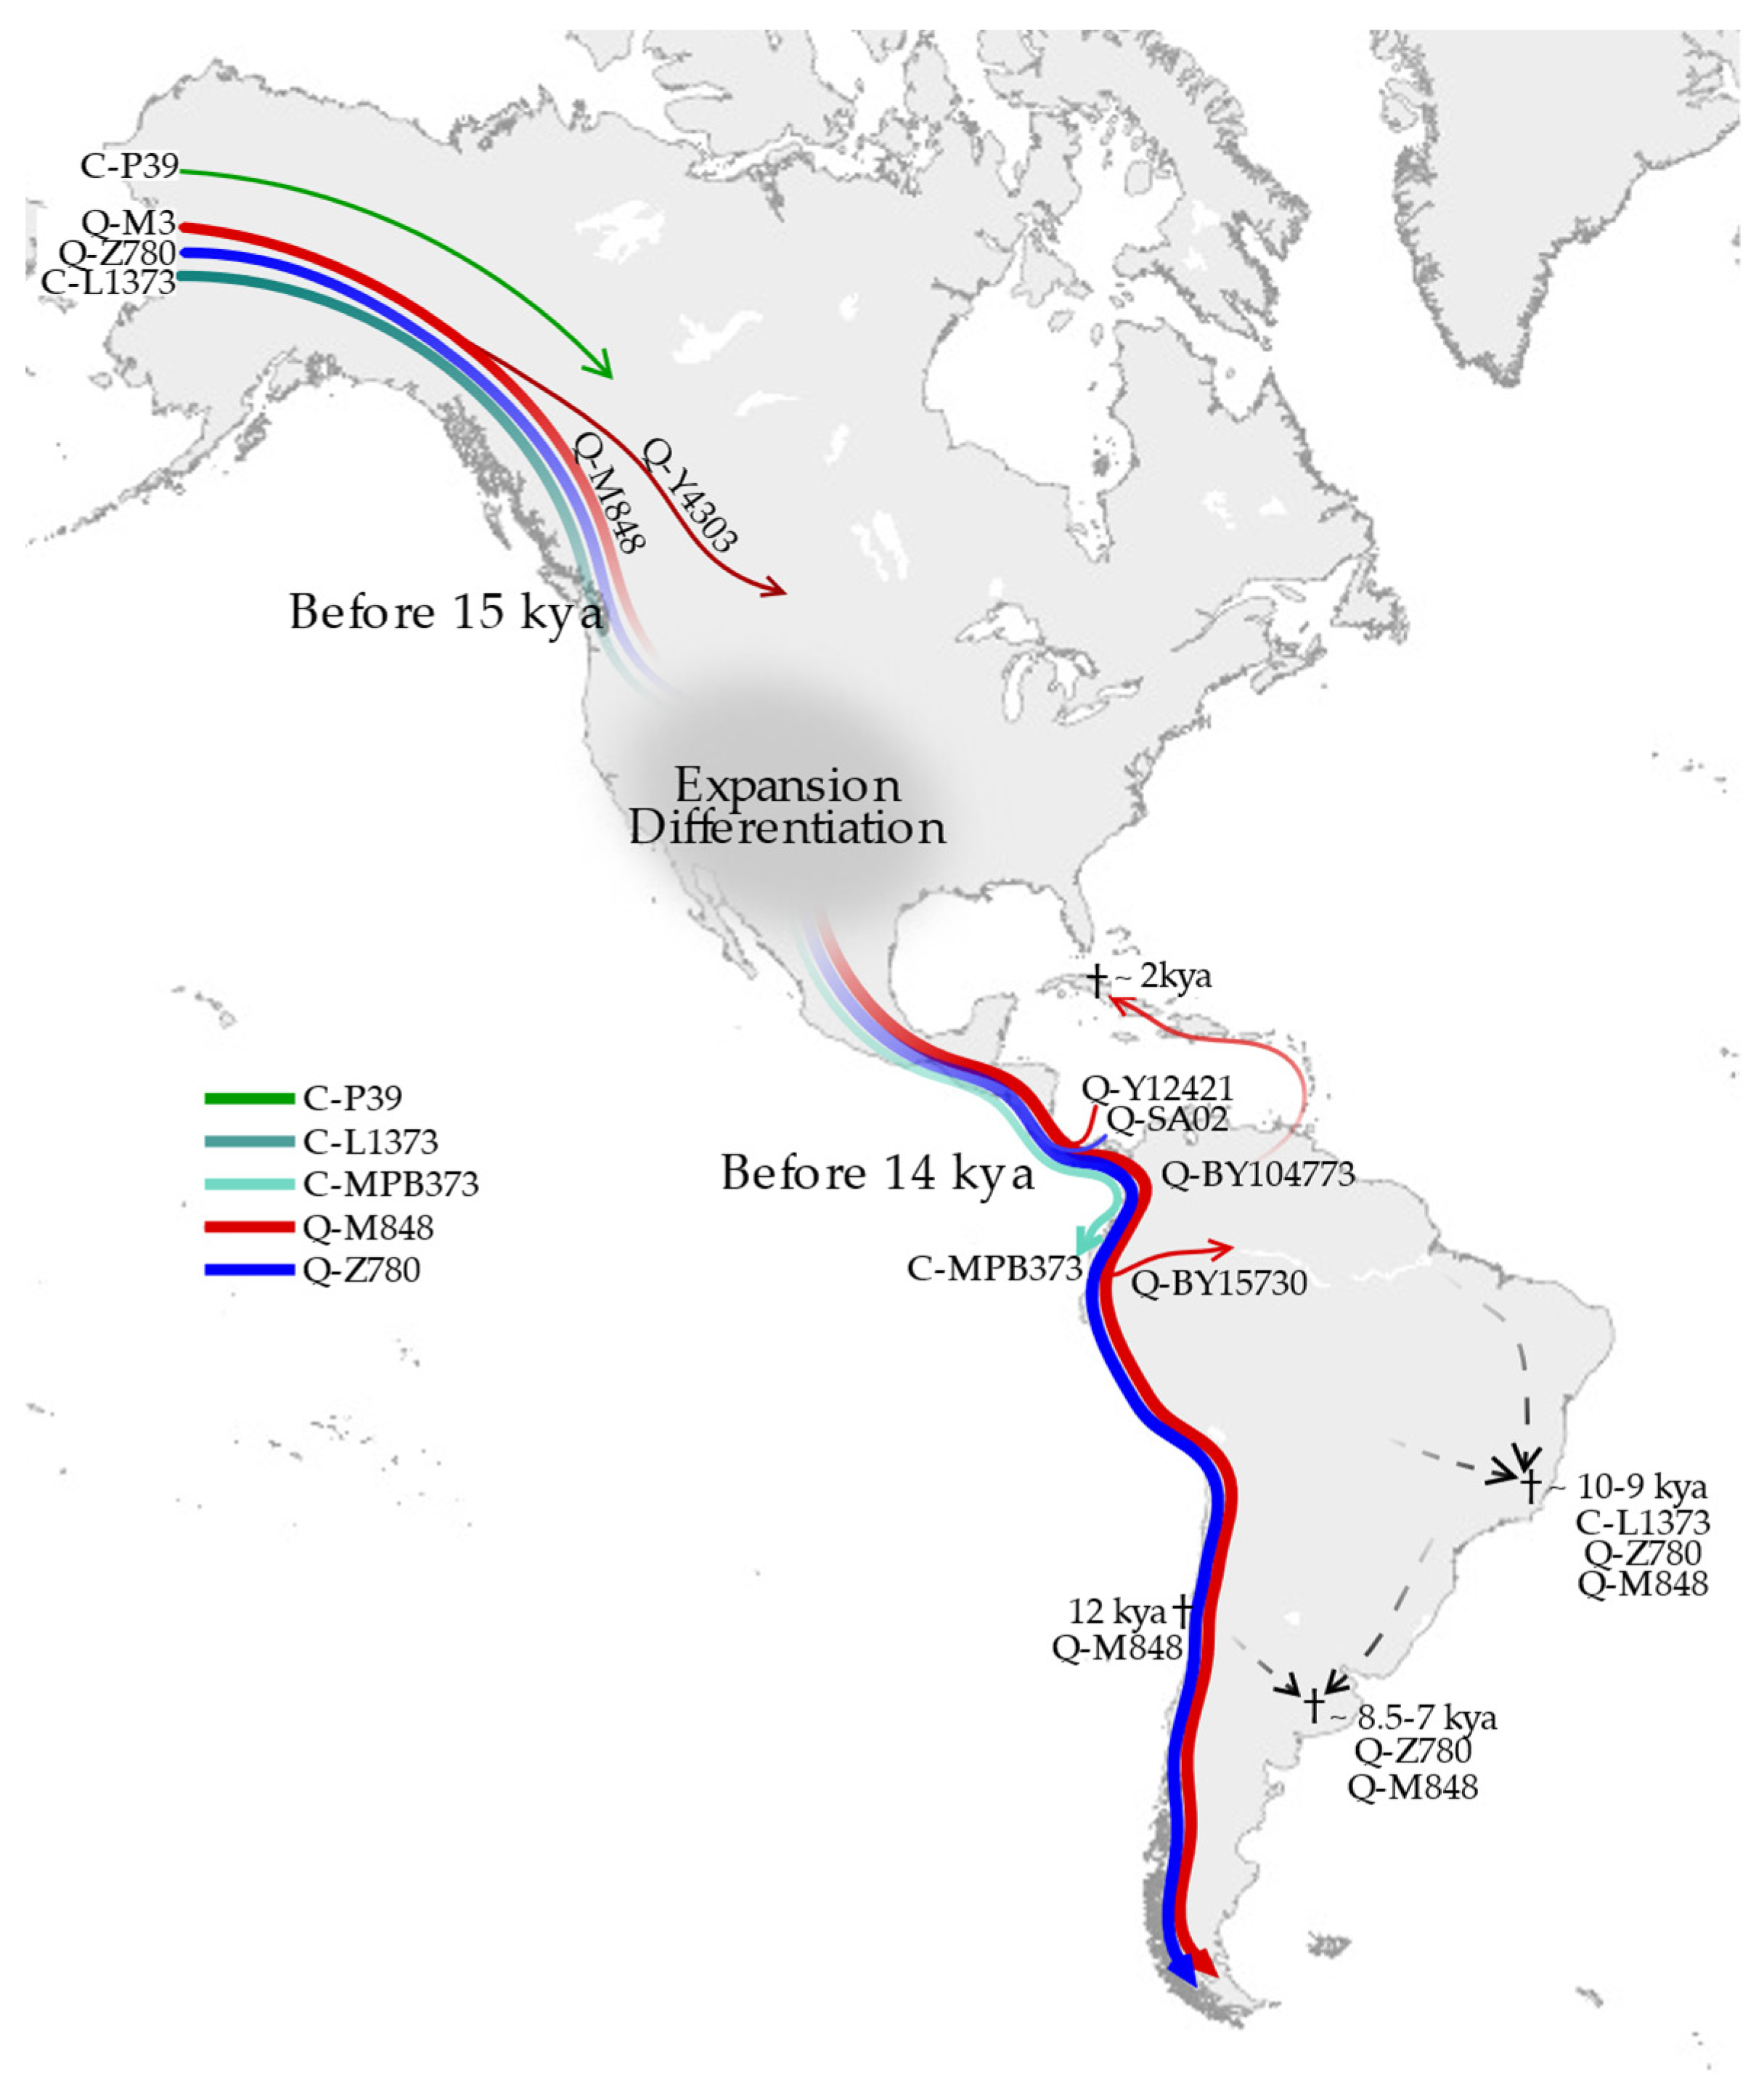
3.1. Phylogeny and Phylogeography of Haplogroup C Y Chromosomes
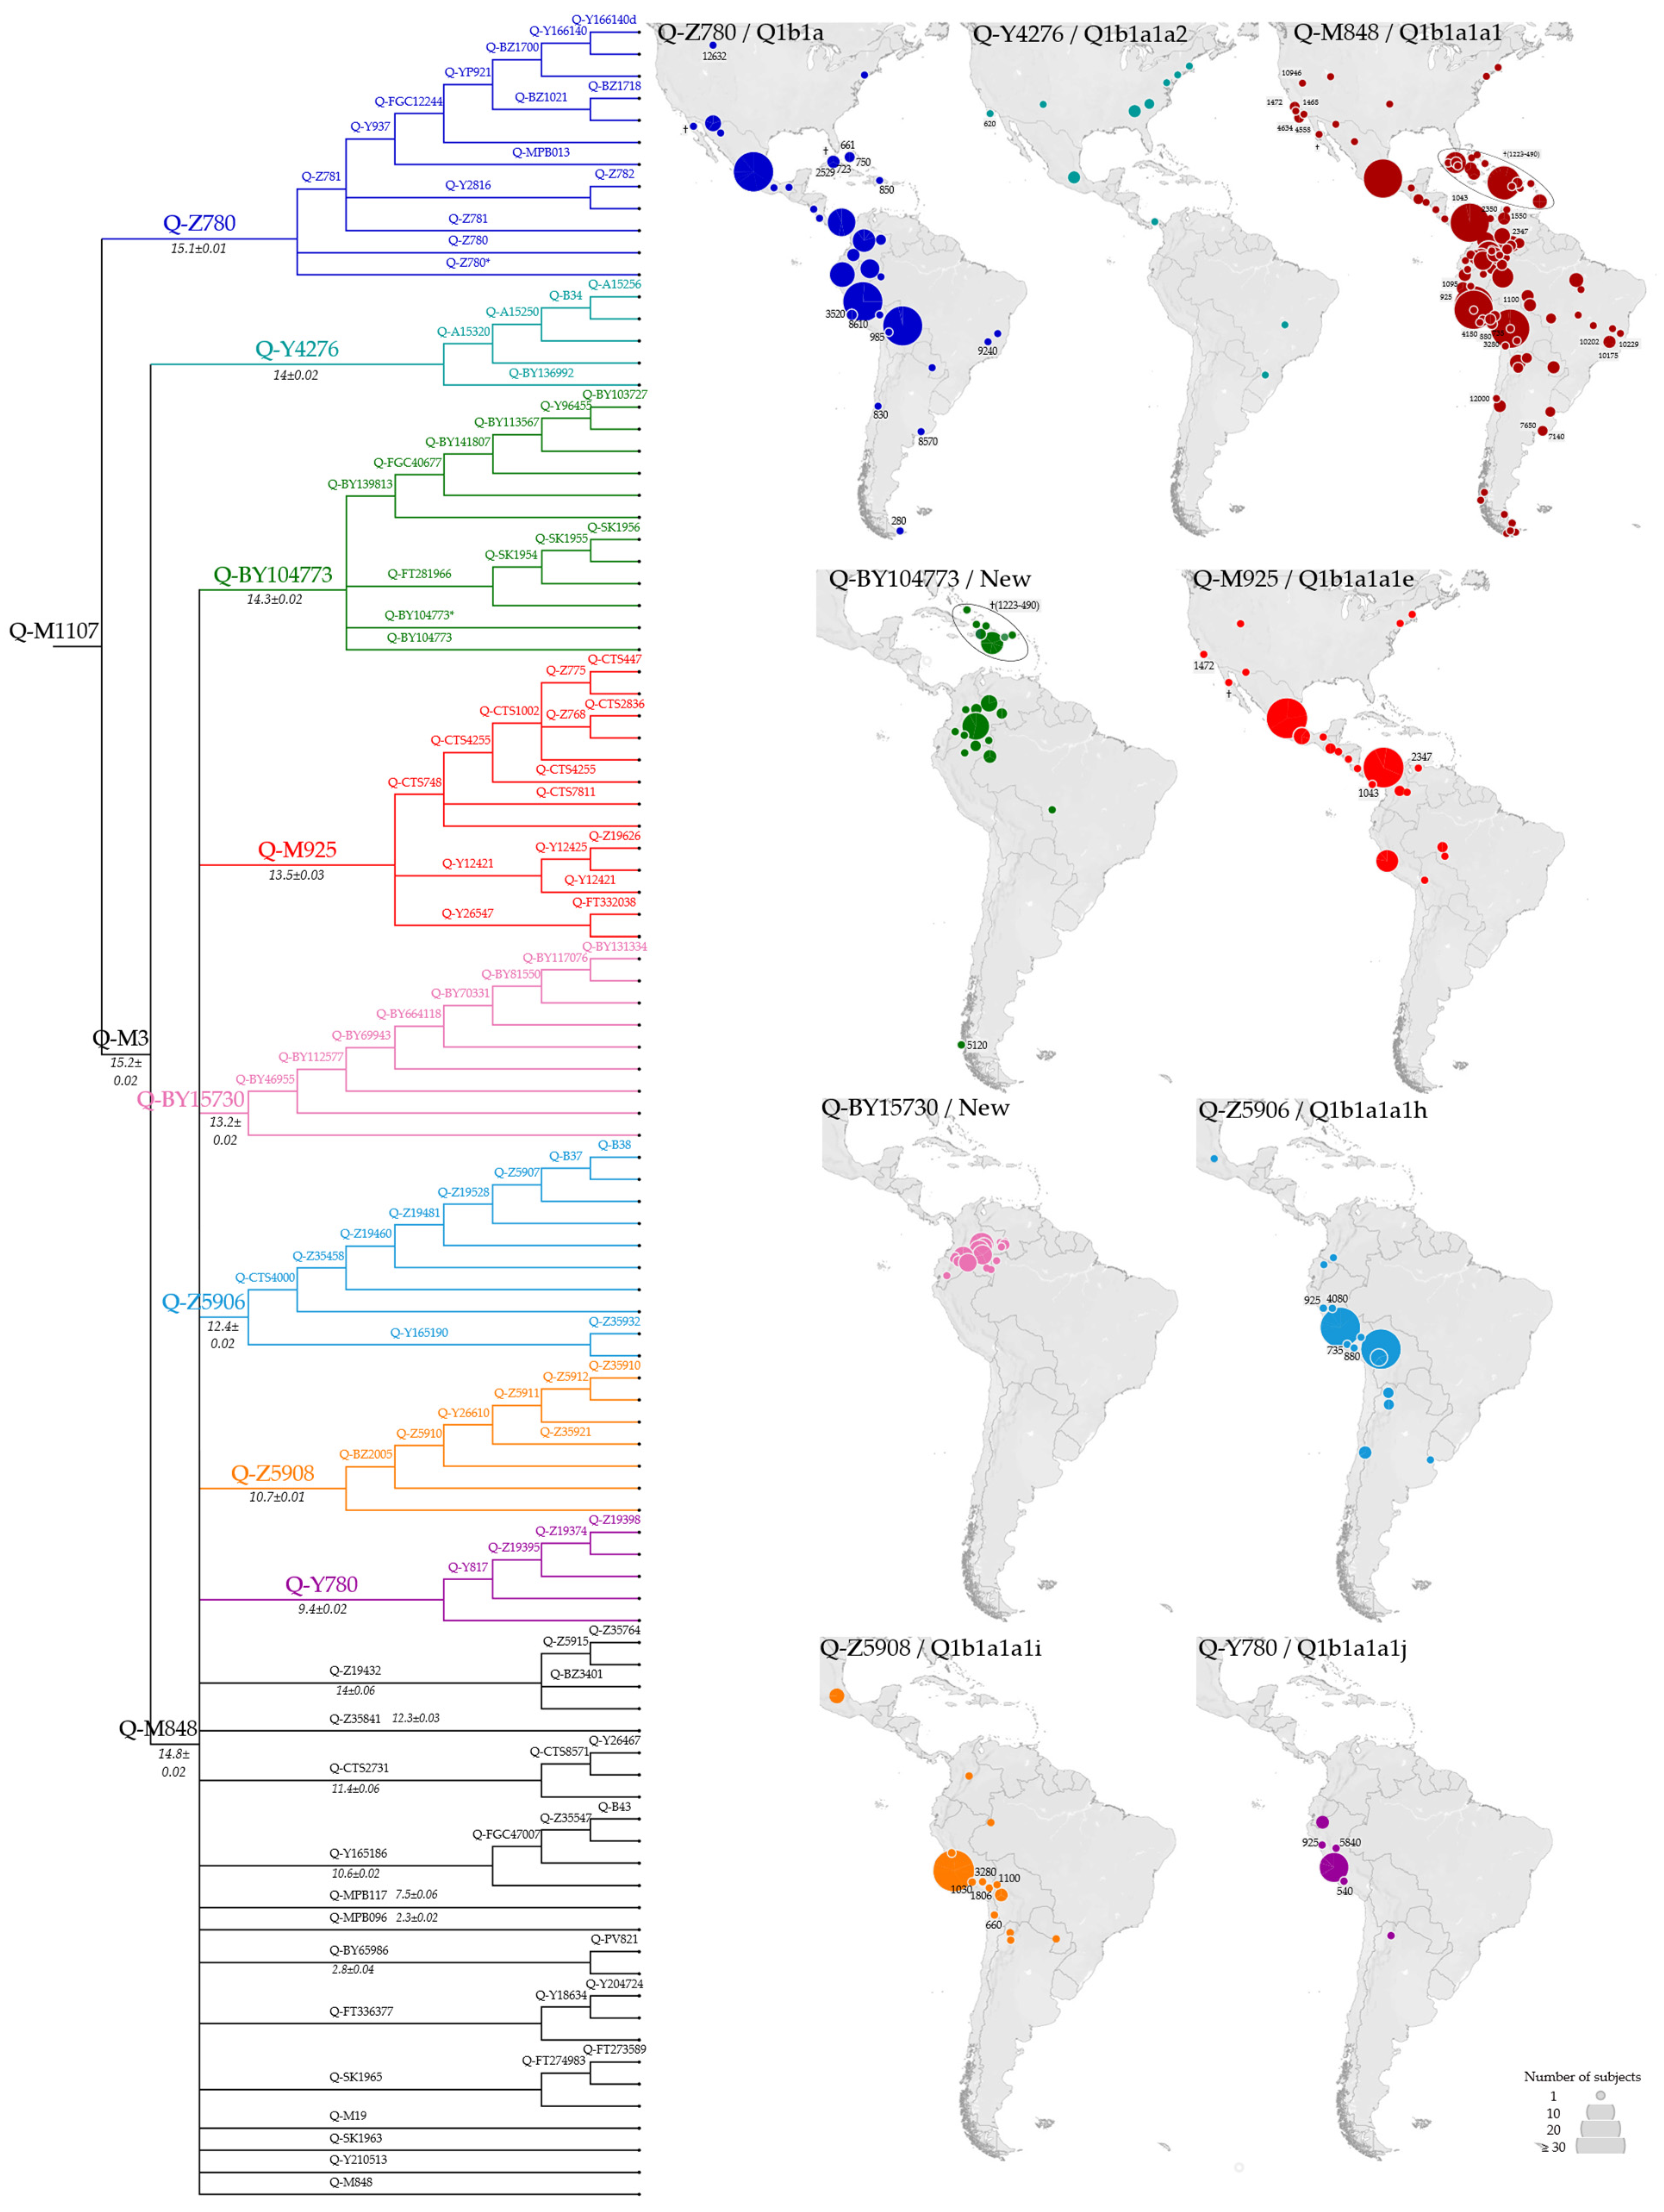
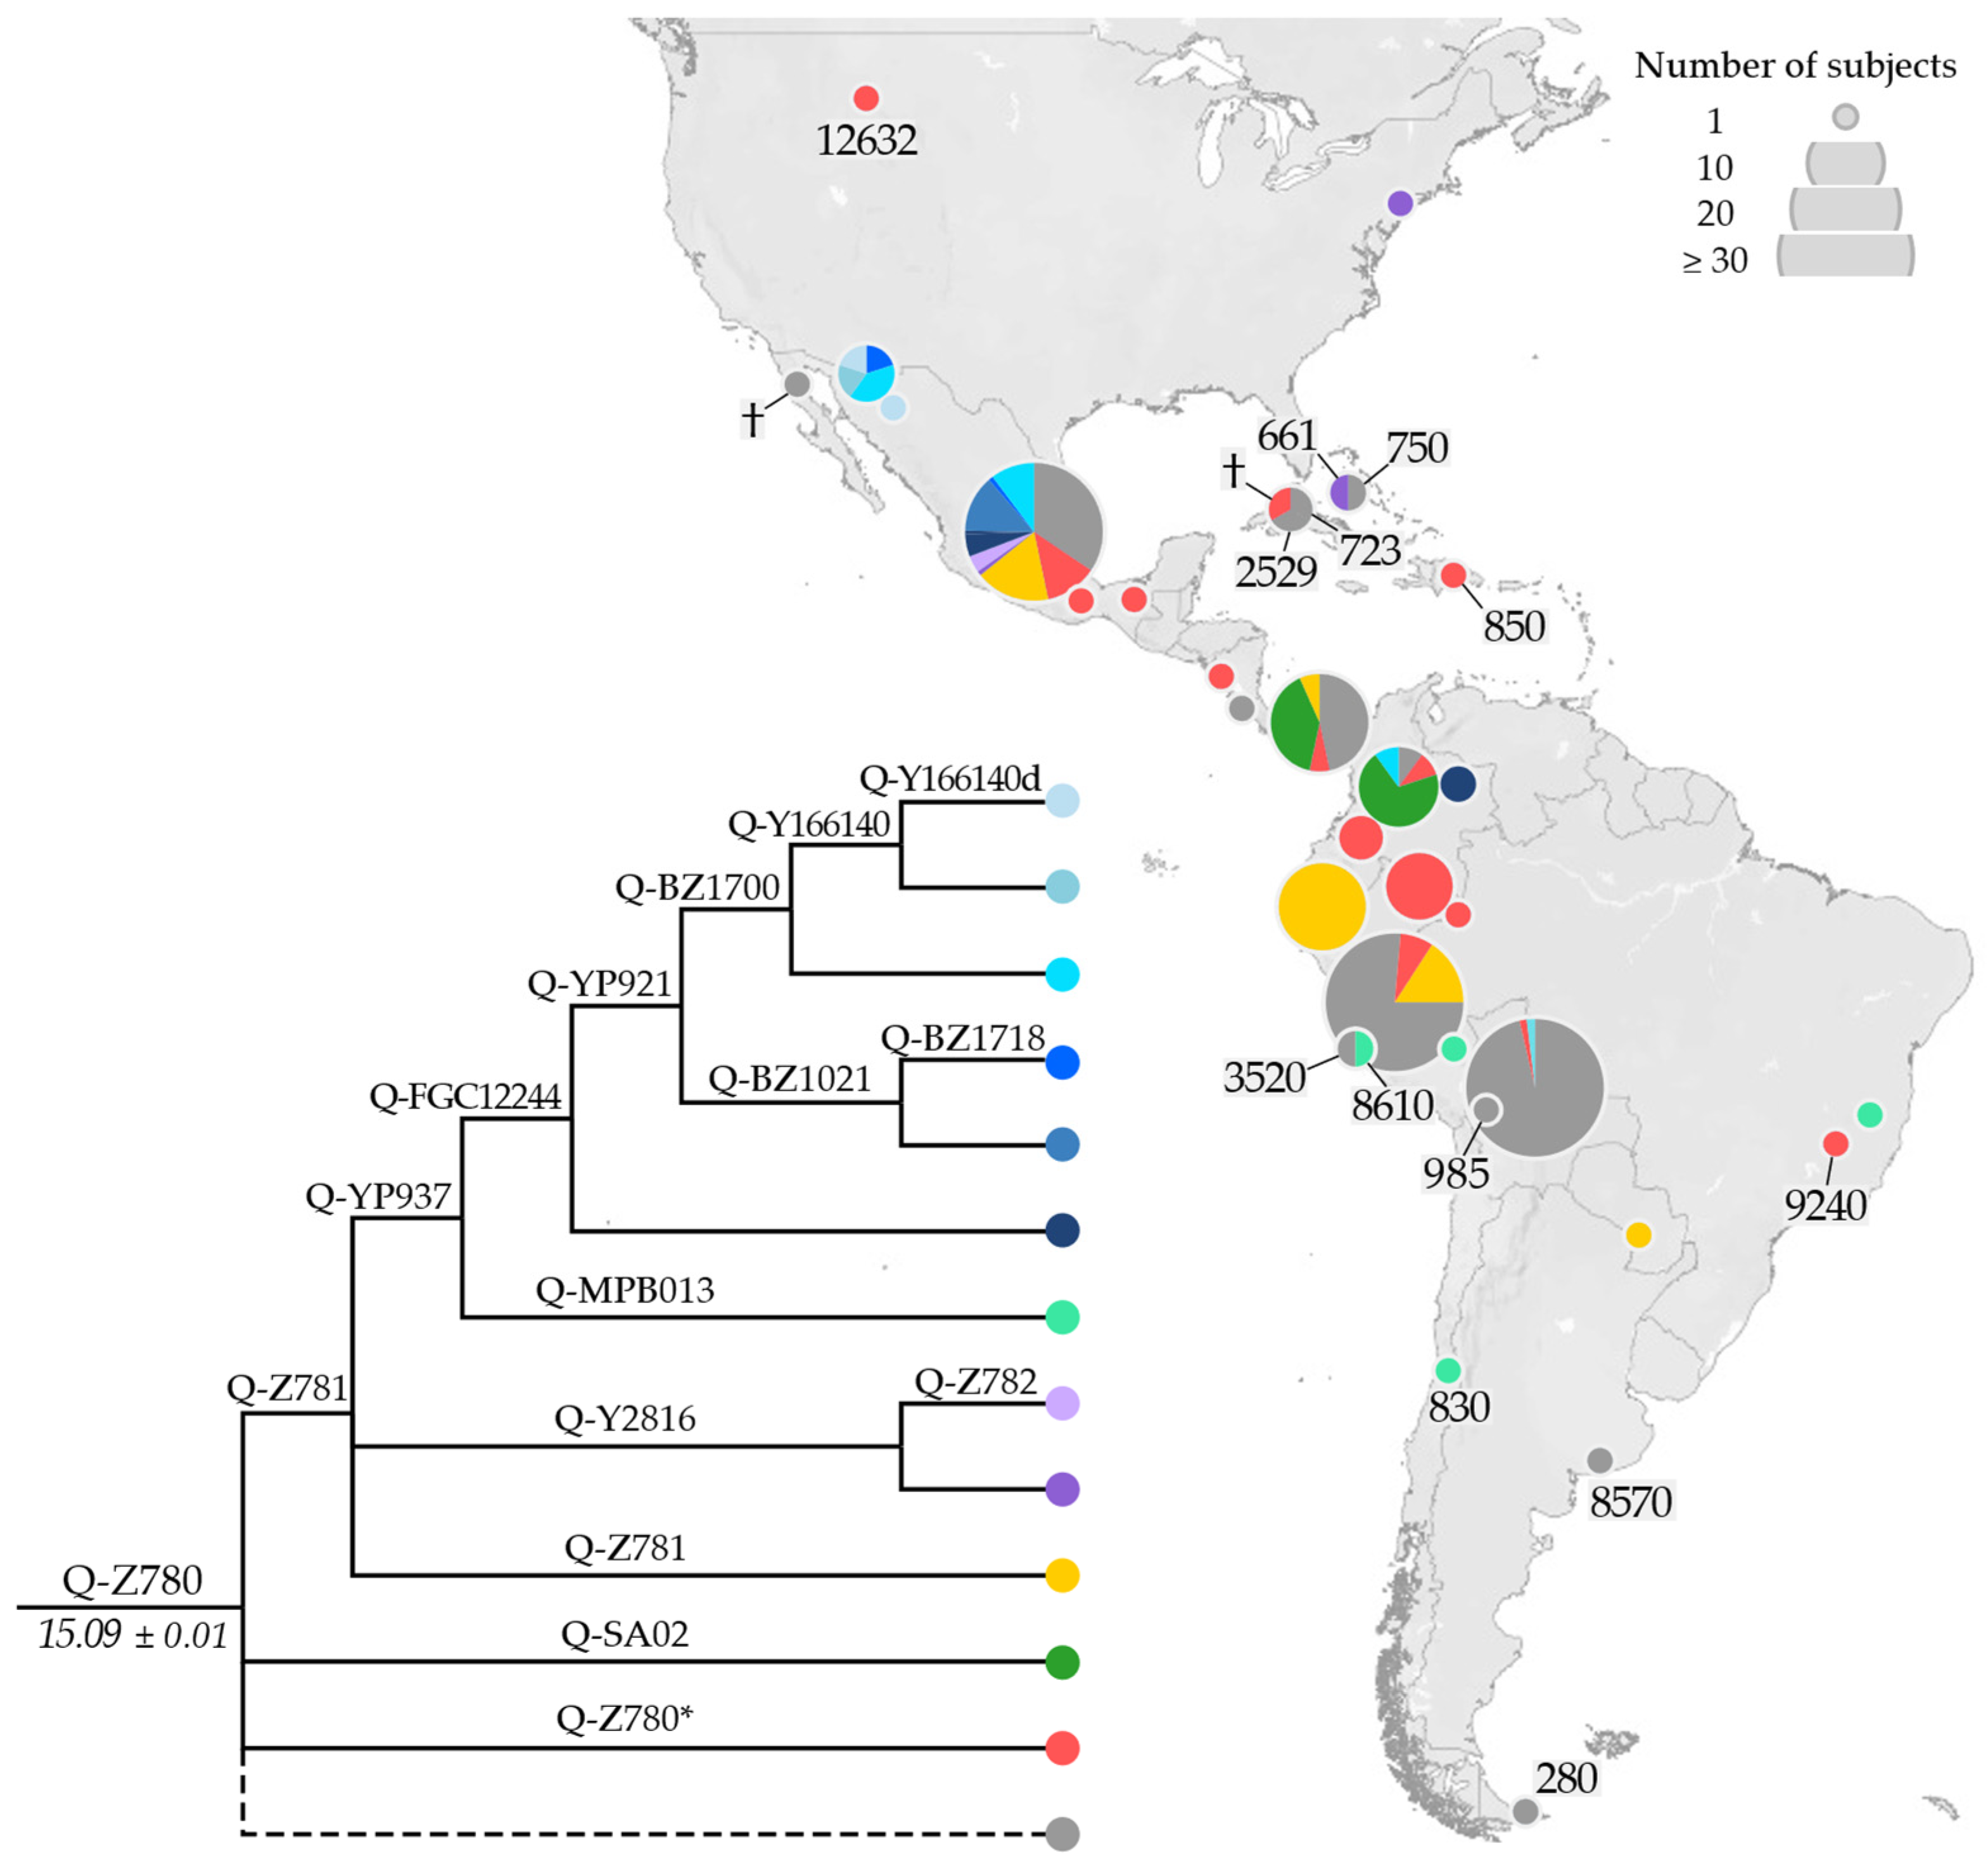
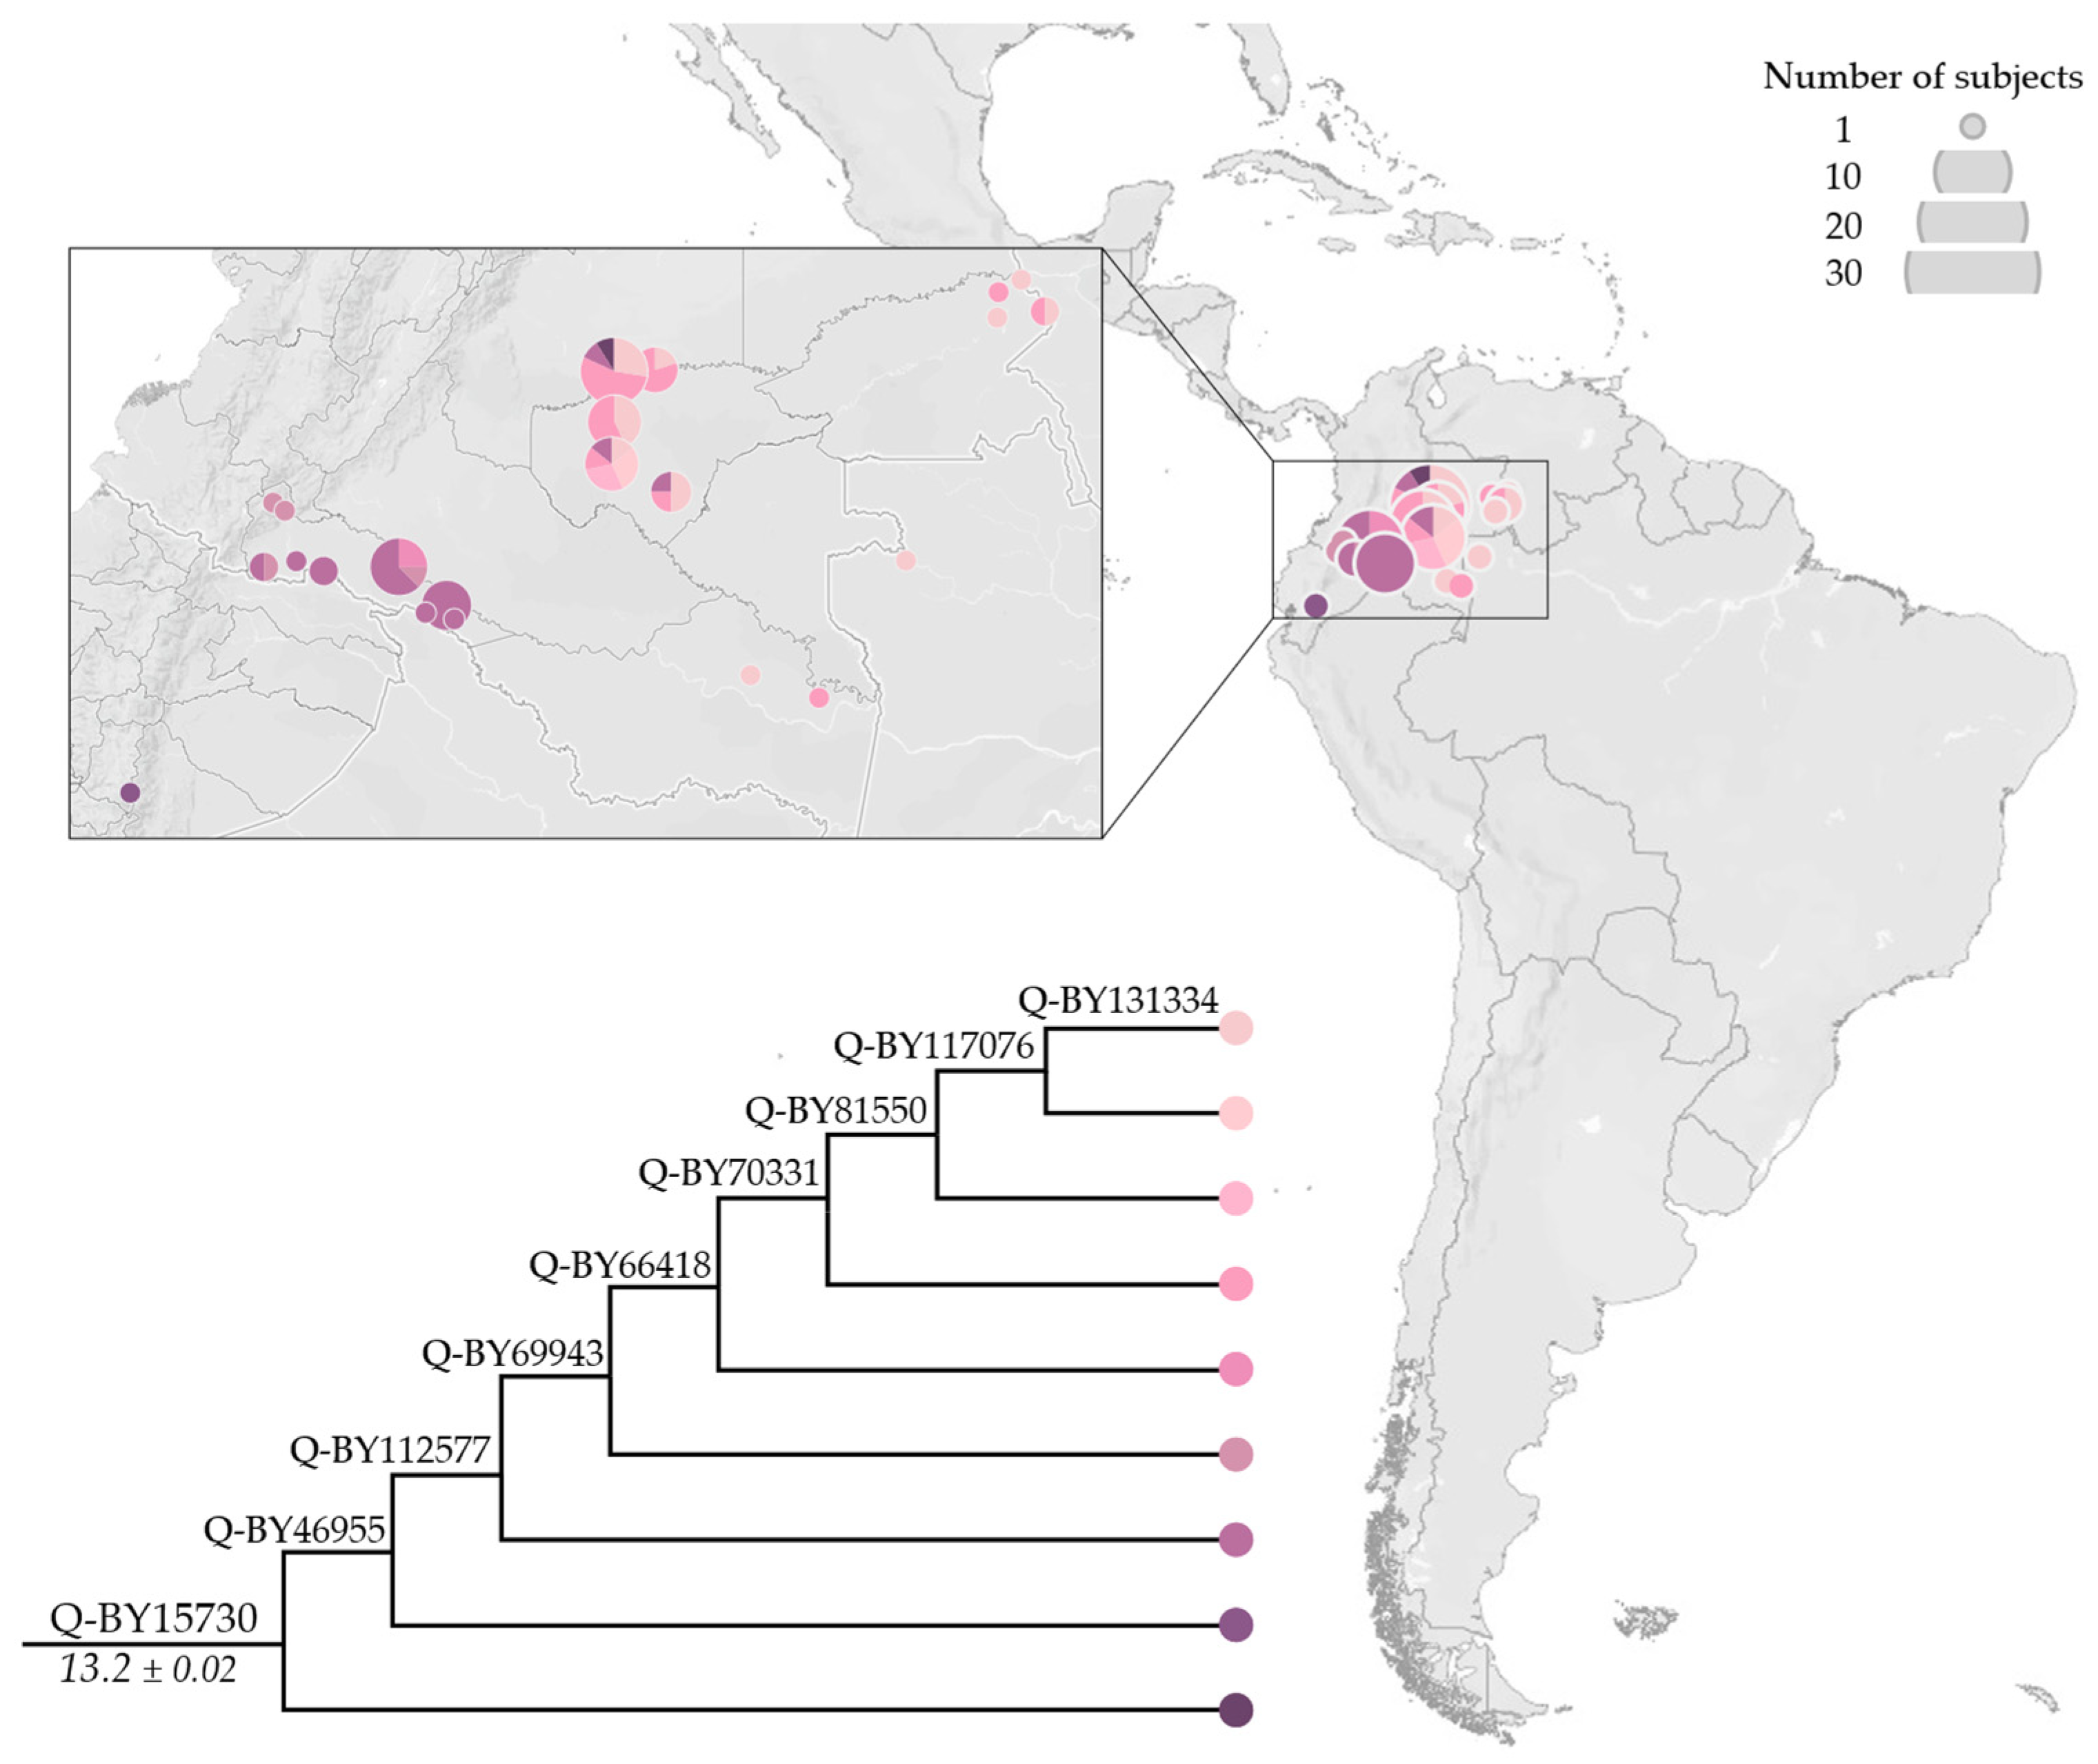
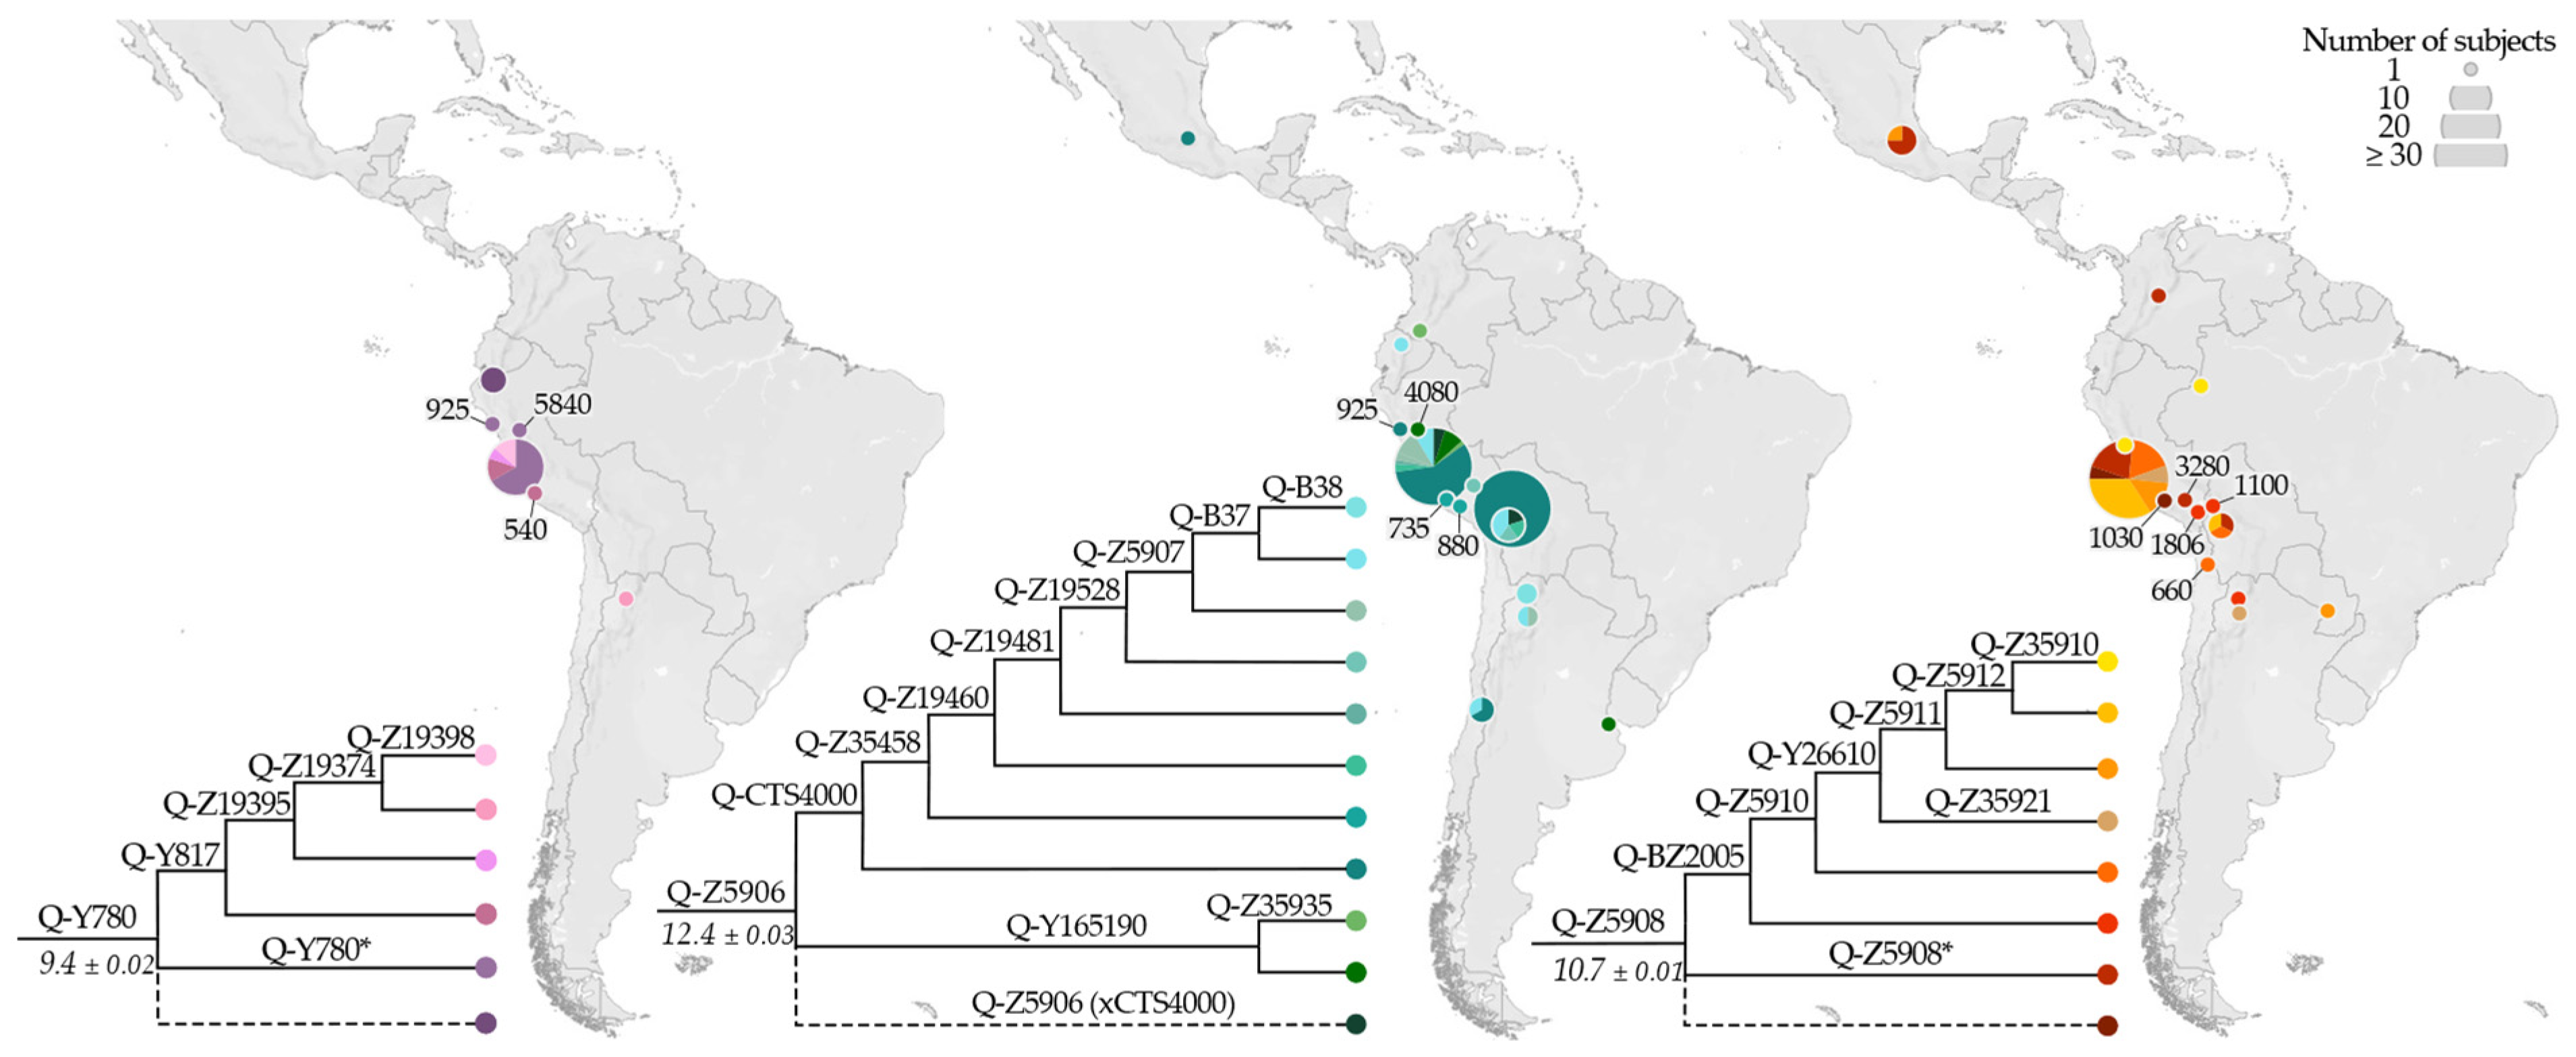
3.2. Phylogeny and Phylogeography of Haplogroup Q Y Chromosomes
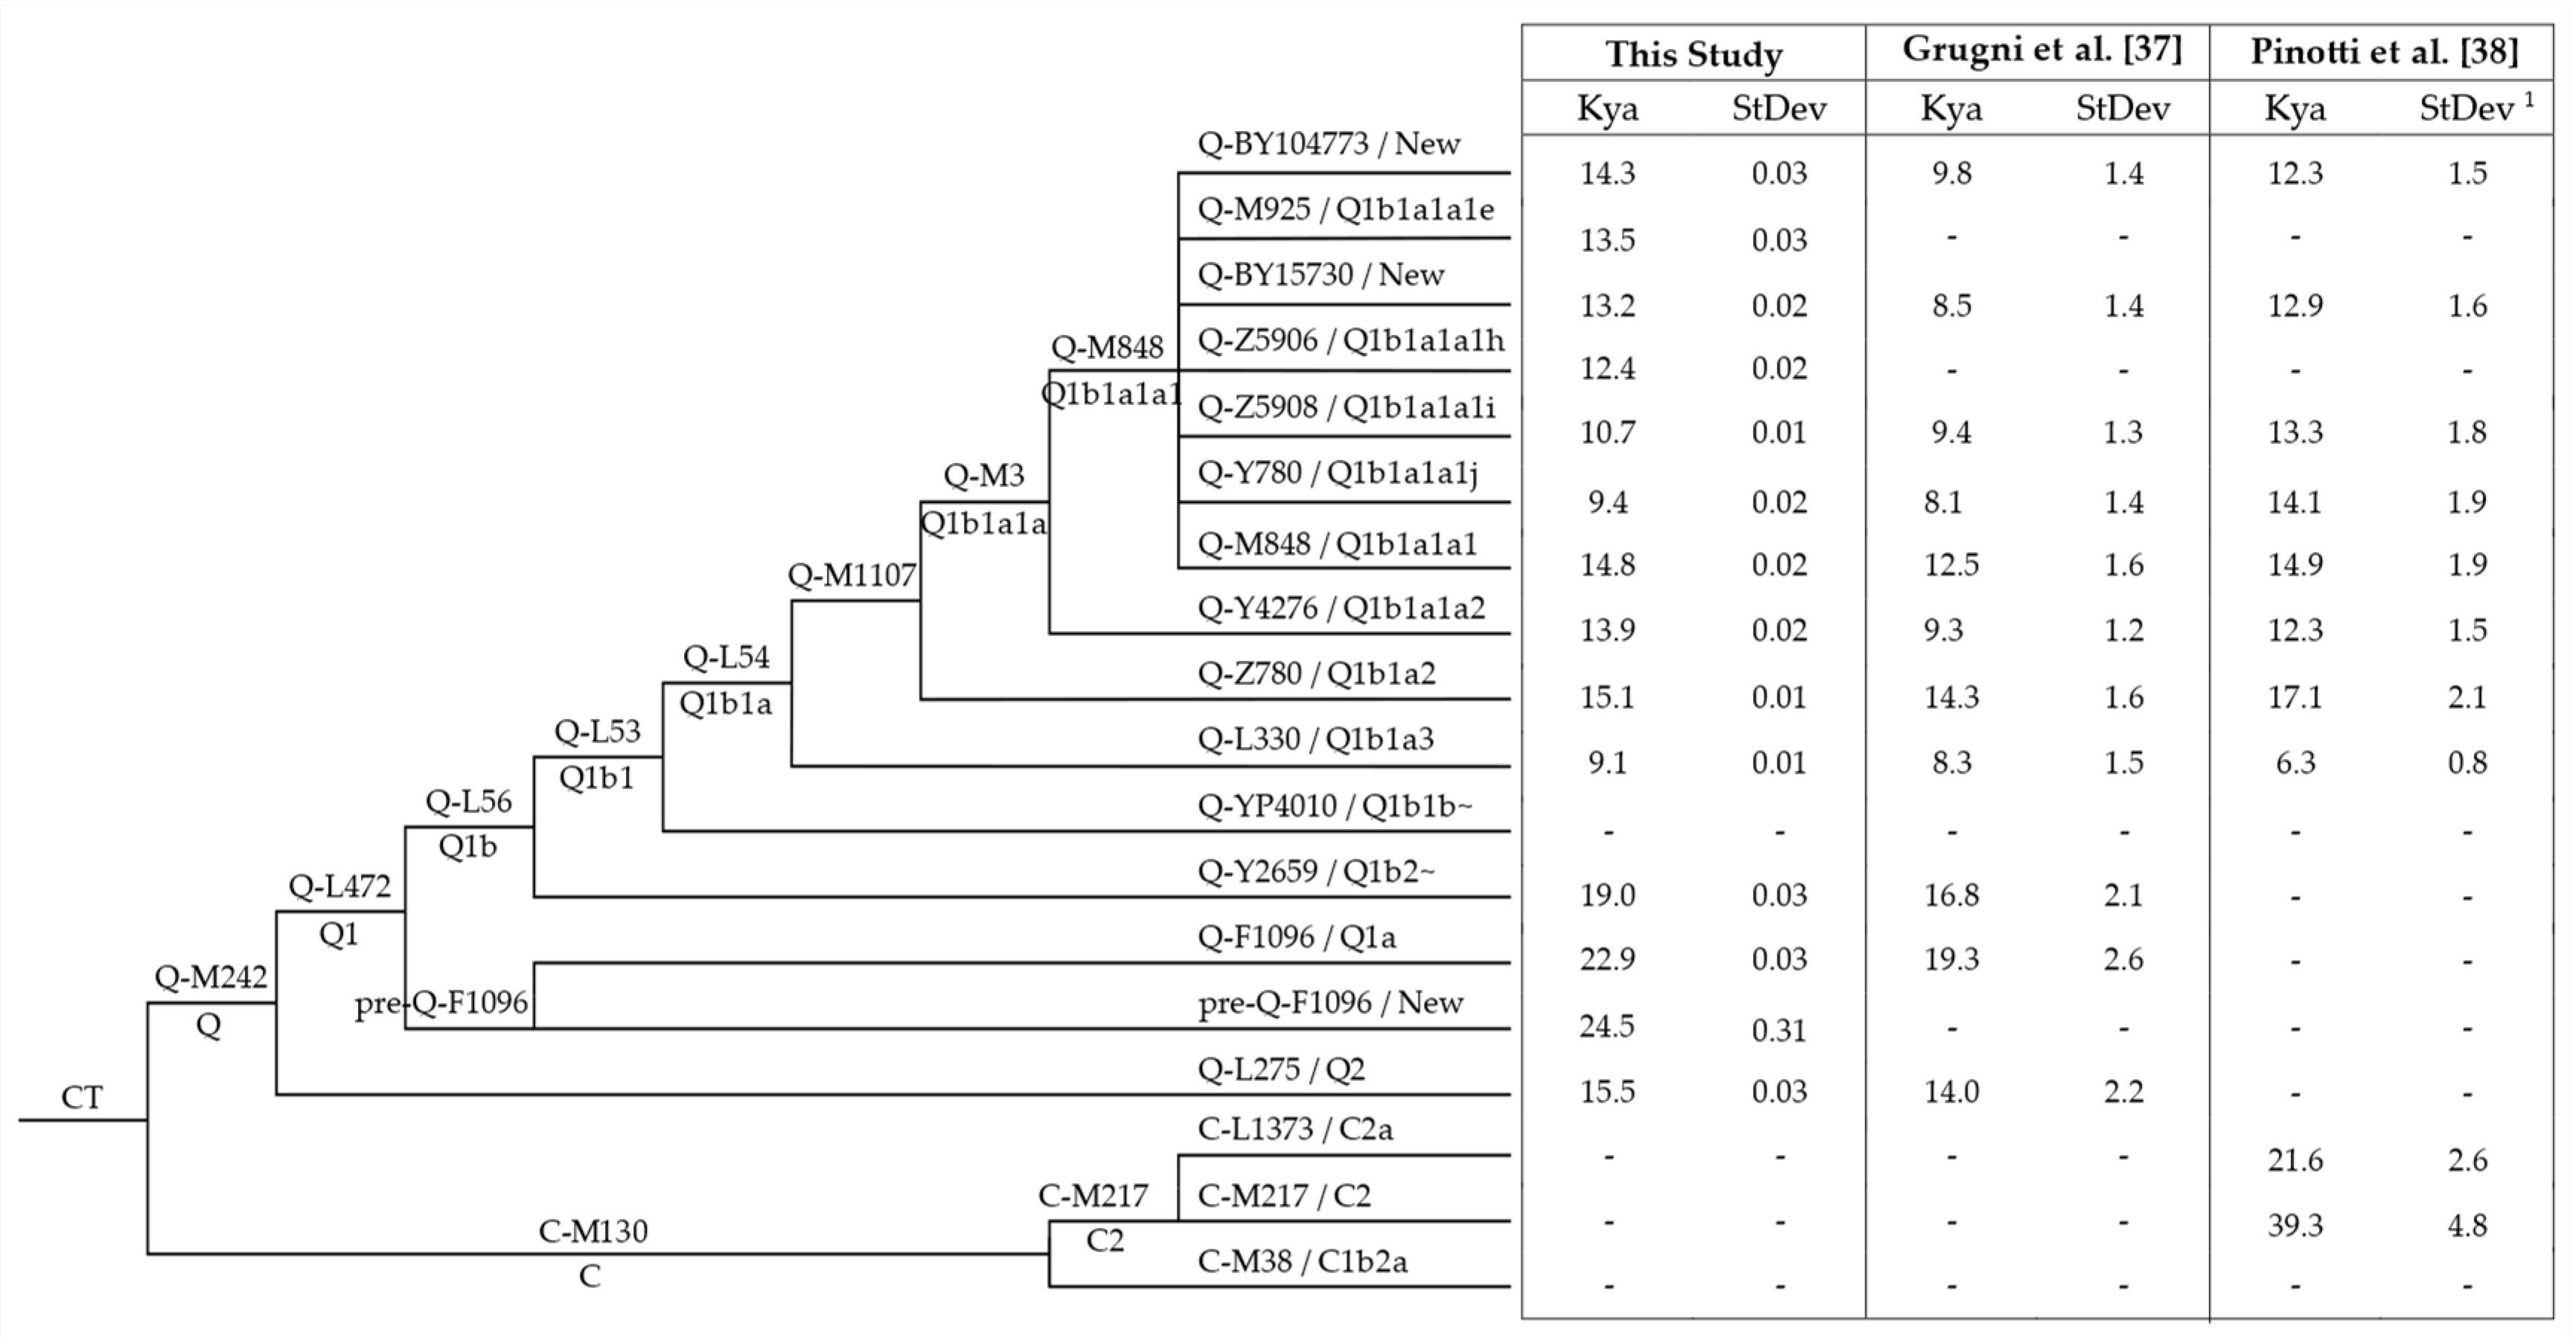
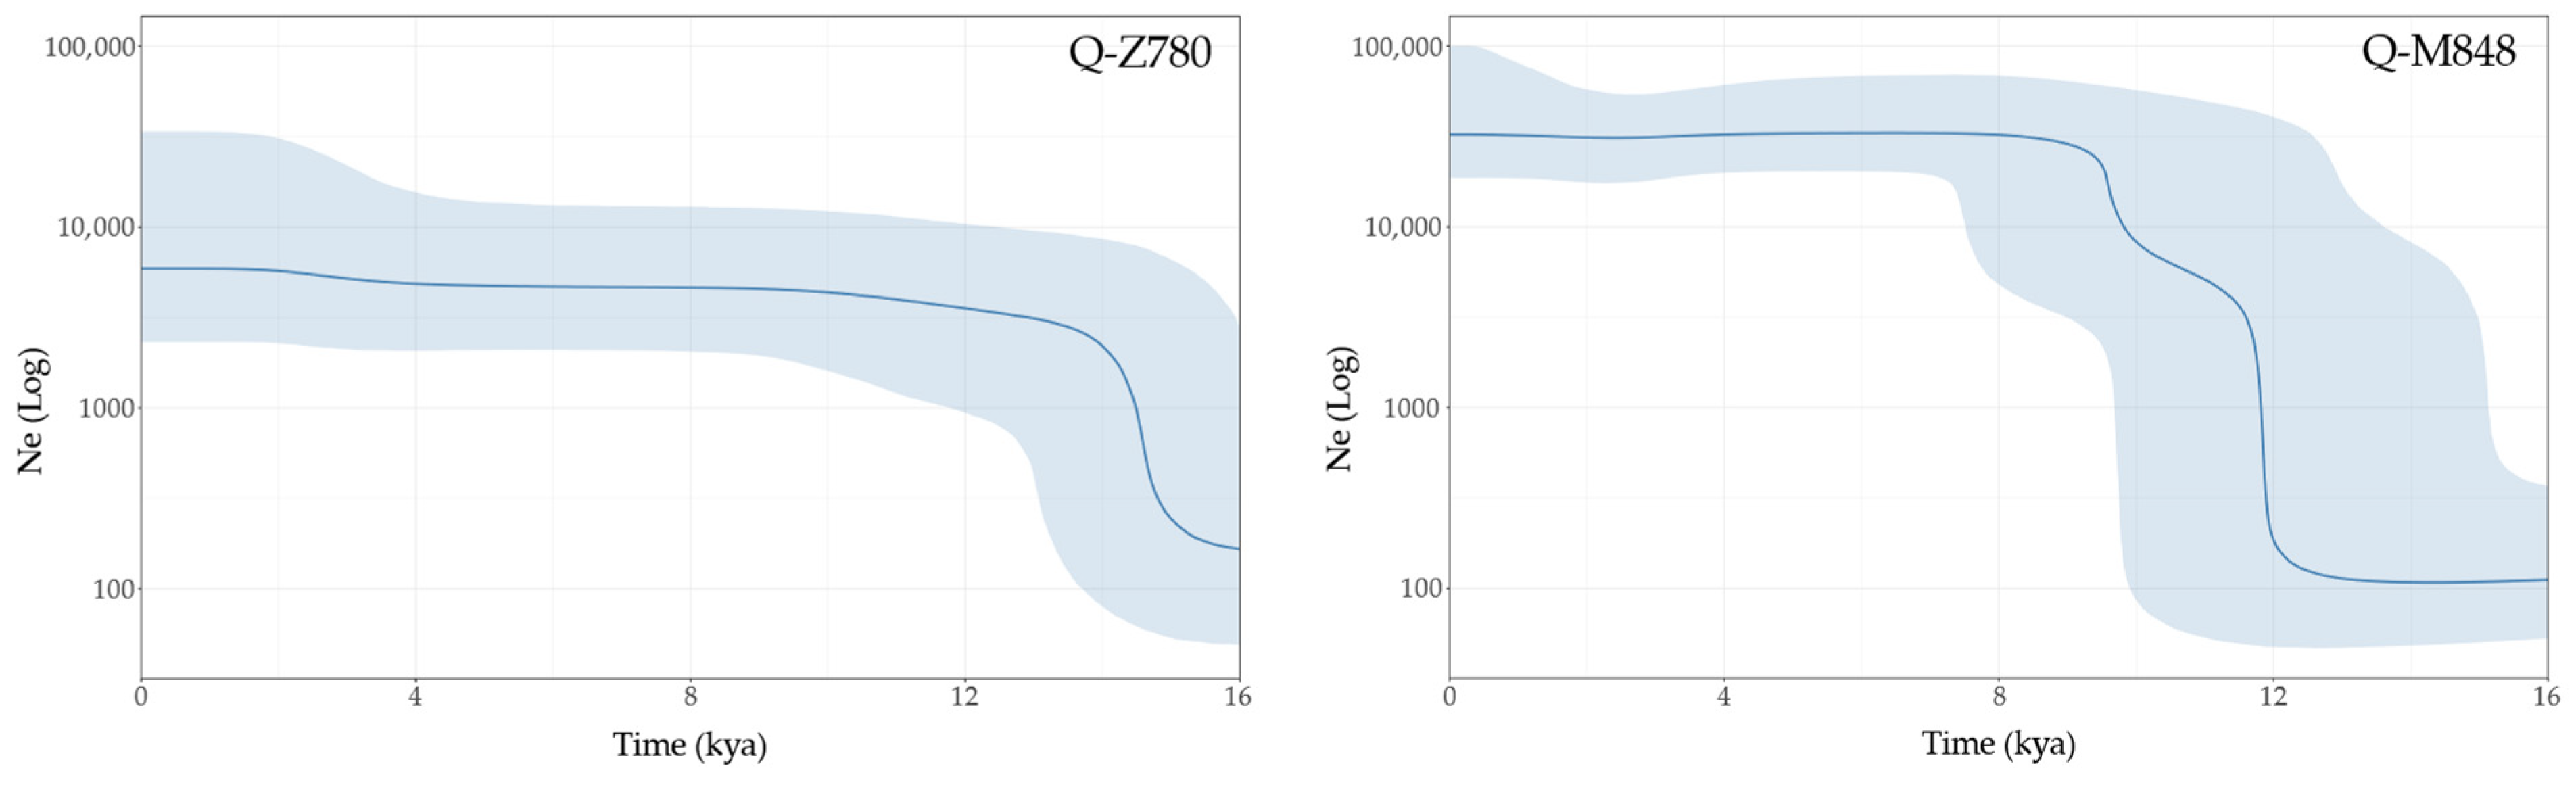
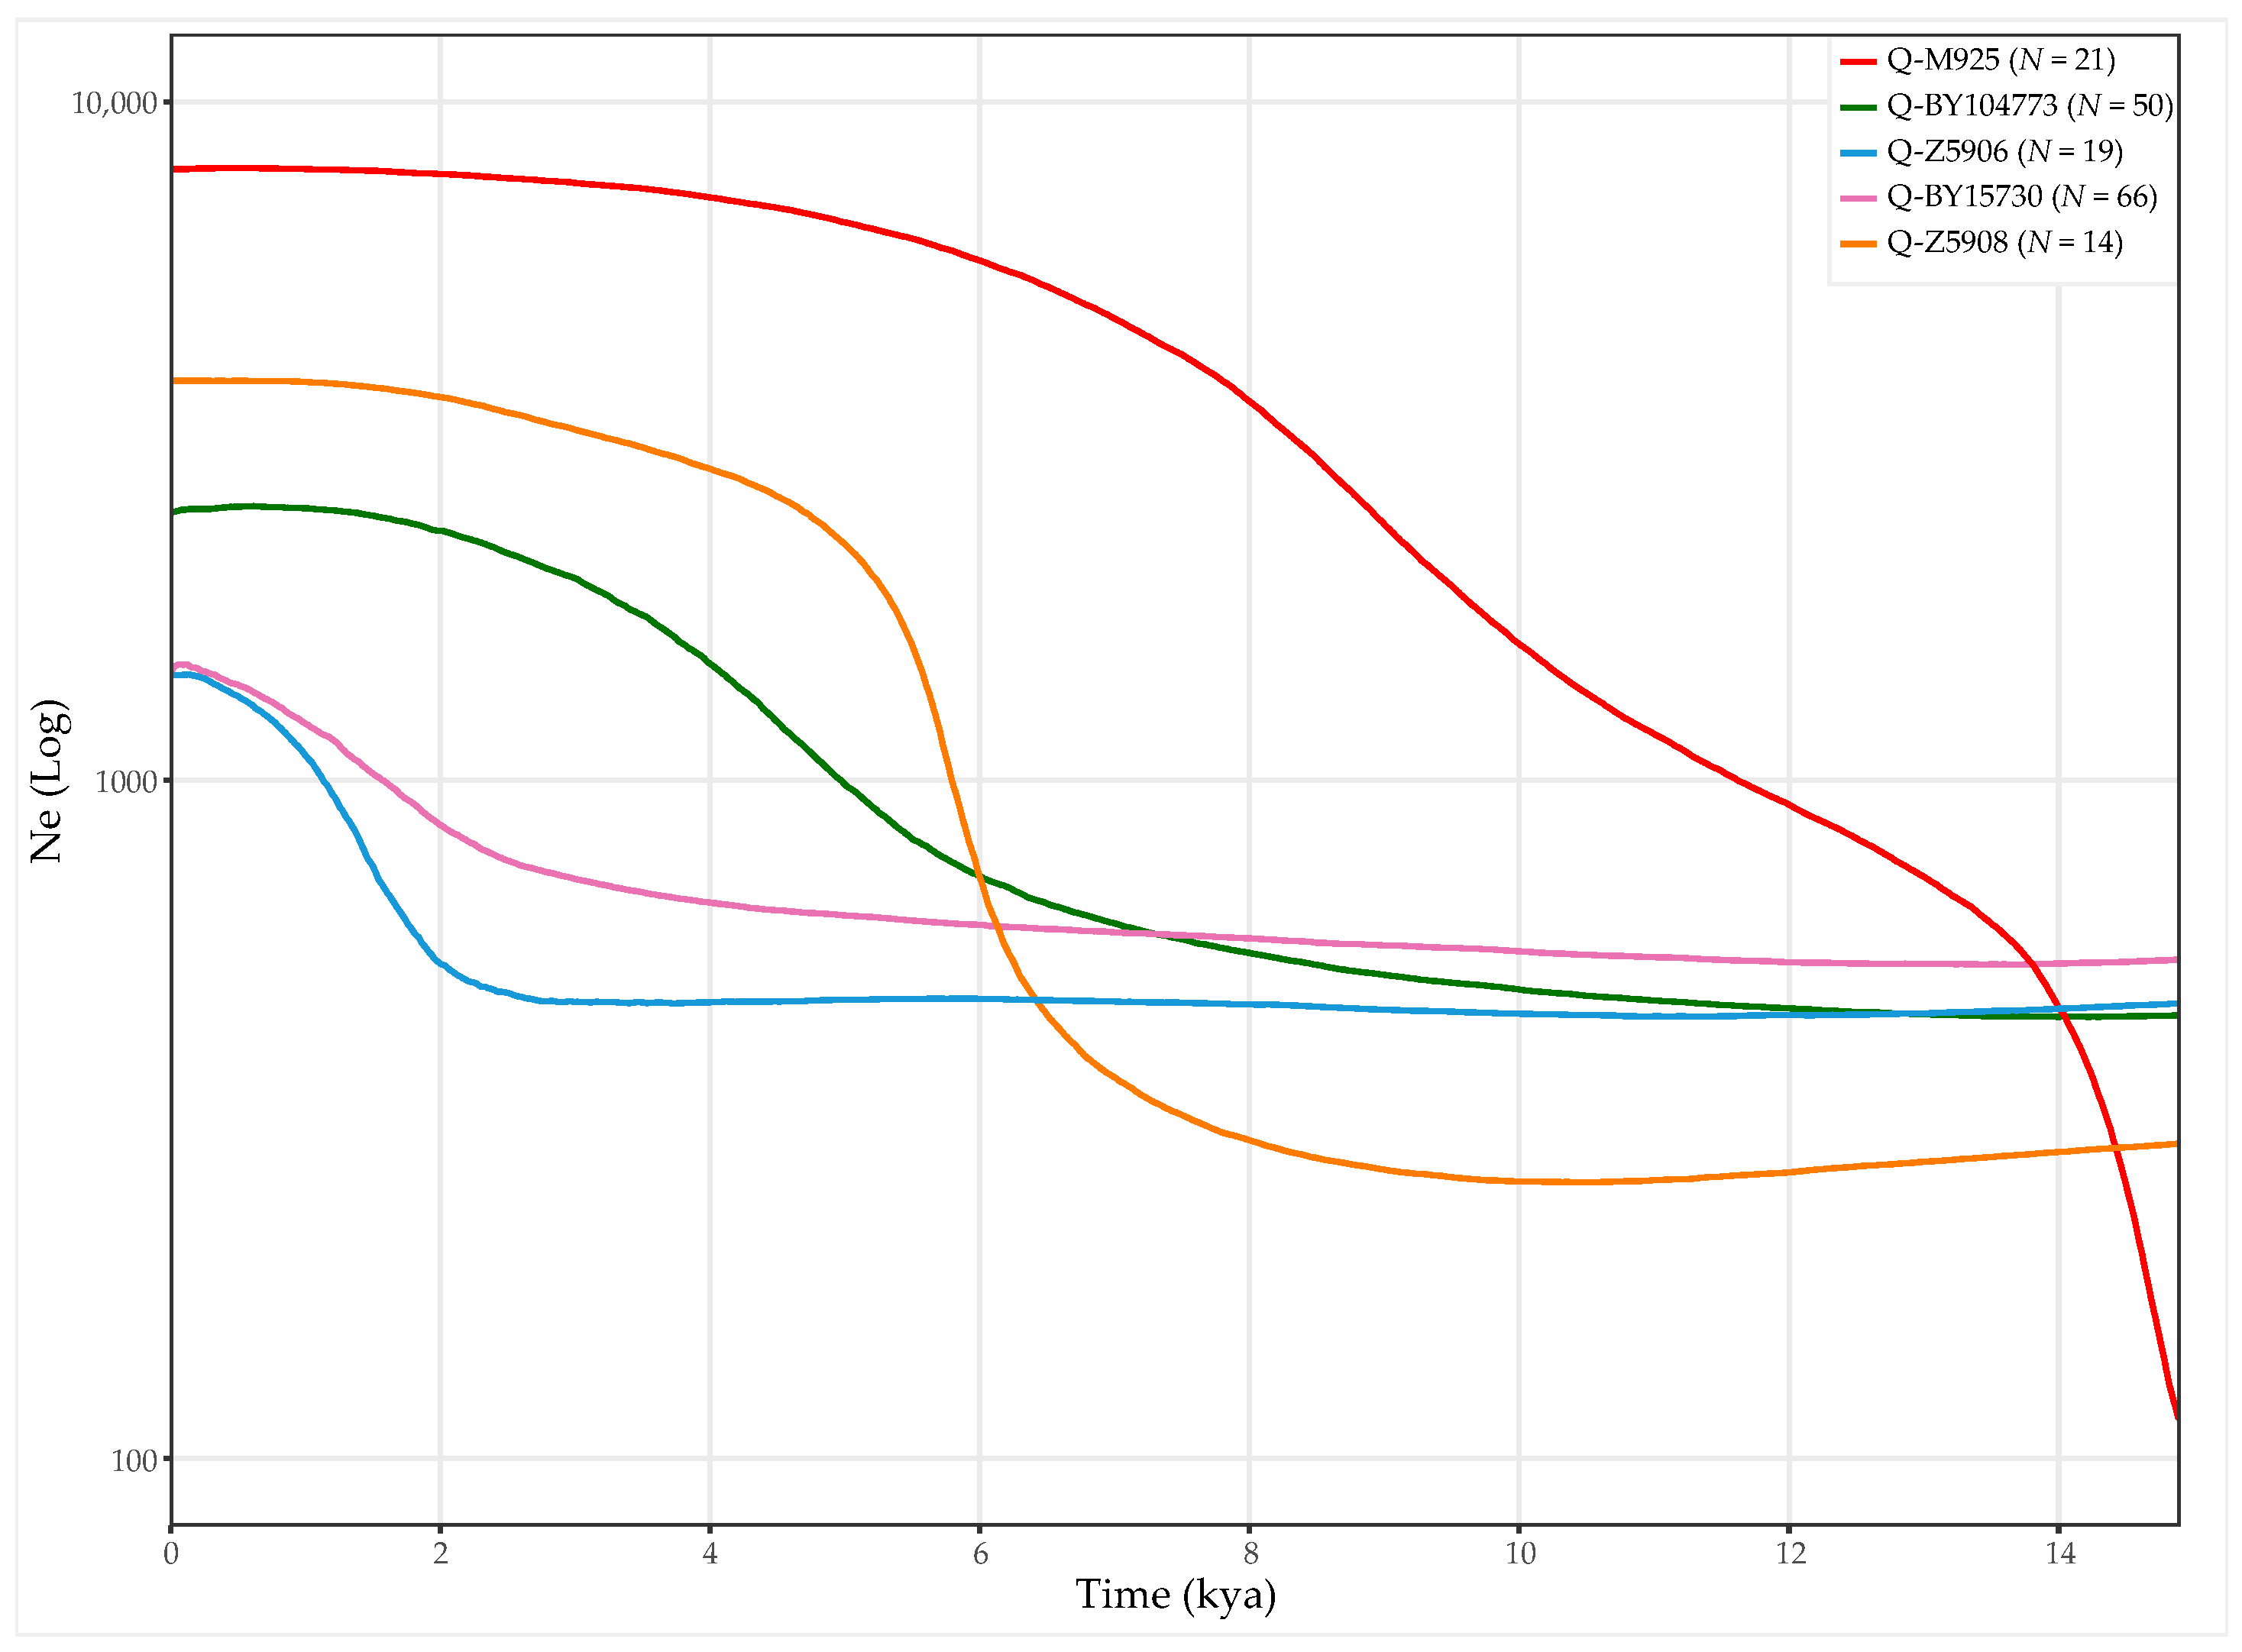
3.3. Age and Population Growth Estimates
4. Discussion
5. Conclusions
Supplementary Materials
Author Contributions
Funding
Institutional Review Board Statement
Informed Consent Statement
Data Availability Statement
Acknowledgments
Conflicts of Interest
Code Availability
References
- Greenberg, J.H.; Turner, C.G.; Zegura, S.L.; Campbell, L.; Fox, J.A.; Laughlin, W.S.; Weiss, K.M.; Woolford, E. The Settlement of the Americas: A comparison of the linguistic, dental, and genetic evidence. Curr. Anthropol. 1986, 27, 477–497. [Google Scholar] [CrossRef]
- Torroni, A.; Schurr, T.G.; Cabell, M.F.; Brown, M.D.; Neel, J.V.; Larsen, M.; Smith, D.G.; Vullo, C.M.; Wallace, D.C. Asian affinities and continental radiation of the four founding Native American mtDNAs. Am. J. Hum. Genet. 1993, 53, 563–590. [Google Scholar]
- Torroni, A.; Sukernik, R.I.; Schurr, T.G.; Starikorskaya, Y.B.; Cabell, M.F.; Crawford, M.H.; Comuzzie, A.G.; Wallace, D.C. MtDNA variation of aboriginal Siberians reveals distinct genetic affinities with Native Americans. Am. J. Hum. Genet. 1993, 53, 591–608. [Google Scholar] [PubMed]
- Pena, S.D.J.; Santos, F.R.; Bianchi, N.O.; Bravi, C.M.; Carnese, F.R.; Rothhammer, F.; Gerelsaikhan, T.; Munkhtuja, B.; Oyunsuren, T. A major founder Y–chromosome haplotype in Amerindians. Nat. Genet. 1995, 11, 15–16. [Google Scholar] [CrossRef]
- Dillehay, T.D. A New Prehistory: Settlement of the Americas; Basic Books: New York, NY, USA, 2000. [Google Scholar]
- Lahaye, C.; Hernandez, M.; Boëda, E.; Felice, G.D.; Guidon, N.; Hoeltz, S.; Lourdeau, A.; Pagli, M.; Pessis, A.-M.; Rasse, M. Human occupation in South America by 20,000 BC: The Toca Da Tira Peia site, Piauí, Brazil. J. Archaeol. Sci. 2013, 40, 2840–2847. [Google Scholar] [CrossRef]
- Ardelean, C.F.; Becerra-Valdivia, L.; Pedersen, M.W.; Schwenninger, J.-L.; Oviatt, C.G.; Macías-Quintero, J.I.; Arroyo-Cabrales, J.; Sikora, M.; Ocampo-Díaz, Y.Z.E.; Rubio-Cisneros, I.I.; et al. Evidence of human occupation in Mexico around the Last Glacial Maximum. Nature 2020, 584, 87–92. [Google Scholar] [CrossRef]
- Dillehay, T.D.; Ocampo, C.; Saavedra, J.; Sawakuchi, A.O.; Vega, R.M.; Pino, M.; Collins, M.B.; Cummings, L.S.; Arregui, I.; Villagran, X.S.; et al. New archaeological evidence for an early human presence at Monte Verde, Chile. PLoS ONE 2015, 10, e0141923. [Google Scholar] [CrossRef] [Green Version]
- Braje, T.J.; Dillehay, T.D.; Erlandson, J.M.; Klein, R.G.; Rick, T.C. Finding the first Americans. Science 2017, 358, 592–594. [Google Scholar] [CrossRef]
- Raghavan, M.; Steinrücken, M.; Harris, K.; Schiffels, S.; Rasmussen, S.; DeGiorgio, M.; Albrechtsen, A.; Valdiosera, C.; Ávila-Arcos, M.C.; Malaspinas, A.-S.; et al. Genomic evidence for the Pleistocene and recent population history of Native Americans. Science 2015, 349, aab3884. [Google Scholar] [CrossRef] [Green Version]
- Moreno-Mayar, J.V.; Vinner, L.; de Barros Damgaard, P.; de la Fuente, C.; Chan, J.; Spence, J.P.; Allentoft, M.E.; Vimala, T.; Racimo, F.; Pinotti, T.; et al. Early human dspersals within the Americas. Science 2018, 362, eaav2621. [Google Scholar] [CrossRef] [Green Version]
- Scheib, C.L.; Li, H.; Desai, T.; Link, V.; Kendall, C.; Dewar, G.; Griffith, P.W.; Mörseburg, A.; Johnson, J.R.; Potter, A.; et al. Ancient human parallel lineages within North America contributed to a coastal expansion. Science 2018, 360, 1024–1027. [Google Scholar] [CrossRef] [PubMed] [Green Version]
- Achilli, A.; Olivieri, A.; Semino, O.; Torroni, A. Ancient human genomes—keys to understanding our past. Science 2018, 360, 964–965. [Google Scholar] [CrossRef] [PubMed]
- Posth, C.; Nakatsuka, N.; Lazaridis, I.; Skoglund, P.; Mallick, S.; Lamnidis, T.C.; Rohland, N.; Nägele, K.; Adamski, N.; Bertolini, E.; et al. Reconstructing the deep population history of Central and South America. Cell 2018, 175, 1185–1197.e22. [Google Scholar] [CrossRef] [Green Version]
- Capodiferro, M.R.; Aram, B.; Raveane, A.; Rambaldi Migliore, N.; Colombo, G.; Ongaro, L.; Rivera, J.; Mendizábal, T.; Hernández-Mora, I.; Tribaldos, M.; et al. Archaeogenomic distinctiveness of the Isthmo-Colombian area. Cell 2021, 184, 1706–1723.e24. [Google Scholar] [CrossRef] [PubMed]
- Bonilla, C.; Bertoni, B.; González, S.; Cardoso, H.; Brum-Zorrilla, N.; Sans, M. Substantial Native American female contribution to the population of Tacuarembó, Uruguay, reveals past episodes of sex-biased gene flow. Am. J. Hum. Biol. 2004, 16, 289–297. [Google Scholar] [CrossRef]
- Bolnick, D.A.; Bolnick, D.I.; Smith, D.G. Asymmetric male and female genetic histories among Native Americans from eastern North America. Mol. Biol. Evol. 2006, 23, 2161–2174. [Google Scholar] [CrossRef] [PubMed] [Green Version]
- Grugni, V.; Battaglia, V.; Perego, U.A.; Raveane, A.; Lancioni, H.; Olivieri, A.; Ferretti, L.; Woodward, S.R.; Pascale, J.M.; Cooke, R.; et al. Exploring the Y chromosomal ancestry of modern Panamanians. PLoS ONE 2015, 10, e0144223. [Google Scholar] [CrossRef] [Green Version]
- Rambaldi Migliore, N.; Colombo, G.; Capodiferro, M.R.; Mazzocchi, L.; Chero Osorio, A.M.; Raveane, A.; Tribaldos, M.; Perego, U.A.; Mendizábal, T.; Montón, A.G.; et al. Weaving mitochondrial DNA and Y-chromosome variation in the Panamanian genetic canvas. Genes 2021, 12, 1921. [Google Scholar] [CrossRef]
- Bryc, K.; Durand, E.Y.; Macpherson, J.M.; Reich, D.; Mountain, J.L. The genetic ancestry of African Americans, Latinos, and European Americans across the United States. Am. J. Hum. Genet. 2015, 96, 37–53. [Google Scholar] [CrossRef] [Green Version]
- Ongaro, L.; Scliar, M.O.; Flores, R.; Raveane, A.; Marnetto, D.; Sarno, S.; Gnecchi-Ruscone, G.A.; Alarcón-Riquelme, M.E.; Patin, E.; Wangkumhang, P.; et al. The genomic impact of European colonization of the Americas. Curr. Biol. 2019, 29, 3974–3986.e4. [Google Scholar] [CrossRef]
- Lind, J.M.; Hutcheson-Dilks, H.B.; Williams, S.M.; Moore, J.H.; Essex, M.; Ruiz-Pesini, E.; Wallace, D.C.; Tishkoff, S.A.; O’Brien, S.J.; Smith, M.W. Elevated male European and female African contributions to the genomes of African American individuals. Hum. Genet. 2006, 120, 713–722. [Google Scholar] [CrossRef] [PubMed]
- Bryc, K.; Auton, A.; Nelson, M.R.; Oksenberg, J.R.; Hauser, S.L.; Williams, S.; Froment, A.; Bodo, J.-M.; Wambebe, C.; Tishkoff, S.A.; et al. Genome-wide patterns of population structure and admixture in West Africans and African Americans. Proc. Natl. Acad. Sci. USA 2010, 107, 786–791. [Google Scholar] [CrossRef] [PubMed] [Green Version]
- Bryc, K.; Velez, C.; Karafet, T.; Moreno-Estrada, A.; Reynolds, A.; Auton, A.; Hammer, M.; Bustamante, C.D.; Ostrer, H. Genome-wide patterns of population structure and admixture among Hispanic/Latino Populations. Proc. Natl. Acad. Sci. USA 2010, 107, 8954–8961. [Google Scholar] [CrossRef] [PubMed] [Green Version]
- Cox, M.P.; Karafet, T.M.; Lansing, J.S.; Sudoyo, H.; Hammer, M.F. Autosomal and X-linked single nucleotide polymorphisms reveal a steep Asian–Melanesian ancestry cline in eastern Indonesia and a sex bias in admixture rates. Proc. Royal Soc. B 2010, 277, 1589–1596. [Google Scholar] [CrossRef] [PubMed] [Green Version]
- Verdu, P.; Becker, N.S.A.; Froment, A.; Georges, M.; Grugni, V.; Quintana-Murci, L.; Hombert, J.-M.; Van der Veen, L.; Le Bomin, S.; Bahuchet, S.; et al. Sociocultural behavior, sex-biased admixture, and effective population sizes in central African Pygmies and Non-Pygmies. Mol. Biol. Evol. 2013, 30, 918–937. [Google Scholar] [CrossRef] [Green Version]
- Ongaro, L.; Molinaro, L.; Flores, R.; Marnetto, D.; Capodiferro, M.R.; Alarcón-Riquelme, M.E.; Moreno-Estrada, A.; Mabunda, N.; Ventura, M.; Tambets, K.; et al. Evaluating the impact of sex-biased genetic admixture in the Americas through the analysis of haplotype data. Genes 2021, 12, 1580. [Google Scholar] [CrossRef]
- Soares, P.; Ermini, L.; Thomson, N.; Mormina, M.; Rito, T.; Röhl, A.; Salas, A.; Oppenheimer, S.; Macaulay, V.; Richards, M.B. Correcting for purifying selection: An improved human mitochondrial molecular clock. Am. J. Hum. Genet. 2009, 84, 740–759. [Google Scholar] [CrossRef] [Green Version]
- Karmin, M.; Saag, L.; Vicente, M.; Sayres, M.A.W.; Järve, M.; Talas, U.G.; Rootsi, S.; Ilumäe, A.-M.; Mägi, R.; Mitt, M.; et al. A recent bottleneck of Y chromosome diversity coincides with a global change in culture. Genome Res. 2015, 25, 459–466. [Google Scholar] [CrossRef] [Green Version]
- Balanovsky, O. Toward a consensus on SNP and STR mutation rates on the human Y-chromosome. Hum. Genet. 2017, 136, 575–590. [Google Scholar] [CrossRef]
- Achilli, A.; Perego, U.A.; Bravi, C.M.; Coble, M.D.; Kong, Q.-P.; Woodward, S.R.; Salas, A.; Torroni, A.; Bandelt, H.-J. The phylogeny of the four pan-American mtDNA haplogroups: Implications for evolutionary and disease studies. PLoS ONE 2008, 3, e1764. [Google Scholar] [CrossRef] [Green Version]
- Perego, U.A.; Achilli, A.; Angerhofer, N.; Accetturo, M.; Pala, M.; Olivieri, A.; Kashani, B.H.; Ritchie, K.H.; Scozzari, R.; Kong, Q.-P.; et al. Distinctive Paleo-Indian migration routes from Beringia marked by two rare MtDNA haplogroups. Curr. Biol. 2009, 19, 1–8. [Google Scholar] [CrossRef] [PubMed] [Green Version]
- Perego, U.A.; Angerhofer, N.; Pala, M.; Olivieri, A.; Lancioni, H.; Kashani, B.H.; Carossa, V.; Ekins, J.E.; Gómez-Carballa, A.; Huber, G.; et al. The initial peopling of the Americas: A growing number of founding mitochondrial genomes from Beringia. Genome Res. 2010, 20, 1174–1179. [Google Scholar] [CrossRef] [PubMed] [Green Version]
- Brandini, S.; Bergamaschi, P.; Cerna, M.F.; Gandini, F.; Bastaroli, F.; Bertolini, E.; Cereda, C.; Ferretti, L.; Gómez-Carballa, A.; Battaglia, V.; et al. The Paleo-Indian entry into South America according to mitogenomes. Mol. Biol. Evol. 2018, 35, 299–311. [Google Scholar] [CrossRef] [Green Version]
- Poznik, G.D.; Henn, B.M.; Yee, M.-C.; Sliwerska, E.; Euskirchen, G.M.; Lin, A.A.; Snyder, M.; Quintana-Murci, L.; Kidd, J.M.; Underhill, P.A.; et al. Sequencing Y chromosomes resolves discrepancy in time to common ancestor of males versus females. Science 2013, 341, 562–565. [Google Scholar] [CrossRef] [PubMed] [Green Version]
- Arias, L.; Schröder, R.; Hübner, A.; Barreto, G.; Stoneking, M.; Pakendorf, B. Cultural innovations influence patterns of genetic diversity in Northwestern Amazonia. Mol. Biol. Evol. 2018, 35, 2719–2735. [Google Scholar] [CrossRef] [PubMed] [Green Version]
- Grugni, V.; Raveane, A.; Ongaro, L.; Battaglia, V.; Trombetta, B.; Colombo, G.; Capodiferro, M.R.; Olivieri, A.; Achilli, A.; Perego, U.A.; et al. Analysis of the human Y-chromosome haplogroup Q characterizes ancient population movements in Eurasia and the Americas. BMC Biol. 2019, 17, 3. [Google Scholar] [CrossRef] [PubMed] [Green Version]
- Pinotti, T.; Bergström, A.; Geppert, M.; Bawn, M.; Ohasi, D.; Shi, W.; Lacerda, D.R.; Solli, A.; Norstedt, J.; Reed, K.; et al. Y chromosome sequences reveal a short Beringian standstill, rapid expansion, and early population structure of Native American Founders. Curr. Biol. 2019, 29, 149–157.e3. [Google Scholar] [CrossRef] [Green Version]
- The 1000 Genomes Project Consortium. Nature 2015, 526, 68–74. [CrossRef] [Green Version]
- Mallick, S.; Li, H.; Lipson, M.; Mathieson, I.; Gymrek, M.; Racimo, F.; Zhao, M.; Chennagiri, N.; Nordenfelt, S.; Tandon, A.; et al. The Simons Genome Diversity Project: 300 genomes from 142 diverse populations. Nature 2016, 538, 201–206. [Google Scholar] [CrossRef]
- Bergström, A.; McCarthy, S.A.; Hui, R.; Almarri, M.A.; Ayub, Q.; Danecek, P.; Chen, Y.; Felkel, S.; Hallast, P.; Kamm, J.; et al. Insights into human genetic variation and population history from 929 diverse genomes. Science 2020, 367, eaay5012. [Google Scholar] [CrossRef]
- Nägele, K.; Posth, C.; Iraeta Orbegozo, M.; Chinique de Armas, Y.; Hernández Godoy, S.T.; González Herrera, U.M.; Nieves-Colón, M.A.; Sandoval-Velasco, M.; Mylopotamitaki, D.; Radzeviciute, R.; et al. Genomic insights into the early peopling of the Caribbean. Science 2020, 369, 456–460. [Google Scholar] [CrossRef] [PubMed]
- Fernandes, D.M.; Sirak, K.A.; Ringbauer, H.; Sedig, J.; Rohland, N.; Cheronet, O.; Mah, M.; Mallick, S.; Olalde, I.; Culleton, B.J.; et al. A genetic history of the pre-contact Caribbean. Nature 2021, 590, 103–110. [Google Scholar] [CrossRef] [PubMed]
- Chambers, J.C.; Abbott, J.; Zhang, W.; Turro, E.; Scott, W.R.; Tan, S.-T.; Afzal, U.; Afaq, S.; Loh, M.; Lehne, B.; et al. The South Asian genome. PLoS ONE 2014, 9, e102645. [Google Scholar] [CrossRef] [PubMed] [Green Version]
- Prüfer, K.; Racimo, F.; Patterson, N.; Jay, F.; Sankararaman, S.; Sawyer, S.; Heinze, A.; Renaud, G.; Sudmant, P.H.; de Filippo, C.; et al. The complete genome sequence of a Neanderthal from the Altai Mountains. Nature 2014, 505, 43–49. [Google Scholar] [CrossRef] [PubMed]
- Rasmussen, M.; Li, Y.; Lindgreen, S.; Pedersen, J.S.; Albrechtsen, A.; Moltke, I.; Metspalu, M.; Metspalu, E.; Kivisild, T.; Gupta, R.; et al. Ancient human genome sequence of an extinct Palaeo-Eskimo. Nature 2010, 463, 757–762. [Google Scholar] [CrossRef]
- Rasmussen, M.; Anzick, S.L.; Waters, M.R.; Skoglund, P.; DeGiorgio, M.; Stafford, T.W.; Rasmussen, S.; Moltke, I.; Albrechtsen, A.; Doyle, S.M.; et al. The genome of a late Pleistocene human from a Clovis burial site in Western Montana. Nature 2014, 506, 225–229. [Google Scholar] [CrossRef] [Green Version]
- Rasmussen, M.; Sikora, M.; Albrechtsen, A.; Korneliussen, T.S.; Moreno-Mayar, J.V.; Poznik, G.D.; Zollikofer, C.P.E.; Ponce de León, M.S.; Allentoft, M.E.; Moltke, I.; et al. The ancestry and affiliations of Kennewick Man. Nature 2015, 523, 455–458. [Google Scholar] [CrossRef]
- Malaspinas, A.-S.; Lao, O.; Schroeder, H.; Rasmussen, M.; Raghavan, M.; Moltke, I.; Campos, P.F.; Sagredo, F.S.; Rasmussen, S.; Gonçalves, V.F.; et al. Two ancient human genomes reveal Polynesian ancestry among the Indigenous Botocudos of Brazil. Curr. Biol. 2014, 24, R1035–R1037. [Google Scholar] [CrossRef] [Green Version]
- de la Fuente, C.; Ávila-Arcos, M.C.; Galimany, J.; Carpenter, M.L.; Homburger, J.R.; Blanco, A.; Contreras, P.; Dávalos, D.C.; Reyes, O.; Roman, M.S.; et al. Genomic insights into the origin and diversification of late maritime hunter-gatherers from the Chilean Patagonia. Proc. Natl. Acad. Sci. USA 2018, 115, E4006–E4012. [Google Scholar] [CrossRef] [Green Version]
- Lindo, J.; Haas, R.; Hofman, C.; Apata, M.; Moraga, M.; Verdugo, R.A.; Watson, J.T.; Viviano Llave, C.; Witonsky, D.; Beall, C.; et al. The genetic prehistory of the Andean Highlands 7000 years BP though European contact. Sci. Adv. 2018, 4, eaau4921. [Google Scholar] [CrossRef] [Green Version]
- Flegontov, P.; Altınışık, N.E.; Changmai, P.; Rohland, N.; Mallick, S.; Adamski, N.; Bolnick, D.A.; Broomandkhoshbacht, N.; Candilio, F.; Culleton, B.J.; et al. Palaeo-Eskimo genetic ancestry and the peopling of Chukotka and North America. Nature 2019, 570, 236–240. [Google Scholar] [CrossRef] [PubMed]
- Sikora, M.; Pitulko, V.V.; Sousa, V.C.; Allentoft, M.E.; Vinner, L.; Rasmussen, S.; Margaryan, A.; de Barros Damgaard, P.; de la Fuente, C.; Renaud, G.; et al. The population history of Northeastern Siberia since the Pleistocene. Nature 2019, 570, 182–188. [Google Scholar] [CrossRef] [PubMed] [Green Version]
- Nakatsuka, N.; Lazaridis, I.; Barbieri, C.; Skoglund, P.; Rohland, N.; Mallick, S.; Posth, C.; Harkins-Kinkaid, K.; Ferry, M.; Harney, É.; et al. A paleogenomic reconstruction of the deep population history of the Andes. Cell 2020, 181, 1131–1145.e21. [Google Scholar] [CrossRef] [PubMed]
- Nakatsuka, N.; Luisi, P.; Motti, J.M.B.; Salemme, M.; Santiago, F.; D’Angelo del Campo, M.D.; Vecchi, R.J.; Espinosa-Parrilla, Y.; Prieto, A.; Adamski, N.; et al. Ancient genomes in South Patagonia reveal population movements associated with technological shifts and geography. Nat. Commun. 2020, 11, 3868. [Google Scholar] [CrossRef]
- Li, H.; Durbin, R. Fast and accurate short read alignment with Burrows–Wheeler transform. Bioinformatics 2009, 25, 1754–1760. [Google Scholar] [CrossRef] [Green Version]
- Garrison, E.; Marth, G. Haplotype-based variant detection from short-read sequencing. arXiv 2012, arXiv:1207.3907. [Google Scholar]
- Chen, H.; Lu, Y.; Lu, D.; Xu, S. Y-LineageTracker: A high-throughput analysis framework for Y-chromosomal next-generation sequencing data. BMC Bioinform. 2021, 22, 114. [Google Scholar] [CrossRef]
- Ortiz, E.M. Vcf2phylip v2.0: Convert a VCF matrix into several matrix formats for phylogenetic analysis. Software 2019. Available online: https://zenodo.org/record/2540861#.Ye-evTgzaUk (accessed on 21 January 2022). [CrossRef]
- Stamatakis, A. RAxML version 8: A tool for phylogenetic analysis and post-analysis of large phylogenies. Bioinformatics 2014, 30, 1312–1313. [Google Scholar] [CrossRef]
- Huerta-Cepas, J.; Serra, F.; Bork, P. ETE3: Reconstruction, analysis, and visualization of phylogenomic data. Mol. Biol. Evol. 2016, 33, 1635–1638. [Google Scholar] [CrossRef] [Green Version]
- Martiniano, R.; De Sanctis, B.; Hallast, P.; Durbin, R. Placing ancient DNA sequences into reference phylogenies. bioRxiv 2020. [Google Scholar] [CrossRef]
- Miles, A.; pyup io bot; Murillo, R.; Ralph, P.; Harding, N.; Pisupati, R.; Rae, S.; Millar, T. Cggh/Scikit-Allel: V1.3.3. 2021. Available online: https://zenodo.org/record/4759368#.Ye-e-jgzaUk (accessed on 21 January 2022). [CrossRef]
- Bouckaert, R.; Vaughan, T.G.; Barido-Sottani, J.; Duchêne, S.; Fourment, M.; Gavryushkina, A.; Heled, J.; Jones, G.; Kühnert, D.; Maio, N.D.; et al. BEAST 2.5: An advanced software platform for Bayesian evolutionary analysis. PLoS Comput. Biol. 2019, 15, e1006650. [Google Scholar] [CrossRef] [PubMed] [Green Version]
- Kumar, S.; Stecher, G.; Li, M.; Knyaz, C.; Tamura, K. MEGA X: Molecular evolutionary genetics analysis across computing platforms. Mol. Biol. Evol. 2018, 35, 1547–1549. [Google Scholar] [CrossRef] [PubMed]
- Rambaut, A.; Drummond, A.J.; Xie, D.; Baele, G.; Suchard, M.A. Posterior summarization in Bayesian phylogenetics using Tracer 1.7. Syst. Biol. 2018, 67, 901–904. [Google Scholar] [CrossRef] [PubMed] [Green Version]
- R Core Team R. A Language and Environment for Statistical Computing; R Foundation for Statistical Computing: Vienna, Austria, 2021; Available online: https://www.R-project.org/ (accessed on 3 December 2021).
- Karafet, T.M.; Zegura, S.L.; Posukh, O.; Osipova, L.; Bergen, A.; Long, J.; Goldman, D.; Klitz, W.; Harihara, S.; de Knijff, P.; et al. Ancestral Asian source(s) of New World Y-chromosome founder haplotypes. Am. J. Hum. Genet. 1999, 64, 817–831. [Google Scholar] [CrossRef] [PubMed] [Green Version]
- Zegura, S.L.; Karafet, T.M.; Zhivotovsky, L.A.; Hammer, M.F. High-Resolution SNPs and Microsatellite Haplotypes Point to a Single, Recent entry of Native American Y chromosomes into the Americas. Mol. Biol. Evol. 2004, 21, 164–175. [Google Scholar] [CrossRef]
- Malhi, R.S.; Gonzalez-Oliver, A.; Schroeder, K.B.; Kemp, B.M.; Greenberg, J.A.; Dobrowski, S.Z.; Smith, D.G.; Resendez, A.; Karafet, T.; Hammer, M.; et al. Distribution of Y chromosomes among Native North Americans: A study of Athapaskan population history. Am. J. Phys. Anthropol. 2008, 137, 412–424. [Google Scholar] [CrossRef] [Green Version]
- Geppert, M.; Baeta, M.; Núñez, C.; Martínez-Jarreta, B.; Zweynert, S.; Cruz, O.W.V.; González-Andrade, F.; González-Solorzano, J.; Nagy, M.; Roewer, L. Hierarchical Y-SNP assay to study the hidden diversity and phylogenetic relationship of Native populations in South America. Forensic Sci. Int. Genet. 2011, 5, 100–104. [Google Scholar] [CrossRef]
- Roewer, L.; Nothnagel, M.; Gusmão, L.; Gomes, V.; González, M.; Corach, D.; Sala, A.; Alechine, E.; Palha, T.; Santos, N.; et al. Continent-wide decoupling of Y-chromosomal genetic variation from language and geography in Native South Americans. PLoS Genet. 2013, 9, e1003460. [Google Scholar] [CrossRef] [Green Version]
- Mezzavilla, M.; Geppert, M.; Tyler-Smith, C.; Roewer, L.; Xue, Y. Insights into the origin of rare haplogroup C3* Y chromosomes in South America from high-density autosomal SNP genotyping. Forensic Sci. Int. Genet. 2015, 15, 115–120. [Google Scholar] [CrossRef] [Green Version]
- Zhong, H.; Shi, H.; Qi, X.-B.; Duan, Z.-Y.; Tan, P.-P.; Jin, L.; Su, B.; Ma, R.Z. Extended Y chromosome investigation suggests postglacial migrations of modern humans into East Asia via the northern route. Mol. Biol. Evol. 2011, 28, 717–727. [Google Scholar] [CrossRef] [Green Version]
- Wei, L.-H.; Wang, L.-X.; Wen, S.-Q.; Yan, S.; Canada, R.; Gurianov, V.; Huang, Y.-Z.; Mallick, S.; Biondo, A.; O’Leary, A.; et al. Paternal origin of Paleo-Indians in Siberia: Insights from Y-chromosome sequences. Eur. J. Hum. Genet. 2018, 26, 1687–1696. [Google Scholar] [CrossRef] [Green Version]
- Chiaroni, J.; Underhill, P.A.; Cavalli-Sforza, L.L. Y chromosome diversity, human expansion, drift, and cultural evolution. Proc. Natl. Acad. Sci. USA 2009, 106, 20174–20179. [Google Scholar] [CrossRef] [PubMed] [Green Version]
- Huang, Y.-Z.; Pamjav, H.; Flegontov, P.; Stenzl, V.; Wen, S.-Q.; Tong, X.-Z.; Wang, C.-C.; Wang, L.-X.; Wei, L.-H.; Gao, J.-Y.; et al. Dispersals of the Siberian Y-chromosome haplogroup Q in Eurasia. Mol. Genet. Genom. 2018, 293, 107–117. [Google Scholar] [CrossRef] [PubMed] [Green Version]
- Jota, M.S.; Lacerda, D.R.; Sandoval, J.R.; Vieira, P.P.R.; Ohasi, D.; Santos-Júnior, J.E.; Acosta, O.; Cuellar, C.; Revollo, S.; Paz-y-Miño, C.; et al. New Native South American Y chromosome lineages. J. Hum. Genet. 2016, 61, 593–603. [Google Scholar] [CrossRef] [PubMed]
- Battaglia, V.; Grugni, V.; Perego, U.A.; Angerhofer, N.; Gomez-Palmieri, J.E.; Woodward, S.R.; Achilli, A.; Myres, N.; Torroni, A.; Semino, O. The first peopling of South America: New evidence from Y-chromosome haplogroup Q. PLoS ONE 2013, 8, e71390. [Google Scholar] [CrossRef] [Green Version]
- Montinaro, F.; Busby, G.B.J.; Pascali, V.L.; Myers, S.; Hellenthal, G.; Capelli, C. Unravelling the hidden ancestry of American admixed populations. Nat. Commun. 2015, 6, 6596. [Google Scholar] [CrossRef] [Green Version]
- Fortes-Lima, C.; Gessain, A.; Ruiz-Linares, A.; Bortolini, M.-C.; Migot-Nabias, F.; Bellis, G.; Moreno-Mayar, J.V.; Restrepo, B.N.; Rojas, W.; Avendaño-Tamayo, E.; et al. Genome-wide ancestry and demographic history of African-descendant Maroon communities from French Guiana and Suriname. Am. J. Hum. Genet. 2017, 101, 725–736. [Google Scholar] [CrossRef] [Green Version]
- Chacón-Duque, J.-C.; Adhikari, K.; Fuentes-Guajardo, M.; Mendoza-Revilla, J.; Acuña-Alonzo, V.; Barquera, R.; Quinto-Sánchez, M.; Gómez-Valdés, J.; Everardo Martínez, P.; Villamil-Ramírez, H.; et al. Latin Americans show wide-spread Converso ancestry and imprint of local Native ancestry on physical appearance. Nat. Commun. 2018, 9, 5388. [Google Scholar] [CrossRef] [Green Version]
- Willerslev, E.; Meltzer, D.J. Peopling of the Americas as inferred from ancient genomics. Nature 2021, 594, 356–364. [Google Scholar] [CrossRef]
- Martiniano, R.; Garrison, E.; Jones, E.R.; Manica, A.; Durbin, R. Removing reference bias and improving indel calling in ancient DNA data analysis by mapping to a sequence variation graph. Genome Biol. 2020, 21, 250. [Google Scholar] [CrossRef]
- Piperno, D.R. The origins of plant cultivation and domestication in the New World tropics: Patterns, process, and new developments. Curr. Anthropol. 2011, 52, S453–S470. [Google Scholar] [CrossRef]
- Morcote-Ríos, G.; Aceituno, F.J.; Iriarte, J.; Robinson, M.; Chaparro-Cárdenas, J.L. Colonisation and early peopling of the Colombian Amazon during the late Pleistocene and the early Holocene: New evidence from La Serranía La Lindosa. Quat. Int. 2021, 578, 5–19. [Google Scholar] [CrossRef]
- Piperno, D.R.; Pearsall, D.M. The Origins of Agriculture in the Lowland Neotropics; Academic Press: San Diego, CA, USA, 1998. [Google Scholar]
- Keegan, W.F. West Indian archaeology. 3. Ceramic age. J. Archaeol. Res. 2000, 8, 135–167. [Google Scholar] [CrossRef]
- Arias, L.; Barbieri, C.; Barreto, G.; Stoneking, M.; Pakendorf, B. High-resolution mitochondrial DNA analysis sheds light on human diversity, cultural interactions, and population mobility in Northwestern Amazonia. Am. J. Phys. Anthropol. 2018, 165, 238–255. [Google Scholar] [CrossRef]
- Barbieri, C.; Barquera, R.; Arias, L.; Sandoval, J.R.; Acosta, O.; Zurita, C.; Aguilar-Campos, A.; Tito-Álvarez, A.M.; Serrano-Osuna, R.; Gray, R.D.; et al. The current genomic landscape of Western South America: Andes, Amazonia, and Pacific Coast. Mol. Biol. Evol. 2019, 36, 2698–2713. [Google Scholar] [CrossRef] [Green Version]
- Rick, J.W. The Character and Context of Highland Preceramic Society. In Peruvian Prehistory: An Overview of Pre-Inca and Inca Society; Cambridge University Press: Cambridge, UK, 1988; pp. 3–40. ISBN 978-0-521-25560-8. [Google Scholar]
- Rivera, M.A. The preceramic Chinchorro mummy complex of northern Chile: Context, style, and purpose. In Tombs for the Living: Andean Mortuary Practices; Dumbarton Oaks Research Library and Collection: Washington, DC, USA, 1995; pp. 43–77. [Google Scholar]
- Dillehay, T.D.; Rossen, J.; Andres, T.C.; Williams, D.E. Preceramic adoption of peanut, squash, and sotton in northern Peru. Science 2007, 316, 1890–1893. [Google Scholar] [CrossRef] [Green Version]
- Aldenderfer, M.S. High elevation foraging societies. In The Handbook of South American Archaeology; Silverman, H., Isbell, W.H., Eds.; Springer: New York, NY, USA, 2008; pp. 131–143. ISBN 978-0-387-74907-5. [Google Scholar]
- Arriaza, B.T.; Standen, V.G.; Cassman, V.; Santoro, C.M. Chinchorro culture: Pioneers of the Coast of the Atacama Desert. In The Handbook of South American Archaeology; Silverman, H., Isbell, W.H., Eds.; Springer: New York, NY, USA, 2008; pp. 45–58. ISBN 978-0-387-74907-5. [Google Scholar]
- Hastorf, C.A. The formative period in the Titicaca Basin. In The Handbook of South American Archaeology; Silverman, H., Isbell, W.H., Eds.; Springer: New York, NY, USA, 2008; pp. 545–561. ISBN 978-0-387-74907-5. [Google Scholar]
- Pozorski, S.; Pozorski, T. Early cultural complexity on the Coast of Peru. In The Handbook of South American Archaeology; Silverman, H., Isbell, W.H., Eds.; Springer: New York, NY, USA, 2008; pp. 607–631. ISBN 978-0-387-74907-5. [Google Scholar]
- Quilter, J. The Ancient Central Andes; Routledge: London, UK, 2013; ISBN 978-1-315-85794-7. [Google Scholar]
- Sandoval, K.; Moreno-Estrada, A.; Mendizabal, I.; Underhill, P.A.; Lopez-Valenzuela, M.; Peñaloza-Espinosa, R.; Lopez-Lopez, M.; Buentello-Malo, L.; Avelino, H.; Calafell, F.; et al. Y-chromosome diversity in Native Mexicans reveals continental transition of genetic structure in the Americas. Am. J. Phys. Anthropol. 2012, 148, 395–405. [Google Scholar] [CrossRef] [Green Version]
- Waters, M.R. Late Pleistocene exploration and settlement of the Americas by modern humans. Science 2019, 365, eaat5447. [Google Scholar] [CrossRef]


Publisher’s Note: MDPI stays neutral with regard to jurisdictional claims in published maps and institutional affiliations. |
© 2022 by the authors. Licensee MDPI, Basel, Switzerland. This article is an open access article distributed under the terms and conditions of the Creative Commons Attribution (CC BY) license (https://creativecommons.org/licenses/by/4.0/).
Share and Cite
Colombo, G.; Traverso, L.; Mazzocchi, L.; Grugni, V.; Rambaldi Migliore, N.; Capodiferro, M.R.; Lombardo, G.; Flores, R.; Karmin, M.; Rootsi, S.; et al. Overview of the Americas’ First Peopling from a Patrilineal Perspective: New Evidence from the Southern Continent. Genes 2022, 13, 220. https://doi.org/10.3390/genes13020220
Colombo G, Traverso L, Mazzocchi L, Grugni V, Rambaldi Migliore N, Capodiferro MR, Lombardo G, Flores R, Karmin M, Rootsi S, et al. Overview of the Americas’ First Peopling from a Patrilineal Perspective: New Evidence from the Southern Continent. Genes. 2022; 13(2):220. https://doi.org/10.3390/genes13020220
Chicago/Turabian StyleColombo, Giulia, Luca Traverso, Lucia Mazzocchi, Viola Grugni, Nicola Rambaldi Migliore, Marco Rosario Capodiferro, Gianluca Lombardo, Rodrigo Flores, Monika Karmin, Siiri Rootsi, and et al. 2022. "Overview of the Americas’ First Peopling from a Patrilineal Perspective: New Evidence from the Southern Continent" Genes 13, no. 2: 220. https://doi.org/10.3390/genes13020220