Article

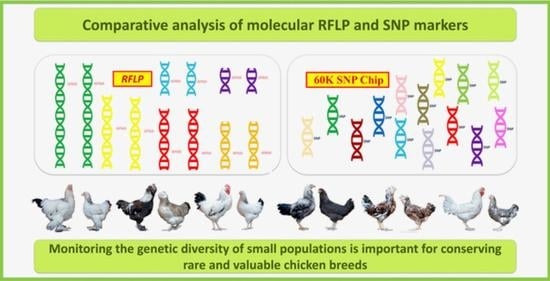
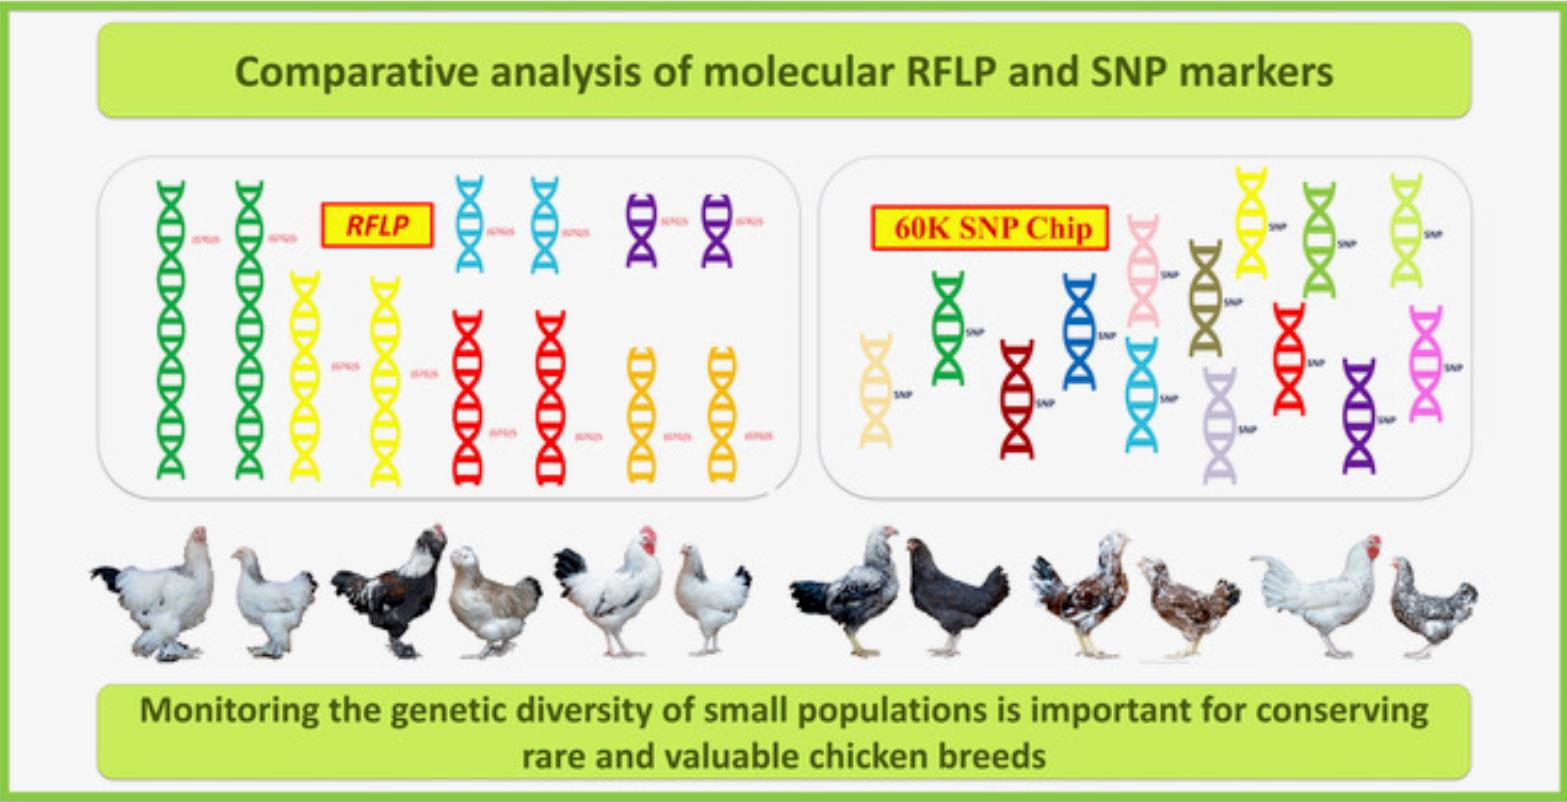
Comparative Analysis of Molecular RFLP and SNP Markers in Assessing and Understanding the Genetic Diversity of Various Chicken Breeds

by
Natalia V. Dementieva
1,*,
Yuri S. Shcherbakov
1,
Valentina I. Tyshchenko
1,
Valeriy P. Terletsky
2,
Anatoly B. Vakhrameev
1,
Olga A. Nikolaeva
1,
Anna E. Ryabova
1,
Anastasiia I. Azovtseva
1,
Olga V. Mitrofanova
1,
Grigoriy K. Peglivanyan
1,
Natalia R. Reinbah
1,
Darren K. Griffin
3 and
Michael N. Romanov
3,*
1
Russian Research Institute of Farm Animal Genetics and Breeding—Branch of the L.K. Ernst Federal Research Centre for Animal Husbandry, Pushkin, 196601 St. Petersburg, Russia
2
Pushkin Leningrad State University, Pushkin, 196605 St. Petersburg, Russia
3
School of Biosciences, University of Kent, Canterbury CT2 7NJ, UK
*
Authors to whom correspondence should be addressed.
Genes 2022, 13(10), 1876; https://doi.org/10.3390/genes13101876
Submission received: 31 August 2022 / Revised: 6 October 2022 / Accepted: 14 October 2022 / Published: 16 October 2022
(This article belongs to the Special Issue Advances in Poultry Genetics and Breeding)

Abstract

:
Monitoring the genetic diversity of small populations is important with respect to conserving rare and valuable chicken breeds, as well as discovery and innovation in germplasm research and application. Restriction fragment length polymorphisms (RFLPs), the molecular markers that underlie multilocus DNA fingerprinting (MLDF), have historically been employed for this purpose, but over the past two decades, there has been an irreversible shift toward high-throughput single-nucleotide polymorphisms (SNPs). In this study, we conducted a comparative analysis of archived MLDF results and new data from whole-genome SNP genotyping (SNPg) among 18 divergently selected breeds representing a large sample of the world gene pool. As a result, we obtained data that fit the general concept of the phylogenetic distribution of the studied breeds and compared them with RFLP and SNP markers. RFLPs were found to be useful markers for retrospective assessment of changes in the genetic architecture and variability underlying the phenotypic variation in chicken populations, especially when samples from previous generations used for MLDF are unavailable for SNPg. These results can facilitate further research necessary to assess the possibility of extrapolating previous MLDF results to study the long-term dynamics of genetic diversity in various small chicken germplasm populations over time. In general, the whole-genome characterization of populations and breeds by multiple SNP loci will further form the basis for the development and implementation of genomic selection with the aim of effective use of the genetic potential of the domestic gene pool in the poultry industry.

Graphical Abstract

1. Introduction

Currently, poultry farming is the most efficient branch of animal husbandry, and domestic chicken (Gallus gallus) is the most common type of poultry [1]. Many years of divergent selection have resulted in a considerable variety of chicken breeds and populations that differ in terms of phenotypic variation, utility type, performance, and unique genetic architecture (e.g., [2,3,4,5]). The goals of gene pool conservation are not only to preserve genetic diversity but also to use individual breeds as sources of valuable genes, variants, and their combinations to develop new lines/breeds and respond to market volatility [6,7,8,9]. An analysis of the genetic variability of breeds is a necessary step for the subsequent successful prediction of the breeding effect (e.g., genomic selection) and to understand the biological mechanism of adaptive and other features of chicken breeds (e.g., [10]).
Modern methods of molecular genetic analysis are rapidly developing and improving (e.g., [11,12,13]). On the other hand, previous studies conducted using genome-wide methods, such as multilocus DNA fingerprinting (MLDF; [14,15]) may remain relevant and appear to be sufficiently accurate to assess and monitor population variability and genetic divergence based on polymorphisms of molecular markers. MLDF is a method used to create genetic “fingerprints” grounded in the analysis of DNA polymorphism in the form of restriction fragment length polymorphism (RFLP) markers (e.g., [16,17,18,19,20]). When performing fingerprinting analysis, an oligonucleotide probe of a repetitive (microsatellite) sequence, e.g., (GTG)5, is used, which, in the course of molecular hybridization with genomic DNA, complementarily binds to minisatellite loci, the size of which varies among individuals [21,22]. Using the method of genomic fingerprinting, it is possible to assess the genetic variability and structure of small gene pool populations, as well as to study the origin of some breeds and genetically identify populations. The limitations of this method include the fact that it can only identify anonymous loci and cannot provide as much information as the modern single-nucleotide polymorphism (SNP) genotyping (SNPg) method. However, data obtained in the past using RFLP markers could be used to control population variability in dynamics by comparing the results of previous studies with new SNP-inferred information, particularly if samples from older generations are unavailable for SNPg.
We have at our disposal numerous breeds and populations of divergently selected chickens maintained in the bioresource collection of the Russian Research Institute of Farm Animal Genetics and Breeding (RRIFAGB) and representing a considerable sample of global chicken breed diversity. Among them, there are such established native breeds as Orloff [23], Pavlov [24,25], Yurlov Crower (YC; [26,27,28]), Poltava Clay (PC; [29,30,31,32]), and Russian White (RW; [33,34,35,36,37]). As a consequence of previous phenotypic, genetic, and phylogenetic studies, we obtained information on the genetic diversity of the bioresource collection breeds [22,38,39,40,41,42] as estimated using the MLDF technique, a (GTG)5 probe, and DNA samples collected from some breeds as long as 10 or even 15 years ago. By 2009, our team had assessed genetic diversity in most of these breeds using this method and pairwise comparison of populations to estimate similarity coefficients within and between populations, genetic distances, and heterozygosity. However, due to the incompleteness of the obtained information (not all pairwise combinations of populations were available) and the lack of a complete phylogenetic analysis, it has become necessary to revise the MLDF data and compare them with recent SNPg results for the same breeds [43,44,45,46]. Tyshchenko et al. [47], preliminarily and on a limited scale, compared the use of MLDF method and SNP technology to evaluate changes in the genetic variability of White Cornish and RW breeds over time. Both techniques for assessing genetic diversity in two chicken populations seemed to yield comparable results, although further large-scale tests are required using a much broader sampling of breeds.
In this regard, the aim of this work was to conduct a comparative analysis of the genomic divergence of breeds obtained by two genome-wide assessment methods, namely a general comparison of MLDF data and the results of analysis conducted using SNP chips for most chicken breeds included in the RRIFAGB bioresource collection. This approach enabled us to track changes in breed diversity dynamics. The corresponding phylogenetic trees were plotted for the investigated breeds based on the employed molecular RFLP and SNP markers, and the trees were comparatively evaluated. Several other genetic and genomic variation characteristics were calculated and discussed for the same breeds that were included in these phylogenetic trees.

2. Materials and Methods

2.1. Animals and DNA Isolation

The subjects of our research were DNA samples obtained from chickens kept in the RRIFAGB collection bioresource farm “Genetic Collection of Rare and Endangered Breeds of Chickens” (Pushkin, St. Petersburg, Russia). Samples for genomic fingerprinting were collected in 2007 from 195 individuals of the following 18 divergently selected breeds/populations (Table 1): Rhode Island Red (RIR), RW, Cochin Blue (CBl), Faverolles Salmon (FS), Moscow Game (MG), New Hampshire (NH), Sussex Light (SL), Uzbek Game (UG), Orloff Mille Fleur (OMF), YC, Pushkin (Pu), Tsarskoye Selo (Ts), Leningrad Golden-and-gray (LGG), Leningrad Mille Fleur (LMF), Zagorsk Salmon (ZS), Pervomai (Pm), Australorp Black Speckled (ABS), and Brahma Light (BL). Samples for genome-wide SNPg were more recently (in 2017) produced from 356 individuals of the same 18 populations (Table 2).
Supplementary Table S1 summarizes population details of the 18 breeds in 2007 and 2017, including population size (total number, i.e., sum of hens and roosters, of 45 to 594), effective population size (25.4 to 299.2), and inbreeding coefficient rate per generation (0.2 to 2.0%). The populations were mainly kept in aviaries, with 45 hens and 5 roosters in small aviaries or 115 hens and 15 roosters in large aviaries. In general, the sex ratio was maintained at 8 hens per rooster. The main mating method was panmixia limited by the selection rate of males at the level of 10–20%. The selection rate of females was not lower than 85%, i.e., only weak and atypical individuals were culled. The remaining shortcomings of hens were corrected by picking the best roosters for them. Groups within a breed were formed if the total population size exceeded 130 heads. Accordingly, the groups were kept in large aviaries of 130 animals (115 hens and 15 roosters) and in small aviaries of 50 animals (45 hens and 5 roosters). The selection of roosters for hens depended on the breeding goal (i.e., homogeneous, heterogeneous, or directionally heterogeneous breeding). When a small number of birds was available in a breed, they were kept in individual cages (i.e., one bird per cage), and individual artificial insemination was used.
Blood samples taken from the brachial wing vein of the studied chicken breeds were used to isolate genomic DNA. Blood samples were collected by qualified laboratory personnel in accordance with the RRIFAGB ethical guidelines to minimize stress or any other disturbance to birds. DNA extraction was performed using the phenol-chloroform method. The quantity and quality of DNA was evaluated using a NanoDrop 2000 spectrophotometer.

2.2. Genotyping and Assessment of Genetic Diversity Using MLDF

The procedure for genetic analysis by MLDF involved a series of steps as described elsewhere (e.g., [20,48]). Briefly, following the enzymatic digestion of DNA with restriction endonuclease HaeIII (or its isoschizomer, BsuRI), electrophoresis of DNA fragments was performed using a Sub-Cell Model 192 horizontal high-throughput electrophoresis system (Bio-Rad Laboratories, Inc., Hercules, CA, USA) for 36 h at 60 V in 0.8% agarose gel with a length of 25 cm. These electrophoresis conditions were unified for all experiments, comparing four breeds on each gel (Figure 1). The size-separated fragments were transferred onto a nylon filter, and DNA was fixed on the filter at 80 °C for 1–2 h. Prehybridization was conducted in a special buffer, followed by molecular hybridization in the same buffer containing a deoxygenin-labeled oligonucleotide probe, (GTG)5, at a concentration of 5 pM/mL. Probe binding sites with immobilized DNA fragments were detected via color reaction with dyes. As a DNA ladder, we used lambda phage DNA restriction fragments produced by cleavage with HindIII and BstEII restriction endonucleases, followed by mixing of the obtained fragments. For improved size control, not two, but up to seven lanes with this DNA marker per gel were used (Figure 1), allowing for a more accurate calculation of the molecular sizes of RFLP bands. The size of RFLP fragments considered in the analysis ranged from 400 to 23,130 bp.
The number and distribution of bands (DNA fragments) on the filter were specific to each individual. Pairwise comparison of all profiles for two different breeds was carried out, and the data were entered into a table for use in calculations. Information on individual filters was combined for the subsequent compilation of a matrix of interbreed distances and the construction of a phylogenetic tree for 18 breeds.
The results of the MLDF analysis were processed using the GELSTATS™ program [49]. Parameters such as FST values (used as genetic distances between breeds and based on band sharing, i.e., the proportion of common DNA fragments within and between breeds [15]) and the mean observed heterozygosity ( H ¯ O ) were estimated [50].
The phylogenetic tree was built using the T-REX web server [51] using the algorithm of tree inference from incomplete matrices and the MW * tree reconstruction method [52].

2.3. Genotyping and Genetic Diversity Assessment Using SNP Chips

The genomic DNA samples were genotyped using chicken 60K SNP BeadChip® DNA chips produced by Illumina for the GWMAS Consortium [53]. All obtained genotypes were filtered by genotyping quality using the PLINK 1.9 program [54]. Genotypes were with quality exceeding 95% were selected for analysis. The following SNP filtering parameters were applied: --maf, 0.05; --geno, 0.02; and --hwa, 0.0001. After filtering, further analyses were performed using 38,711 SNPs located on autosomes GGA1 to GGA28; SNPs located on sex chromosomes were excluded to avoid their influence on subsequent analyses.
Pairwise FST genetic distances were calculated using the EIGENSOFT program [55] based on SNP profiles obtained from whole-genome screening on Illumina Chicken 60K SNP BeadChip® chips (Illumina, San Diego, CA, USA). Observed (HO) and expected heterozygosity (HE), unbiased expected heterozygosity (UHE), allelic diversity (AR), and coefficient of inbreeding (FIS) were calculated in the diveRsity R package [56]. Multidimensional scaling (MDS) analysis was performed, the results of which were visualized in the R environment using the ggplot2 library [57].
A phylogenetic tree for 18 breeds was built using the Neighbor-Net algorithm implemented in SplitsTree v. 4.14.6 [58]. This tree was visualized using iTOL v. 5 [59]. Cluster analysis was performed to determine the structure of populations using the Admixture 1.3 program [60]. The results of the admixture analysis were visualized using the POPHELPER package [61].

3. Results

3.1. MLDF-Based Genetic Diversity

As shown by the results of the genetic diversity study using MLDF, more than 100 DNA fragments per comparison (gel) were detected in the patterns of hybridization of the oligonucleotide probe with chicken genomic DNA (Figure 1). The distribution of these fragments differed between individuals, with a varying probability of occurrence of two individuals having an identical distribution pattern of DNA fragments. This indicator was the lowest in Pu (p = 3.20 × 10⁻⁸) and ZS (p = 2.70 × 10⁻¹¹, in two experiments) and the highest in CBl (p = 2.34 × 10⁻¹⁷), MG (p = 1.30 × 10⁻¹⁷), and YC (p = 1.80 × 10⁻¹⁸).
As shown in Table 1, the most recent experimental populations of Ts and LGG had the highest level of mean heterozygosity ( H ¯ O = 0.82), suggesting increased diversity within these breeds. The highest frequency of occurrence of common DNA fragments was observed in ZS chickens, for which the lowest level of mean heterozygosity was determined ( H ¯ O = 0.54; Table 1). Populations subject to intensive breeding work (e.g., Pushkin, Tsarskoye Selo, Leningrad Golden-and-gray, Leningrad Mille Fleur, and Australorp Black Speckled) tended to demonstrate lower genetic diversity values (Table 1).
The use of multilocus analysis technology made it possible not only to identify intrapopulation differences but also to calculate genetic distances to build a phylogenetic tree that displays the origin and degree of relationship in 18 divergently selected breeds. The resulting tree (Figure 2) had four main branches and several subclusters, including: (1) Asiatic breeds (BL, CBl), (2) a representative of a European root (egg-type RW), (3) dual-purpose breeds/populations bred at the RRIFAGB (LMF, LGG, ABS, Pu, and Ts), and (4) other dual-purpose breeds (RIR, ZS, Pm, SL) and game breeds (UG, MG, and game-related YC and OMF). For instance, based on the genetic distance between the ABS and Pu populations, these breeds were close to each other, which consistent with the history of breeding, as ABS was one of the breeds that used to create Pu.
In addition, as a result of a complementary analysis using MLDF (Supplementary Information S1), the genetic homogeneity of the RW population from the RRIFAGB farm was revealed, which can be explained by the long-term (over tens of generations) intensive selection for certain traits in this population.

3.2. Genetic Diversity Based on SNP Genotypes

The results of the assessment of genetic diversity using DNA chips are shown in Table 2. The lowest HO value was found in the BL population (0.273 ± 0.001) and the highest in the UG population (0.373 ± 0.002). The HE and UHE values were also the lowest in BL (0.253 ± 0.001 and 0.261 ± 0.001, respectively), whereas the highest values were in MG (0.354 ± 0.001 and 0.363 ± 0.001, respectively). The lowest AR value was detected in BL (1.716 ± 0.001), confirming the lower HO and HE values in this breed, and the highest AR value was determined in MG (1.944 ± 0.001). According to the FIS coefficient, almost none of the populations manifested inbreeding.
Pairwise FST genetic distances (Supplementary Table S3) ranged from 0.025 (between MG and NH) to 0.278 (between RW and BL). Visualization of pairwise FST genetic distances (Figure 3) showed genetic relatedness between MG, UG, and YC breeds, as well as between SL and Pm and within a group of Pu, ABS, RW, and LGG chickens. Furthermore, interbreed kinship was found between the breed pairs ZS–FS, CBl–BL, and NH–RIR. Similar patterns of breed similarity were observed on the MDS plot of the distribution of individuals based on SNP genotypes (Figure 4a).

3.3. Admixture Analysis

The calculation of the cross-validation error (CV) in the Admixture cluster analysis showed that the most likely number of clusters (ancestral populations) in our breed sample was 16 (Figure 5), which is somewhat out of line with the number of breeds we examined (18). Admixture analysis at K = 2 (Figure 4b) separated BL, Pu, and RW from other breeds. At K = 3, Pm was isolated, and at K = 4, FS and ZS were singled out (Figure 6). Analysis at higher K values showed that MG and NH carry genetic components of different origin. FS had a high percentage of the ZS breed genotypes. Additionally, some individuals of the UG and YC breeds had genetic components of different origins.

3.4. Comparative Assessment of Variability Determined by MLDF and SNPg Analysis

Figure 7 shows a comparison of the indicators of population heterozygosity generated by the two methods for 18 breeds. The analysis showed certain discrepancies in the assessment of variability. Given the estimated values of MLDF-derived heterozygosity (ln-inferred trend line that is largely similar to the SNP curve in Figure 7), the actual values were greater for BL, FS, LGG, Pu, CBl, ABS, and Ts. On the other hand, heterozygosity indicators for ZS, RW, SL, Pm, and OMF showed lower values. This comparison suggested that heterozygosity assessment by MLDF may not be as accurate as that using SNPg. However, it appears that over approximately a decade of breeding the small, closed-gene-pool populations, heterozygosity tended to decrease.

4. Discussion

In this work, using the multilocus probe (GTG)5, we performed the fingerprint typing of 18 chicken breeds kept in small, closed gene pool flocks. The use of oligonucleotide (microsatellite) probes, including the (GTG)5 probe employed in this study and others, has been widely established in MLDF investigations. For example, Haberfeld et al. [21] explored the following such probes: a clone R18.1 from the bovine genome containing poly (GT) sequences, as well as oligonucleotide probes (GTG)5 and (GT)12. Hybridization of the R18.1 probe with HinfI restricted chicken DNA revealed a highly polymorphic pattern of DNA fingerprinting. In 20 unrelated broilers, an average of 27.8 bands per individual was detected in the range of 3 to 23 kb. Additionally, according to Epplen et al. [22], the best probes to obtain fingerprinting patterns in chickens were (GGAT)4, (GTG)5, and (TCC)5. We suggest that MLDF is the most suitable method when the tendency of similarity of genotypes in one breed is clearly visible when breeding very small groups of animals. For example, in a very small population of BL chickens, we analyzed even in the 1990s, we observed a very low heterozygosity and, most likely, a high degree of inbreeding. The same breed showed a higher heterozygosity estimate in more recent MLDF studies (2009) and lower heterozygosity in the recent SNP survey presented here. Previously, we were only able to partially describe the MLDF results in our studies [39,63,64], whereas additional analysis in the present study (using the algorithm of tree inference from incomplete matrices; [52]) enabled us to fill in all the gaps in the assessment of interbreeding variability and phylogeny.
A comparative evaluation of H ¯ O data obtained using MLDF and variability determined by SNP analysis showed a decline in heterozygosity in the populations of BL, FS, LGG, Pu, CBl, ABS, Ts, and other breeds, possibly due to a decrease in the population size of BL, FS, ABS, Pu, and CBl breeds observed from 2007 to 2017. An intensive selection in the experimental LGG and Ts populations appears to have led to a decrease in their heterozygosity. According to the MLDF data, H ¯ O in ZS, RW, SL, Pm, and OMF was slightly lower, as a result of the effort to restore their genetic diversity, including measures such as individual selection and purchase of breeding eggs from other collections from 2007 to 2017. The importance of monitoring genetic variability for the timely adjustment of breeding priorities in small populations has also been emphasized by other authors [65,66].
As for the MLDF procedure itself, it is well established that it is subject limitations and drawbacks. If it were a universal, comprehensive, highly reliable, straightforward, and highly effective method, it would still be widely used today. However, it has been gradually discontinued since the early 2000s and is rarely revisited. This technique was largely abandoned because it used anonymous loci and was difficult to perform (setting up and conducting one experiment took almost a week), and only few samples could be compared at the same time (as it is desirable to conduct comparisons on the same filter). However, based on our many years of experience (e.g., [47]) and this comparative study, we suggest that MLDF could be an adequate method to compare related breeds or the level of population variability over time. Furthermore, the efficacy of assessment of inbreeding by MLDF is doubtful, and it is disputable that MLDF is an appropriate method that can reliably detect the degree of inbreeding, as we previously showed in another comparative study [47] and as observed in other investigations [67,68,69,70].
Nevertheless, in this work, we found a suitable way to analyze previous fingerprints and build the corresponding phylogenetic tree using the tree inference from incomplete matrices for 18 divergently selected breeds surveyed in the 2000s. The resulting tree topology (Figure 2) was largely congruent to that for the trees that were constructed based on the SNPg data of the same 18 populations (Figure 3). This topology also echoed the phylogeny that was produced by Larkina et al. [71] for the same breeds. Therefore, in phylogenetic terms, it seems reasonable to suggest that an obsolete MLDF method was adequate to compare variability between breeds and populations in dynamics. Therefore, the phylogenetic results described here enabled the evaluation of the effectiveness of analysis based on DNA fingerprints and SNP markers in a comparative aspect. To the best of our knowledge, such an analysis of the domestic gene pool (more precisely, an extensive sample of the world gene pool) has not been performed to date. In the previous study [71], we only slightly attempted to approach such a comparative analysis but using different datasets, i.e., in terms of multiple phenotypic traits and five SNPs at a single locus.
The two phylogenetic trees generated with RFLP markers (Figure 2) and SNPs (Figure 3) had a number of significant overlaps. There were also differences that could occur for two main reasons. First, SNP markers provide more extensive genome coverage and a more accurate display of genomic variability. Second, there were several gaps in the RFLP data, which (although they were filled virtually using a computer algorithm) could become an additional source of errors in the reconstruction of phylogenetic relationships.
The presented analysis of two approaches to assess genetic diversity provides a deeper understanding of the features of the genomic architecture of chicken breeds and populations. In addition, we compared the degree of variability within populations using two methods and correlated the results with historical breed data. The two approaches used in our study to assess genetic relatedness between chicken populations revealed differences between Asiatic breeds (e.g., BL and CBl) and genetically rooted light-layer breeds, such as RW and Pu. Similar results were reported in a study by Malomane et al. [72].
The optimal probable number of admixture-inferred clusters (i.e., 16 ancestral populations; Figure 5) did not match the actual number of breeds we explored (18), possibly due to problems in the breeding process of different breeds related to the occurrence of random, unplanned crossings between populations similar in phenotype. At K = 2 (Figure 4b), the Asiatic meat BL breed was clearly distinguished, as well as two breeds of RW and Pu descended from White Leghorns that represent the egg-layer (Mediterranean) ancestral type. The rest of the breeds had varying proportions of genomic “mixing” of these two ancestral types. Thus, at K = 2, we have a subdivision of all the studied breeds in strict accordance with the two primary evolutionary branches of chicken breed formation as was postulated by Moiseyeva et al. [62]. At K = 3 (Figure 6), a third ancestral type was added that most likely conforms to the dual-purpose breeds proposed by Larkina et al. [71] as another major evolutionary breed-formation branch. Accordingly, the following four groups of populations can be distinguished: (1) meat-type BL, as well as CBl and FS with meat-type “impurities”; (2) egg-type RW and Pu, with adjoining experimental populations of LGG and ABS; (3) typical dual-purpose breeds SL and Pm (which, due to the common Columbian plumage coloration, could also interbreed uncontrollably); and (4) all other breeds showing a varied degree of mixed ancestry. Separation of FS and ZS at K = 4 that were partially unseparated at K = 8 evidenced an admixture of ZS genotypes in the FS population. Analysis at the maximum K values showed that MG and NH carry numerous genetic components of differing origins, possibly as a result of significant random mixing of the two breeds with each other and with other breeds. The discovery of such introgression of breeds is common in poultry breeding; many researchers studying the genetic diversity of chicken breeds and populations have reached similar conclusions (e.g., [2,3,73]).
Additionally, some individuals of the UG and YC breeds had genetic components of different origins, indicating the need for further study of these breeds. The first of these is a game breed, and the second has game chicken roots in its origin. The game type also stands out as an independent evolutionary branch of domestic chicken breeding according to the concept proposed by Moiseyeva et al. [62]; therefore, in general, we can suggest that in the present study, there was a formation of a separate cluster that consisted of game and related chicken breeds. This suggestion is also supported by our phylogenetic/clustering models (Figure 2, Figure 3 and Figure 4), which generally showed genetic relationships between these breeds, including MG, UG, YC, and OMF. A close relationship between the following pairs (groups) of breeds can be observed in the admixture bar plots, phylogenetic trees, and MDS plot: (1) SL and Pm, which were partly interbred; (2) a group of layers and related breeds, including RW, Pu, ABS, and LGG; (3) a branch of Asiatic breeds CBl and BL; (4) ZS and FS, which (as previously noted) also merged into a separate subcluster; and (5) related populations of NH and RIR, with NH exhibiting significant interbreeding in its demographic history.
Collectively, when comparing phylogenies from MLDF and genome-wide SNPg, a clear concept of the distribution within this large global sample of chicken breeds can be tracked, which conforms to known models of their evolutionary subdivision [62,71]. On the other hand, there were also discrepancies: for example, in the tree plotted on the basis of the SNPg results (Figure 3), BL was in the same subcluster with CBl, whereas FS was clustered with ZS; however, in the MLDF-inferred tree BL was placed on the same branch with CBl and FS (Figure 2). Furthermore, as shown in Figure 2, RW was located largely apart from the rest of the breeds, whereas in Figure 3 this breed was situated next to Pu, ABS, and LGG, probably due to the common roots of origin and the focus of selection in these populations on egg production, which was better displayed using a more advanced SNPg method.

5. Conclusions

In the present study, we attempted to assess the biodiversity of a large number of chicken breeds from the RRIFAGB bioresource collection. In genetic and phylogenetic studies of 18 divergently selected breeds, we not only assessed the general phylogeny of breeds but also considered how two types of markers were able to reflect these phylogenetic relationships. On the basis of MLDF data, we obtained a matrix of interbreed distances, calculated population genetic indicators characterizing the genetic variability of breeds, and built phylogenetic trees and cluster models. Our analysis results show that the MLDF method remains a fairly accurate method for retrospective analysis of changes in the genetic divergence of populations over time, although the method itself is already very outdated. Although there are examples of comparisons of multilocus DNA fingerprints and microsatellites to determine genetic distances in chicken [19], such a comparison of RFLP and SNP markers within the same work, to the best of our knowledge, has not been carried out to day (except for our limited preliminary survey of two breeds; [47]). Therefore, this comparative aspect was somewhat novel in phylogeny studies of chickens. The estimates of genetic diversity obtained as a result of the analysis of two approaches provides a deeper understanding of the features of the genomic architecture of chicken breeds and populations. In addition, we emphasize the particular importance of constantly monitoring the variability of small-gene-pool populations and comparing these results with data on the origin and demographic history of breeds in order to develop the most effective germplasm innovation strategy.

Supplementary Materials

The following supporting information can be downloaded at: https://www.mdpi.com/article/10.3390/genes13101876/s1, Supplementary Information S1: Evaluation of the genetic variation in Russian White chickens using DNA fingerprinting; Supplementary Information S2: Newick format for representation of phylogenetic trees; Table S1: Population characteristics of the chicken germplasm breeds in 2007 and 2017 [74,75]; Table S2: Pairwise genetic FST distances between the 18 studied chicken breeds based on multilocus DNA fingerprinting; Table S3: Pairwise genetic FST distances between the 18 studied chicken breeds based on SNP genotypes.

Author Contributions

Conceptualization, N.V.D. and M.N.R.; methodology, V.P.T., N.V.D. and M.N.R.; software, Y.S.S. and M.N.R.; validation, O.A.N. and M.N.R.; formal analysis, V.I.T. and M.N.R.; investigation, O.V.M., V.P.T. and A.B.V.; resources, A.E.R. and A.I.A.; data curation, N.R.R.; writing—original draft preparation, N.V.D., Y.S.S., G.K.P. and M.N.R.; writing—review and editing, D.K.G. and M.N.R.; visualization, A.B.V., Y.S.S. and M.N.R.; supervision, M.N.R.; project administration, N.V.D.; funding acquisition, N.V.D. All authors have read and agreed to the published version of the manuscript.

Funding

This research was funded by the Ministry of Science and Higher Education of the Russian Federation (grant no. 075-15-2021-1037; internal no. 15.BRK.21.0001).

Institutional Review Board Statement

The study was conducted according to the guidelines of the Declaration of Helsinki and approved by the Institutional Review Board of the Russian Research Institute of Farm Animal Genetics and Breeding—Branch of the L. K. Ernst Federal Research Center for Animal Husbandry (Protocol No. 2020-4 dated 3 March 2020).

Informed Consent Statement

Not applicable.

Data Availability Statement

The MLDF genotyping datasets are available from the figshare repository: https://doi.org/10.6084/m9.figshare.20736760 (accessed on 13 October 2022). The proprietary SNP genotyping data produced and analyzed in this study were generated using the 60K chicken SNP chip produced by Illumina Inc. for the GWMAS Consortium represented by Cobb-Vantress Inc. and Hendrix Genetics B.V. As such, the datasets generated using this chip are confidential and protected as intellectual property or as trade secrets. As a consequence, the SNP genotyping information used in this study was not made public but is kept in a secure database at the RRIFAGB. However, the data can be provided upon reasonable request and can be shared with third parties upon approval from the GWMAS Consortium. The authors affirm that all other data necessary to confirm conclusions reported in this article are present within the article, figures, and tables.

Acknowledgments

We thank the USDA Chicken GWMAS Consortium, Cobb-Vantress Inc., and Hendrix Genetics B.V. for access to the developed 60K chicken SNP chip produced by Illumina Inc. for the GWMAS Consortium. The skilled technical assistance of Olga M. Romanova in preparing Figure 4 and Figure 6 is kindly appreciated.

Conflicts of Interest

The authors declare no conflict of interest. The funders had no role in the design of the study; in the collection, analyses, or interpretation of data; in the writing of the manuscript; or in the decision to publish the results.

References

  1. Romanov, M.N.; Sazanov, A.A.; Moiseyeva, I.G.; Smirnov, A.F. Poultry. In Genome Mapping and Genomics in Animals, Volume 3: Genome Mapping and Genomics in Domestic Animals; Cockett, N.E., Kole, C., Eds.; Springer: Berlin, Heidelberg, Germany, 2009; pp. 75–141. [Google Scholar]
  2. Chen, L.; Wang, X.; Cheng, D.; Chen, K.; Fan, Y.; Wu, G.; You, J.; Liu, S.; Mao, H.; Ren, J. Population genetic analyses of seven Chinese indigenous chicken breeds in a context of global breeds. Anim. Genet. 2019, 50, 82–86. [Google Scholar] [CrossRef] [PubMed] [Green Version]
  3. Lawal, R.A.; Hanotte, O. Domestic chicken diversity: Origin, distribution, and adaptation. Anim. Genet. 2021, 52, 385–394. [Google Scholar] [CrossRef] [PubMed]
  4. Malomane, D.K.; Weigend, S.; Schmitt, A.O.; Weigend, A.; Reimer, C.; Simianer, H. Genetic diversity in global chicken breeds in relation to their genetic distances to wild populations. Genet. Sel. Evol. 2021, 53, 36. [Google Scholar] [CrossRef] [PubMed]
  5. Romanov, M.N. Using Phenetic Approaches for Studying Poultry Populations under Preservation and Breeding. In Gene Mapping, Polymorphisms, Disease Genetic Markers, Marker Assisted Selection, Gene Expression, Transgenes, Non-Conventional Animal Products, Conservation Genetics, Conservation of Domestic Animal Genetic Resources, Proceedings of the 5th World Congress on Genetics Applied to Livestock Production, Guelph, Canada, 7–12 August 1994; International Committee for World Congresses on Genetics applied to Livestock Production, University of Guelph: Guelph, Canada, 1994; Volume 21, pp. 556–559. [Google Scholar]
  6. Weigend, S.; Romanov, M.N. Current Strategies for the Assessment and Evaluation of Genetic Diversity in Chicken Resources. In Proceedings of the Abstracts and Proceedings of the XXI World’s Poultry Congress, Montreal, Canada, 20–24 August 2000 (CD-ROM); WPSA: Montreal, Canada, 2000. [Google Scholar]
  7. Tagirov, M.T.; Tereshchenko, L.V.; Tereshchenko, A.V. Substantiation of the possibility of using primary germ cells as material for the preservation of poultry genetic resources. Ptakhivnytstvo 2006, 58, 464–473. [Google Scholar]
  8. Tagirov, M.; Artemenko, A.; Tereshchenko, A. Preservation of the poultry gene pool by cryoconservation. Agrar. Solut. 2010, 10. [Google Scholar]
  9. Tereshchenko, O.V.; Katerinich, O.O.; Pankova, S.M.; Borodai, V.P. Formation of genetic resources of domestic breeds of poultry in the context of food security of the state. Sučasne Ptahìvnictvo 2015, 7–8, 19–21. [Google Scholar]
  10. Lee, M.O.; Romanov, M.N.; Plemyashov, K.V.; Dementieva, N.V.; Mitrofanova, O.V.; Barkova, O.Y.; Womack, J.E. Haplotype structure and copy number polymorphism of the β-defensin 7 genes in diverse chicken breeds. Anim. Genet. 2017, 48, 490–492. [Google Scholar] [CrossRef] [Green Version]
  11. Mitrofanova, O.V.; Tyshchenko, V.I.; Dement’eva, N.V.; Terletskii, V.P. Investigation of the characteristics of genetic heterogeneity of chicken breeds and experimental populations on the basis of DNA polymorphism analysis. Russ. Agricult. Sci. 2007, 33, 391–393. [Google Scholar] [CrossRef]
  12. Weigend, S.; Romanov, M.N.; Rath, D. Methodologies to Identify, Evaluate and Conserve Poultry Genetic Resources. In Participant List & Full Text CD + Book of Abstracts, Proceedings of the XXII World’s Poultry Congress & Exhibition, Istanbul, Turkey, 8–13 June 2004; WPSA—Turkish Branch: Istanbul, Turkey, 2004; p. 84. [Google Scholar]
  13. Weigend, S.; Romanov, M.N.; Ben-Ari, G.; Hillel, J. Overview on the Use of Molecular Markers to Characterize Genetic Diversity in Chickens. In Participant List & Full Text CD + Book of Abstracts, Proceedings of the XXII World’s Poultry Congress & Exhibition, Istanbul, Turkey, 8–13 June 2004; WPSA—Turkish Branch: Istanbul, Turkey, 2004; p. 192. [Google Scholar]
  14. Lynch, M. The similarity index and DNA fingerprinting. Mol. Biol. Evol. 1990, 7, 478–484. [Google Scholar] [CrossRef] [Green Version]
  15. Lynch, M. Analysis of population genetic structure by DNA fingerprinting. In DNA Fingerprinting: Approaches and Applications; Birkhauser Verlag: Basel, Switzerland, 1991; pp. 113–126. [Google Scholar]
  16. Dunnington, E.A.; Gal, O.; Plotsky, Y.; Haberfeld, A.; Kirk, T.; Goldberg, A.; Lavi, U.; Cahaner, A.; Siegel, P.B.; Hillel, J. DNA fingerprints of chickens selected for high and low body weight for 31 generations. Anim. Genet. 1990, 21, 247–257. [Google Scholar] [CrossRef]
  17. Dunnington, E.A.; Stallard, L.C.; Hillel, J.; Siegel, P.B. Genetic diversity among commercial chicken populations estimated from DNA fingerprints. Poult. Sci. 1994, 73, 1218–1225. [Google Scholar] [CrossRef] [PubMed]
  18. Debenham, P.G. DNA fingerprinting. J. Pathol. 1991, 164, 101–106. [Google Scholar] [CrossRef] [PubMed]
  19. Ponsuksili, S.; Wimmers, K.; Schmoll, F.; Horst, P.; Schellander, K. Comparison of multilocus DNA fingerprints and microsatellites in an estimate of genetic distance in chicken. J. Hered. 1999, 90, 656–659. [Google Scholar] [CrossRef] [PubMed]
  20. Tyshchenko, V.I.; Dement’eva, N.V.; Terletskii, V.P.; Yakovlev, A.F. Assessment of genetic diversity in chicken populations based on genomic fingerprinting. Agric Biol. 2002, 37, 43–46. [Google Scholar]
  21. Haberfeld, A.; Cahaner, A.; Yoffe, O.; Plotsky, Y.; Hillel, J. DNA fingerprints of farm animals generated by microsatellite and minisatellite DNA probes. Anim. Genet. 1991, 22, 299–305. [Google Scholar] [CrossRef]
  22. Epplen, J.T.; Ammer, H.; Epplen, C.; Kammerbauer, C.; Mitreiter, R.; Roewer, L.; Schwaiger, W.; Steimle, V.; Zischler, H.; Albert, E.; et al. Oligonucleotide fingerprinting using simple repeat motifs: A convenient, ubiquitously applicable method to detect hypervariability for multiple purposes. Exp. Suppl. 1991, 58, 50–69. [Google Scholar] [CrossRef] [Green Version]
  23. Moiseyeva, I.G.; Sevastyanova, A.A.; Aleksandrov, A.V.; Vakhrameev, A.B.; Romanov, M.N.; Dmitriev, Y.I.; Semenova, S.K.; Sulimova, G.E. Orloff chicken breed: History, current status and studies. Proc. Timiryazev Agric. Acad. 2016, 1, 78–96. [Google Scholar]
  24. Moiseyeva, I.G.; Corti, E.; Romanov, M.N. Polydactyly in chickens. In Advances in Modern Poultry Science, Proceedings of the 16th International Conference, Sergiyev Posad, Russia, 19–21 May 2009; WPSA, RAAS, Poultry Science and Technology Institute: Sergiyev Posad, Russia, 2009; pp. 51–53. [Google Scholar]
  25. Corti, E.; Moiseyeva, I.G.; Romanov, M.N. Five-toed chickens: Their origin, genetics, geographical spreading and history. Proc. Timiryazev Agric. Acad. 2010, 7, 156–170. [Google Scholar]
  26. Moiseyeva, I.G.; Nikiforov, A.A.; Romanov, M.N.; Aleksandrov, A.V.; Moysyak, Y.V.; Semyenova, S.K. Origin, history, genetics and economic traits of the Yurlov Crower chicken breed. In Elektronnyi Zhurnal [Electronic Journal]; Laboratory of Animal Comparative Genetics, N.I. Vavilov Institute of General Genetics: Moscow, Russia, 2007; Available online: https://web.archive.org/web/20120210170800/http://www.lab-cga.ru/articles/Yurlovskaya/Yurlovskaya.htm (accessed on 22 August 2022).
  27. Moiseyeva, I.G.; Romanov, M.N.; Aleksandrov, A.V.; Nikiforov, A.A.; Sevastyanova, A.A. Evolution and genetic diversity of old domestic hen’s breed–Yurlovskaya Golosistaya: System analysis of variability forms. Proc. Timiryazev Agric. Acad. 2009, 3, 132–147. [Google Scholar]
  28. Moiseyeva, I.G.; Sevastyanova, A.A.; Aleksandrov, A.V.; Romanov, M.N. Singing breeds of hens. Priroda 2011, 4, 10–18. [Google Scholar]
  29. Romanov, M.N.; Bondarenko, Y.V. Introducing the Ukrainian indigenous poultry—The Poltava chickens. Fancy Fowl 1994, 14, 8–9. [Google Scholar]
  30. Moiseyeva, I.G.; Kovalenko, A.T.; Mosyakina, T.V.; Romanov, M.N.; Bondarenko, Y.V.; Kutnyuk, P.I.; Podstreshny, A.P.; Nikiforov, A.A.; Tkachik, T.E. Origin, history, genetics and economic traits of the Poltava chicken breed. In Elektronnyi Zhurnal [Electronic Journal]; Laboratory of Animal Comparative Genetics, N.I. Vavilov Institute of General Genetics: Moscow, Russia, 2006; Issue 4; Available online: https://web.archive.org/web/20120205195904/http://www.lab-cga.ru/articles/Jornal04/Statia2.htm (accessed on 22 August 2022).
  31. Moiseyeva, I.G.; Romanov, M.N.; Kovalenko, A.T.; Mosyakina, T.V.; Bondarenko, Y.V.; Kutnyuk, P.I.; Podstreshny, A.P.; Nikiforov, A.A. The Poltava chicken breed of Ukraine: Its history, characterization and conservation. Anim. Genet. Resour. Inf. 2007, 40, 71–78. [Google Scholar] [CrossRef] [Green Version]
  32. Kulibaba, R.; Tereshchenko, A. Transforming growth factor β1, pituitary-specific transcriptional factor 1 and insulin-like growth factor I gene polymorphisms in the population of the Poltava clay chicken breed: Association with productive traits. Agric. Sci. Pract. 2015, 2, 67–72. [Google Scholar] [CrossRef]
  33. Dementeva, N.V.; Romanov, M.N.; Kudinov, A.A.; Mitrofanova, O.V.; Stanishevskaya, O.I.; Terletsky, V.P.; Fedorova, E.S.; Nikitkina, E.V.; Plemyashov, K.V. Studying the structure of a gene pool population of the Russian White chicken breed by genome-wide SNP scan. Agric. Biol. 2017, 52, 1166–1174. [Google Scholar] [CrossRef] [Green Version]
  34. Dementeva, N.V.; Kudinov, A.A.; Mitrofanova, O.V.; Stanishevskaya, O.I.; Fedorova, E.S.; Romanov, M.N. Genome-wide association study of reproductive traits in a gene pool breed of the Russian White chickens. Reprod. Domest. Anim. 2018, 53 (Suppl. 2), 123–124. [Google Scholar] [CrossRef]
  35. Kudinov, A.A.; Dementieva, N.V.; Mitrofanova, O.V.; Stanishevskaya, O.I.; Fedorova, E.S.; Larkina, T.A.; Mishina, A.I.; Plemyashov, K.V.; Griffin, D.K.; Romanov, M.N. Genome-wide association studies targeting the yield of extraembryonic fluid and production traits in Russian White chickens. BMC Genomics 2019, 20, 270. [Google Scholar] [CrossRef]
  36. Dementieva, N.V.; Fedorova, E.S.; Krutikova, A.A.; Mitrofanova, O.V.; Stanishevskaya, O.I.; Pleshanov, N.V.; Smaragdov, M.G.; Kudinov, A.A.; Terletsky, V.P.; Romanov, M.N. Genetic variability of indels in the prolactin and dopamine receptor D2 genes and their association with the yield of allanto-amniotic fluid in Russian White laying hens. Tarım Bilim. Derg.-J. Agric. Sci. 2020, 26, 373–379. [Google Scholar] [CrossRef]
  37. Abdelmanova, A.S.; Dotsev, A.V.; Romanov, M.N.; Stanishevskaya, O.I.; Gladyr, E.A.; Rodionov, A.N.; Vetokh, A.N.; Volkova, N.A.; Fedorova, E.S.; Gusev, I.V.; et al. Unveiling comparative genomic trajectories of selection and key candidate genes in egg-type Russian White and meat-type White Cornish chickens. Biology 2021, 10, 876. [Google Scholar] [CrossRef]
  38. Tyshchenko, V.I. Analysis of Genetic Diversity in Breeds and Experimental Populations of Chickens Using DNA Fingerprinting. Candidate of Biological Sciences Thesis and Abstract, VAK Specialty 03.00.15]; RRIFAGB: St. Petersburg, Russia, 2002. [Google Scholar]
  39. Tyshchenko, V.I.; Mitrofanova, O.V.; Dement’eva, N.V.; Terletskii, V.P.; Yakovlev, A.F. Estimation of genetic variability in the breeds and hen experimental populations by DNA-fingerprinting. Agric. Biol. 2007, 42, 29–33. [Google Scholar]
  40. Tyshchenko, V.I.; Dementieva, N.V.; Terletskii, V.P.; Yakovlev, A.F. Genetic diversity of the chicken gene pool breeds of the SRI RRIFAGB experimental farm. In Collection of the SRI RRIFAGB Works; RRIFAGB: St. Petersburg, Russia, 2011; p. 128. [Google Scholar]
  41. Yakovlev, A.F.; Dementieva, N.V.; Tyshchenko, V.I.; Terletskii, V.P. Genetic Diversity and Divergence of Gene Pool Breeds of Chickens. In Collection of the SRI RRIFAGB Scientific Works, Proceedings of the Scientific Conference Dedicated to the 70th Anniversary of the Institute “Genetics and Breeding in Animal Husbandry: Yesterday, Today, Tomorrow”, St. Petersburg–Pushkin, Russia, 9–11 June 2010; RRIFAGB: Pushkin, Russia, 2010; p. 153. [Google Scholar]
  42. Tyshchenko, V.I. Molecular Genetic Analysis of Intrapopulation Variability in a Gene Pool Pavlov Chicken Breed. Research in the Field of Natural Sciences [Electronic Resource]. 2015. Available online: https://science.snauka.ru/2015/06/10140 (accessed on 22 August 2022).
  43. Romanov, M.N.; Dementyeva, N.V.; Terletsky, V.P.; Plemyashov, K.V.; Stanishevskaya, O.I.; Kudinov, A.A.; Perinek, O.Y.; Fedorova, E.S.; Larkina, T.A.; Pleshanov, N.V. Applying SNP array technology to assess genetic diversity in Russian gene pool of chickens. In Proceedings of the International Plant and Animal Genome XXV Conference, San Diego, CA, USA, 14–18 January 2017; Scherago International: San Diego, CA, USA, 2017. Abstract P0115. [Google Scholar]
  44. Dementieva, N.V.; Mitrofanova, O.V.; Kudinov, A.A.; Smaragdov, M.G.; Yakovlev, A.F.; Romanov, M.N. Pportunities of SNP-genotyping for studying the features of the genetic architecture of chicken populations with different histories. In World and Russian Trends in Development of Poultry Industry: Realities and Challenges of Future, Proceedings of the 19th International Conference, Sergiyev Posad, Russia, 15–17 May 2018; WPSA, Poultry Research Centre, Poultry Science and Technology Institute: Sergiyev Posad, Russia, 2018; pp. 80–81. [Google Scholar]
  45. Dementieva, N.V.; Kudinov, A.A.; Larkina, T.A.; Mitrofanova, O.V.; Dysin, A.P.; Terletsky, V.P.; Tyshchenko, V.I.; Griffin, D.K.; Romanov, M.N. Genetic variability in local and imported germplasm chicken populations as revealed by analyzing runs of homozygosity. Animals 2020, 10, 1887. [Google Scholar] [CrossRef]
  46. Dementieva, N.V.; Mitrofanova, O.V.; Dysin, A.P.; Kudinov, A.A.; Stanishevskaya, O.I.; Larkina, T.A.; Plemyashov, K.V.; Griffin, D.K.; Romanov, M.N.; Smaragdov, M.G. Assessing the effects of rare alleles and linkage disequilibrium on estimates of genetic diversity in the chicken populations. Animal 2021, 15, 100171. [Google Scholar] [CrossRef] [PubMed]
  47. Tyshchenko, V.I.; Mitrofanova, O.V.; Dementeva, N.V.; Terletskiy, V.P.; Novikova, O.B. Molecular genetic evaluation of variability in chicken populations of Cornish and Russian White breeds. Mod. Sci. Res. Dev. 2018, 9, 394–398. [Google Scholar]
  48. Yelubayeva, M.E.; Buralkhiyev, B.A.; Tyshchenko, V.I.; Terletskiy, V.P.; Ussenbekov, Y.S. Results of Camelus dromedarius and Camelus bactrianus genotyping by α-S1-casein, kappa-casein loci, and DNA fingerprinting. Cytol. Genet. 2018, 52, 179–185. [Google Scholar] [CrossRef]
  49. Rogstad, S.H.; Pelikan, S. GELSTATS: A computer program for population genetics analyses using VNTR multilocus probe data. Biotechniques 1996, 21, 1128–1131. [Google Scholar] [CrossRef]
  50. Stephens, J.C.; Gilbert, D.A.; Yuhki, N.; O’Brien, S.J. Estimation of heterozygosity for single-probe multilocus DNA fingerprints. Mol. Biol. Evol. 1992, 9, 729–743. [Google Scholar] [CrossRef] [Green Version]
  51. Boc, A.; Diallo, A.B.; Makarenkov, V. T-REX: A web server for inferring, validating and visualizing phylogenetic trees and networks. Nucleic Acids Res. 2012, 40, W573–W579. [Google Scholar] [CrossRef] [Green Version]
  52. Makarenkov, V.; Lapointe, F.J. A weighted least-squares approach for inferring phylogenies from incomplete distance matrices. Bioinformatics 2004, 20, 2113–2121. [Google Scholar] [CrossRef] [Green Version]
  53. Groenen, M.A.M.; Megens, H.J.; Zare, Y.; Warren, W.C.; Hillier, L.W.; Crooijmans, R.P.M.A.; Vereijken, A.; Okimoto, R.; Muir, W.M.; Cheng, H.H. The development and characterization of a 60K SNP chip for chicken. BMC Genomics 2011, 12, 274. [Google Scholar] [CrossRef] [Green Version]
  54. Purcell, S.; Neale, B.; Todd-Brown, K.; Thomas, L.; Ferreira, M.A.; Bender, D.; Maller, J.; Sklar, P.; de Bakker, P.I.; Daly, M.J.; et al. PLINK: A tool set for whole-genome association and population-based linkage analyses. Am. J. Hum. Genet. 2007, 81, 559–575. [Google Scholar] [CrossRef] [Green Version]
  55. Patterson, N.; Price, A.L.; Reich, D. Population structure and eigenanalysis. PLoS Genet. 2006, 2, e190. [Google Scholar] [CrossRef]
  56. Keenan, K.; McGinnity, P.; Cross, T.F.; Crozier, W.W.; Prodohl, P.A. diveRsity: An R package for the estimation and exploration of population genetics parameters and their associated errors. Methods Ecol. Evol. 2013, 4, 782–788. [Google Scholar] [CrossRef]
  57. Wickham, H. ggplot2: Elegant Graphics for Data Analysis; Springer: New York, NY, USA, 2009. [Google Scholar] [CrossRef]
  58. Huson, D.H.; Bryant, D. Application of phylogenetic networks in evolutionary studies. Mol. Biol. Evol. 2006, 23, 254–267. [Google Scholar] [CrossRef] [PubMed]
  59. Letunic, I.; Bork, P. Interactive Tree Of Life (iTOL) v5: An online tool for phylogenetic tree display and annotation. Nucleic Acids Res. 2021, 49, W293–W296. [Google Scholar] [CrossRef] [PubMed]
  60. Alexander, D.H.; Novembre, J.; Lange, K. Fast model-based estimation of ancestry in unrelated individuals. Genome Res. 2009, 19, 1655–1664. [Google Scholar] [CrossRef] [PubMed] [Green Version]
  61. Francis, R.M. pophelper: An R package and web app to analyse and visualize population structure. Mol. Ecol. Resour. 2017, 17, 27–32. [Google Scholar] [CrossRef] [PubMed] [Green Version]
  62. Moiseyeva, I.G.; Romanov, M.N.; Nikiforov, A.A.; Sevastyanova, A.A.; Semyenova, S.K. Evolutionary relationships of Red Jungle Fowl and chicken breeds. Genet. Sel. Evol. 2003, 35, 403–423. [Google Scholar] [CrossRef] [Green Version]
  63. Yakovlev, A.F.; Tyshenko, V.I.; Dement’eva, N.V.; Mitrofanova, O.V.; Terletskii, V.P.; Kolosov, N.V. Divergence of Leningrad-bred chicken breeds. Russ. Agricult. Sci. 2010, 36, 299–302. [Google Scholar] [CrossRef]
  64. Yakovlev, A.F.; Tyshchenko, V.I.; Dement’eva, N.V.; Mitrofanova, O.V.; Terletskii, V.P.; Vakhrameev, A.B. Intra- and interbreed heterogeneity and divergence in four hen breeds, having genetic roots of fighting bird. Agric. Biol. 2011, 46, 52–56. [Google Scholar]
  65. Palinkas-Bodzsar, N.; Sztan, N.; Molnar, T.; Hidas, A. Gene conservation of six Hungarian local chicken breeds maintained in small populations over time. PLoS ONE 2020, 15, e0238849. [Google Scholar] [CrossRef]
  66. Cendron, F.; Mastrangelo, S.; Tolone, M.; Perini, F.; Lasagna, E.; Cassandro, M. Genome-wide analysis reveals the patterns of genetic diversity and population structure of 8 Italian local chicken breeds. Poult. Sci. 2021, 100, 441–451. [Google Scholar] [CrossRef]
  67. Kuhnlein, U.; Dawe, Y.; Zadvorny, D.; Gavora, J.S. DNA fingerprinting: A tool for determining genetic distances between strains of poultry. Theor. Appl. Genet. 1989, 77, 669–672. [Google Scholar] [CrossRef] [PubMed]
  68. Zhu, J.; Nestor, K.E.; Moritsu, Y. Relationship between band sharing levels of DNA fingerprints and inbreeding coefficients and estimation of true inbreeding in turkey lines. Poult. Sci. 1996, 75, 25–28. [Google Scholar] [CrossRef] [PubMed]
  69. Ye, X.; Zhu, J.; Velleman, S.G.; Nestor, K.E. Genetic diversity of commercial turkey primary breeding lines as estimated by DNA fingerprinting. Poult. Sci. 1998, 77, 802–807. [Google Scholar] [CrossRef] [PubMed]
  70. Sreekumar, G.P.; Smyth, J.R., Jr.; Ponce de Leon, F.A. Molecular characterization of the Smyth chicken sublines and their parental controls by RFLP and DNA fingerprint analysis. Poult. Sci. 2001, 80, 1–5. [Google Scholar] [CrossRef] [PubMed]
  71. Larkina, T.A.; Barkova, O.Y.; Peglivanyan, G.K.; Mitrofanova, O.V.; Dementieva, N.V.; Stanishevskaya, O.I.; Vakhrameev, A.B.; Makarova, A.V.; Shcherbakov, Y.S.; Pozovnikova, M.V.; et al. Evolutionary subdivision of domestic chickens: Implications for local breeds as assessed by phenotype and genotype in comparison to commercial and fancy breeds. Agriculture 2021, 11, 914. [Google Scholar] [CrossRef]
  72. Malomane, D.K.; Simianer, H.; Weigend, A.; Reimer, C.; Schmitt, A.O.; Weigend, S. The SYNBREED chicken diversity panel: A global resource to assess chicken diversity at high genomic resolution. BMC Genom. 2019, 20, 345. [Google Scholar] [CrossRef] [Green Version]
  73. Nie, C.; Almeida, P.; Jia, Y.; Bao, H.; Ning, Z.; Qu, L. Genome-wide single-nucleotide polymorphism data unveil admixture of Chinese indigenous chicken breeds with commercial breeds. Genome Biol. Evol. 2019, 11, 1847–1856. [Google Scholar] [CrossRef]
  74. Kliman, R.; Sheehy, B.; Schultz, J. Genetic drift and effective population size. Nat. Educ. 2008, 1, 3. [Google Scholar]
  75. Falconer, D.S. Introduction to Quantitative Genetics, 3rd ed.; Longman: New York, NY, USA, 1989. [Google Scholar]
Figure 1. Exemplary multilocus DNA fingerprinting filter generated for within- and between-breed biodiversity evaluation using anonymous RFLP markers in four chicken breeds. DNA fragments resulted from restriction with HaeIII (or BsuRI), followed by probing with digoxigenin-labelled oligonucleotide (GTG)5. Lanes 1, 12, 23, 35, and 47: DNA ladder (see details in the Section 2.2).
Genes 13 01876 g001
Figure 2. Phylogenetic tree for 18 chicken breeds plotted using pairwise DNA fingerprinting-derived genetic distances (Supplementary Table S2). The corresponding Newick tree format is shown in Supplementary Information S2.
Genes 13 01876 g002
Figure 3. Phylogenetic tree for 18 chicken breeds based on SNP genotypes and pairwise FST genetic distances (Supplementary Table S3) plotted using the Neighbor-Net method (in the SplitsTree 4 program) and the iTOL v. 5 web service [59]. The corresponding Newick tree format is shown in Supplementary Information S2.
Genes 13 01876 g003
Figure 4. Visualization of the MDS and ADMIXTURE hierarchical clustering based on genotyping information (356 individuals from 18 breeds genotyped for 38,711 SNPs). (a) Results of the MDS analysis. Individuals are plotted on the two coordinate axes, C1 and C2, according to their coordinates. Ellipses describe how each breed is dispersed around its center of gravity. (b) ADMIXTURE hierarchical clustering analysis for K = 2 predefined clusters (ancestral populations). The proportions of each cluster (y-axis) that were defined to be indicative of European (egg-type) and Asiatic (meat-type) ancestries (according to [62]) are plotted in blue and red, respectively, for each individual. Breeds: Pervomai (Pm), Australorp Black Speckled (ABS), Brahma Light (BL), Cochin Blue (CBl), Faverolles Salmon (FS), Leningrad Golden-and-gray (LGG), Leningrad Mille Fleur (LMF), Moscow Game (MG), New Hampshire (NH), Orloff Mille Fleur (OMF), Pushkin (Pu), Rhode Island Red (RIR), Russian White (RW), Sussex Light (SL), Tsarskoye Selo (Ts), Uzbek Game (UG), Yurlov Crower (YC), and Zagorsk Salmon (ZS).
Genes 13 01876 g004
Figure 5. Cross-validation (CV) error in the Admixture analysis based on SNP genotypes in 18 chicken breeds. The optimal number of ancestral populations was K = 16.
Genes 13 01876 g005
Figure 6. Admixture analysis of the cluster structure conducted for 18 chicken breeds based on genome-wide SNP analysis.
Genes 13 01876 g006
Figure 7. Heterozygosity of 18 populations assessed by various methods: H_SNP, HO values with SNP genotyping; H_F, H ¯ O values with multilocus DNA fingerprinting; ln (H_F), logarithmic trend y   ( x ) = a × ln   ( x ) + b for the H ¯ O   curve.
Genes 13 01876 g007
Table 1. Mean heterozygosity ( H ¯ O ) and other genetic diversity indicators computed using the GELSTATS™ program in 18 chicken breeds analysis of fingerprinting patterns.
BreedAbbreviaturen1 H ¯ O Mean No. of Loci per IndividualMean No. of Alleles Per LocusProportion of Polymorphic Loci
Rhode Island RedRIR110.7019.495.440.94
Russian WhiteRW110.6118.384.790.95
Cochin BlueCBl110.8016.446.991.00
Faverolles SalmonFS110.7316.626.261.00
Moscow GameMG110.7520.815.621.00
New HampshireNH110.7514.157.621.00
Sussex LightSL110.6716.505.690.88
Uzbek GameUG110.7319.235.721.00
Orloff Mille FleurOMF100.6518.215.110.95
Yurlov CrowerYC100.7120.925.621.00
PushkinPu110.7711.355.991.00
Tsarskoye SeloTs110.829.287.971.00
Leningrad Golden-and-grayLGG110.829.568.011.00
Leningrad Mille FleurLMF100.7310.556.541.00
Zagorsk SalmonZS110.5420.494.720.77
PervomaiPm110.6617.155.300.94
Australorp Black SpeckledABS110.7712.396.460.92
Brahma LightBL110.6717.116.080.88
1 n, number of genotyped birds.
Table 2. Genetic diversity scores (M ± SE) based on SNP genotypes in the 18 studied chicken populations 1.
BreednHOHEUHEARFIS
RIR220.358 ± 0.0010.338 ± 0.0010.346 ± 0.0011.918 ± 0.001−0.054 ± 0.001
RW230.314 ± 0.0010.294 ± 0.0010.301 ± 0.0021.848 ± 0.001−0.063 ± 0.001
CBl180.335 ± 0.0010.315 ± 0.0010.324 ± 0.0011.867 ± 0.001−0.059 ± 0.002
FS200.289 ± 0.0010.295 ± 0.0010.302 ± 0.0011.831 ± 0.0020.012 ± 0.001
MG190.364 ± 0.0020.354 ± 0.0010.363 ± 0.0021.944 ± 0.001−0.028 ± 0.001
NH190.371 ± 0.0010.351 ± 0.0020.361 ± 0.0011.939 ± 0.001−0.053 ± 0.001
SL200.338 ± 0.0010.321 ± 0.0010.329 ± 0.0011.882 ± 0.001−0.048 ± 0.001
UG190.373 ± 0.0020.343 ± 0.0010.353 ± 0.0011.922 ± 0.001−0.078 ± 0.001
OMF200.340 ± 0.0010.322 ± 0.0010.330 ± 0.0021.891 ± 0.001−0.052 ± 0.001
YC200.350 ± 0.0010.326 ± 0.0010.334 ± 0.0011.889 ± 0.002−0.068 ± 0.002
Pu200.322 ± 0.0010.303 ± 0.0010.311 ± 0.0011.836 ± 0.001−0.056 ± 0.002
Ts200.346 ± 0.0020.333 ± 0.0010.342 ± 0.0011.905 ± 0.001−0.038 ± 0.001
LGG200.310 ± 0.0010.295 ± 0.0010.303 ± 0.0011.827 ± 0.001−0.046 ± 0.001
LMF210.348 ± 0.0010.329 ± 0.0010.337 ± 0.0011.898 ± 0.001−0.056 ± 0.001
ZS180.301 ± 0.0010.286 ± 0.0020.295 ± 0.0011.816 ± 0.002−0.047 ± 0.001
Pm200.338 ± 0.0010.317 ± 0.0010.326 ± 0.0011.875 ± 0.001−0.061 ± 0.001
ABS200.335 ± 0.0010.321 ± 0.0010.329 ± 0.0011.887 ± 0.001−0.036 ± 0.001
BL170.273 ± 0.0010.253 ± 0.0010.261 ± 0.0011.716 ± 0.001−0.072 ± 0.001
1 M, mean value; SE, standard error; n, number of genotyped birds; HO, observed heterozygosity; HE, expected heterozygosity; UHE, unbiased expected heterozygosity; AR, rarefied allelic richness; FIS, inbreeding coefficient.
Publisher’s Note: MDPI stays neutral with regard to jurisdictional claims in published maps and institutional affiliations.

