Article

Selection and Validation of Reliable Reference Genes for Gene Expression Studies in Different Genotypes and TRV-Infected Fruits of Peach (Prunus persica L. Batsch) during Ripening

College of Horticulture, Northwest Agriculture and Forestry University, Yangling, Xianyang 712100, China
*
Author to whom correspondence should be addressed.
These authors contributed equally to this work.
Genes 2022, 13(1), 160; https://doi.org/10.3390/genes13010160
Submission received: 14 December 2021 / Revised: 11 January 2022 / Accepted: 12 January 2022 / Published: 17 January 2022
(This article belongs to the Section Plant Genetics and Genomics)

Abstract

:
Real-time quantitative PCR (RT-qPCR) is a powerful tool to detect and quantify transcription abundance, and the stability of the reference gene determines its success. However, the most suitable reference gene for different genotypes and tobacco rattle virus (TRV) infected fruits was unclear in peach (Prunus persica L. Batsch). In this study, 10 reference genes were selected and gene expression was characterized by RT-qPCR across all samples, including different genotypes and TRV-infected fruits during ripening. Four statistical algorithms (geNorm, NormFinder, BestKeeper, and RefFinder) were used to calculate the stability of 10 reference genes. The geNorm analysis indicated that two suitable reference genes should be used for gene expression normalization. In general, the best combination of reference genes was CYP2 and Tua5 for TRV-infected fruits and CYP2 and Tub1 for different genotypes. In 18S, GADPH, and TEF2, there is an unacceptable variability of gene expression in all experimental conditions. Furthermore, to confirm the validity of the reference genes, the expression levels of PpACO1, PpEIN2, and PpPL were normalized at different fruit storage periods. In summary, our results provide guidelines for selecting reliable reference genes in different genotypes and TRV-infected fruits and lay the foundation for accurate evaluation of gene expression for RT-qPCR analysis in peach.

1. Introduction

Gene expression analysis is becoming increasingly important for understanding the signaling and metabolic pathways during cell development and death [1,2]. Real-time quantitative PCR (RT-qPCR) is one of the most widely used techniques to determine gene expression because of its good repeatability, strong specificity, high sensitivity, and wide application range compared with microarrays, semi-quantitative, and northern blots [3,4,5]. In RT-qPCR, using a reference gene to normalize gene expression is a simple, popular method with wide application [6]. The reference gene, also known as the housekeeping gene, is stably expressed in various tissues and experimental conditions and maintains the minimal life function of cells [7,8]. Normalization can lead to incorrect results if there are large fluctuations in the expression of reference genes [6]. Consequently, selecting an optimal reference gene with a steady expression pattern is an essential pre-requisite before normalization.
Many studies have reported the selection and validation of reference genes in plants [9,10,11,12,13,14,15]. However, these reference genes exhibit constant expression patterns under certain experimental conditions, but their expression levels vary widely under other experimental conditions. In longan, CYP2 was the best reference gene at the fruit development stages, but the least stable gene under NAA treatment [16]. In mulberry, TIP41 was the preferred reference gene for normalizing gene expression under control, but not under drought stress [17]. In the case of peach, CYP2 was identified as a stable reference gene in fruit flesh samples, but displayed unacceptably variable expression patterns in fruit peel [11]. Therefore, it is completely necessary to select stably expressed reference genes under specific experimental conditions to normalize the target gene, rather than using a reference gene previously published under other experimental conditions.
Peach (Prunus persica L. Batsch) is one of the most economically important fruit crops in China. Softening is a complex process of biochemistry and physiology, including cell wall destruction, pectin hydrolysis, and content release [18]. According to the texture characteristics, peaches are classified into melting flesh (MF), non-melting flesh (NMF), and stony-hard (SH) types [19,20]. Significant differences exist in the softening rates of peach fruits with different textures [21]. MF peach is rapidly softening, SH peach is hardly softened on the tree and after harvest, and NMF peach is between MF and SH [22,23]. The study of the softening of peach fruits with different genotypes is an important part of the postharvest problem. Therefore, clarifying the expression patterns of key regulatory factors during fruit ripening can help to better elucidate the complex regulatory mechanisms.
Virus-induced gene silencing (VIGS) is one of the most widely used and efficient tools for gene function research [24,25,26]. VIGS technology requires a virus vector to achieve silencing of endogenous genes. Tobacco rattle virus (TRV) vector has been successfully used in most fruit trees. Bai et al. had succeeded in knocking down the PpCCD4 gene with the TRV-VIGS approach in white flesh peaches [27]. In Li et al. study [28], PpSEP1 expression was inhibited by TRV-VIGS to determine PpSEP1 functions in peach during ripening. Thus, VIGS is the most important molecular method to verify gene function in peach. Finding the most suitable internal reference gene in TRV-infected fruits is an indispensable and important part of the RT-qPCR experiment. Although Kou et al. found the best reference genes under different tissue and different exogenous regulator treatments in peach [11], the selected reference genes may not be suitable for TRV-injected peach fruits.
Reference genes are generally stable expressed genes that maintain minimal vital functions of the cell, such as ubiquitin (UBQ) and RNA polymerase subunit (RP) [7]. In the current study, actin protein, tublin and 18S ribosomal RNA (18S) are the most commonly used as internal reference genes for gene expression analysis in peach [13,15,28]. Many stably expressed reference genes reported in other species, such as glyceraldehyde-3-phosphate dehydrogenase (GADPH), translation enlongation factor (TEF), and cyclophilin (CYP), were also included as candidate genes for subsequent analysis [14,17]. In this study, 10 reference genes were selected according to reference genes often used and reported in peach. Their expression level in peach was confirmed by RT-qPCR across all samples, including different genotypes and TRV-infected fruits. The stability of the expression of 10 reference genes was analyzed by geNorm, NormFinder, BestKeeper, and RefFinder. In addition, the expression profiles of PpACO1, PpEIN2, and PpPL were normalized by using the unstable reference genes and the best combination of reference genes, respectively. Our data provides validated reference genes for RT-qPCR analysis of peach fruit, which will be conducive to future studies on the gene expression of peach.

2. Materials and Methods

2.1. Different Genetypes Fruits

Peach (P. persica L. Batsch) varieties ‘Rui Hong’ (RH, melting flesh), ‘Zao Feng Wang’ (ZFW, melting flesh), ‘Babygold 5’ (B5, non-melting flesh), and ‘Qin Wang’ (QW, stony-hard) were used as experimental materials and planted in the Experimental Station of the College of Horticulture at Northwest A&F University, Yangling, Shaanxi, China. During the commercial harvest period, the fruit maintained relatively high hardness, the green surface of the fruit faded slightly, and some skin turned red. The fruits were harvested at the same maturity with a uniform size and no mechanical damage. The harvested fruit was soaked for 30 min in 2 g/L of carbendazim to kill worm eggs, and then stored at 24 ± 1 °C. During storage, fruits were sampled every two days, frozen in liquid nitrogen, and stored at −80 °C until the fruit was completely softened. Three biological repetitions were designed, and each biological repetition was performed by mixing the pulp of five fruits. Table S1 lists the sample data used for this experiment.

2.2. TRV-Infected Fruits

The fruits of the peach varieties ‘Rui Hong’ and ‘Zao Feng Wang’ are used as TRV-injected fruits. The empty plasmid pTRV1 and pTRV2 were transformed into Agrobacterium strain GV3101 by heat stimulation and grown on LB medium containing kanamycin and rifampicin at 28 °C for 3 days. A single clone was picked and grown in LB medium containing kanamycin and rifampicin for 14 h, and then the cells were collected and resuspended to an OD600 of 0.8 and stored at room temperature for 2 h as described by Bai et al. [27]. According to the protocols reported by Li et al. [28], 200 intact RH fruits were selected randomly for injection. The culture containing the recombinant plasmids pTRV1 and pTRV2 was mixed at a ratio of 1:1, and then 200 μL of the culture was infiltrated into the peach fruit with a needle. One week after the injection, the fruits were harvested and stored at 24 ± 1 °C. During storage, fruits were sampled every two days, frozen in liquid nitrogen, and stored at −80 °C until the fruit was completely softened. Three biological repetitions were designed, and each biological repetition was performed by mixing the pulp of five fruits.

2.3. Design for RT-qPCR Primers

Primers of ten reference genes (18S, Actin, CYP2, TEF2, GAPDH, PLA2, RPII, Tua5, Tub1, and UBQ10) had previously been designed in other studies [9,11,29,30,31,32], and the details are listed in Table S2. The mRNA sequences of PpACO1, PpEIN2 and PpPL were obtained from the peach genome database on the GDR website (https://www.rosaceae.org/, accessed on 15 July 2021). The primer was designed by Primer Premier 6, and the specificity was tested by electrophoresis in a 1.0% agarose gel. Primer sequence of PpACO1, PpEIN2, and PpPL was listed in Table S3.

2.4. RNA Isolation and cDNA Preparation

Total RNA was extracted using the RNAprep Pure Plant Kit (Polysaccharides & Polyphenolics-rich) (Tiangen Biotech, Beijing, China). RNA quality and integrity were tested by electrophoresis in 1% agarose gels and a microspectrophotometer (Thermo NanoDrop 2000, Wilmington, NC, USA), respectively. Only RNA preparations having an A260/A280 value of 1.8–2.0 and an A260/A230 value of >2.0 were used for subsequent analysis. Reverse transcription was completed using the PrimeScript RT Reagent Kit with gDNA Eraser (Takara, Beijing, China).

2.5. RT-qPCR with SYBR Green

RT-qPCR was performed with the Bio-Rad CFX system (Bio-Rad Laboratories, Hercules, CA, USA). Each reaction mix contains 2 µL of ddH2O, 1 µL of forward and reverse primer mixture, 1 µL cDNA, and 5 µL of SYBR Premix ExTaq II (TaKaRa, Beijing, China) to a final volume of 10 µL. The PCR amplification procedure was set to 95 °C for 1 min, followed by 40 cycles of 95 °C for 15 s, 60 °C for 20 s, and 72 °C for 15 s, and constructed a melting curve. Each RT-qPCR reaction was carried out in triplicate. A no-template control (NTC) was also carried out.

2.6. Normalization of PpACO1, PpEIN2, and PpPL

PpACO1 (ethylene synthesis-related gene), PpEIN2 (ethylene signal transduction-related gene), and PpPL (cell wall degradation-related gene) all play important roles in peach ripening and have high expression levels during storage [18,28]. In this study, to validate the reference genes, the expression levels of the three selected genes were normalized using the best reference gene combination, the best reference gene and the unstable gene in peach varieties ‘Rui Hong’ (RH), ‘Qin Wang’ (QW), and TRV-infected ‘Zao Feng Wang’ (ZFW) fruit during storage. The expression level of the three genes was calculated by the 2-Δ Δ Ct method [33].

2.7. Data Analysis

The geNorm algorithm program was used by qbase + software (Demo 3.2) [34]. The Normfinder [35] and BestKeeper [36] algorithm programs were Excel-based tools to calculate the stability of 10 reference genes. RefFinder [37] is an online website (https://www.heartcure.com.au/reffinder/, accessed on 27 July 2021) to carry out comprehensive stability analysis.

3. Result

3.1. Detection of Amplification Specificity of Reference Gene Primers

Based on previous studies [9,11,29,30,31,32], we selected 10 candidate reference genes to re-evaluate gene expression stability in TRV-based VIGS-injected peach fruits in order to identify the most suitable reference gene for RT-qPCR. The housekeeping genes were those genes involved in encoding 18S ribosomal RNA (18S), actin protein (Actin), cyclophilin 2 (CYP2), translation elongation factor 2 (TEF2), glyceraldehyde-3-phosphate dehydrogenase (GADPH), phospholipase A2 β (PLA2), RNA polymerase subunit (RPII), tublin α-5 (Tua5), tublin β-1 (Tub1), and ubiquitin 10 (UBQ10). All the RNA samples were detected by electrophoresis in 1% agarose gels, and the 28S rRNA and 18S rRNA bands were clear. The result of electrophoresis showed a specific single band for all RT-qPCR products (Figure S1), and the melting curve figures displayed a single peak for each RT-qPCR product (Figure S2), demonstrating that the primers for the 10 reference genes used in this study have high specificity.

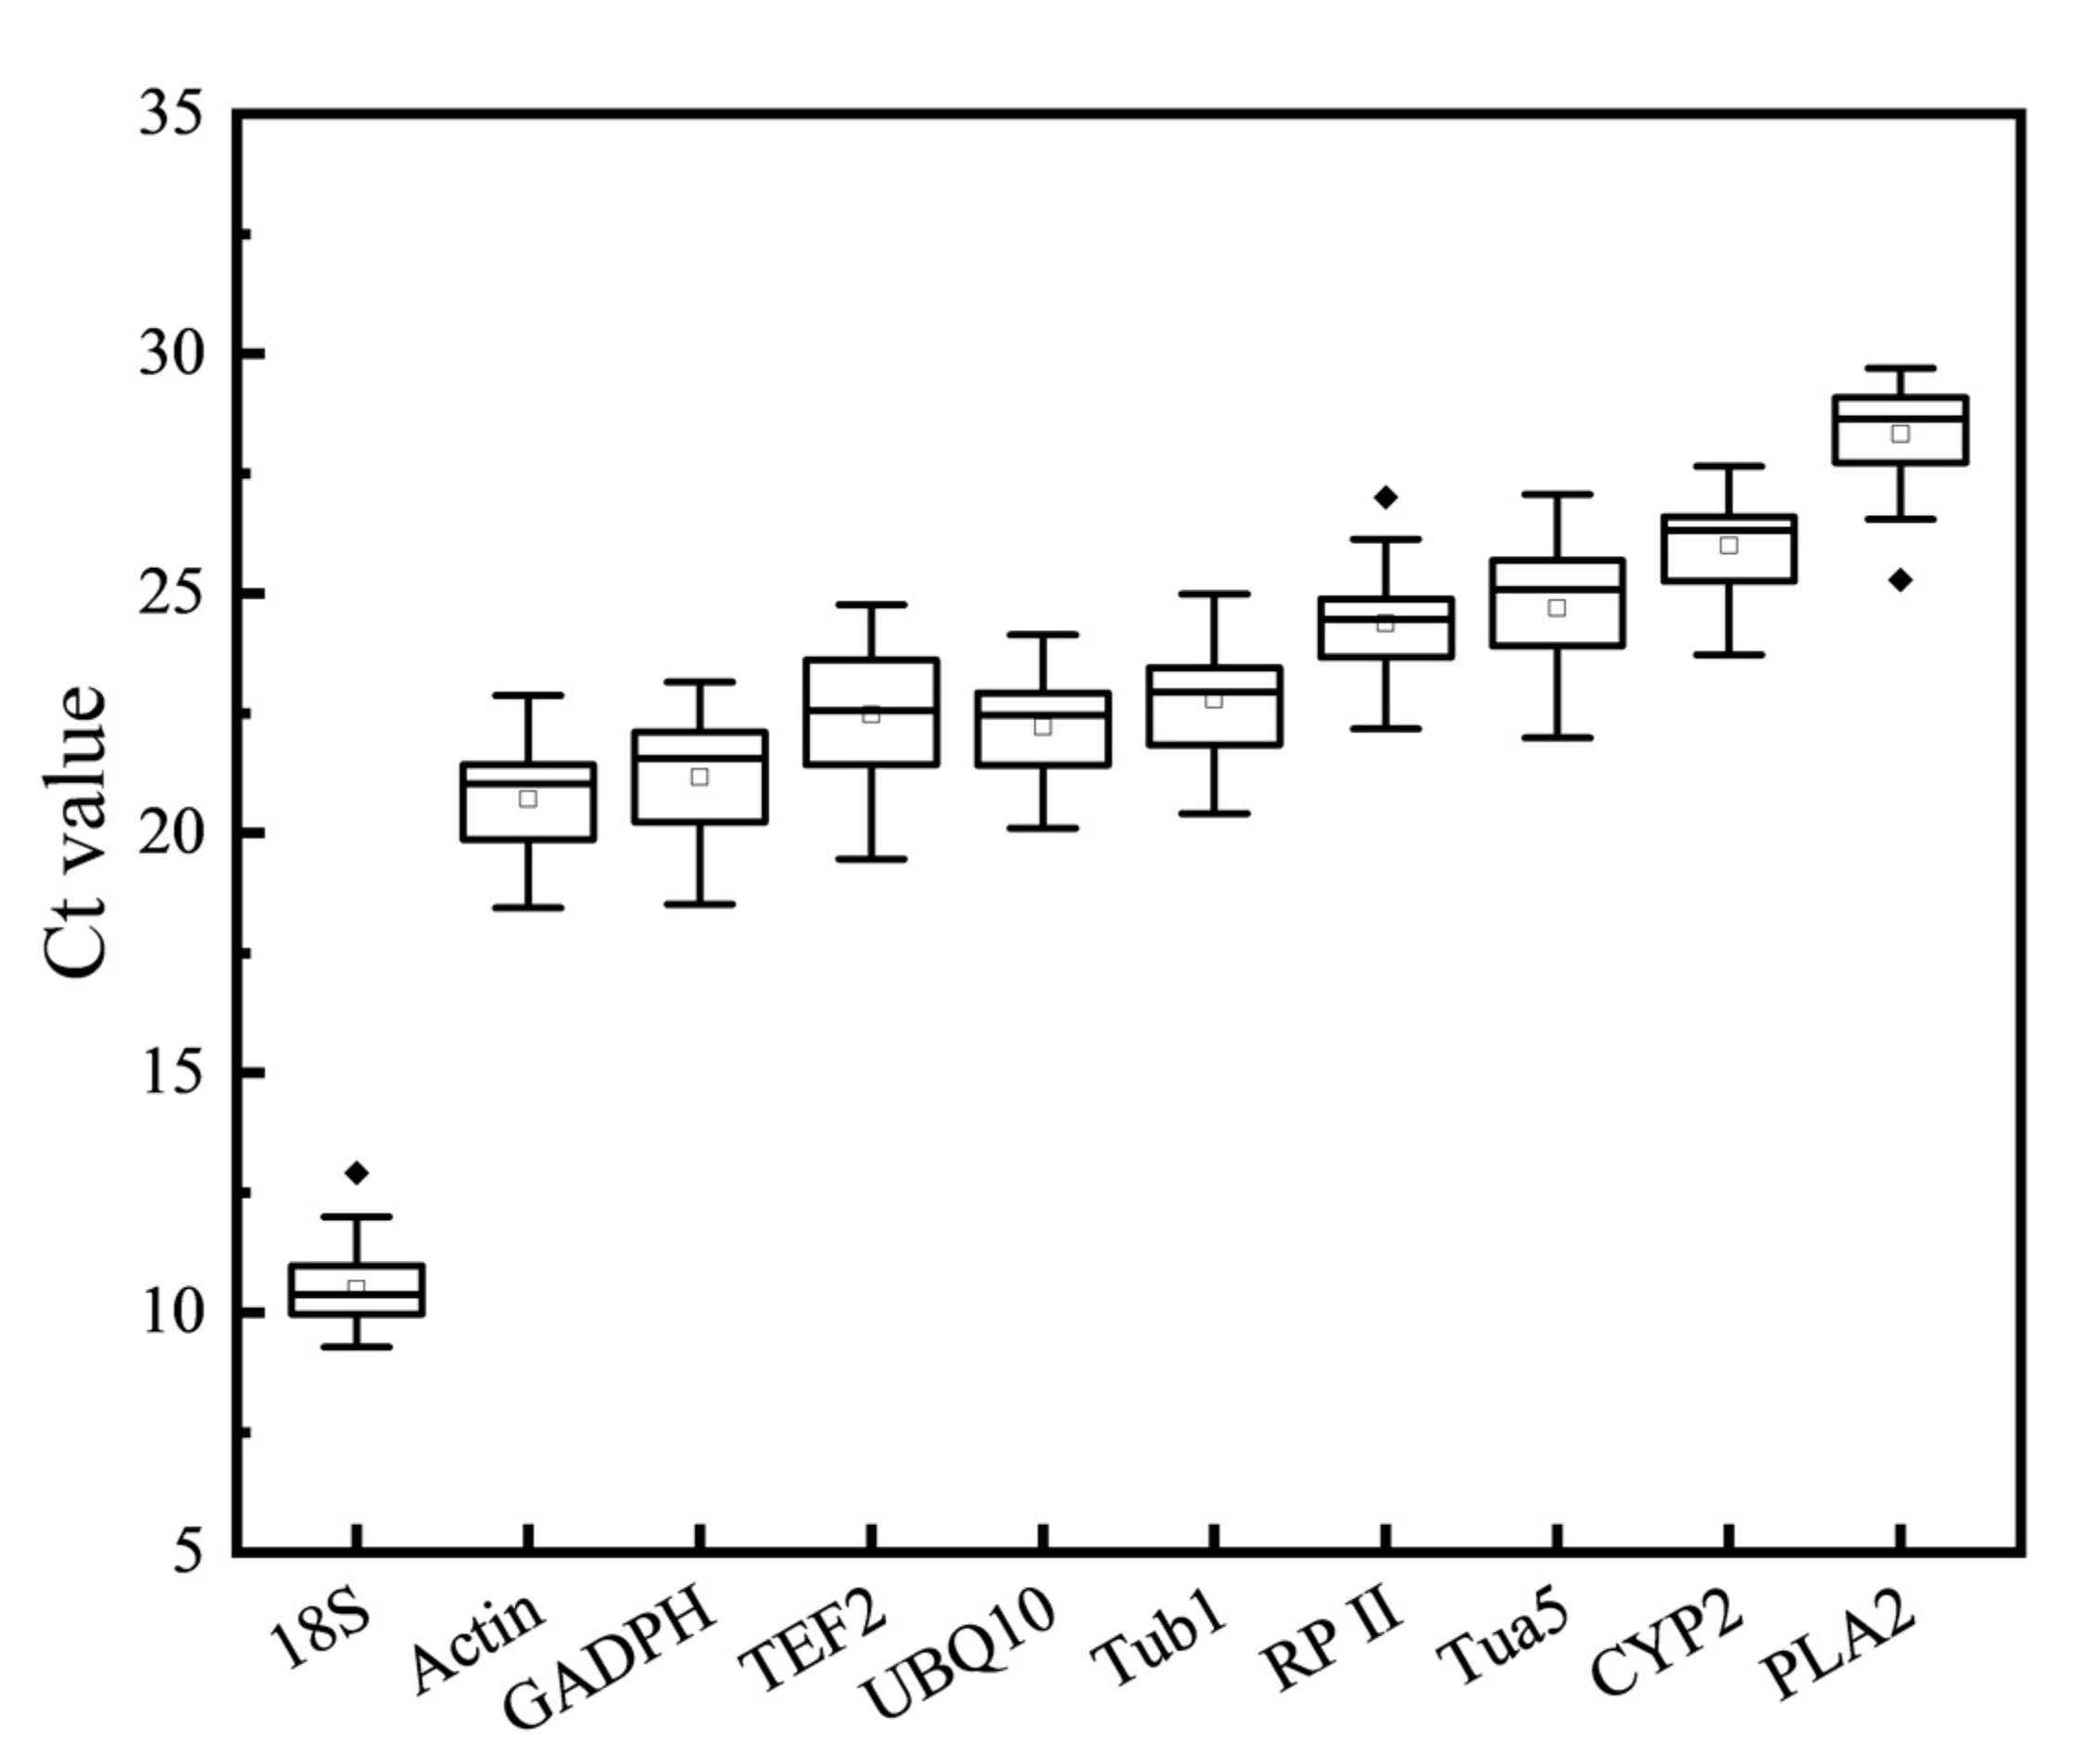
3.2. Expression Level of Reference Genes

In order to further confirm the raw expression levels, a RT-qPCR was designed for the 10 reference genes for all samples, including different genotypes and TRV-infected fruits. The Ct values of the 10 reference genes under all experimental conditions range from 9.28 for 18S to 29.69 for PLA2, which indicates that obvious differences exist in the expression profile (Figure 1). The average Ct value of 18S is the lowest, indicating that it has the lowest number of cycles to reach threshold fluorescence and it exhibits the highest expression abundance. Except for 18S, CYP2, and PLA2, the mean Ct values of other genes varied between 20 and 25, demonstrating that those genes were relatively highly expressed in this study. The least expressed genes were CYP2 and PLA2, with Ct values of 26.03 and 28.37, respectively. Furthermore, 18S had a narrowest Ct range compared to other genes, while TEF2 had the widest, and the majority of the reference genes had lower expression variation.

3.3. Stability of Reference Genes

In our study, the stability of 10 reference genes were independently confirmed using the geNorm, NormFinder, BestKeeper, and RefFinder across all samples, including different genetypes and TRV-infected fruits.

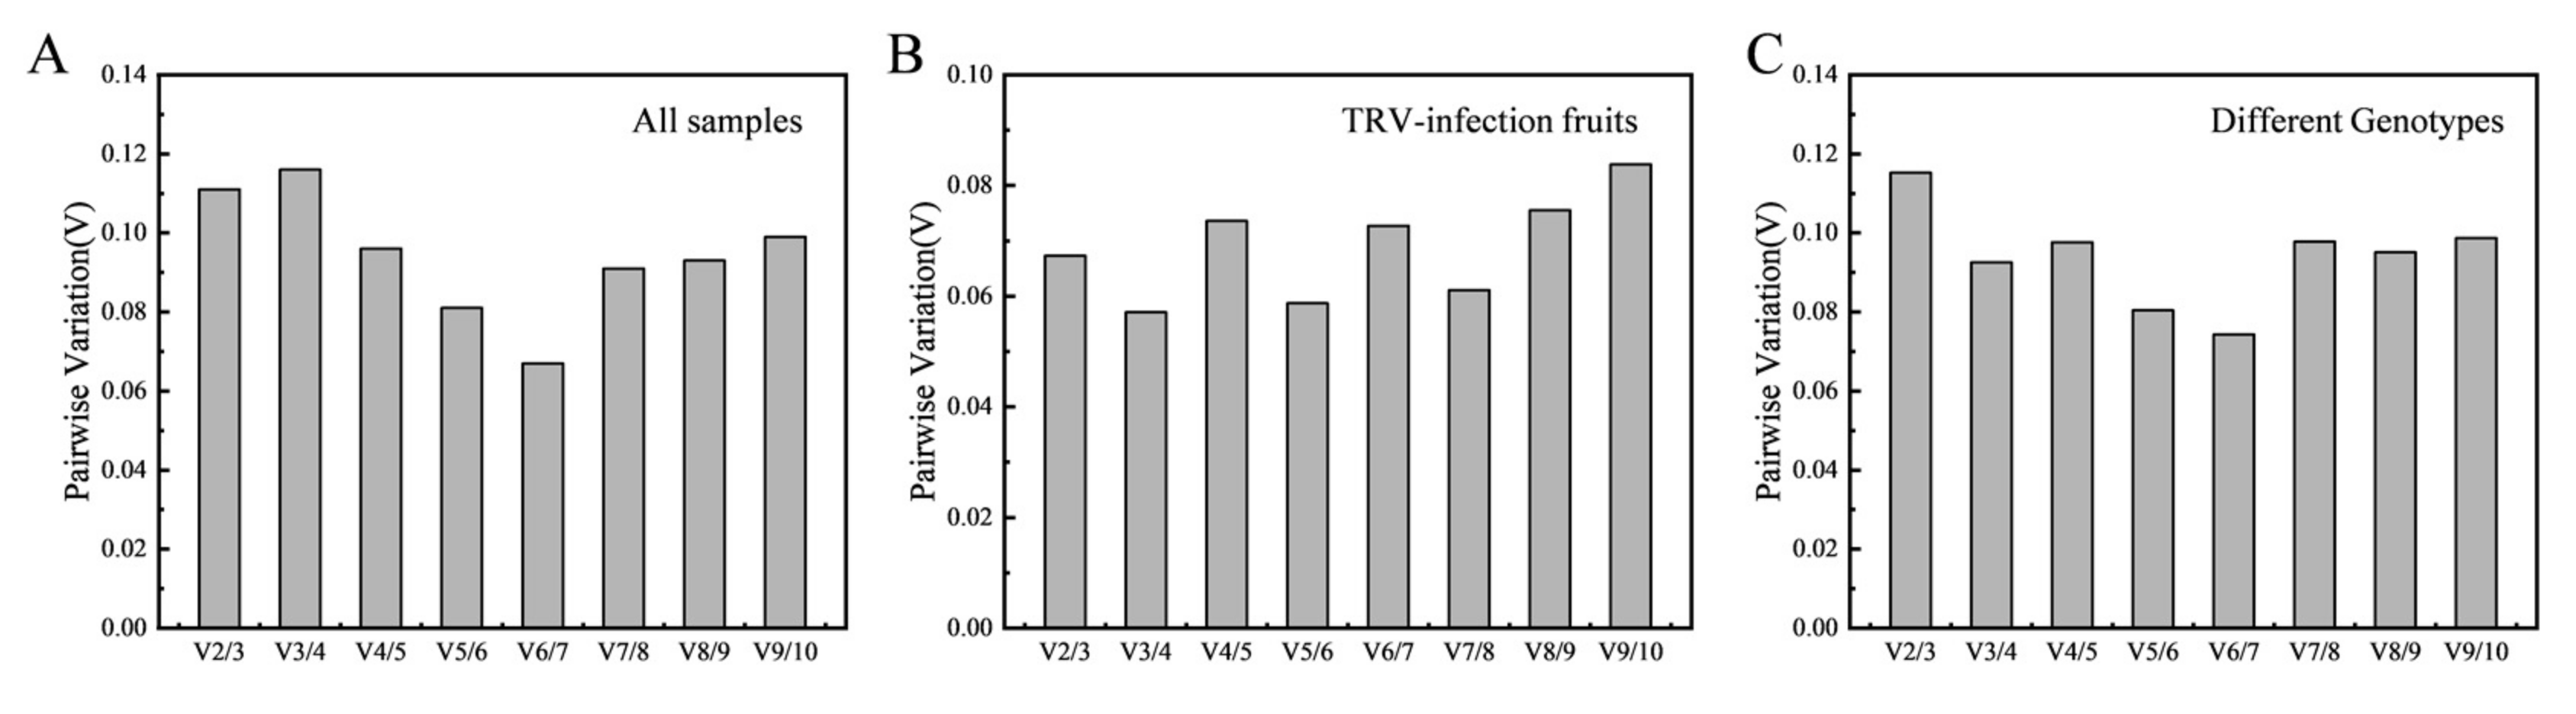
3.3.1. geNorm Analysis

The geNorm was used to calculate the measurement (M) values of expression stability for 10 reference genes based on the raw Ct value. As shown in Figure 2, reference genes were ranked according to M values. A higher M value means lower stability, while a lower M value implies more stable gene expression. In our study, 10 reference genes had M values below 1.5, which is a threshold for assessing stability, indicating that all genes had a stable expression profile across all these experimental sets. In the total sample, the most stably expressed genes were CYP2 and GADPH, and the two least stably expressed genes were 18S and TEF2. The result was similar across the different genotypes. In the TRV-infected fruits, CYP2 and Tua5 were the most stably expressed genes, whereas 18S and TEF2 were the least.
The appropriate number of reference genes was also evaluated based on the pairwise variation value (Vn/n + 1 value) (Figure 3). The result showed that the V2/3 of all experimental groups was lower than 0.15, indicating that two suitable reference genes were required for normalization. The optimal combination of reference genes was CYP2 with Tua5 for TRV-infected fruits and CYP2 with GADPH for different genotypes. In addition, CYP2 with GADPH was selected as the best reference gene combination in all samples.

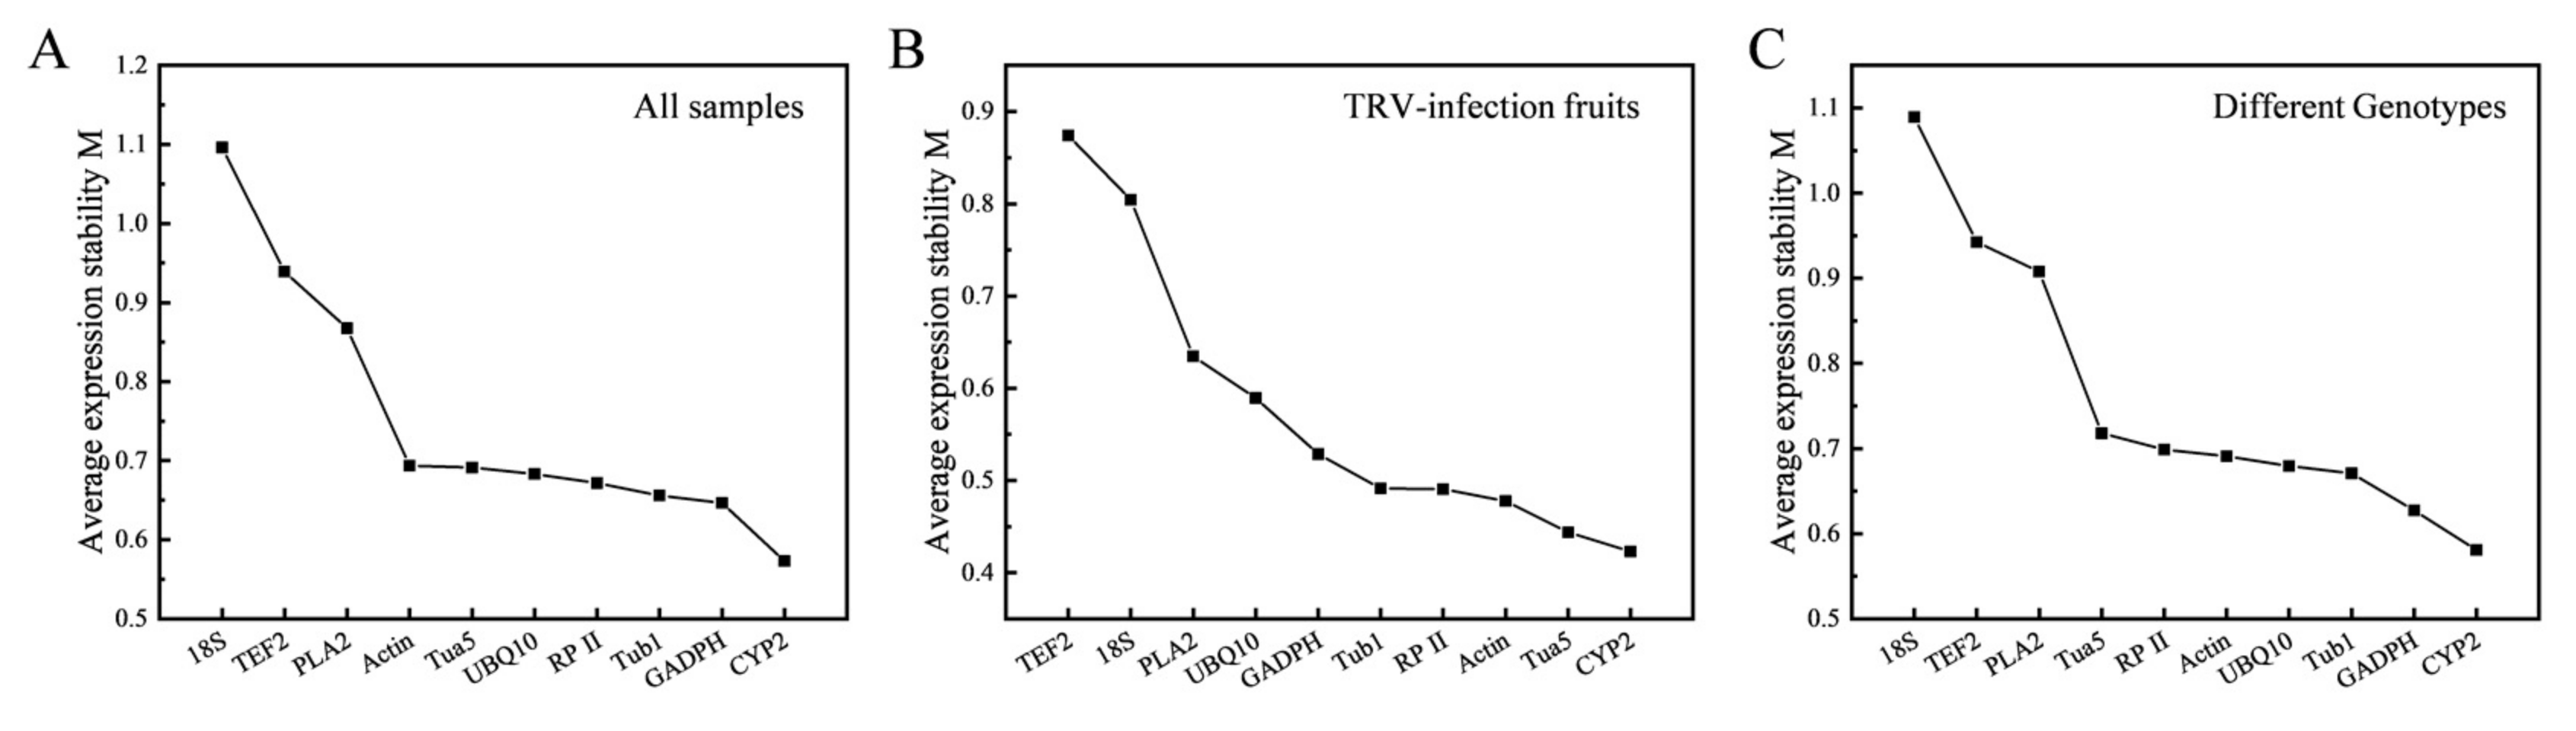
3.3.2. NormFinder Analysis

The expression stability was further analyzed by NormFinder, in which intra- and inter-group were considered to calculate normalization, and ANOVA was used to evaluate expression stability. Unlike qbase + software, NormFinder cannot directly use the raw data, which needs to be transformed into quantities for relative comparison. The variation value for 10 reference genes were calculated by NormFinder, and a higher stable value meant lower stability, whereas lower values indicated better stability. In this sense, all samples with no subgroup and the two series were calculated. The result of the variation values is shown in Table 1. Our data indicated that the definition of subgroup has a significant effect on the outcome. However, it exhibited two common features with no subgroups and two subgroups; CYP2, GADPH, and Tub1 were always classified among the top three positions, meaning that they have higher expression stabilities, and 18S was the worst reference gene. CYP2 and Tua5 were the most stable references in TRV-infected fruits, and CYP2 and UBQ10 were the most stable genes among different genotypes. 18S and TEF2 had the lowest stability under all experimental conditions. 18S, GADPH, and TEF2 were always included as unstable reference genes, showing an unstable expression profile.

3.3.3. BestKeeper Analysis

The expression stability of the 10 reference genes was further analyzed using BestKeeper, and the R value was also calculated for assessing the stability. The higher the R value, the more it indicated stable expression of the reference gene (Table 2). Initial analysis of the data using CV values (coefficient of variation) and SD values (standard deviation) for 10 reference genes demonstrated that SD values of all reference genes were less than 1, except for six genes (CYP2, Actin, Tub1, Tua5, TEF2, and GADPH) in TRV-infected fruits, indicating that most were unstable expression under TRV infection in peach fruit. The most stable expressed genes were CYP2 for 0.954, Tua5 for 0.954 in all samples; CYP2 for 0.999 and Actin for 0.991 under TRV-infected conditions; Tua5 for 0.934 and CYP2 for 0.918 in different genotypes. In addition, 18S was the least stable gene with the highest stability in all samples, while GADPH and PLA2 were the most unstable reference genes in TRV-infected fruits and different genotypes, respectively. It can be seen that CYP2 expression is relatively stable and has been in the top two positions in all experimental conditions. The most unstable is 18S, which has been in the last two places.

3.3.4. RefFinder Analysis

For the final ranking of the reference genes, a further comprehensive stability analysis was performed on all 10 reference genes according to RefFinder. RefFinder considers the results from four different algorithms to provide comprehensive stable values of reference genes. The recommended comprehensive ranking was: CYP2 and Tub1 for total samples; CYP2 and Tua5 for TRV-infected fruits; CYP2 and Tub1 for different genotypes (Table 3). Furthermore, TEF2 always included unstable reference genes under all experimental conditions.

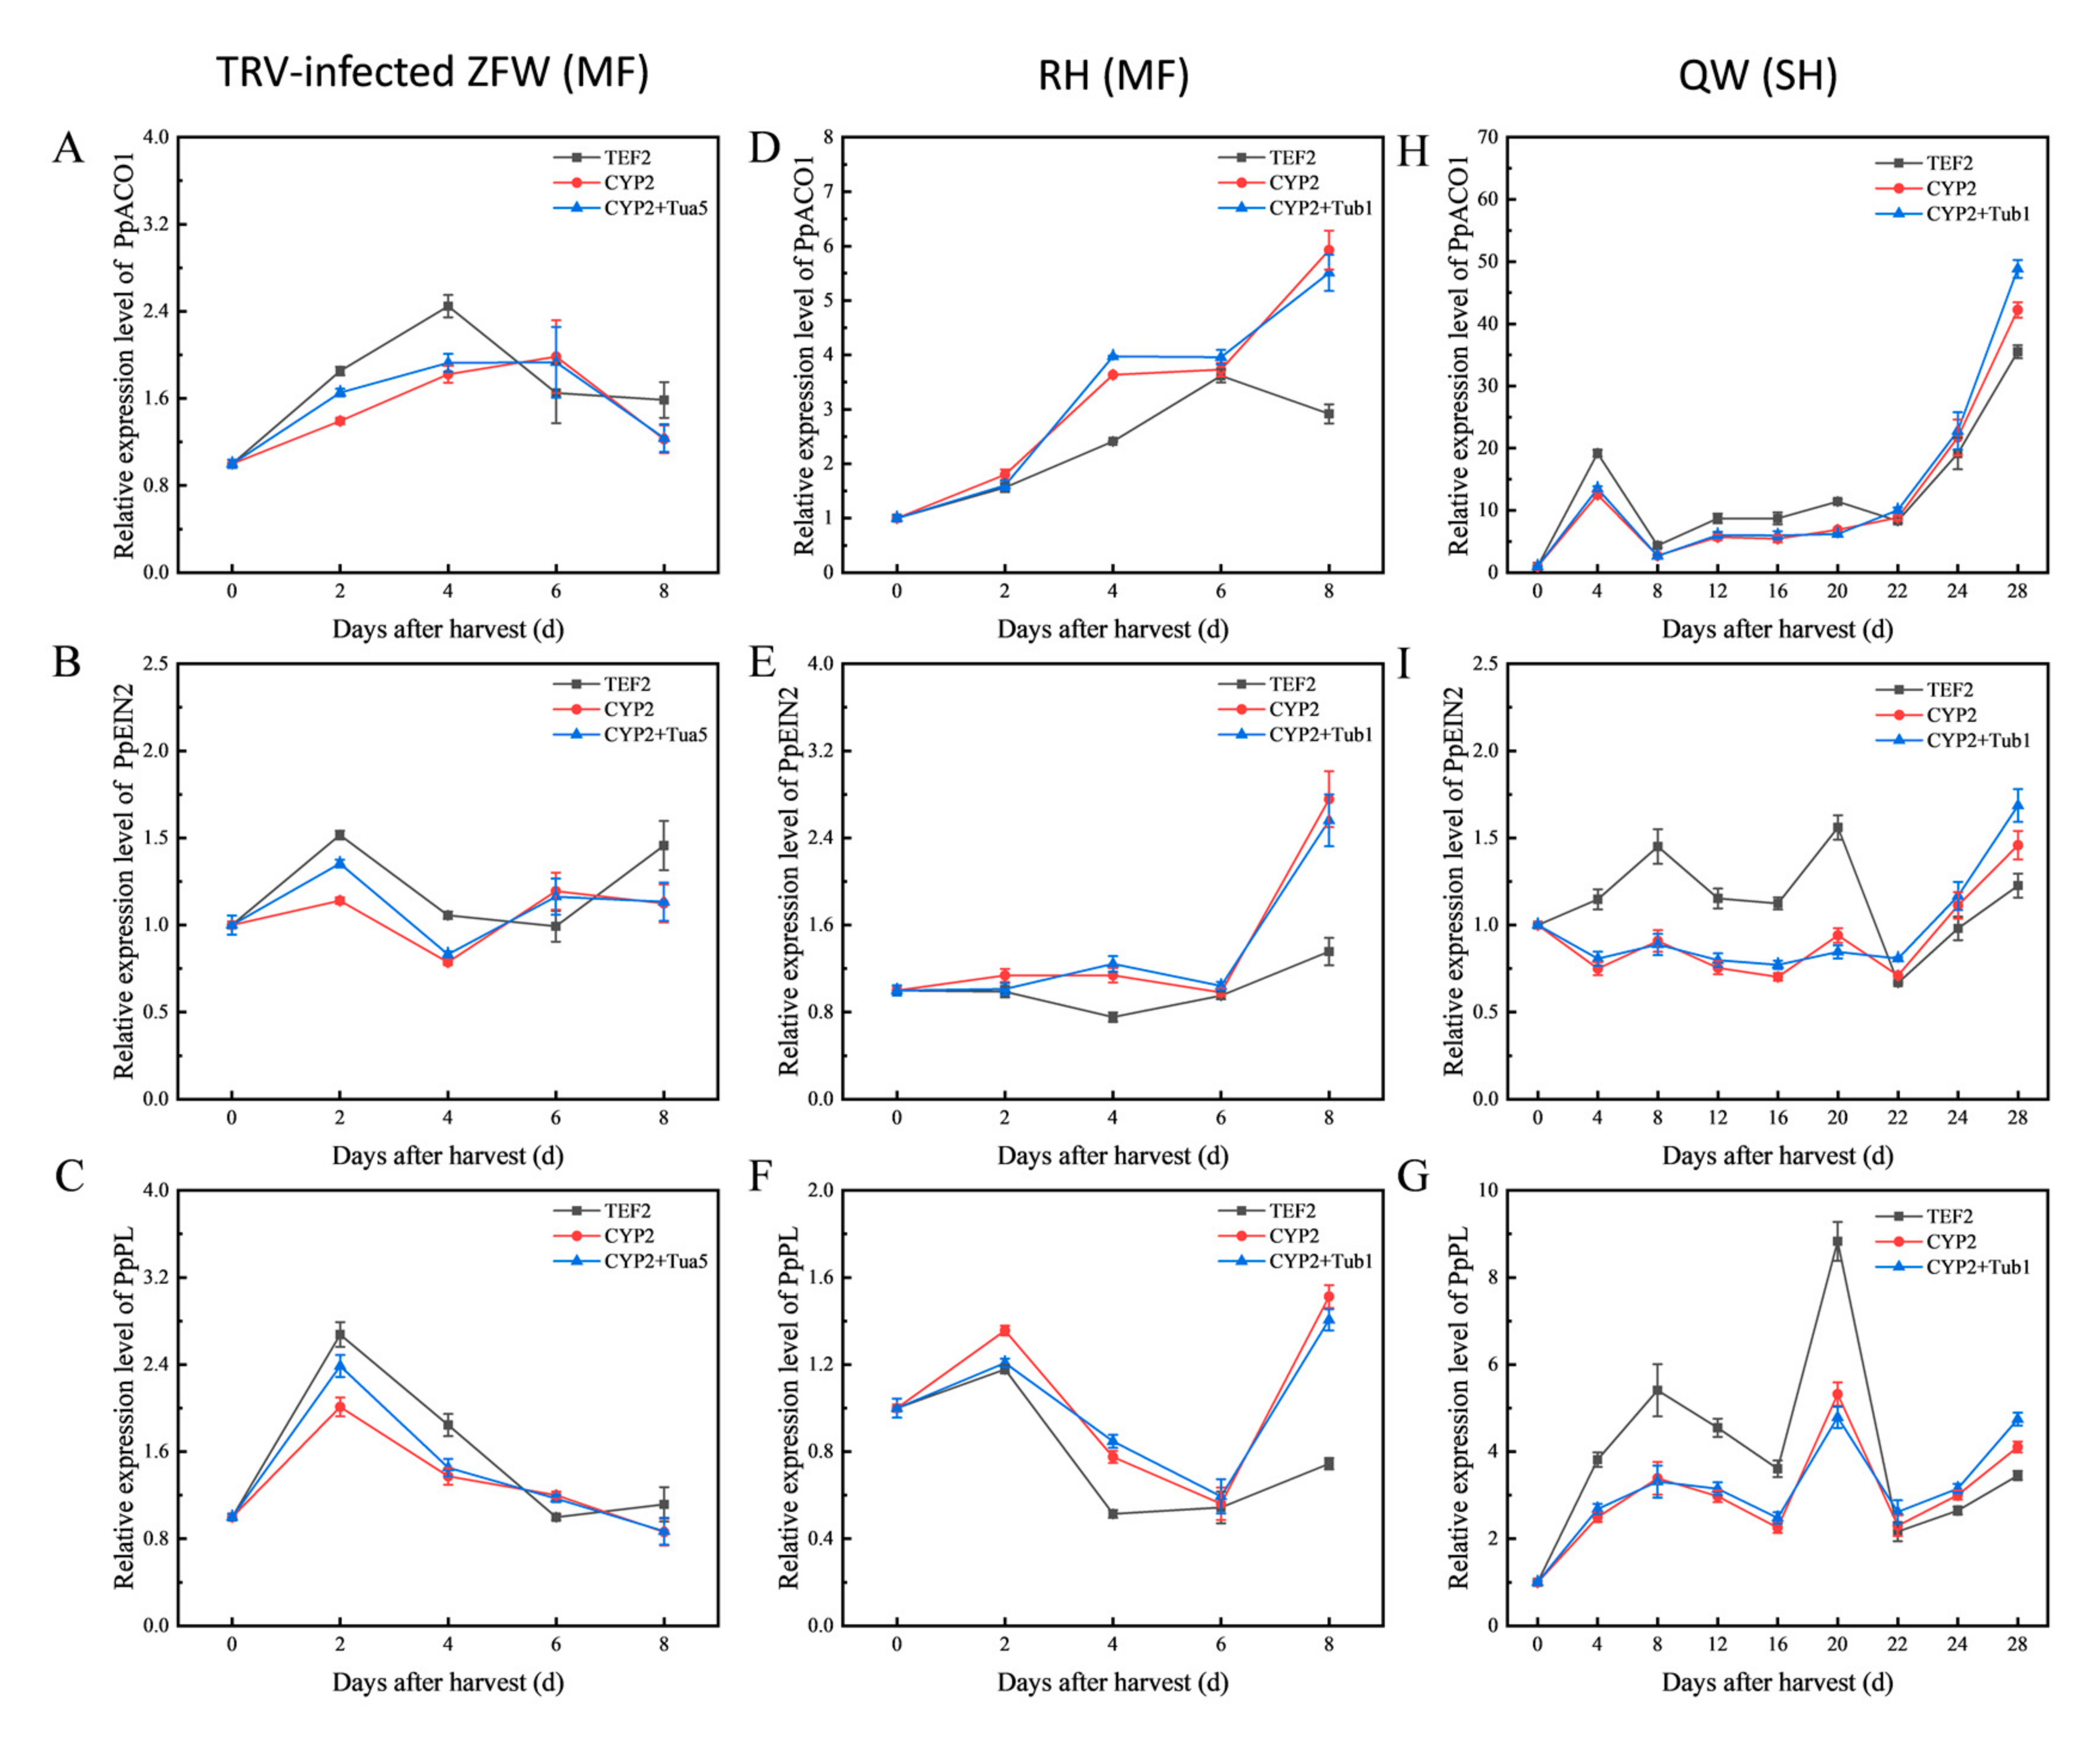
3.4. Validation of Reference Genes

To evaluate the stability of selected reference genes, the expression pattern of PpACO1, PpEIN2, and PpPL was evaluated during peach fruit ripening with the best combination of reference genes (CYP2 with Tua5 for TRV-infected fruits, CYP2 with Tub1 for different genotypes), the most stable genes (CYP2) and unstable genes (TEF2) for normalization (Figure 4).
In terms of the TRV-injected fruits, it can be found that the expression levels of PpACO1, PpEIN2, and PpPL when normalized in combination with the stable reference gene and the best reference gene alone were consistent, but their expression patterns were partially similar to those of the others when normalized using the unstable reference gene TEF2. The expression level of PpACO1 that was normalized by CYP2 alone and the combination of CYP2 and Tua5, gradually increased and reached its peak at 6 DAH (days after harvest), then decreased, whereas its expression level with TEF2 as reference gene reached its peak at 4 DAH (Figure 4A).
During melting flesh peach fruit storage of ‘RH’, when the relative expression changes of PpEIN2 were normalized by the combination of the stable reference gene and the best reference gene alone, the expression level of PpEIN2 remained essentially unchanged. However, when the most unstable reference gene TEF2 was used, the expression of PpEIN2 decreased from 2 DAH to 6 DAH, a significant change compared with the previous two results (Figure 4E). In the stony hard flesh peach fruit of ‘QW’, no differences were observed with different reference genes, indicating that the reference gene has different stability in different varieties.

4. Discussion

The reference gene should show minimal change and appropriate expression abundance in different tissues and experimental conditions [7,38]. There is a literature for screening reference genes in plants, such as peach [11], tomato [39,40], Arabidopsis [41], potato [42], soybean [43,44], banana [45], and longan [16], finding that the expression level of the internal reference is also unstable under every experimental condition. Therefore, the selection of internal reference genes under specific experimental conditions is particularly necessary. In this study, we aim to select reference genes that could be stably expressed as internal controls for RT-qPCR studies of gene expression in peach fruit with different genotypes and TRV-infected fruits.
We analyzed the expression profiles of 10 reference genes. The reference gene should meet the appropriate Ct value range. In this study, the average Ct values of the 10 reference genes showed that 18S had the narrowest Ct range, while TEF2 had the widest (Figure 1). Taking 18S as an example, a small Ct value reflects a large expression accumulation, indicating that the expression abundance of 18S is particularly high. The narrow Ct value range can reflect the stability to a certain extent, indicating that the 18S has the best stability (Figure 1). However, in this experiment, 18S was not the best choice for the internal reference gene. The reason is as follows: because of its abundance, the 18S is recommended only for target genes that are highly transcribed. When the target gene expression level is low, the 18S is not suitable as a reference gene for accurate subtraction of baseline values in RT-qPCR data analysis [9,46]. Furthermore, 18S was the most unstable reference gene in all the samples from geNorm and RefFinder analysis (Figure 2; Table 3). The stability of 18S in peach was also found to be poor [9,32]. It is precisely for this reason that the 18S failed to replace the use of other housekeeping genes. This demonstrated that it needs to combine the expression levels of the reference genes with stability analysis.
The stability of the gene expression was confirmed separately using geNorm, NormFinder, BestKeeper, and RefFinder for ranking reference genes. The geNorm program calculates the M value of the stability of each reference gene to screen out the more stable reference genes [34]. NormFinder software obtains expression stability values based on the intra- and inter-group variation coefficient of each reference gene between samples [35]. BestKeeper comprehensive analysis of the stability of reference genes based on the SD, CV and R of Ct values of each reference gene under various experimental conditions [36]. Furthermore, RefFinder considers the results from four different algorithms, including geNorm, NormFinder, BestKeeper, and ΔCt method, to provide comprehensive stable values of reference genes [37]. We use four most popular software packages to analyze the stability of 10 reference genes. Among TRV-infected fruits, the geNorm, NormFinder, BestKeeper, and RefFinder analyses showed almost identical top five stable reference genes, although with a slightly change in rank order. Moreover, the ranking orders of reference genes under different genotypes by the four programs are different, which is expected because the algorithms of the software are different.
For RefFinder analysis, CYP2, Tua5, and Actin were ranked as the top three in TRV-infected fruits, followed by CYP2, Tub1, and UBQ10 in different genotypes. In addition, GADPH, TEF2, and PLA2 were ranked as the last three in TRV-infected fruits, with GADPH, TEF2, and 18S in different genotypes (Table 3). Although most authors used only a single reference gene as a standardized internal control, it has been suggested that RT-qPCR studies using two or more reference genes may contribute to more reliable results [12,47,48,49]. According to pairwise variation, two reference genes were required for gene expression level normalization in this study since the V2/3 was lower than 0.15 (Figure 3). Therefore, the best reference gene combinations were CYP2 with Tua5 for TRV-infected fruits and CYP2 with Tub1 for different genotypes. To further confirm the validated reference genes in RT-qPCR, the combination of the most stable reference gene, the best reference gene alone, and the least stable reference gene were used for normalization of PpACO1, PpEIN2, and PpPL. The result shows that normalization by the unstable reference gene leads to misinterpretation of the expression pattern of PpACO1, PpEIN2, and PpPL (Figure 4). Therefore, screening for stable reference genes is highly necessary for the correct processing of RT-qPCR data.
In this study, CYP2, ranked in the top two by geNorm, NormFinder, and Bestkeeper programs, proved to be the best reference gene for all experimental conditions (Figure 2; Table 1 and Table 2). CYP2 was the best choice for standardization in pulp samples at different storage temperatures and fruit development stages in a pre-study of peach [11], similar to our result. In geNorm analysis, CYP has maintained the top six positions of 19 genes throughout the developmental stages and postharvest ripening of peel and pulp, indicating CYP has better stability during banana fruit development and maturation [45]. CYP2 presents stable expression in different developmental stages and after 2,4-D treatment of longan [16]. Furthermore, in cucumbers, CYP was best reference gene under cold and heat treatment [50]. This suggests that the stability of CYP2 expression is reliable across species.
It has been reported in peach that TEF2 was found to be the most stable and reliable reference gene, suggesting the use of TEF2 in combination with RPII for different tissues, different storage times and different genotypes [9]. However, in this study, TEF2 was the most unstable reference gene in different genotypes by RefFinder analysis (Table 3), and the top three reference genes with high variability among all experimental conditions by Normfinder analysis (Table 1). The expression level of PpACO1 normalized by TEF2 displayed differences in the expression level with the combination of the most stable reference gene and the most stable reference gene alone in ‘RH’ during ripening (Figure 4D). These results show that TEF2 is not the best normalization factor for different genotypes. It is possible that the different varieties of peach and experimental conditions have led to the discrepancy between the two assays [13]. The poor stability of TEF2 was also pointed out in peach and other species. TEF2 exhibited a middle-rank order for flesh at different storage temperatures and different tissues, and did not perform as well as other stable genes as a normalization factor in peach [11]. The least appropriate reference gene was TEF2 for seed development and the entire growth cycle in Plukenetia volubilis [51].

5. Conclusions

To our knowledge, this is the first report on the validation of a set of reference genes in TRV-infected peach fruits for the standardization of gene expression analysis using RT-qPCR. Our results suggest that it need to select the expression stability of reference genes under specific experimental conditions. For TRV-infected fruits, CYP2 with Tua5 is best gene combination for gene normalization. For different genotypes, CYP2 with Tub1 is one of the best gene combinations. Our results provide a foundation for the further use of RT-qPCR in the analysis of gene expression in peach.

Supplementary Materials

The following supporting information can be downloaded at: https://www.mdpi.com/article/10.3390/genes13010160/s1, Figure S1: The amplification sizes and specificity of primers of ten reference genes. M, DL 2000 maker. Figure S2: Melting curve of ten reference genes by RT-qPCR. A single peak indicated the specificity of primers. Table S1: Sample sets in this study. Table S2: Delineations of ten candidate reference genes. Table S3: The information of the primers used for qRT-PCR validation.

Author Contributions

C.Z. conceived and designed the studies; Z.X., J.D., W.S. and H.W. performed all experiments; J.D. analyzed the results; Z.X. and J.D. wrote the manuscript. K.S. check the language; C.Z., L.X., J.M. and D.Z. modified the manuscript. All authors have read and agreed to the published version of the manuscript.

Funding

This work was supported by grants from the National Key Research and Development Program of China (No. 2019YFD1000203) and China Agriculture Research System (CARS-30-Z-16).

Institutional Review Board Statement

Not applicable.

Informed Consent Statement

Not applicable.

Data Availability Statement

Not applicable.

Conflicts of Interest

The authors declare that there are no conflict of interest.

References

  1. Cao, S.; Liang, M.; Shi, L.; Shao, J.; Song, C.; Bian, K.; Chen, W.; Yang, Z. Accumulation of carotenoids and expression of carotenogenic genes in peach fruit. Food Chem. 2016, 214, 137–146. [Google Scholar] [CrossRef]
  2. Vimolmangkang, S.; Zheng, H.; Peng, Q.; Jiang, Q.; Wang, H.; Fang, T.; Liao, L.; Wang, L.; He, H.; Han, Y. Assessment of Sugar Components and Genes Involved in the Regulation of Sucrose Accumulation in Peach Fruit. J. Agric. Food Chem. 2016, 64, 6723–6729. [Google Scholar] [CrossRef] [PubMed]
  3. Engel, H.; Kueppers, C.; Koenig, M.; Loeffert, D. Successful gene expression analysis by multiplex, real-time, one-step RT-PCR, irrespective of the targets amplified. BioTechniques 2007, 43, 230–231. [Google Scholar] [CrossRef] [PubMed] [Green Version]
  4. Bustin, S.A.; Benes, V.; Nolan, T.; Pfaffl, M.W. Quantitative real-time RT-PCR—A perspective. J. Mol. Endocrinol. 2005, 34, 597–601. [Google Scholar] [CrossRef] [PubMed] [Green Version]
  5. Garson, J.A.; Grant, P.R.; Ayliffe, U.; Ferns, R.B.; Tedder, R.S. Real-time PCR quantitation of hepatitis B virus DNA using automated sample preparation and murine cytomegalovirus internal control. J. Virol. Methods 2005, 126, 207–213. [Google Scholar] [CrossRef] [PubMed] [Green Version]
  6. Guénin, S.; Mauriat, M.; Pelloux, J.; Van Wuytswinkel, O.; Bellini, C.; Gutierrez, L. Normalization of qRT-PCR data: The necessity of adopting a systematic, experimental conditions-specific, validation of references. J. Exp. Bot. 2009, 60, 487–493. [Google Scholar] [CrossRef] [PubMed] [Green Version]
  7. Thellin, O.; Zorzi, W.; Lakaye, B.; De Borman, B.; Coumans, B.; Hennen, G.; Grisar, T.; Igout, A.; Heinen, E. Housekeeping genes as internal standards: Use and limits. J. Biotechnol. 1999, 75, 291–295. [Google Scholar] [CrossRef] [Green Version]
  8. Schmittgen, T.D.; Zakrajsek, B.A. Effect of experimental treatment on housekeeping gene expression: Validation by real-time, quantitative RT-PCR. J. Biochem. Biophys. Methods 2000, 46, 69–81. [Google Scholar] [CrossRef]
  9. Tong, Z.; Gao, Z.; Wang, F.; Zhou, J.; Zhang, Z. Selection of reliable reference genes for gene expression studies in peach using real-time PCR. BMC Mol. Biol. 2009, 10, 71. [Google Scholar] [CrossRef] [PubMed] [Green Version]
  10. Luo, X.; Shi, T.; Sun, H.; Song, J.; Ni, Z.; Gao, Z. Selection of suitable inner reference genes for normalisation of microRNA expression response to abiotic stresses by RT-qPCR in leaves, flowers and young stems of peach. Sci. Hortic. 2014, 165, 281–287. [Google Scholar] [CrossRef]
  11. Kou, X.; Zhang, L.; Yang, S.; Li, G.; Ye, J. Selection and validation of reference genes for quantitative RT-PCR analysis in peach fruit under different experimental conditions. Sci. Hortic. 2017, 225, 195–203. [Google Scholar] [CrossRef]
  12. Marini, N.; Bevilacqua, C.B.; Büttow, M.V.; Raseira, M.C.B.; Bonow, S. Identification of reference genes for RT-qPCR analysis in peach genotypes with contrasting chilling requirements. Genet. Mol. Res. 2017, 16, gmr16029666. [Google Scholar] [CrossRef] [PubMed]
  13. You, S.; Cao, K.; Chen, C.; Li, Y.; Wu, J.; Zhu, G.; Fang, W.; Wang, X.; Wang, L. Selection and validation reference genes for qRT-PCR normalization in different cultivars during fruit ripening and softening of peach (Prunus persica). Sci. Rep. 2021, 11, 7302. [Google Scholar] [CrossRef] [PubMed]
  14. Wei, Y.; Hongjian, W.; Yuejian, Y. Characterization and Selection of Reference Genes for Real-time Quantitative RT-PCR of Plants. Chin. Bull. Bot. 2012, 47, 427–436. [Google Scholar] [CrossRef]
  15. Rickes, L.N.; Klumb, E.K.; Benitez, L.C.; Braga, E.J.B.; Bianchi, V.J. Stable reference genes for studies of gene expression in Prunus persica under water stress. Aust. J. Crop Sci. 2016, 10, 1348–1356. [Google Scholar] [CrossRef]
  16. Wu, J.; Zhang, H.; Liu, L.; Li, W.; Wei, Y.; Shi, S. Validation of Reference Genes for RT-qPCR Studies of Gene Expression in Preharvest and Postharvest Longan Fruits under Different Experimental Conditions. Front. Plant Sci. 2016, 7, 780. [Google Scholar] [CrossRef] [PubMed] [Green Version]
  17. Shukla, P.; Reddy, R.A.; Ponnuvel, K.M.; Rohela, G.K.; Shabnam, A.A.; Ghosh, M.K.; Mishra, R.K. Selection of suitable reference genes for quantitative real-time PCR gene expression analysis in Mulberry (Morus alba L.) under different abiotic stresses. Mol. Biol. Rep. 2019, 46, 1809–1817. [Google Scholar] [CrossRef]
  18. Hayama, H.; Shimada, T.; Fujii, H.; Ito, A.; Kashimura, Y. Ethylene-regulation of fruit softening and softening-related genes in peach. J. Exp. Bot. 2006, 57, 4071–4077. [Google Scholar] [CrossRef] [PubMed]
  19. Yoshioka, H.; Hayama, H.; Tatsuki, M.; Nakamura, Y. Cell wall modification during development of mealy texture in the stony-hard peach “Odoroki” treated with propylene. Postharvest Biol. Technol. 2010, 55, 1–7. [Google Scholar] [CrossRef]
  20. Hayama, H.; Tatsuki, M.; Nakamura, Y. Combined treatment of aminoethoxyvinylglycine (AVG) and 1-methylcyclopropene (1-MCP) reduces melting-flesh peach fruit softening. Postharvest Biol. Technol. 2008, 50, 228–230. [Google Scholar] [CrossRef]
  21. Lu, M.-T.; Song, C.-W.; Huang, C.-C.; Ou, S.-K. Changes in Flesh Firmness and Ethylene Production of Different Peach Types during Fruit Ripening. Acta Hortic. 2008, 153–159. [Google Scholar] [CrossRef]
  22. Haji, T.; Yaegaki, H.; Yamaguchi, M. Changes in ethylene production and flesh firmness of melting, nonmelting and stony hard peaches after harvest. J. Jpn. Soc. Hortic. Sci. 2001, 70, 458–459. [Google Scholar] [CrossRef] [Green Version]
  23. Haji, T.; Yaegaki, H.; Yamaguchi, M. Varietal Differences in the Relationship between Maturation Characteristics, Storage Life and Ethylene Production in Peach Fruit. J. Jpn. Soc. Hortic. Sci. 2004, 73, 97–104. [Google Scholar] [CrossRef] [Green Version]
  24. Lu, R.; Martin-Hernandez, A.M.; Peart, J.R.; Malcuit, I.; Baulcombe, D.C. Virus-induced gene silencing in plants. Methods 2003, 30, 296–303. [Google Scholar] [CrossRef]
  25. Senthil-Kumar, M.; Mysore, K.S. New dimensions for VIGS in plant functional genomics. Trends Plant Sci. 2011, 16, 656–665. [Google Scholar] [CrossRef] [PubMed]
  26. Burch-Smith, T.M.; Anderson, J.C.; Martin, G.B.; Dinesh-Kumar, S.P. Applications and advantages of virus-induced gene silencing for gene function studies in plants. Plant J. 2004, 39, 734–746. [Google Scholar] [CrossRef] [PubMed]
  27. Bai, S.; Tuan, P.A.; Tatsuki, M.; Yaegaki, H.; Ohmiya, A.; Yamamizo, C.; Moriguchi, T. Knockdown of Carotenoid Cleavage Dioxygenase 4 (CCD4) via Virus-Induced Gene Silencing Confers Yellow Coloration in Peach Fruit: Evaluation of Gene Function Related to Fruit Traits. Plant Mol. Biol. Rep. 2015, 34, 257–264. [Google Scholar] [CrossRef]
  28. Li, J.; Li, F.; Qian, M.; Han, M.; Liu, H.; Zhang, D.; Ma, J.; Zhao, C. Characteristics and regulatory pathway of the PrupeSEP1 SEPALLATA gene during ripening and softening in peach fruits. Plant Sci. 2017, 257, 63–73. [Google Scholar] [CrossRef] [PubMed] [Green Version]
  29. Xu, Y.; Zhang, L.; Ma, R. Functional characterization and mapping of two MADS box genes from peach (Prunus persica). Chin. Sci. Bull. 2008, 53, 853–859. [Google Scholar] [CrossRef] [Green Version]
  30. Tatsuki, M.; Nakajima, N.; Fujii, H.; Shimada, T.; Nakano, M.; Hayashi, K.-I.; Hayama, H.; Yoshioka, H.; Nakamura, Y. Increased levels of IAA are required for system 2 ethylene synthesis causing fruit softening in peach (Prunus persica L. Batsch). J. Exp. Bot. 2013, 64, 1049–1059. [Google Scholar] [CrossRef] [PubMed]
  31. Leida, C.A.; Terol, J.; Martí, G.; Agustí, M.; Llácer, G.; Badenes, M.L.; Ríos, G. Identification of genes associated with bud dormancy release in Prunus persica by suppression subtractive hybridization. Tree Physiol. 2010, 30, 655–666. [Google Scholar] [CrossRef] [PubMed] [Green Version]
  32. Li, Z.; Reighard, G.L.; Abbott, A.G.; Bielenberg, D.G. Dormancy-associated MADS genes from the EVG locus of peach [Prunus persica (L.) Batsch] have distinct seasonal and photoperiodic expression patterns. J. Exp. Bot. 2009, 60, 3521–3530. [Google Scholar] [CrossRef] [Green Version]
  33. Livak, K.J.; Schmittgen, T.D. Analysis of Relative Gene Expression Data Using Real-Time Quantitative PCR and the 2−ΔΔCT Method. Methods 2001, 25, 402–408. [Google Scholar] [CrossRef]
  34. Vandesompele, J.; De Preter, K.; Pattyn, F.; Poppe, B.; Van Roy, N.; De Paepe, A.; Speleman, F. Accurate normalization of real-time quantitative RT-PCR data by geometric averaging of multiple internal control genes. Genome Biol. 2002, 3, research0034.1–research0034.11. [Google Scholar] [CrossRef] [PubMed] [Green Version]
  35. Andersen, C.L.; Jensen, J.L.; Ørntoft, T.F. Normalization of Real-Time Quantitative Reverse Transcription-PCR Data: A Model-Based Variance Estimation Approach to Identify Genes Suited for Normalization, Applied to Bladder and Colon Cancer Data Sets. Cancer Res. 2004, 64, 5245–5250. [Google Scholar] [CrossRef] [PubMed] [Green Version]
  36. Pfaffl, M.W.; Tichopad, A.; Prgomet, C.; Neuvians, T.P. Determination of stable housekeeping genes, differentially regulated target genes and sample integrity: BestKeeper—Excel-based tool using pair-wise correlations. Biotechnol. Lett. 2004, 26, 509–515. [Google Scholar] [CrossRef] [PubMed]
  37. Xie, F.; Xiao, P.; Chen, D.; Xu, L.; Zhang, B. miRDeepFinder: A miRNA analysis tool for deep sequencing of plant small RNAs. Plant Mol. Biol. 2012, 80, 75–84. [Google Scholar] [CrossRef] [PubMed]
  38. Valasek, M.A.; Repa, J.J. The power of real-time PCR. Adv. Physiol. Educ. 2005, 29, 151–159. [Google Scholar] [CrossRef] [PubMed]
  39. Løvdal, T.; Lillo, C. Reference gene selection for quantitative real-time PCR normalization in tomato subjected to nitrogen, cold, and light stress. Anal. Biochem. 2009, 387, 238–242. [Google Scholar] [CrossRef]
  40. Mascia, T.; Santovito, E.; Gallitelli, D.; Cillo, F. Evaluation of reference genes for quantitative reverse-transcription polymerase chain reaction normalization in infected tomato plants. Mol. Plant Pathol. 2010, 11, 805–816. [Google Scholar] [CrossRef] [PubMed]
  41. Remans, T.; Smeets, K.; Opdenakker, K.; Mathijsen, D.; Vangronsveld, J.; Cuypers, A. Normalisation of real-time RT-PCR gene expression measurements in Arabidopsis thaliana exposed to increased metal concentrations. Planta 2008, 227, 1343–1349. [Google Scholar] [CrossRef] [Green Version]
  42. Nicot, N.; Hausman, J.-F.; Hoffmann, L.; Evers, D. Housekeeping gene selection for real-time RT-PCR normalization in potato during biotic and abiotic stress. J. Exp. Bot. 2005, 56, 2907–2914. [Google Scholar] [CrossRef] [PubMed]
  43. Libault, M.; Thibivilliers, S.; Bilgin, D.D.; Radwan, O.; Benitez, M.; Clough, S.J.; Stacey, G. Identification of Four Soybean Reference Genes for Gene Expression Normalization. Plant Genome 2008, 1, 44–54. [Google Scholar] [CrossRef]
  44. Hu, R.; Fan, C.; Li, H.; Zhang, Q.; Fu, Y.-F. Evaluation of putative reference genes for gene expression normalization in soybean by quantitative real-time RT-PCR. BMC Mol. Biol. 2009, 10, 93. [Google Scholar] [CrossRef] [PubMed] [Green Version]
  45. Chen, L.; Zhong, H.-Y.; Kuang, J.-F.; Li, J.-G.; Lu, W.-J.; Chen, J.-Y. Validation of reference genes for RT-qPCR studies of gene expression in banana fruit under different experimental conditions. Planta 2011, 234, 377–390. [Google Scholar] [CrossRef] [PubMed]
  46. Jain, M.; Nijhawan, A.; Tyagi, A.K.; Khurana, J.P. Validation of housekeeping genes as internal control for studying gene expression in rice by quantitative real-time PCR. Biochem. Biophys. Res. Commun. 2006, 345, 646–651. [Google Scholar] [CrossRef] [PubMed]
  47. Joseph, J.T.; Poolakkalody, N.J.; Shah, J.M. Plant reference genes for development and stress response studies. J. Biosci. 2018, 43, 173–187. [Google Scholar] [CrossRef] [PubMed]
  48. Zhang, Y.; Peng, X.; Liu, Y.; Li, Y.; Luo, Y.; Wang, X.; Tang, H. Evaluation of suitable reference genes for qRT-PCR normalization in strawberry (Fragaria × ananassa) under different experimental conditions. BMC Mol. Biol. 2018, 19, 8. [Google Scholar] [CrossRef]
  49. Feng, K.; Liu, J.-X.; Xing, G.-M.; Sun, G.; Li, S.; Duan, A.-Q.; Wang, F.; Li, M.-Y.; Xu, Z.-S.; Xiong, A.-S. Selection of appropriate reference genes for RT-qPCR analysis under abiotic stress and hormone treatment in celery. PeerJ 2019, 7, e7925. [Google Scholar] [CrossRef]
  50. Migocka, M.; Papierniak, A. Identification of suitable reference genes for studying gene expression in cucumber plants subjected to abiotic stress and growth regulators. Mol. Breed. 2010, 28, 343–357. [Google Scholar] [CrossRef]
  51. Niu, L.; Tao, Y.-B.; Chen, M.-S.; Fu, Q.; Li, C.; Dong, Y.; Wang, X.; He, H.; Xu, Z.-F. Selection of Reliable Reference Genes for Gene Expression Studies of a Promising Oilseed Crop, Plukenetia volubilis, by Real-Time Quantitative PCR. Int. J. Mol. Sci. 2015, 16, 12513–12530. [Google Scholar] [CrossRef] [PubMed] [Green Version]
Figure 1. Real-time quantitative PCR (RT-qPCR) raw Ct values for ten reference genes in all experimental samples. The boxes represent the 25th and 75th percentiles. A line and a square in each box indicate the median and mean Ct values, respectively. The black dots represent potential outliers.
Genes 13 00160 g001
Figure 2. The measurement (M) values of ten reference genes were calculated by geNorm and ranked across all the samples (A), TRV-infected fruits (B), and different genotypes (C). A higher M value means lower stability, while a lower M value implies more stable gene expression.
Genes 13 00160 g002
Figure 3. The pairwise variation (Vn/Vn + 1) of ten reference genes by geNorm in all the samples (A), TRV-infected fruits (B), and different genotypes (C). Cut-off value is 0.15.
Genes 13 00160 g003
Figure 4. Relative expression levels of PpACO1, PpEIN2, and PpPL during peach fruit storage. The expression pattern was normalized by the best combination of reference gene, the most stable reference gene alone and the least stable reference gene. (AC) gene expression levels in TRV-infected ‘Zao Feng Wang’ (ZFW) fruits during storage, (DF) gene expression levels in ‘Rui Hong’ (RH) during storage, and (HG) gene expression levels in ‘Qin Wang’ (QW) during storage. MF: melting flesh; SH: stony-hard. Data shown the means with standard error (n = 3).
Genes 13 00160 g004
Table 1. Ranking of variation value for ten reference genes calculated by Normfinder.
RankAll SamplesTRV-Infected FruitsDifferent Genotypes
No Subgroups2 Subgroups
1CYP20.192RP II0.110CYP20.125CYP20.222
2RP II0.381CYP20.133Tua50.211UBQ100.404
3Tub10.407Tub10.218RP II0.226RP II0.426
4UBQ100.417Tua50.227Actin0.252Tub10.432
5Tua50.437UBQ100.240Tub10.267Tua50.470
6Actin0.478PLA20.291UBQ100.433Actin0.476
7GADPH0.625Actin0.312PLA20.471GADPH0.544
8PLA20.691TEF20.343GADPH0.775PLA20.739
9TEF20.794GADPH0.350TEF20.815TEF20.785
1018S0.98018S0.44418S0.81618S0.969
Table 2. The R values of ten reference genes were calculated by BestKepper.
RankAll SamplesTRV-Infected FruitsDifferent Genotypes
CV ± SDR CV ± SDR CV ± SDR
1CYP23.10 ± 0.810.954CYP23.97 ± 1.010.999Tua53.24 ± 0.810.934
2Tua54.02 ± 0.990.954Actin5.88 ± 1.200.991CYP22.40 ± 0.630.918
3TEF25.18 ± 1.160.928Tub15.37 ± 1.200.989Actin4.05 ± 0.840.907
4RP II3.23 ± 0.790.916Tua54.80 ± 1.150.984RP II2.71 ± 0.670.881
5Actin4.66 ± 0.970.915TEF27.64 ± 1.650.978TEF24.13 ± 0.940.867
6Tub13.66 ± 0.840.896RP II3.99 ± 0.950.971UBQ102.64 ± 0.590.835
7UBQ103.51 ± 0.780.891UBQ103.43 ± 0.730.969GADPH3.39 ± 0.730.815
8GADPH4.55 ± 0.960.848PLA23.27 ± 0.900.966Tub12.83 ± 0.650.803
9PLA22.62 ± 0.740.74118S5.72 ± 0.590.95718S5.75 ± 0.600.437
1018S5.87 ± 0.610.554GADPH5.40 ± 1.090.145PLA21.66 ± 0.470.435
Table 3. Comprehensive ranking of ten reference genes were calculated by RefFinder.
RankAll SamplesTRV-Infected FruitsDifferent Genotypes
1CYP21.50CYP22.11CYP21.41
2Tub12.45Tua53.03Tub12.51
3RPII3.13Actin3.22UBQ102.63
4UBQ104.12Tub13.56RPII4.61
5Actin5.42RPII4.16PLA24.76
618S5.62UBQ104.56Actin5.05
7PLA25.6618S5.62Tua56.16
8Tua55.79PLA25.66GADPH7.00
9GADPH7.00GADPH7.9018S7.40
10TEF29.24TEF28.71TEF29.24
Publisher’s Note: MDPI stays neutral with regard to jurisdictional claims in published maps and institutional affiliations.

