
Association and Gene–Gene Interactions Study of Late-Onset Alzheimer’s Disease in the Russian Population

 ,
,
Abstract
:1. Introduction
2. Materials and Methods
2.1. Samples
2.2. Genotyping
2.3. Statistical Analyses
3. Results
4. Discussion
5. Conclusions
Author Contributions
Funding
Institutional Review Board Statement
Informed Consent Statement
Conflicts of Interest
References
- Alzheimer’s Association Report. Alzheimer’s disease facts and figures. Alzheimer’s Dement. 2019, 15, 321–387. Available online: https://alz-journals.onlinelibrary.wiley.com/doi/abs/10.1016/j.jalz.2019.01.010 (accessed on 6 August 2021).
- Patterson, C. World Alzheimer Report. In The State of the Art of Dementia Research: New Frontiers; Alzheimer’s Disease International: London, UK, 2018; Available online: https://www.alz.co.uk/research/WorldAlzheimerReport2018.pdf (accessed on 21 September 2018).
- Sosa-Ortiz, A.L.; Acosta-Castillo, I.; Prince, M.J. Epidemiology of dementias and Alzheimer’s disease. Arch. Med. Res. 2012, 43, 600–608. [Google Scholar] [CrossRef]
- Alzheimer’s Association Report. Alzheimer’s disease facts and figures. Alzheimer’s Dement. 2012, 8, 131–168. Available online: https://www.sciencedirect.com/science/article/abs/pii/S1552526012000325 (accessed on 6 August 2021).
- Gatz, M.; Reynolds, C.A.; Fratiglioni, L.; Johansson, B.; Mortimer, J.A.; Berg, S.; Fiske, A.; Pedersen, N.L. Role of genes and environments for explaining Alzheimer disease. Arch. Gen. Psychiatry 2006, 63, 168–174. [Google Scholar] [CrossRef]
- Prestia, A.; Boccardi, M.; Galluzzi, S.; Cavedo, E.; Adorni, A.; Soricelli, A.; Bonetti, M.; Geroldi, C.; Giannakopoulos, P.; Thompson, P.; et al. Hippocampal and amygdalar volume changes in elderly patients with Alzheimer’s disease and schizophrenia. Psychiatry Res. 2011, 192, 77–83. [Google Scholar] [CrossRef] [PubMed]
- Horesh, Y.; Katsel, P.; Haroutunian, V.; Domany, E. Gene expression signature is shared by patients with Alzheimer’s disease and schizophrenia at the superior temporal gyrus. Eur. J. Neurol. 2011, 18, 410–424. [Google Scholar] [CrossRef] [PubMed]
- Lambert, J.C.; Heath, S.; Even, G.; Campion, D.; Sleegers, K.; Hiltunen, M.; Combarros, O.; Zelenika, D.; Bullido, M.J.; Tavernier, B.; et al. Genome-wide association study identifies variants at CLU and CR1 associated with Alzheimer’s disease. Nat. Genet. 2009, 41, 1094–1099. [Google Scholar] [CrossRef] [PubMed]
- Harold, D.; Abraham, R.; Hollingworth, P.; Sims, R.; Gerrish, A.; Hamshere, M.L.; Pahwa, J.S.; Moskvina, V.; Dowzell, K.; Williams, A.; et al. Genome-wide association study identifies variants at CLU and PICALM associated with Alzheimer’s diseases. Nat. Genet. 2009, 41, 1088–1093. [Google Scholar] [CrossRef] [Green Version]
- Logue, M.W.; Schu, M.; Vardarajan, B.N.; Buros, J.; Green, R.C.; Go, R.C.P.; Griffith, P.; Obisesan, T.O.; Shatz, R.; Borenstein, A.; et al. A comprehensive genetic association study of Alzheimer disease in African Americans. Arch. Neurol. 2011, 68, 1569–1579. [Google Scholar] [CrossRef] [PubMed] [Green Version]
- Cruchaga, C.; Haller, G.; Chakraverty, S.; Mayo, K.; Vallania, F.L.; Mitra, R.D.; Faber, K.; Williamson, J.; Bird, T.; Diaz-Arrastia, R.; et al. Rare variants in APP, PSEN1 and PSEN2 increase risk for AD in late-onset Alzheimer’s disease families. PLoS ONE 2012, 7, e31039. [Google Scholar] [CrossRef]
- Holmans, P.; Green, E.K.; Pahwa, J.S.; Ferreira, M.A.; Purcell, S.M.; Sklar, P.; Owen, M.J.; O’Donovan, M.C.; Craddock, N.; Wellcome Trust Case-Control Consortium. Gene ontology analysis of GWA study data sets provides insights into the biology of bipolar disorder. Am. J. Hum. Genet. 2009, 85, 13–24. [Google Scholar] [CrossRef] [Green Version]
- Kanehisa, M.; Goto, S.; Hattori, M.; Aoki-Kinoshita, K.F.; Itoh, M.; Kawashima, S.; Katayama, T.; Araki, M.; Hirakawa, M. From genomics to chemical genomics: New developments in KEGG. Nucleic Acids Res. 2006, 34, D354–D357. [Google Scholar] [CrossRef] [PubMed]
- Harris, M.A.; Clark, J.; Ireland, A.; Lomax, J.; Ashburner, M.; Foulger, R.; Eilbeck, K.; Lewis, S.; Marshall, B.; Mungall, C.; et al. The Gene Ontology (GO) database and informatics resource. Nucleic Acids Res. 2004, 32, D258–D261. [Google Scholar] [PubMed] [Green Version]
- Szklarczyk, D.; Franceschini, A.; Wyder, S.; Forslund, K.; Heller, D.; Huerta-Cepas, J.; Simonovic, M.; Roth, A.; Santos, A.; Tsafou, K.P.; et al. STRING v10: Protein–protein interaction networks, integrated over the tree of life. Nucleic Acids Res. 2015, 43, 447–452. [Google Scholar] [CrossRef]
- Warde-Farley, D.; Donaldson, S.L.; Comes, O.; Zuberi, K.; Badrawi, R.; Chao, P.; Franz, M.; Grouios, C.; Kazi, F.; Lopes, C.T.; et al. The GeneMANIA prediction server: Biological network integration for gene prioritization and predicting gene function. Nucleic Acids Res. 2010, 38, W214–W220. [Google Scholar] [CrossRef]
- Bocharova, A.V.; Stepanov, V.A. Genetic diversity of populations in North Eurasia by genetic markers associated with diseases impairing human cognitive functions. Russ. J. Genet. 2021, 57, 1082–1091. [Google Scholar] [CrossRef]
- American Psychiatric Association. Diagnostic and Statistical Manual of Mental Disorders, 4th ed.; American Psychiatric Association: Washington, DC, USA, 2010. [Google Scholar]
- McKhann, G.; Drachman, D.; Folstein, M.; Katzman, R.; Price, D.; Stadlan, E.M. Clinical diagnosis of Alzheimer’s disease: Report of the NINCDS-ADRDA Work Group under the auspices of Department of Health and Human Services Task Force on Alzheimer’s Disease. Neurology 1984, 34, 939–944. [Google Scholar] [CrossRef] [Green Version]
- Benjamini, Y.; Hochberg, Y. Controlling the false discovery rate: A practical and powerful approach to multiple testing. J. R. Stat. Soc. Ser. B 1995, 57, 289–300. [Google Scholar] [CrossRef]
- Barrett, J.C.; Fry, B.; Maller, J.; Daly, M.J. Haploview: Analysis and visualization of LD and haplotype maps. Bioinformatics. 2005, 21, 263–265. [Google Scholar] [CrossRef] [PubMed] [Green Version]
- Chen, G.B.; Xu, Y.; Xu, H.M.; Li, M.D.; Zhu, J.; Lou, X.Y. Practical and theoretical considerations in study design for detecting gene-gene interactions using MDR and GMDR approaches. PLoS ONE 2011, 6, e16981. [Google Scholar] [CrossRef] [PubMed]
- Lipnicki, D.M.; Crawford, J.; Kochan, N.A.; Trollor, J.N.; Draper, B.; Reppermund, S.; Maston, K.; Mather, K.A.; Brodaty, H.; Sachdev, P.S.; et al. Risk factors for mild cognitive impairment, dementia and mortality: The Sydney Memory and Ageing Study. J. Am. Med. Dir. Assoc. 2017, 18, 388–395. [Google Scholar] [CrossRef] [PubMed]
- Martínez-Martínez, A.B.; Torres-Perez, E.; Devanney, N.; Del Moral, R.; Johnson, L.A.; Arbones-Mainar, J.M. Beyond the CNS: The many peripheral roles of APOE. Neurobiol. Dis. 2020, 138, 104809. [Google Scholar] [CrossRef] [PubMed]
- Cai, C.; Wen, Z.; Li, L. The relationship between ApoE gene polymorphism and the efficacy of statins controlling hyperlipidemia. Am. J. Transl. Res. 2021, 13, 6772–6777. [Google Scholar] [PubMed]
- Liu, G.; Bao, X.; Jiang, Y.; Liao, M.; Jiang, Q.; Feng, R.; Zhang, L.; Ma, G.; Chen, Z.; Wang, G.; et al. Identifying the Association Between Alzheimer’s Disease and Parkinson’s Disease Using Genome-Wide Association Studies and Protein-Protein Interaction Network. Mol. Neurobiol. 2015, 52, 1629–1636. [Google Scholar] [CrossRef] [PubMed]
- Wei, C.J.; Cui, P.; Li, H.; Lang, W.J.; Liu, G.Y.; Ma, X.F. Shared genes between Alzheimer’s disease and ischemic stroke. CNS Neurosci. Ther. 2019, 25, 855–864. [Google Scholar] [CrossRef] [PubMed]
- DeMichele-Sweet, M.A.A.; Weamer, E.A.; Klei, L.; Vrana, D.T.; Hollingshead, D.J.; Seltman, H.J.; Sims, R.; Foroud, T.; Hernandez, I.; Moreno-Grau, S.; et al. Genetic risk for schizophrenia and psychosis in Alzheimer disease. Mol. Psychiatry 2018, 23, 963–972. [Google Scholar] [CrossRef]
- Johansson, J.U.; Brubaker, W.D.; Javitz, H.; Bergen, A.W.; Nishita, D.; Trigunaite, A.; Crane, A.; Ceballos, J.; Mastroeni, D.; Tenner, A.J.; et al. Peripheral complement interactions with amyloid β peptide in Alzheimer’s disease: Polymorphisms, structure, and function of complement receptor 1. Alzheimers Dement. 2018, 14, 1438–1449. [Google Scholar] [CrossRef]
- Salakhov, R.R.; Goncharova, I.A.; Makeeva, O.A.; Golubenko, M.V.; Kulish, E.V.; Kashtalap, V.V.; Barbarash, O.L.; Puzyrev, V.P. TOMM40 Gene Polymorphisms Association with Lipid Profile. Genetika 2014, 50, 222–229. [Google Scholar] [CrossRef]
- Jansen, I.E.; Savage, J.E.; Watanabe, K.; Bryois, J.; Williams, D.M.; Steinberg, S.; Sealock, J.; Karlsson, I.K.; Hägg, S.; Athanasiu, L.; et al. Genome-wide meta-analysis identifies new loci and functional pathways influencing Alzheimer’s disease risk. Nat. Genet. 2019, 51, 404–413. [Google Scholar] [CrossRef]
- Stepanov, V.A.; Bocharova, A.V.; Marusin, A.V.; Zhukova, N.G.; Alifirova, V.M.; Zhukova, I.A. Replicative association analysis of genetic markers of cognitive traits with Alzheimer’s disease in the Russian population. Mol. Biol. 2014, 48, 952–962. [Google Scholar] [CrossRef]
- Corder, E.H.; Saunders, A.M.; Strittmatter, W.J.; Schmechel, D.E.; Gaskell, P.C.; Small, G.W.; Roses, A.D.; Haines, J.L.; Pericak-Vance, M.A. Gene dose of apolipoprotein E type 4 allele and the risk of Alzheimer’s disease in late onset families. Science 1993, 261, 921–923. [Google Scholar] [CrossRef]
- Arpawong, T.E.; Pendleton, N.; Mekli, K.; McArdle, J.J.; Gatz, M.; Armoskus, C.; Knowles, J.A.; Prescott, C.A. Genetic variants specific to aging-related verbal memory: Insights from GWASs in a population-based cohort. PLoS ONE 2017, 12, e0182448. [Google Scholar] [CrossRef]
- Roses, A.D.; Lutz, M.W.; Amrine-Madsen, H.; Saunders, A.M.; Crenshaw, D.G.; Sundseth, S.S.; Huentelman, M.J.; Welsh-Bohmer, K.A.; Reiman, E.M. A TOMM40 variable-length polymorphism predicts the age of late-onset Alzheimer’s disease. Pharmacogenomics J. 2010, 10, 375–384. [Google Scholar] [CrossRef] [PubMed] [Green Version]
- Sebastiani, P.; Gurinovich, A.; Nygaard, M.; Sasaki, T.; Sweigart, B.; Bae, H.; Andersen, S.L.; Villa, F.; Atzmon, G.; Christensen, K.; et al. APOE Alleles and Extreme Human Longevity. J. Gerontol. Ser. A Biol. Sci. Med. Sci. 2019, 74, 44–51. [Google Scholar] [CrossRef] [Green Version]
- Forrest, M.; Chapman, R.M.; Doyle, A.M.; Tinsley, C.L.; Waite, A.; Blake, D.J. Functional analysis of TCF4 missense mutations that cause Pitt–Hopkins syndrome. Hum. Mutat. 2012, 33, 1676–1686. [Google Scholar] [CrossRef] [PubMed]
- Stefansson, H.; Ophoff, R.A.; Steinberg, S.; Andreassen, O.A.; Cichon, S.; Rujescu, D.; Werge, T.; Pietiläinen, O.P.; Mors, O.; Mortensen, P.B.; et al. Common variants conferring risk of schizophrenia. Nature 2009, 460, 744–747. [Google Scholar] [CrossRef] [Green Version]
- Wirgenes, K.V.; Sønderby, I.E.; Haukvik, U.K.; Mattingsdal, M.; Tesli, M.; Athanasiu, L.; Sundet, K.; Røssberg, J.I.; Dale, A.M.; Brown, A.A.; et al. TCF4 sequence variants and mRNA levels are associated with neurodevelopmental characteristics in psychotic disorders. Transl. Psychiatry 2012, 2, e112. [Google Scholar] [CrossRef] [PubMed]
- Eckart, N.; Song, Q.; Yang, R.; Wang, R.; Zhu, H.; McCallion, A.S.; Avramopoulos, D. Functional Characterization of Schizophrenia-Associated Variation in CACNA1C. PLoS ONE 2016, 11, e0157086. [Google Scholar] [CrossRef] [Green Version]
- Green, E.K.; Grozeva, D.; Jones, I.; Jones, L.; Kirov, G.; Caesar, S.; Gordon-Smith, K.; Fraser, C.; Forty, L.; Russell, E.; et al. The bipolar disorder risk allele at CACNA1C also confers risk of recurrent major depression and of schizophrenia. Mol. Psychiatry 2010, 15, 1016–1022. [Google Scholar] [CrossRef] [Green Version]
- Cross-Disorder Group of the Psychiatric Genomics Consortium. Identification of risk loci with shared effects on five major psychiatric disorders: A genome-wide analysis. Lancet 2013, 381, 1371–1379. [Google Scholar] [CrossRef]
- Ishii, K.; Kubo, K.I.; Nakajima, K. Reelin and neuropsychiatric disorders. Front. Cell. Neurosci. 2016, 10, 229. [Google Scholar] [CrossRef] [PubMed] [Green Version]
- Ovadia, G.; Shifman, S. The genetic variation of RELN expression in schizophrenia and bipolar disorder. PLoS ONE 2011, 6, e19955. [Google Scholar] [CrossRef]
- Bufill, E.; Roura-Poch, P.; Sala-Matavera, I.; Antón, S.; Lleó, A.; Sánchez-Saudinós, B.; Tomàs-Abadal, L.; Puig, T.; Abós, J.; Bernades, S.; et al. Reelin signaling pathway genotypes and Alzheimer disease in a Spanish population. Alzheimer Dis. Assoc. Disord. 2015, 29, 169–172. [Google Scholar] [CrossRef]


| Parameter | Patients with LOAD, n = 185 | Control Group, n = 287 |
|---|---|---|
| Gender: Women | 120 (64.86%) | 200 (69.69%) |
| Gender: Men | 65 (35.14%) | 87 (30.31%) |
| Mean age | 72.15 ± 7.87 | 71.8 ± 5.70 |
| Race | Caucasoid | Caucasoid |
| Population | Russians | Russians |
| Gene. | SNP ID | Allele a | Functional Consequence (NCBI) | Position (GRCh38) | Minor Allele Frequency | MAF | |
|---|---|---|---|---|---|---|---|
| Cases | Controls | HapMap | |||||
| CHD6 | rs1010304 | G/A | intron variant | 20:41473007 | 0.06 | 0.05 | 0.06 |
| NCAPD3 | rs1031381 | T/C | intron variant | 11:134218788 | 0.40 | 0.43 | 0.42 |
| MPC2 | rs10489202 | T/G | intron variant | 1:167933841 | 0.21 | 0.20 | 0.22 |
| CSMD1 | rs10503253 | A/C | intron variant | 8:4323322 | 0.23 | 0.27 | 0.26 |
| CCDC60 | rs11064768 | G/A | intron variant | 12:119380704 | 0.08 | 0.07 | 0.07 |
| NT5C2 | rs11191580 | C/T | intron variant | 10:103146454 | 0.09 | 0.09 | 0.11 |
| LOC105378889-PRMT6 | rs12125971 | T/C | intergenic variant | 1:106921021 | 0.08 | 0.08 | 0.07 |
| LOC101928778-LOC105371627 | rs12140439 | A/C | intergenic variant | 1:177753772 | 0.29 | 0.30 | 0.34 |
| TENM4 | rs12290811 | A/T | intron variant | 11:79372576 | 0.12 | 0.12 | 0.14 |
| LUZP2 | rs12361953 | G/T | intron variant | 11:24589584 | 0.14 | 0.14 | 0.15 |
| CADM2 | rs12494658 | C/T | intron variant | 3:85825326 | 0.24 | 0.30 | 0.28 |
| SNX29 | rs12922317 | G/A | intron variant | 16:11983775 | 0.40 | 0.35 | 0.35 |
| LOC105373605 | rs12989701 | A/C | intron variant | 2:127130409 | 0.10 | 0.15 | 0.15 |
| CTNNA2 | rs13034462 | G/T | intron variant | 2:79892368 | 0.03 | 0.04 | 0.05 |
| BRD1 | rs138880 | C/A | intron variant | 22:49824963 | 0.21 | 0.21 | 0.23 |
| DCHS2 | rs1466662 | A/T | intron variant | 4:154426241 | 0.35 | 0.35 | 0.69 |
| CLU | rs1532278 | T/C | intron variant | 8:27608798 | 0.44 | 0.39 | 0.38 |
| TOMM40 | rs157580 | G/A | intron variant | 19:44892009 | 0.34 | 0.36 | 0.35 |
| LOC730100 | rs1606974 | A/G | intron variant | 2:51646461 | 0.08 | 0.06 | 0.07 |
| NKAPL | rs1635 | T/G | missense variant | 6:28259826 | 0.07 | 0.06 | 0.05 |
| LSM1 | rs16887244 | G/A | intron variant | 8:38173827 | 0.23 | 0.21 | 0.21 |
| POM121L2 | rs16897515 | A/C | missense variant | 6:27310241 | 0.09 | 0.11 | 0.12 |
| CNTN4 | rs17194490 | T/G | intron variant | 3:2506102 | 0.18 | 0.15 | 0.14 |
| ARHGAP31 | rs17203055 | G/A | intron variant | 3:119365484 | 0.11 | 0.10 | 0.12 |
| TCF4 | rs17512836 | C/T | intron variant | 18:55527730 | 0.008 | 0.02 | 0.05 |
| CADM2 | rs17518584 | C/T | intron variant | 3:85555773 | 0.34 | 0.32 | 0.30 |
| TCF4 | rs17594526 | T/C | intron variant | 18:55391007 | 0.01 | 0.02 | 0.05 |
| GPR89P- TRV-AAC1-5 | rs17693963 | C/A | intergenic variant | 6:27742386 | 0.06 | 0.06 | 0.08 |
| TOMM40 | rs2075650 | G/A | intron variant | 19:44892362 | 0.26 | 0.28 | 0.16 |
| CLU | rs2279590 | T/C | intron variant | 8:27598736 | 0.44 | 0.40 | 0.39 |
| ZNF365 | rs2393895 | C/A | intron variant | 10:62579087 | 0.23 | 0.23 | 0.20 |
| CSMD1 | rs2616984 | G/A | intron variant | 8:4625619 | 0.33 | 0.31 | 0.29 |
| DNAH11 | rs368331 | G/A | intron variant | 7:21703356 | 0.07 | 0.06 | 0.06 |
| FBXO40 | rs3772130 | G/A | intron variant | 3:121625293 | 0.20 | 0.25 | 0.25 |
| STK24 | rs3783006 | C/G | intron variant | 13:98458955 | 0.46 | 0.48 | 0.47 |
| CR1 | rs3818361 | A/G | intron variant | 1:207611623 | 0.33 | 0.25 | 0.25 |
| CD33 | rs3826656 | G/A | intron variant | 19:51223357 | 0.24 | 0.24 | 0.23 |
| APOE | rs429358 | C/T | missense variant | 19:44908684 | 0.22 | 0.10 | 0.13 |
| ACSM1 | rs433598 | T/C | intron variant | 16:20668884 | 0.35 | 0.37 | 0.34 |
| APOC1 | rs4420638 | G/A | 500B Downstream Variant | 19:44919689 | 0.18 | 0.14 | 0.18 |
| CNTN4 | rs4629318 | A/G | intron variant | 3:2851590 | 0.15 | 0.15 | 0.14 |
| CDON | rs472926 | G/A | intron variant | 11:126035363 | 0.16 | 0.17 | 0.17 |
| CACNA1C | rs4765905 | C/G | intron variant | 12:2240418 | 0.32 | 0.37 | 0.37 |
| TENM4 | rs530965 | T/C | intron variant | 11:79354056 | 0.49 | 0.47 | 0.49 |
| CSMD2 | rs544991 | T/C | intron variant | 1:33723829 | 0.31 | 0.27 | 0.31 |
| PICALM- RNU6-560P | rs561655 | G/A | intergenic variant | 11:86089237 | 0.30 | 0.35 | 0.33 |
| CHD6 | rs6129846 | T/C | intron variant | 20:41478674 | 0.06 | 0.05 | 0.06 |
| NRXN3 | rs6574433 | G/A | intron variant | 14:78319816 | 0.45 | 0.42 | 0.42 |
| CR1 | rs6656401 | A/G | intron variant | 1:207518704 | 0.31 | 0.23 | 0.24 |
| NECTIN2 | rs6857 | T/C | 3 Prime UTR Variant | 19:44888997 | 0.28 | 0.19 | 0.17 |
| NECTIN2 | rs6859 | A/G | intron variant | 19:44878777 | 0.50 | 0.42 | 0.44 |
| LOC105375630 | rs7004633 | G/A | intron variant | 8:88748082 | 0.21 | 0.19 | 0.20 |
| RELN | rs7341475 | A/G | intron variant | 7:103764368 | 0.16 | 0.19 | 0.16 |
| LOC105373605 | rs7561528 | A/G | intron variant | 2:127132061 | 0.31 | 0.31 | 0.34 |
| APOE | rs769449 | A/G | intron variant | 19:44906745 | 0.17 | 0.08 | 0.10 |
| KLHL1 | rs7984606 | C/A | intron variant | 13:69881529 | 0.003 | 0.004 | 0.05 |
| NKAIN2 | rs9491140 | T/C | intron variant | 6:124370091 | 0.32 | 0.32 | 0.31 |
| APOE | rs7412 | T/C | missense variant | 19:44908822 | 0.08 | 0.07 | 0.07 |
| Gene | Variant | Minor Allele | OR (95% CI) | Major Allele | OR (95% CI) | p Value | p Value Corrected |
|---|---|---|---|---|---|---|---|
| APOE4 * (ε3/ε4) | rs429358 rs7412 | ε4 | 2.88 (1.95–4.24) | ε3 | 0.35 (0.24–0.51) | 5 × 10⁻⁸ | 8.62 × 10⁻⁴ |
| APOE * | rs769449 | A | 2.44 (1.62–3.66) | G | 0.41 (0.27–0.62) | 1 × 10⁻⁵ | 2.5 × 10⁻³ |
| APOE * | rs429358 | C | 2.53 (1.75–3.67) | T | 0.39 (0.27–0.57) | 5 × 10⁻⁷ | 1.7 × 10⁻³ |
| TOMM40 * | rs2075650 | G | 1.67 (1.21–2.29) | A | 0.60 (0.44–0.82) | 2 × 10⁻³ | 3.4 × 10⁻³ |
| NECTIN2 * | rs6857 | T | 1.65 (1.21–2.26) | C | 0.61 (0.44–0.83) | 2 × 10⁻³ | 4.3 × 10⁻³ |
| CR1 | rs3818361 | A | 1.5 (1.12–2.00) | G | 0.67 (0.5–0.89) | 6 × 10⁻³ | 5.2 × 10⁻³ |
| CR1 | rs6656401 | A | 1.46 (1.09–1.96) | G | 0.68 (0.51–0.92) | 0.01 | 6 × 10⁻³ |
| NECTIN2 | rs6859 | A | 1.34 (1.03–1.74) | G | 0.75 (0.57–0.97) | 0.03 | 6.8 × 10⁻³ |
| FBXO40 | rs3772130 | G | 0.72 (0.52–0.99) | A | 1.39 (1.01–1.91) | 0.04 | 7.7 × 10⁻³ |
| N | rs, Gene | Haplotype Frequencies (Cases/Controls) % | |||||||
|---|---|---|---|---|---|---|---|---|---|
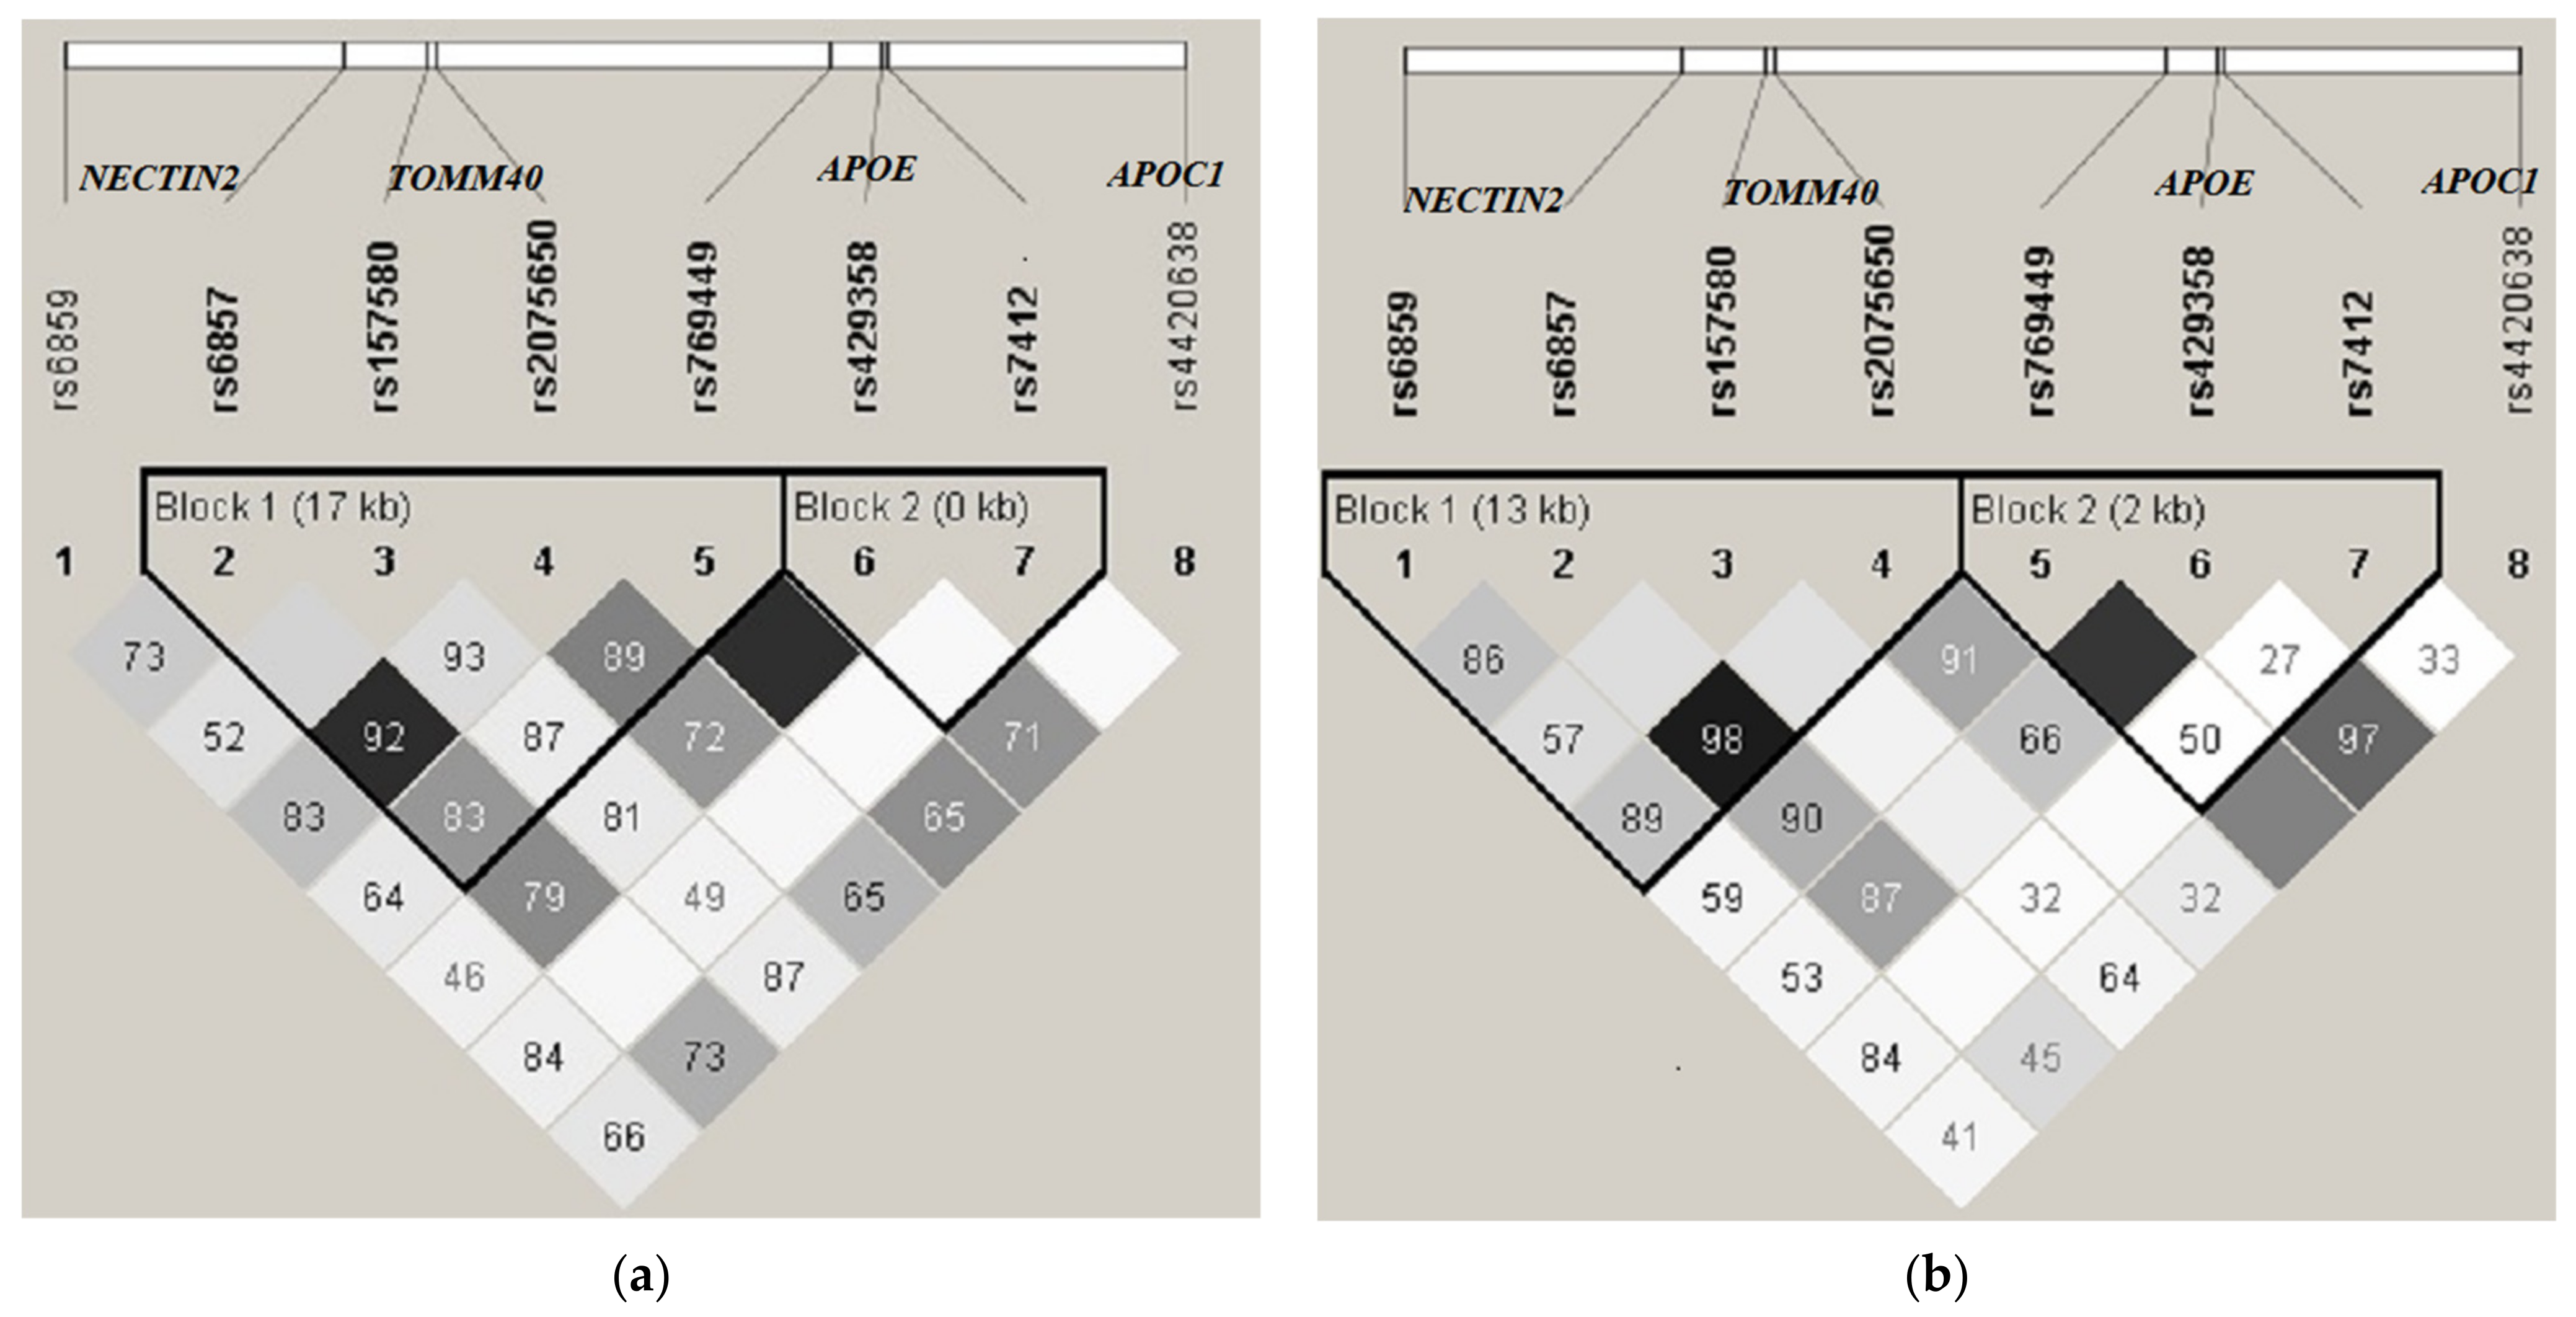
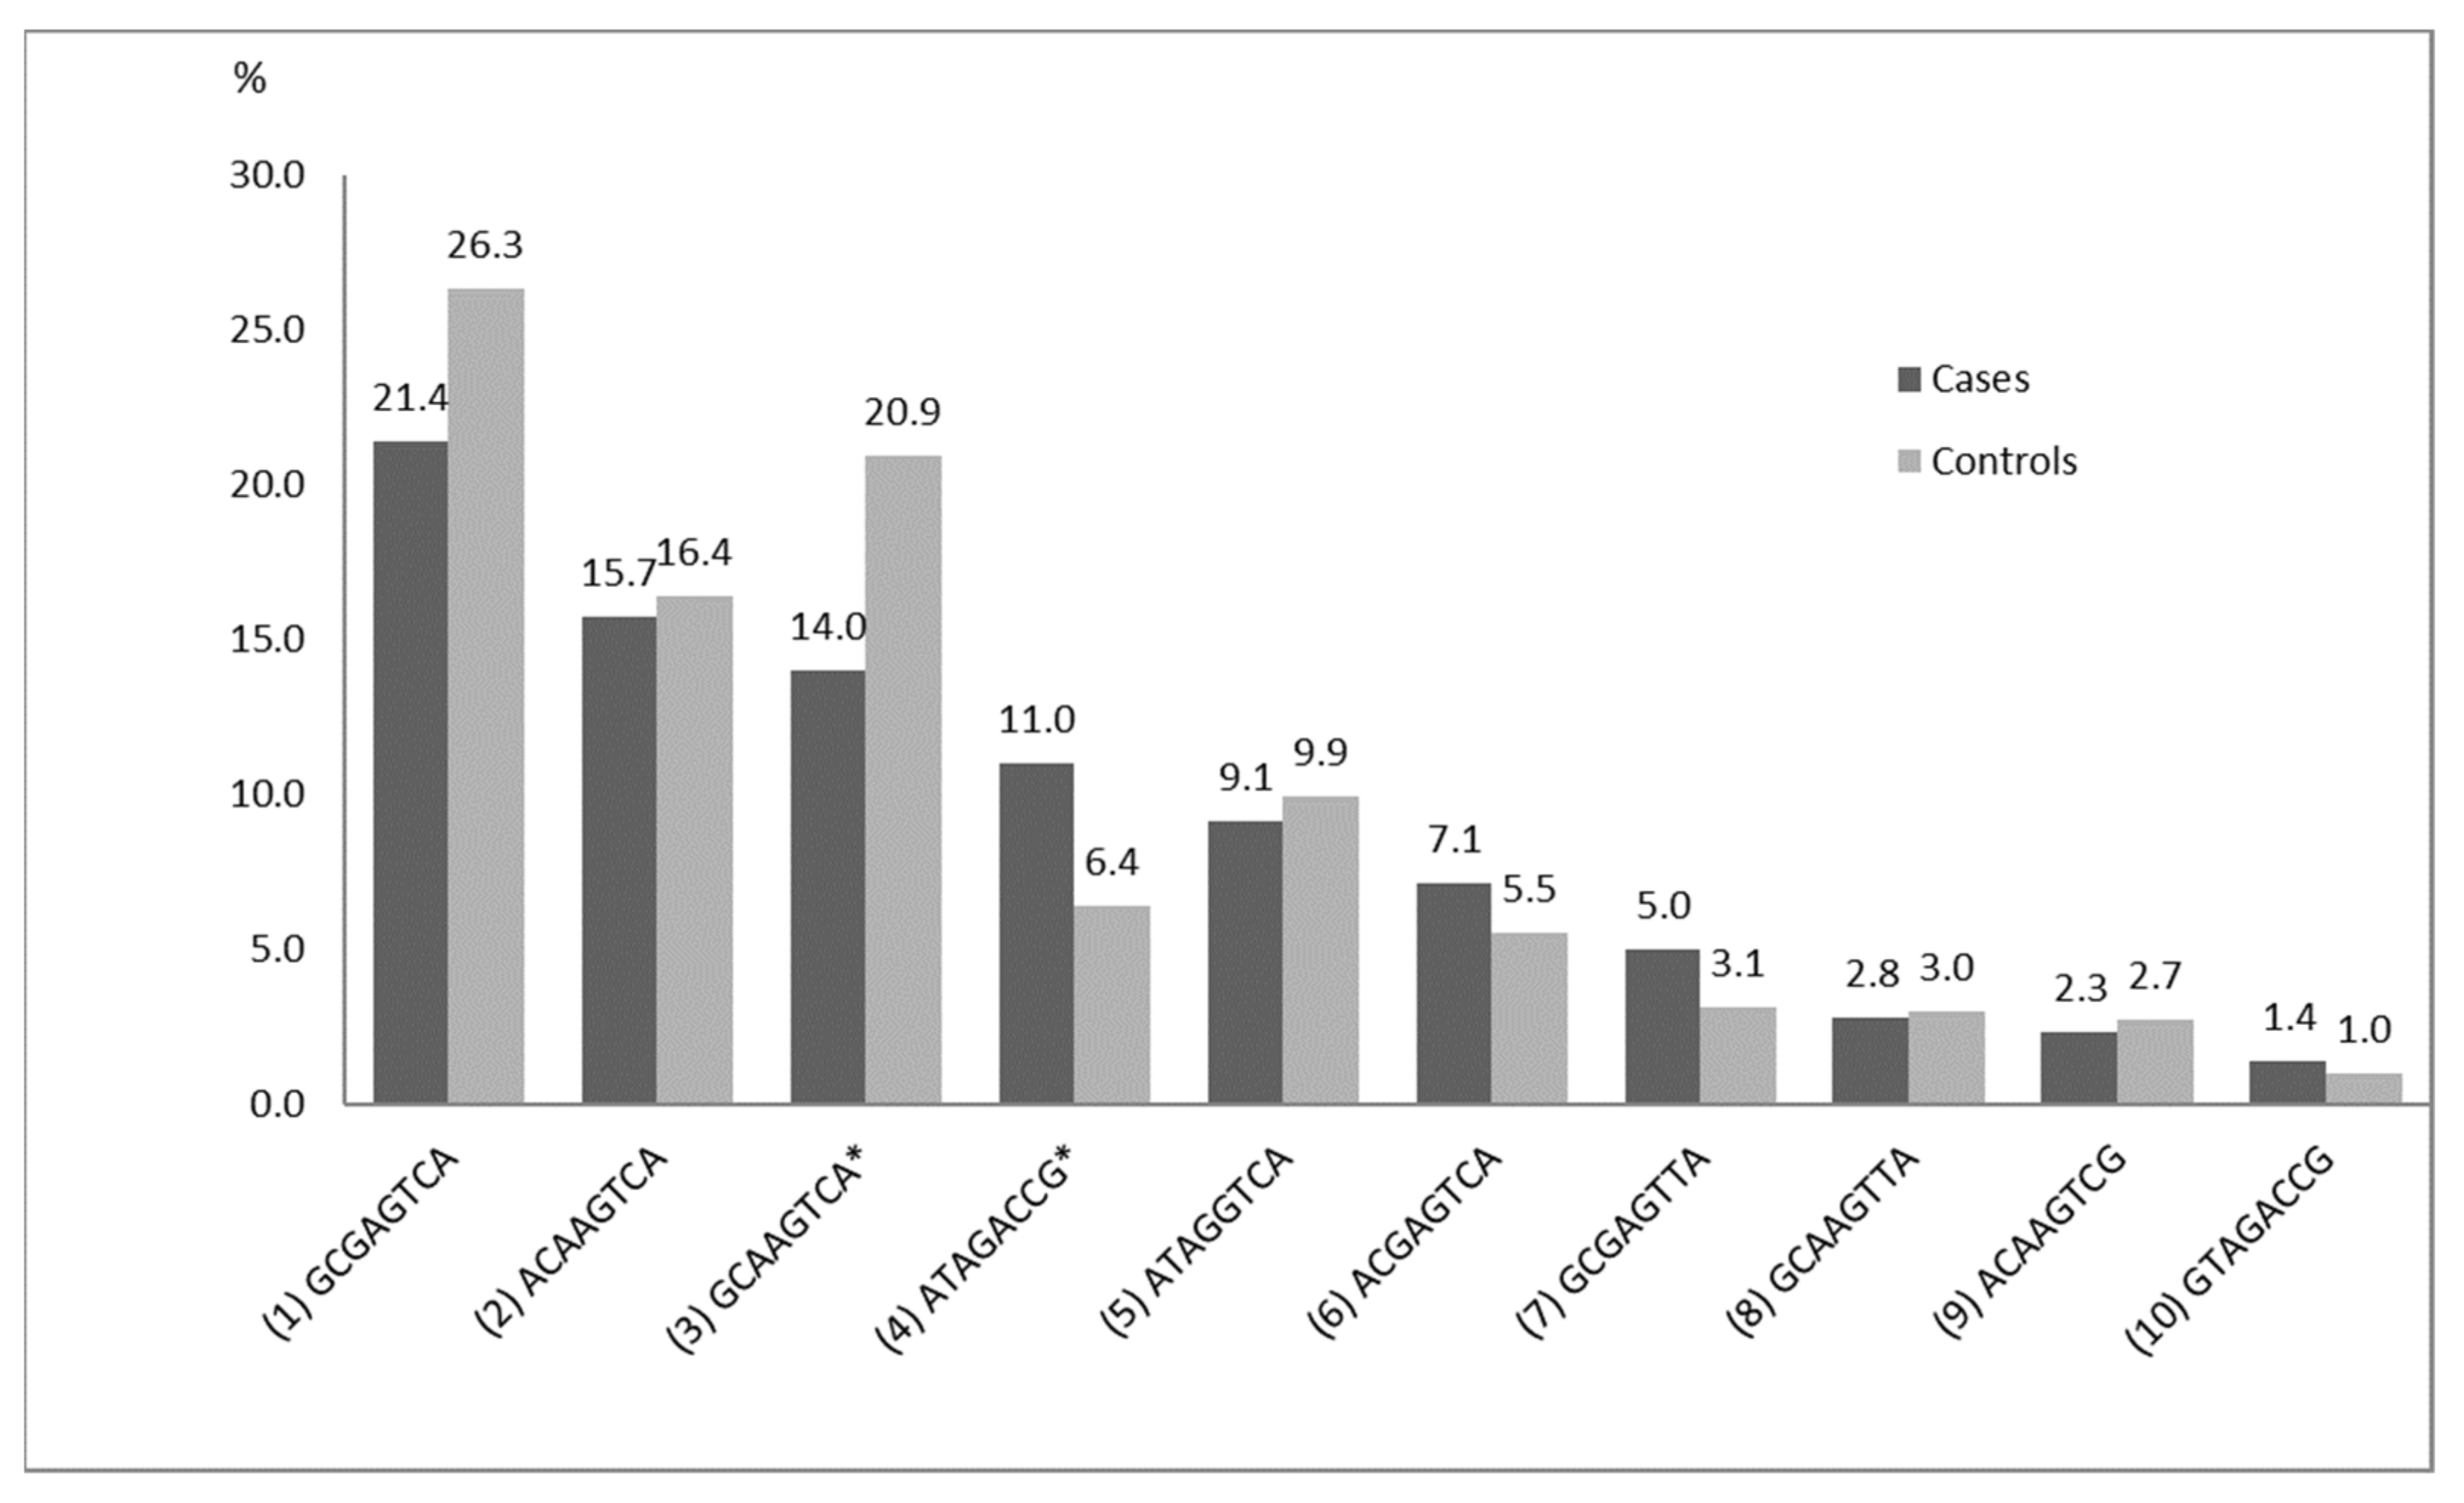
| rs6859 NECTIN2 | rs6857 NECTIN2 | rs157580 TOMM40 | rs2075650 TOMM40 | rs769449 APOE | rs429358 APOE | rs7412 APOE | rs4420638 APOC1 | ||
| 1 | G | C | G | A | G | T | C | A | 21.4/26.3 |
| 2 | A | C | A | A | G | T | C | A | 15.7/16.4 |
| 3 | G | C | A | A | G | T | C | A | 14.0/20.9 |
| 4 | A | T | A | G | A | C | C | G | 11.0/6.4 |
| 5 | A | T | A | G | G | T | C | A | 9.1/9.9 |
| 6 | A | C | G | A | G | T | C | A | 7.1/5.5 |
| 7 | G | C | G | A | G | T | T | A | 5.0/3.1 |
| 8 | G | C | A | A | G | T | T | A | 2.8/3.0 |
| 9 | A | C | A | A | G | T | C | G | 2.3/2.7 |
| 10 | G | T | A | G | A | C | C | G | 1.4/1.0 |
| 11 | G | T | A | A | G | C | C | G | 1.1/0.6 |
| 12 | G | C | A | A | A | C | C | G | 0.7/0.6 |
| 13 | A | T | A | A | G | C | C | G | 0.7/0.8 |
| 14 | G | C | A | A | G | T | C | G | 0.5/1.0 |
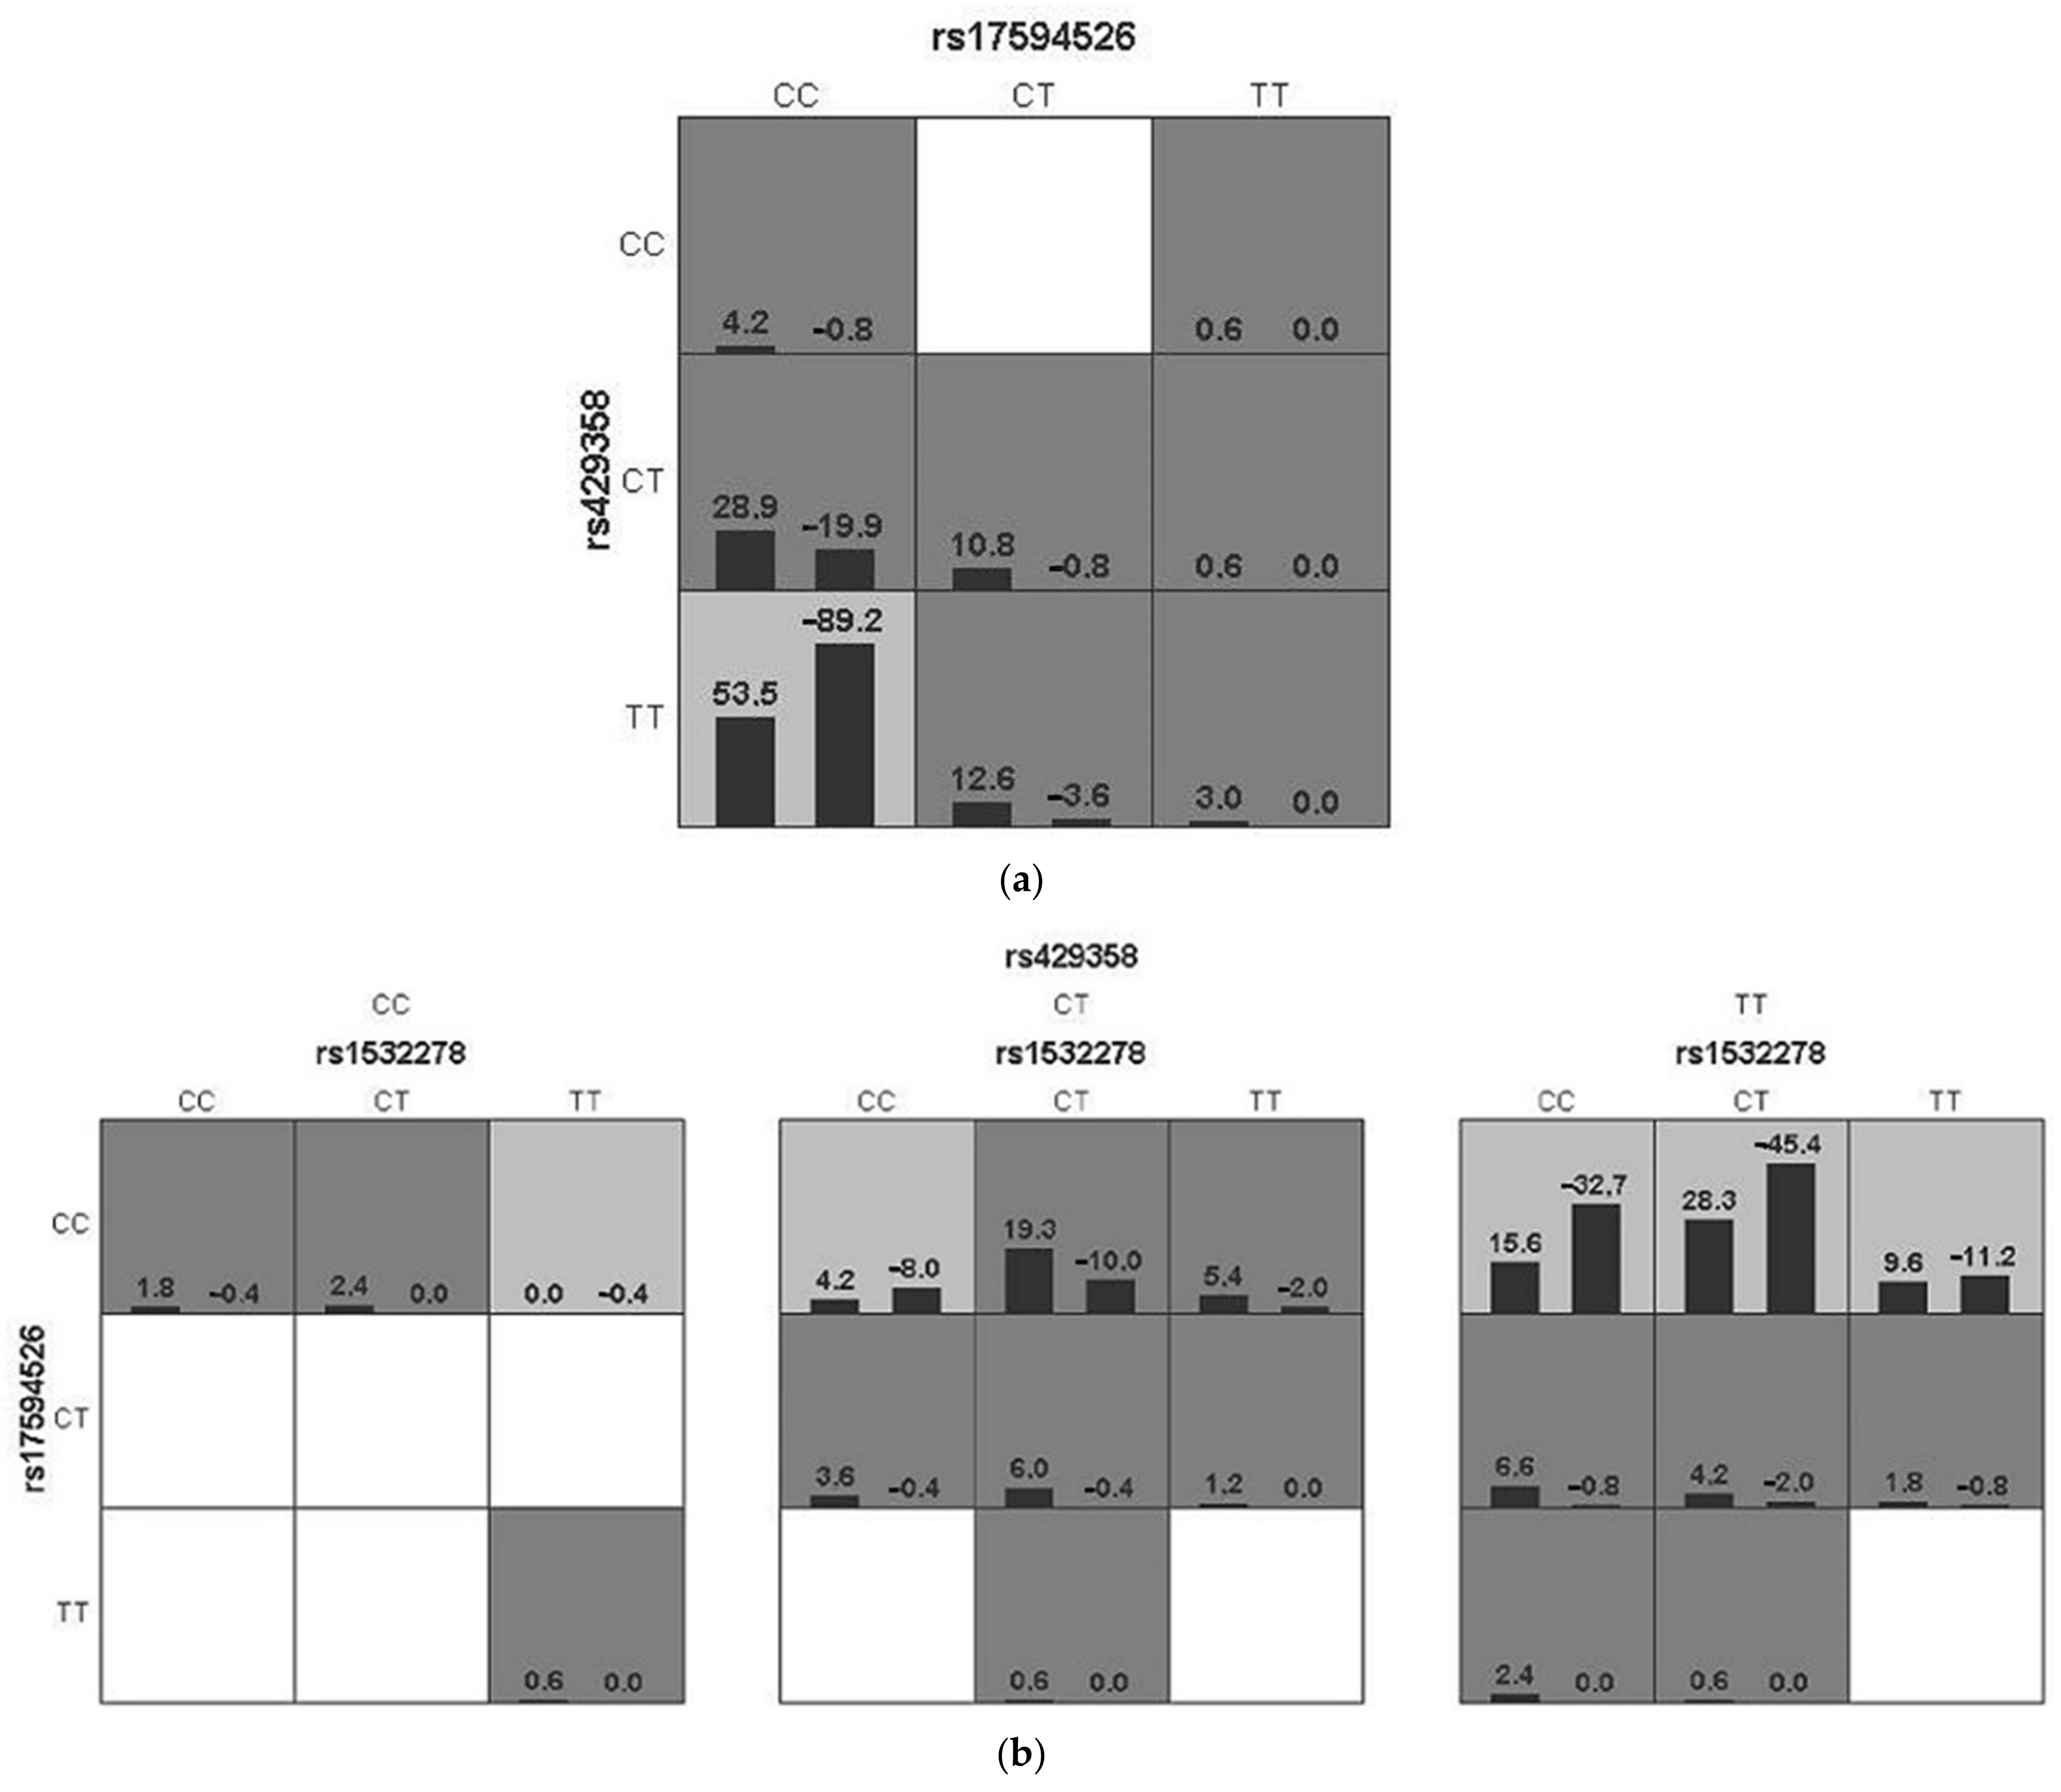
| Best Interaction Model | TBA # | CVC | p Value | OR # (95% CI) # |
|---|---|---|---|---|
| APOE | 0.59 | 6/10 | 0.0006 | 2.81 (1.54–5.13) |
| TCF4, APOE | 0.66 | 10/10 | <0.0001 | 4.04 (2.27–7.17) |
| CLU, TCF4, APOE | 0.66 | 10/10 | <0.0001 | 5.71 (3.03–10.78) |
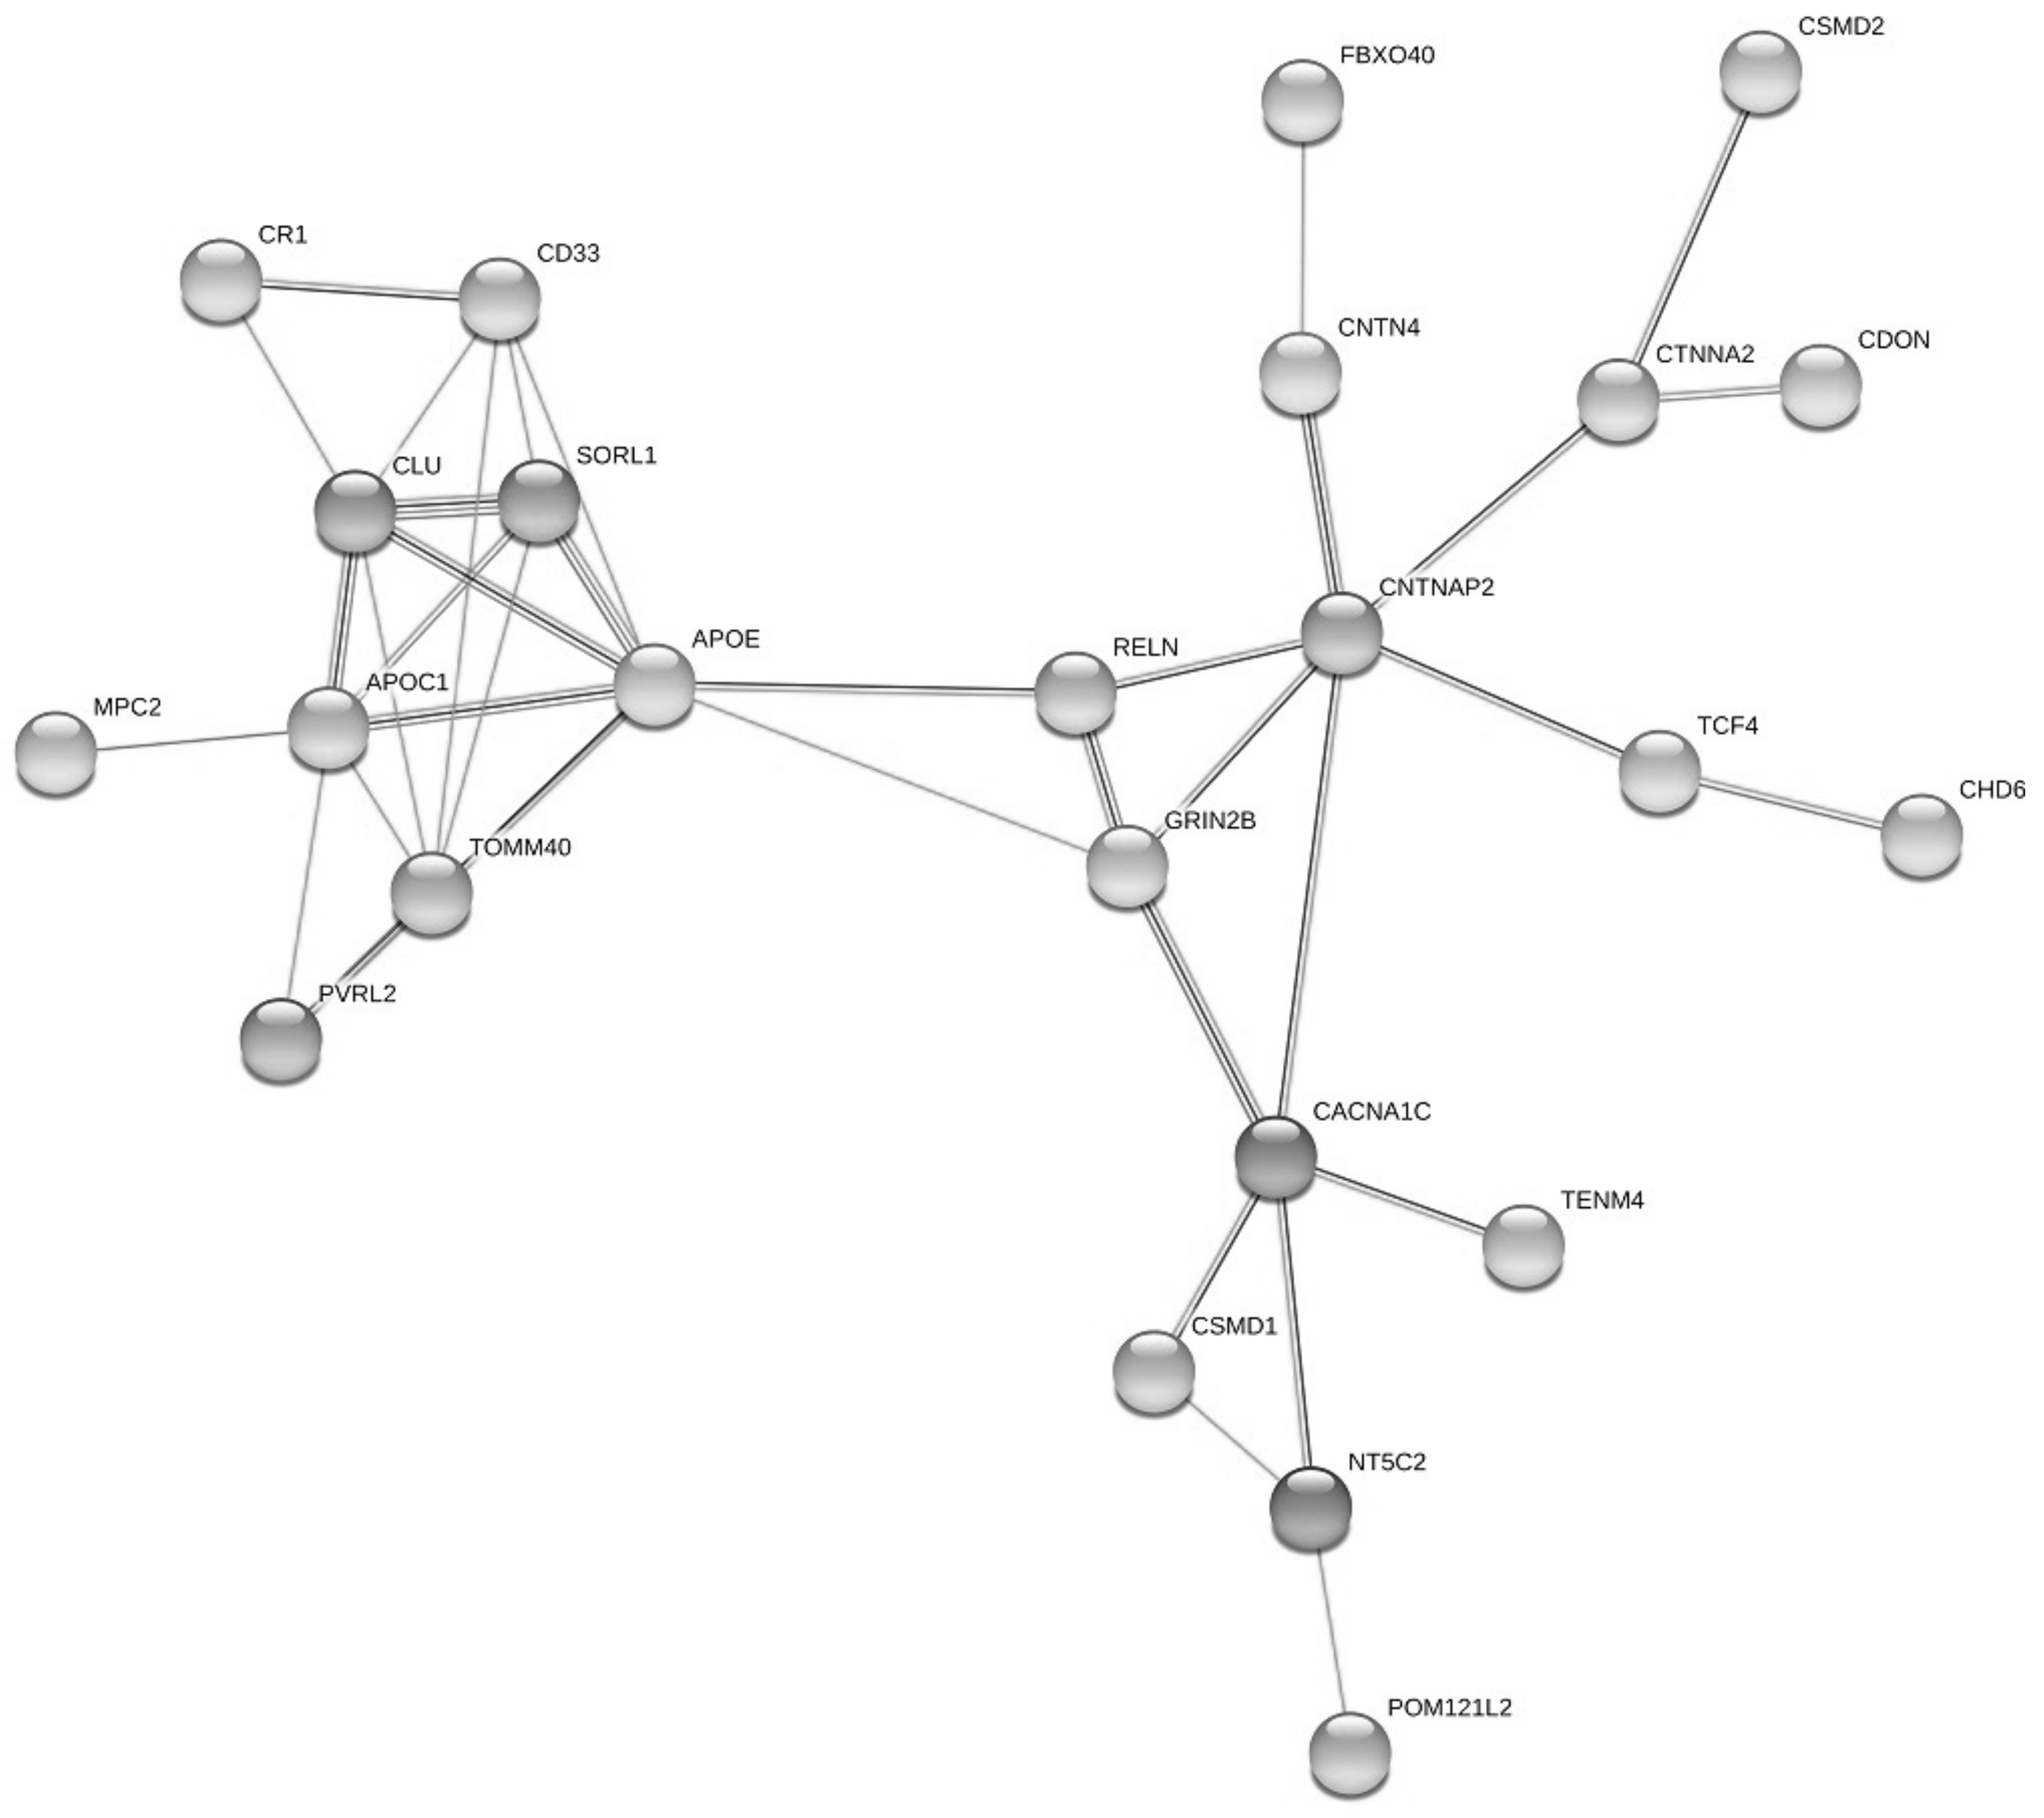
| Pathway ID | Pathway Description | Observed Gene Count | False Discovery Rate | Matching Proteins in Your Network (Labels) |
|---|---|---|---|---|
| GO:0022008 | neurogenesis | 15 | 0.00028 | APOE,CDON,CLU,CNTN4,CNTNAP2,CTNNA2,KLHL1,LSM1,NRXN3,RELN,SORL1,STK24,TCF4,TENM4,ZNF365 |
| GO:0007155 | cell adhesion | 11 | 0.00036 | CADM2,CD33,CDON,CNTN4,CNTNAP2,CTNNA2,DCHS2,NRXN3,PVRL2,RELN,TENM4 |
| GO:0007399 | nervous system development | 17 | 0.00036 | APOE,CDON,CLU,CNTN4,CNTNAP2,CTNNA2,DNAH11,GRIN2B,KLHL1,LSM1,NRXN3,RELN,SORL1,STK24,TCF4,TENM4,ZNF365 |
| GO:0048699 | generation of neurons | 14 | 0.00036 | APOE,CDON,CNTN4,CNTNAP2,CTNNA2,KLHL1,LSM1,NRXN3,RELN,SORL1,STK24,TCF4,TENM4,ZNF365 |
| GO:0032989 | cellular component morphogenesis | 10 | 0.00044 | CLU,CNTN4,CNTNAP2,CTNNA2,NRXN3,PVRL2,RELN,STK24,TENM4,ZNF365 |
| GO:0050767 | regulation of neurogenesis | 10 | 0.00044 | APOE,CDON,CNTN4,LSM1,RELN,SORL1,STK24,TCF4,TENM4,ZNF365 |
| GO:0048666 | neuron development | 10 | 0.00045 | APOE,CNTN4,CNTNAP2,CTNNA2,KLHL1,NRXN3,RELN,STK24,TENM4,ZNF365 |
| GO:0031175 | neuron projection development | 9 | 0.00058 | APOE,CNTN4,CNTNAP2,CTNNA2,KLHL1,NRXN3,RELN,STK24,ZNF365 |
| GO:0000902 | cell morphogenesis | 9 | 0.00061 | CLU,CNTN4,CNTNAP2,CTNNA2,NRXN3,RELN,STK24,TENM4,ZNF365 |
| GO:0032990 | cell part morphogenesis | 8 | 0.00064 | CNTN4,CNTNAP2,CTNNA2,NRXN3,PVRL2,RELN,STK24,ZNF365 |
| GO:0007417 | central nervous system development | 10 | 0.00084 | CDON,CLU,CNTN4,CNTNAP2,CTNNA2,GRIN2B,KLHL1,RELN,TENM4,ZNF365 |
| GO:0007611 | learning or memory | 6 | 0.00089 | APOE,CNTNAP2,DNAH11,GRIN2B,NRXN3,RELN |
Publisher’s Note: MDPI stays neutral with regard to jurisdictional claims in published maps and institutional affiliations. |
© 2021 by the authors. Licensee MDPI, Basel, Switzerland. This article is an open access article distributed under the terms and conditions of the Creative Commons Attribution (CC BY) license (https://creativecommons.org/licenses/by/4.0/).
Share and Cite
Bocharova, A.; Vagaitseva, K.; Marusin, A.; Zhukova, N.; Zhukova, I.; Minaycheva, L.; Makeeva, O.; Stepanov, V. Association and Gene–Gene Interactions Study of Late-Onset Alzheimer’s Disease in the Russian Population. Genes 2021, 12, 1647. https://doi.org/10.3390/genes12101647
Bocharova A, Vagaitseva K, Marusin A, Zhukova N, Zhukova I, Minaycheva L, Makeeva O, Stepanov V. Association and Gene–Gene Interactions Study of Late-Onset Alzheimer’s Disease in the Russian Population. Genes. 2021; 12(10):1647. https://doi.org/10.3390/genes12101647
Chicago/Turabian StyleBocharova, Anna, Kseniya Vagaitseva, Andrey Marusin, Natalia Zhukova, Irina Zhukova, Larisa Minaycheva, Oksana Makeeva, and Vadim Stepanov. 2021. "Association and Gene–Gene Interactions Study of Late-Onset Alzheimer’s Disease in the Russian Population" Genes 12, no. 10: 1647. https://doi.org/10.3390/genes12101647