Article

Detection of Spinal Muscular Atrophy Patients Using Dried Saliva Spots

1
Department of Community Medicine and Social Healthcare Science, Kobe University Graduate School of Medicine, 7-5-1 Kusunoki-cho, Chuo-ku, Kobe 650-0017, Hyogo, Japan
2
Faculty of Rehabilitation, Kobe Gakuin University, 518 Arise, Ikawadani-cho, Nishi-ku, Kobe 651-2180, Hyogo, Japan
3
Department of Pediatrics, Ehime Prefectural Imabari Hospital, 4-5-5 Ishiicho, Imabari 794-0006, Ehime, Japan
4
Department of Pediatrics, Osaka City University Graduate School of Medicine, 1-4-3 Asahi-Machi, Abeno-ku, Osaka 545-8585, Osaka, Japan
5
Department of Pediatrics, Hyogo College of Medicine, 1-1 Mukogawacho, Nishinomiya 663-8501, Hyogo, Japan
6
Department of Neurology, National Hospital Organization Osaka Toneyama Medical Center, 5-1-1 Toneyama, Toyonaka 560-8552, Osaka, Japan
7
Department of Pediatrics, Kobe University Graduate School of Medicine, 7-5-1 Kusunoki-cho, Chuo-ku, Kobe 650-0017, Hyogo, Japan
*
Author to whom correspondence should be addressed.
Genes 2021, 12(10), 1621; https://doi.org/10.3390/genes12101621
Submission received: 27 September 2021 / Revised: 11 October 2021 / Accepted: 13 October 2021 / Published: 14 October 2021
(This article belongs to the Special Issue Genetics of Motor Neuron Diseases)

Abstract

:
Spinal muscular atrophy (SMA) is a lower motor neuron disease, once considered incurable. The main symptoms are muscle weakness and muscular atrophy. More than 90% of cases of SMA are caused by homozygous deletion of survival motor neuron 1 (SMN1). Emerging treatments, such as splicing modulation of SMN2 and SMN gene replacement therapy, have improved the prognoses and motor functions of patients. However, confirmed diagnosis by SMN1 testing is often delayed, suggesting the presence of diagnosis-delayed or undiagnosed cases. To enable patients to access the right treatments, a screening system for SMA is essential. Even so, the current newborn screening system using dried blood spots is still invasive and cumbersome. Here, we developed a completely non-invasive screening system using dried saliva spots (DSS) as an alternative DNA source to detect SMN1 deletion. In this study, 60 DSS (40 SMA patients and 20 controls) were tested. The combination of modified competitive oligonucleotide priming-polymerase chain reaction and melting peak analysis clearly distinguished DSS samples with and without SMN1. In conclusion, these results suggest that our system with DSS is applicable to SMA patient detection in the real world.

1. Introduction

Spinal muscular atrophy (SMA) is one of the most devastating neuromuscular disorders, characterized by motor neuron degeneration [1]. The patients present with muscle weakness and muscular atrophy [1]. Clinically, SMA is divided into five subtypes: Type 0 (the most severe form, prenatal onset, death within weeks of birth); Type I (Werdnig–Hoffmann disease, severe form, onset < 6 months, non-sitter); Type II (Dubowitz disease, intermediate form, onset < 18 months, sitter); Type III (Kugelberg–Welander disease, mild form, onset > 18 months, walker); and Type IV (the mildest form, onset > 30 years) [2,3].
The majority of SMA cases (~95%) involve homozygous deletion of survival motor neuron 1 (SMN1), while some others (~5%) carry a deleterious SMN1 mutation, thus SMN1 is considered the disease-causing gene [1,2]. The homologous gene, SMN2, serves as an SMA-modifying gene because a high SMN2 copy number is generally associated with a milder phenotype [4,5].
SMN1 and SMN2 are identical except for five nucleotides located in intron 6, exon 7, intron 7, and exon 8 [1]. Molecular diagnosis of SMA requires the detection of SMN1-specific nucleotides, especially the one located in exon 7. Several methods have been developed to achieve this, including single-stranded conformation polymorphism (SSCP) analysis [1], restriction enzyme digestion analysis [6], modified competitive oligonucleotide priming-polymerase chain reaction (mCOP-PCR) [7,8], multiplex ligation-dependent probe amplification (MLPA) [9], digital droplet PCR (ddPCR) [10] and next-generation sequencing (NGS) [11].
SMA has long been thought an incurable disease because of the absence of effective drugs. However, three new and effective drugs for SMA are now available: nusinersen [12], onasemnogene abeparvovec-xioi [13], and risdiplam [14]. These drugs give better outcomes when treatment is initiated at an early stage, before the onset of symptoms [12,13,14]. Therefore, there is a growing implementation of newborn screening programs for SMA (NBS-SMA) worldwide [7,15,16,17,18,19,20,21]. Technically, the current NBS-SMA program can detect all SMA patients with a homozygous deletion regardless of the clinical subtype.
Even though NBS-SMA has begun in many countries, there remain many older children or adults with SMA in the population who were not detected in early infancy. The majority of them may be diagnosed with SMA in a timely fashion, but the rest may be diagnosed late or may not be diagnosed, particularly those with a later onset of the disease [22,23,24,25]. Undiagnosed patients cannot access treatment with the new drugs. Therefore, to complement NBS-SMA, it is desirable to establish a screening system that covers older children and adults. The samples for that purpose should be collected at schools, workplaces, or homes. However, one potential hurdle is the invasiveness of blood-based templates such as dried blood spots (DBS), which may require health care visitation of the individuals or blood collection by health care workers.
Here, we aim to develop a non-invasive SMA screening method from dried saliva spots (DSS) to detect SMN1 using a combination of nested mCOP-PCR and melting curve analysis. The simplicity and non-invasiveness of the DSS collection might be suitable for adults and children school-aged or older. To our knowledge, there has been no reported study employing DSS as genetic material to screen for SMA.

2. Materials and Methods

2.1. Patient and Control Samples

A total of 61 DSS samples (40 SMA patients and 21 controls) were enrolled in this study. The patients had been diagnosed as having SMN1-deleted SMA based on an SMN1 deletion test using the PCR restriction fragment length polymorphism (PCR-RFLP) method [6].
Prior to this study, informed consent was obtained from all participants. The study was approved by the Ethics Committee of Kobe University Graduate School of Medicine (reference number 1210, approved on 12 October 2011) and was conducted in accordance with the World Medical Association Declaration of Helsinki.

2.2. Detection of SMN1 and CFTR

2.2.1. Outline of the Detection System

Our system consisted of two steps, multiplex nested PCR amplification and melting curve analysis. (1) Multiplex nested PCR. The first-round PCR amplified SMN1 exon 7 and SMN2 exon 7 using a common primer set, and simultaneously amplified CFTR as a reference gene. The second-round PCR amplified SMN1 exon 7 with a specific mCOP primer set and simultaneously amplified CFTR as a reference gene. (2) Melting curve analysis. The dissociation characteristics of the nested PCR products during heating were analyzed. In this analysis, the SMN1 peak was clearly separated from the CFTR peak.

2.2.2. Preparation of DSS Samples

The chemically modified filter paper was used in this study, Indicating Flinders Technology Associates (FTA) card (GE Healthcare, Boston, MA, USA), which is designed to inactivate highly pathogenic organisms. The DSS sample was prepared by direct spitting into the center of the FTA card and was then air-dried for at least one hour. The DSS cards were sent to our laboratory for immediate analysis or stored in a dark room at room temperature until use.

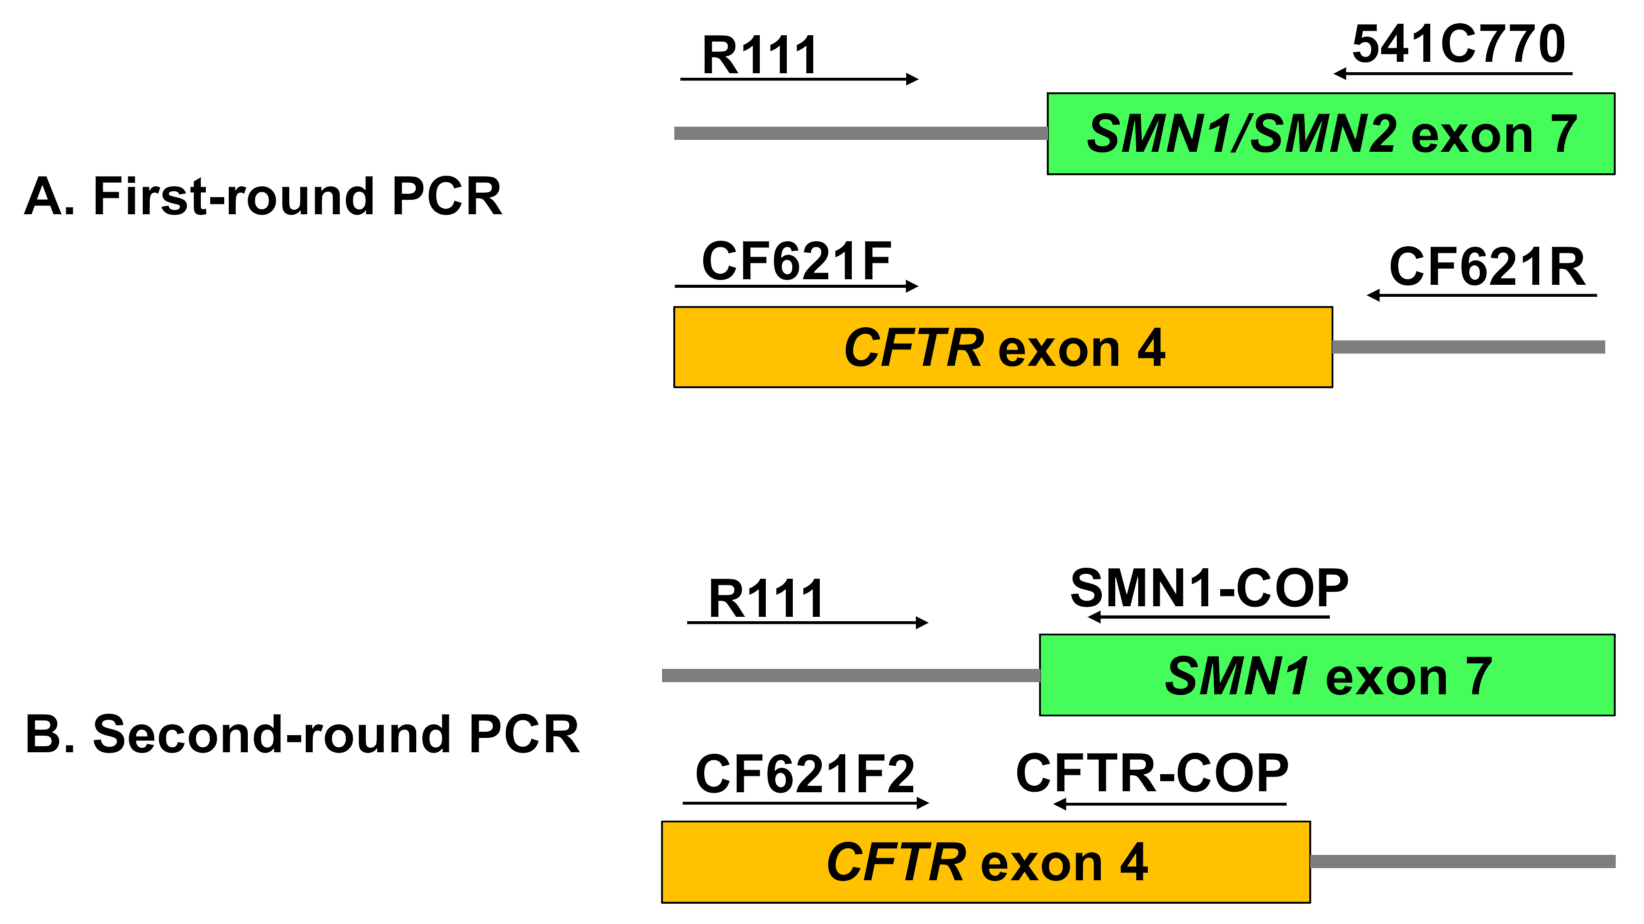
2.2.3. Multiplex Nested PCR

First-Round PCR: Multiplex Amplification of SMN and CFTR Outer Fragments

A conventional multiplex PCR was used to amplify outer fragments of SMN1/SMN2 and CFTR using the GeneAmp® PCR System 9700 (Applied Biosytems, Foster City, CA, USA).
The DSS was punched out in the center of the spot area using a 2 mm diameter paper punch. The punched paper was then placed into a 50 μL PCR mixture for direct amplification containing 1 U of DNA polymerase KOD FX Neo (TOYOBO, Osaka, Japan). A blank paper was also punched out and used as a negative control. The primers used to amplify the outer fragment of SMN1 and SMN2 were R111 (5′-AGA CTA TCA ACT TAA TTT CTG ATC A-3′) and 541C770 (5′-TAA GGA ATG TGA GCA CCT TCC TTC-3′) (Figure 1A) [1]. The primers used to amplify the outer fragment of CFTR were CF621F (5′-AGT CAC CAA AGC AGT ACA GC-3′) and CF621R (5′-GGG CCT GTG CAA GGA AGT GTTA-3′) (Figure 1A) [26].
The PCR conditions were: (1) initial denaturation at 94 °C for 7 min; (2) 35 cycles of denaturation at 94 °C for 30 s, annealing at 60 °C for 30 s, and extension at 72 °C for 30 s; (3) additional extension at 72 °C for 7 min; and (4) hold at 10 °C.
To confirm the amplification of the target sequences, the first-round PCR products were run on a 4% agarose gel in 1 × TBE buffer and visualized by Midori-Green staining (Nippon Genetics, Tokyo, Japan). The first-round PCR products were then diluted 100-fold and used as the template for the second-round PCR.

Second-Round PCR: Allele-Specific Amplification of SMN1 and CFTR Inner Fragments

A real-time mCOP-PCR was performed to specifically amplify the inner fragment of SMN1 using a LightCycler® 96 system (Roche Applied Science, Mannheim, Germany). Here, the inner fragment of CFTR was also amplified, together with SMN1, as a reference gene.
Two microliters of a 100-fold dilution of the first-round PCR product were added into a reaction mixture with a final volume of 30 µL containing 1 U of DNA polymerase KOD FX Neo and 1.5 µL EvaGreen® Dye (Biotium, Hayward, CA, USA). The primers for allele-specific amplification of the SMN1 inner fragment were RIII and SMN1-COP (5′-TGT CTG AAA CC-3′) (Figure 1B) [1,27]. The primers for amplification of the CFTR inner fragment were CF621F2 (5′-ATC ATA GCT TCC TAT GAC CCG GA-3′) and CFTR-COP (5′-GGC TGG GTG TA-3′) (Figure 1B).
The PCR conditions were as follows: (1) initial denaturation at 94 °C for 7min; (2) 20 cycles of denaturation at 94 °C for 30 s, annealing at 37 °C for 30 s, and extension at 72 °C for 30 s; and (3) melting curve analysis consisting of an initial holding step at 65 °C for 1 min, a heating step with a temperature increase from 65 to 97 °C at a rate of 0.2 °C/s, and a final holding step at room temperature.
To confirm the amplification of the target sequences, the second-round PCR products were run on a 4% agarose gel in 1 × TBE buffer and visualized by Midori-Green staining.

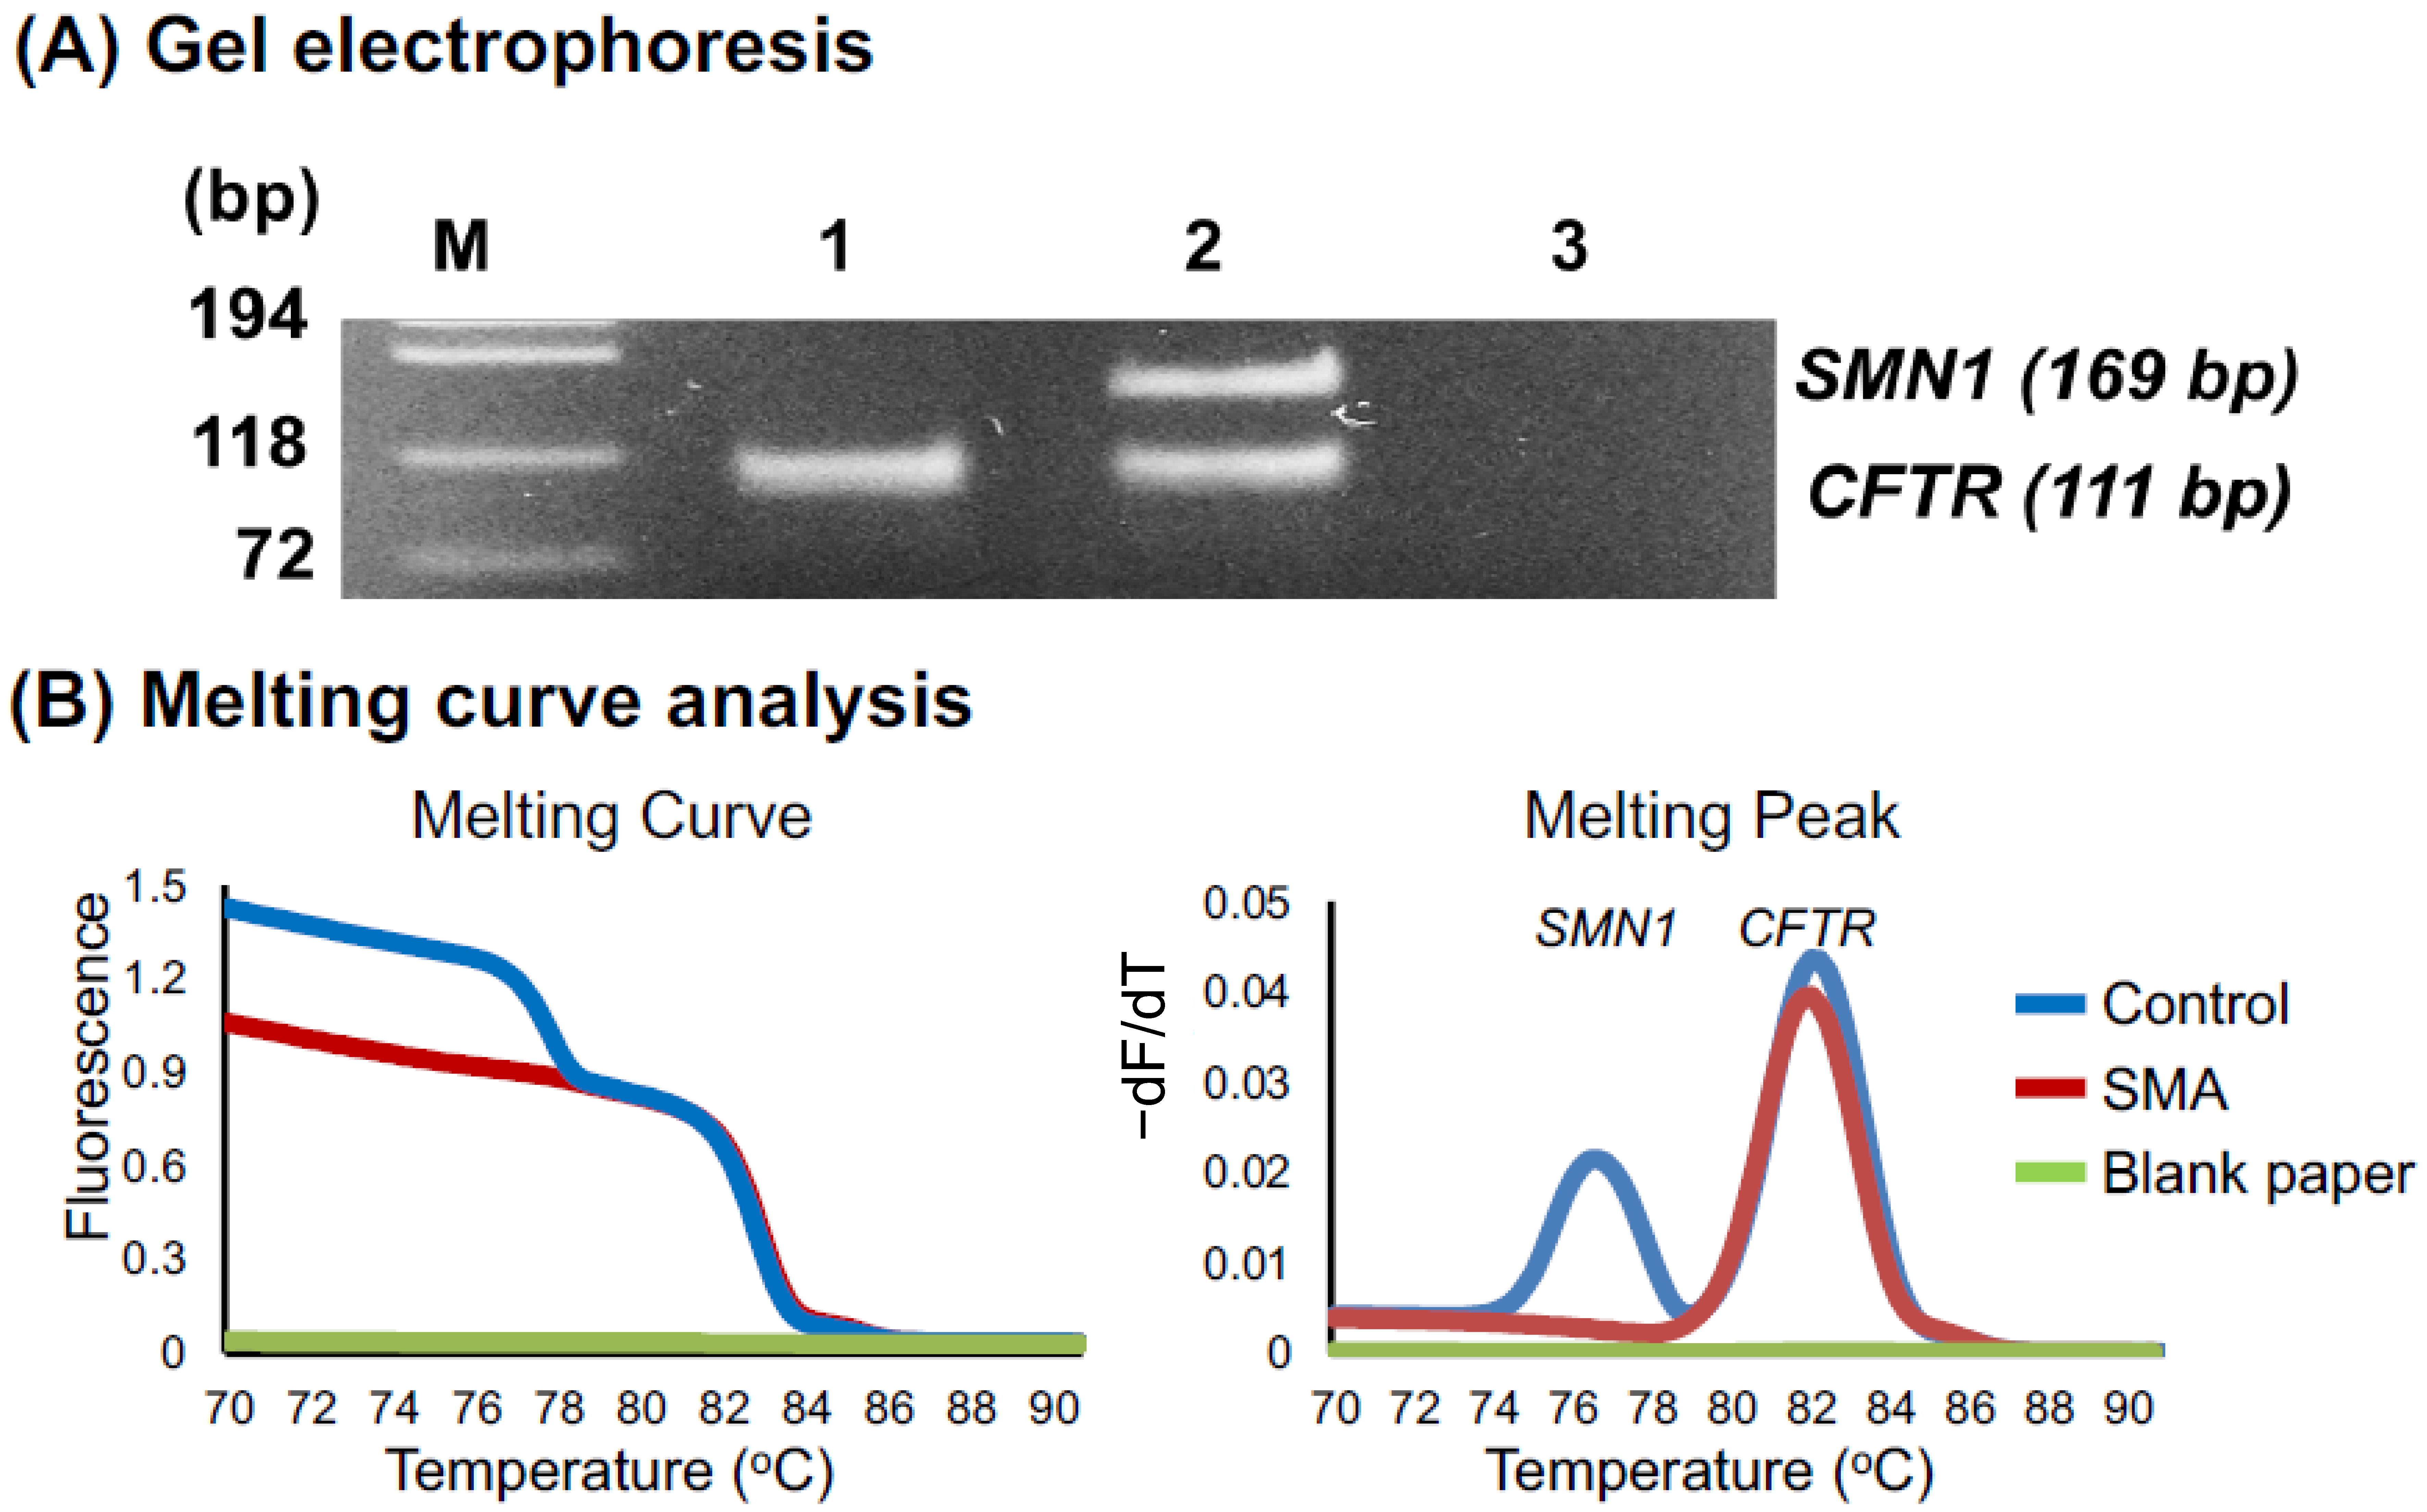
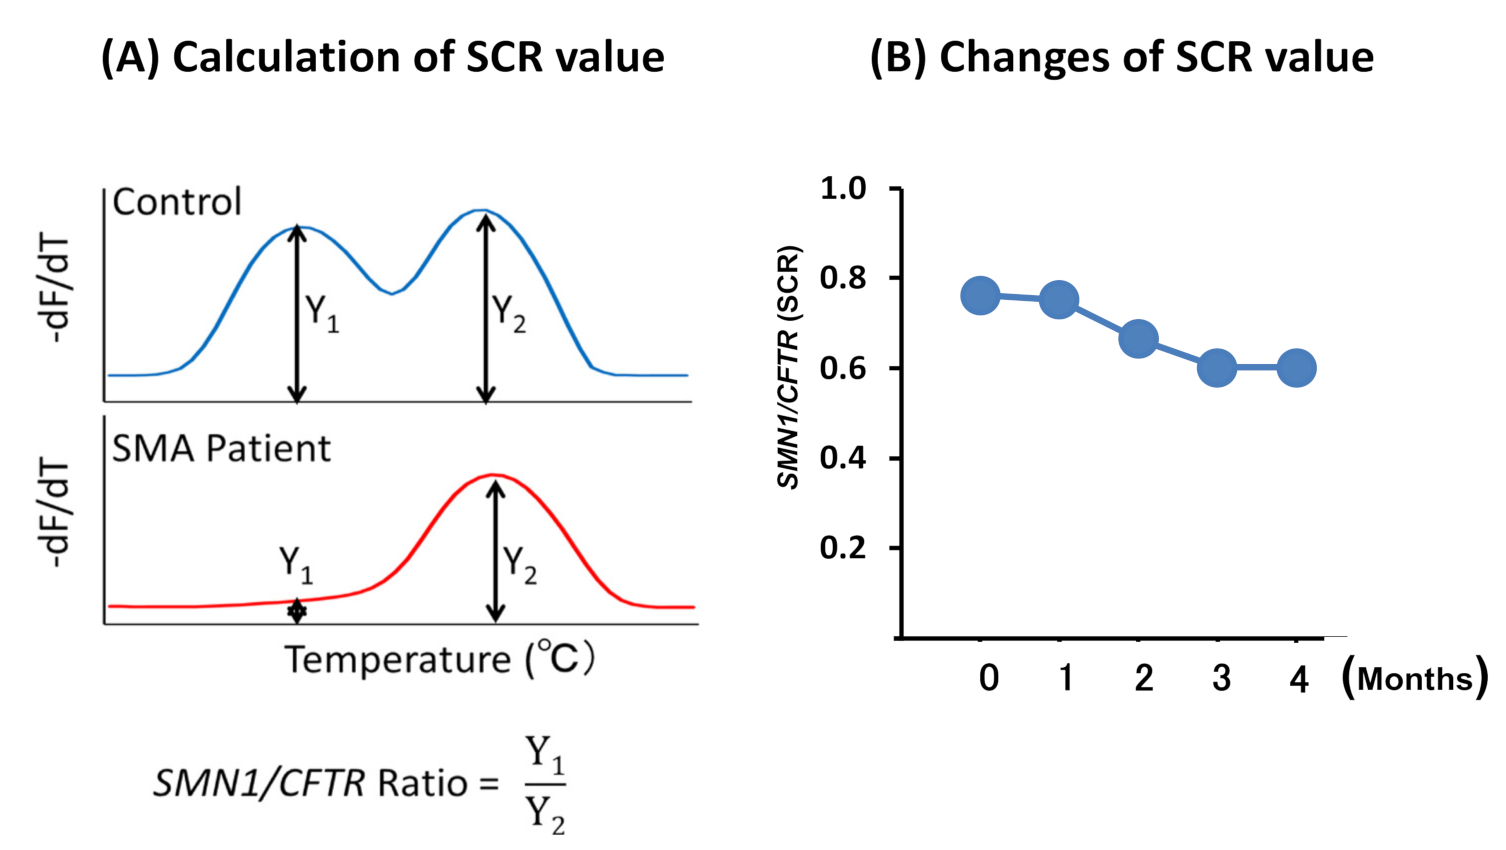
2.2.4. Melting Curve Analysis

Melting curve analysis was performed with LightCycler® 96 Software (version 1.1.0.1320). The temperature conditions are described above. Fluorescence data were converted into melting peaks by the software and plotted as the negative derivative of fluorescence with respect to temperature (−dF[fluorescence]/dT[temperature] vs temperature) [28]. To quantify the melting peak profiles, we calculated the SMN1/CFTR ratio (SCR). The SCR values are defined as the SMN1 melting peak height divided by the CFTR melting peak height (see the Results section).

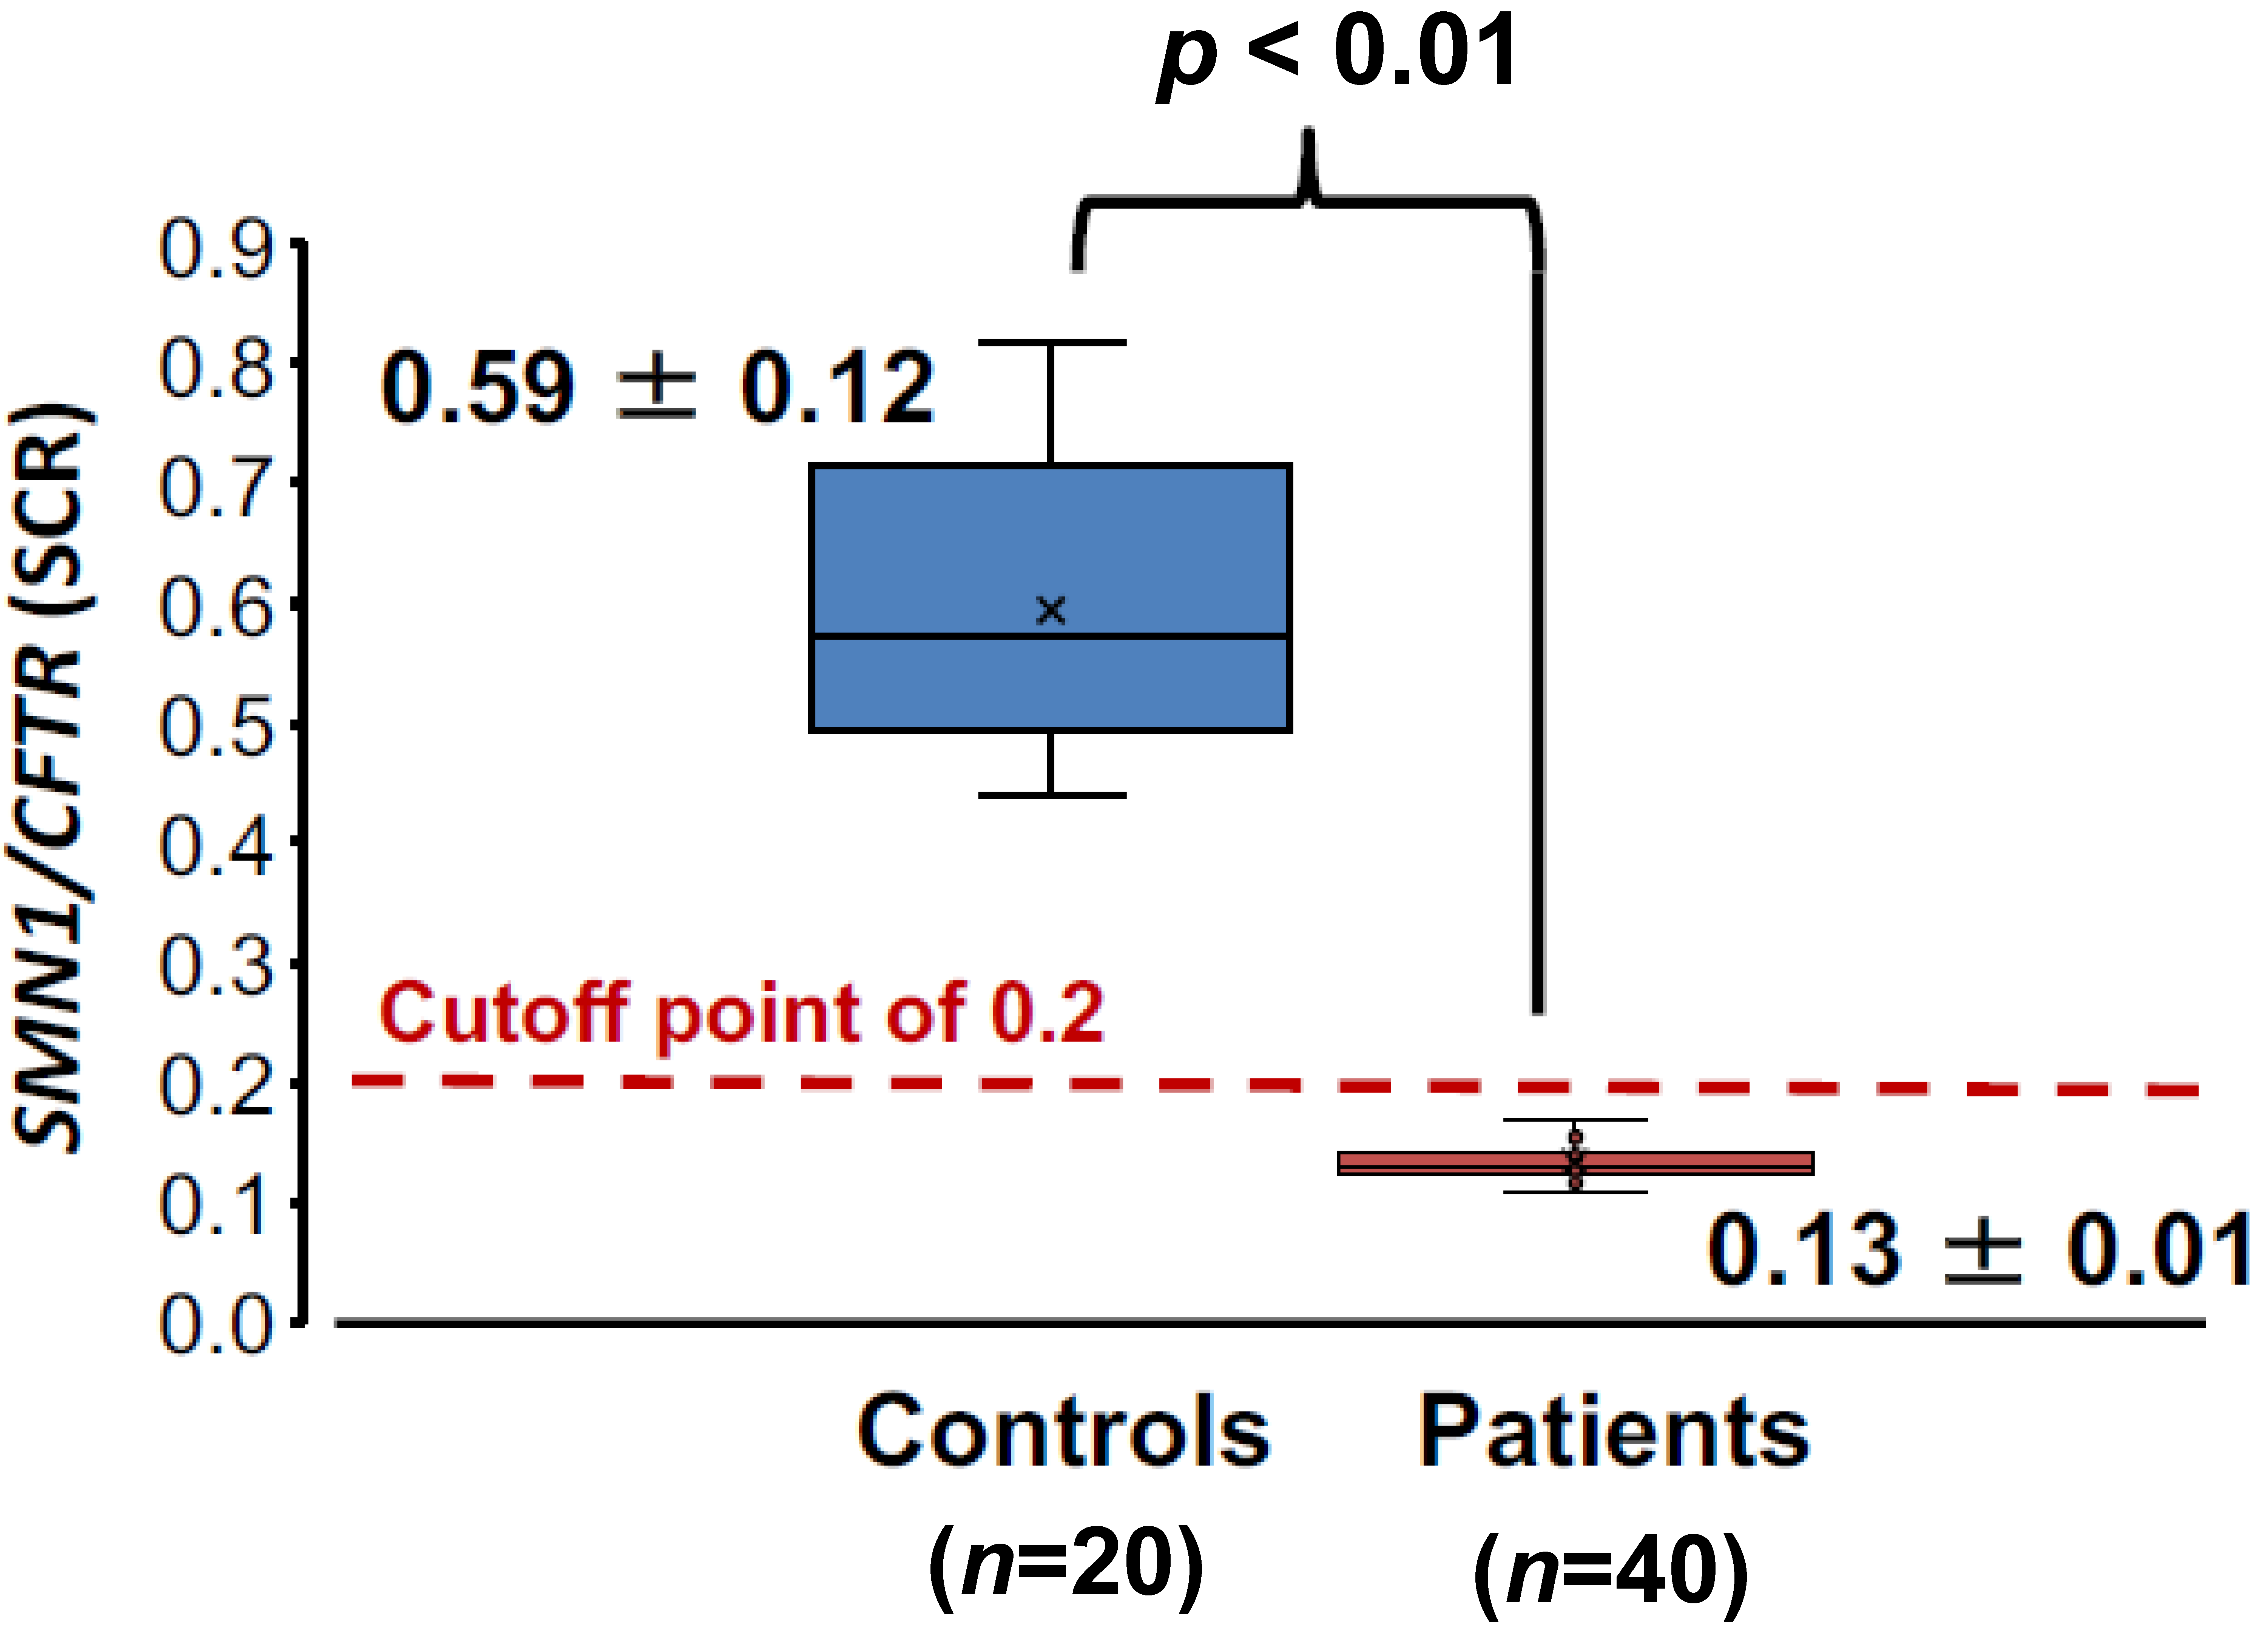
2.3. Statistical Analysis

To compare differences in the SCR between the two groups, the Student’s t-test was performed using Microsoft Excel with the add-in software Statcel 3 (The Publisher OMS Ltd., Tokyo, Japan). A p-value of less than 0.05 was considered statistically significant.

3. Results

3.1. Preliminary Assays

We analyzed three fresh samples using conventional PCR and gel electrophoresis: a control DSS sample, a patient DSS sample, and a blank filter paper sample as a negative control. Nested PCR products of these samples were electrophoresed on an agarose gel (Figure 2A). The control DSS sample showed two bands for the SMN1 (169 bp) and CFTR (111 bp) products, whereas the patient DSS sample showed only one band for CFTR, indicating the absence of SMN1 amplification. CFTR has been often used as the reference gene [26,28,29].
Next, instead of using conventional PCR analysis and agarose gel electrophoresis, we analyzed the samples using real-time PCR and melting curve analysis. To detect the amplification products of CFTR and SMN1, melting curve analysis was performed immediately after real-time PCR (Figure 2B). The control DSS sample showed two melting peaks for the SMN1 (77 °C) and CFTR (82 °C) products, whereas the patient DSS sample showed only one peak for CFTR, indicating the absence of SMN1 amplification.
Then, we also checked the possibility of DNA degradation in the DSS sample during the storage period. We analyzed the same control DSS sample 1, 2, 3, and 4 months after saliva collection. Two melting peaks for the SMN1 and CFTR products were observed in all the experiments performed at 1, 2, 3, and 4 months.
Here, we defined the SCR value using the peak height of those two genes. The value tended to decrease as the months increased, suggesting that SMN1 degraded more easily than CFTR (Figure 3). However, we also noticed that the SCR value did not obviously decrease within one month after saliva collection. Thus, we analyzed all DSS samples within two weeks in the main experiments.

3.2. Main Assays

3.2.1. Melting Curve Analysis of 60 DSS Samples

We collected DSS from 21 healthy controls and 40 SMA patients. These SMA patients enrolled in this study had been confirmed to carry no SMN1 exon 7 using the PCR-RFLP method [6].
All the samples were successfully analyzed except for one DSS sample of a healthy control (1 out of 21 DSS). This sample showed no amplification in the first-round PCR (data not shown). This negative result might be due to the absence of DNA or the presence of PCR inhibitors. We then excluded this sample from further analysis. In total, we analyzed 20 DSS of healthy controls and 40 DSS of SMA patients.
All 20 DSS samples from healthy controls produced two melting peaks for SMN1 and CFTR, whereas all 40 DSS samples from SMA patients had only one melting peak for CFTR. The melting peak profiles of the patients using DSS were consistent with their RFLP-PCR results using freshly collected blood.

3.2.2. SCR Values between Controls and SMA Patients

In the early stage of the development of our system, the results of melting curve analyses were only examined by visual inspection by two individuals. However, to properly deal with poor-quality or poor-quantity DNA samples, we needed to quantify the melting peak pattern and determine the cutoff point of our assay. For that purpose, we used SCR values of healthy controls and SMA patients.
The SCR value of healthy controls was 0.59 ± 0.12 (mean ± SD), whereas the SCR value of SMA patients was 0.13 ± 0.01. The SCR value differences between the two groups were statistically significant (p < 0.01) (Figure 4).
The SCR value ranges of controls and SMA patients were far apart and did not overlap in this study. An SCR value of 0.2, however, was tentatively set as the cutoff point showing the absence of SMN1. This tentative cutoff point was less than −3 SD of healthy control values, 0.23.

4. Discussion

4.1. Expansion of SMA Screening to Older Children or Adults

There may be quite a few undiagnosed cases of SMA in all age groups. The NBS-SMA is a nationwide public health program intended to identify newborn infants with SMA. However, the number of newborns screened for SMA is too small to detect all affected infants with SMA [20]. A nationwide spread of the NBS-SMA program may not happen soon. In addition, infants after the neonatal period will not be tested in the NBS-SMA. Diagnosis of SMA may become more difficult after the neonatal period. Milder symptoms can make a diagnosis of SMA more difficult because of similarities with other muscle weakness diseases [24,30].
To increase the diagnosis rate, we must consider adding SMA screening into the health check items for infants, toddlers, school-age children, and adults. Our system may be the best option for SMA screening as part of the health checks. As a non-invasive and cost-effective alternative, DSS sampling is suitable for health checks held in schools or workplaces. Once dried, DSS samples can be stored at room temperature in the dark, without any special equipment, and they can be sent to a center or a laboratory by airmail, enabling telediagnosis and eliminating hospital visitation.

4.2. Saliva as a Good Source for Genetic Analysis

Saliva has been used for analysis of human DNA by PCR-based HLA typing [31], microarray SNP genotyping [32,33], TaqMan SNP genotyping assays [32,34], loop-mediated isothermal amplification-melting curve (LAMP-MC) analysis [34], PCR-Sanger sequencing [33], next generation sequencing [35], and whole genome or exome sequencing [36,37].
Saliva has now proved to be a good alternative source for genetic analysis. In the studies mentioned above, saliva was collected using a saliva collection kit with a special container, either in-house-made [31] or commercially available [32,33,34,35,36,37]. Later, DNA was extracted from the liquid saliva sample in the container [31,32,33,34,35,36,37].
Some previous studies used a different kind of saliva sample. Instead of a liquid saliva sample, some researchers prepared DSS samples and extracted DNA from them for various purposes [38,39,40]. Kisoi et al. identified insertion/deletion polymorphisms of the angiotensin-converting enzyme (ACE) gene by PCR amplification using DNA from DSS samples [38]. Our study also demonstrated genotyping analysis of SMN genes using DSS samples. These findings support the idea that saliva, even if dried, can be a good DNA source for PCR.
Kisoi et al. reported a simple DNA extraction method from the DSS samples: they boiled one DSS punch (4 mm in diameter) and used an aliquot of the supernatant for PCR amplification [38]. Hayashida et al. reported direct PCR from DSS to detect SNP in alcohol metabolism-related genes (ADH1B and ALDH2) using a TaqMan probe assay [41]. In agreement with their results, we provide further evidence that direct PCR amplification is feasible from DSS without boiling or DNA purification procedures.

4.3. Robustness and Accuracy of Our SMA Screening System

In this study, the basic technology to detect SMN1, mCOP-PCR, is a type of allele-specific PCR. Originally, COP-PCR was based on allele-specific amplification, in which two oligonucleotide primers compete for one target DNA sequence in one PCR tube [42]. The primers are short (10–11 bases) and highly identical except for one nucleotide change in the middle of the primers [8,42]. The modified version adopted in this study, mCOP-PCR, uses one gene-specific oligonucleotide primer (SMN1-COP) that preferentially binds the SMN1 sequence rather than the competitor sequence, SMN2 [8].
Here, we employed nested PCR to rescue low quantity and quality genetic material in the DSS. The first-round PCR amplified common regions of the target genes and provided enough template for the second-round PCR, even for quantitative assays [7,8,43]. In addition, the first-round PCR products contained no other sequences similar to the SMN1-specific mCOP-PCR primer, which avoids the amplification of unexpected primer binding sites in the second-round PCR and enhances the specificity of our system [7,8].

4.4. Limitation of PCR-Based Assays Using DSS

The use of saliva, either liquid or dried, has potential limitations for PCR-based assays. First, the quantity of amplifiable human DNA recovered from liquid saliva is lower than blood (37.3% in saliva versus 87.6% in the blood) [32]. Second, the DNA quality obtained from saliva does not always meet the quality standard for certain assays, even though the DNA obtained from saliva showed a good A260/A280 ratio [36]. DNA degradation during the storage period may be related to the quality. Third, PCR inhibitors in the saliva may confound the results [32,44].
We experienced one case of assay failure out of 61 DSS samples (1.6%) in this study. This failure might be due to the absence of DNA or the presence of PCR inhibitors. The possibility of DNA degradation can be ruled out because the storage period was less than two weeks. In our pilot study of NBS-SMA, there were no cases of assay failure out of 4157 DBS samples (0%) [7]. Compared with our previous study of DBS, this study with DSS showed a higher rate of assay failure.

5. Conclusions

We demonstrated the potential use of DSS sampling as a good alternative source for SMA detection using nested mCOP-PCR. The sample collection procedure is non-invasive, easy to handle, and requires no hospital visitation. DSS might be preferable for SMA screening for older children or adults. We hope that this will help in overcoming the delay in SMA diagnosis.

Author Contributions

Conceptualization, H.N., H.S. and Y.O.S.W.; Methodology, H.N. and Y.O.S.W.; Formal Analysis, H.N., E.T.E.N. and Y.O.S.W.; Resources, K.O., H.A., Y.T., T.S., H.S. and M.S.; Data curation, H.N., E.T.E.N. and Y.O.S.W.; Writing—Original Draft Preparation, Y.O.S.W. and H.N.; Writing—Review & Editing, Y.O.S.W., E.T.E.N., H.N., H.S. and M.S.; Supervision, H.N. All authors have read and agreed to the published version of the manuscript.

Funding

This research was funded by the Ministry of Education, Culture, Sports, Science and Technology, Japan, Grant No. 20K08197.

Institutional Review Board Statement

This study was conducted according to the guidelines of the Declaration of Helsinki, and approved by the Ethics Committee of Kobe University Graduate School of Medicine (protocol code: 1210).

Informed Consent Statement

Informed consent was obtained from all subjects involved in the study.

Acknowledgments

We are indebted to all SMA-affected patients and their parents/guardians who participated in this study. We are grateful to Chiyo Hayashi who managed the samples and documents of the patients who participated in this study.

Conflicts of Interest

All authors declare no conflict of interest.

References

  1. Lefebvre, S.; Bürglen, L.; Reboullet, S.; Clermont, O.; Burlet, P.; Viollet, L.; Benichou, B.; Cruaud, C.; Millasseau, P.; Zeviani, M.; et al. Identification and characterization of a spinal muscular atrophy-determining gene. Cell 1995, 80, 155–165. [Google Scholar] [CrossRef] [Green Version]
  2. Arnold, W.D.; Kassar, D.; Kissel, J.T. Spinal muscular atrophy: Diagnosis and management in a new therapeutic era. Muscle Nerve 2015, 51, 157–167. [Google Scholar] [CrossRef] [PubMed]
  3. Carré, A.; Empey, C. Review of Spinal Muscular Atrophy (SMA) for Prenatal and Pediatric Genetic Counselors. J. Genet. Couns. 2016, 25, 32–43. [Google Scholar] [CrossRef] [PubMed]
  4. Prior, T.W.; Nagan, N.; Sugarman, E.A.; Batish, S.D.; Braastad, C. Technical standards and guidelines for spinal muscular atrophy testing. Genet. Med. 2011, 13, 686–694. [Google Scholar] [CrossRef] [PubMed] [Green Version]
  5. Calucho, M.; Bernal, S.; Alías, L.; March, F.; Venceslá, A.; Rodríguez-Álvarez, F.J.; Aller, E.; Fernández, R.M.; Borrego, S.; Millán, J.M.; et al. Correlation between SMA type and SMN2 copy number revisited: An analysis of 625 unrelated Spanish patients and a compilation of 2834 reported cases. Neuromuscul. Disord. 2018, 28, 208–215. [Google Scholar] [CrossRef] [PubMed]
  6. Van der Steege, G.; Grootscholten, P.M.; van der Vlies, P.; Draaijers, T.G.; Osinga, J.; Cobben, J.M.; Scheffer, H.; Buys, C.H.C.M. PCR-based DNA test to confirm clinical diagnosis of autosomal recessive spinal muscular atrophy. Lancet 1995, 345, 985–986. [Google Scholar] [CrossRef]
  7. Shinohara, M.; Niba, E.T.E.; Wijaya, Y.O.S.; Takayama, I.; Mitsuishi, C.; Kumasaka, S.; Kondo, Y.; Takatera, A.; Hokuto, I.; Morioka, I.; et al. A Novel System for Spinal Muscular Atrophy Screening in Newborns: Japanese Pilot Study Masakazu. Int. J. Neonatal. Screen. 2019, 5, 41. [Google Scholar] [CrossRef] [PubMed] [Green Version]
  8. Ar Rochmah, M.; Harahap, N.I.F.; Niba, E.T.E.; Nakanishi, K.; Awano, H.; Morioka, I.; Iijima, K.; Saito, T.; Saito, K.; Lai, P.S.; et al. Genetic screening of spinal muscular atrophy using a real-time modified COP-PCR technique with dried blood-spot DNA. Brain Dev. 2017, 39, 774–782. [Google Scholar] [CrossRef] [PubMed]
  9. Arkblad, E.L.; Darin, N.; Berg, K.; Kimber, E.; Brandberg, G.; Lindberg, C.; Holmberg, E.; Tulinius, M.; Nordling, M. Multiplex ligation-dependent probe amplification improves diagnostics in spinal muscular atrophy. Neuromuscul. Disord. 2006, 16, 830–838. [Google Scholar] [CrossRef] [PubMed]
  10. Vidal-Folch, N.; Gavrilov, D.; Raymond, K.; Rinaldo, P.; Tortorelli, S.; Matern, D.; Oglesbee, D. Multiplex droplet digital PCR method applicable to newborn screening, carrier status, and assessment of spinal muscular atrophy. Clin. Chem. 2018, 64, 1753–1761. [Google Scholar] [CrossRef] [Green Version]
  11. Feng, Y.; Ge, X.; Meng, L.; Scull, J.; Li, J.; Tian, X.; Zhang, T.; Jin, W.; Cheng, H.; Wang, X.; et al. The next generation of population-based spinal muscular atrophy carrier screening: Comprehensive pan-ethnic SMN1 copy-number and sequence variant analysis by massively parallel sequencing. Genet. Med. 2017, 19, 936–944. [Google Scholar] [CrossRef]
  12. Finkel, R.S.; Mercuri, E.; Darras, B.T.; Connolly, A.M.; Kuntz, N.L.; Kirschner, J.; Chiriboga, C.A.; Saito, K.; Servais, L.; Tizzano, E.; et al. Nusinersen versus Sham Control in Infantile-Onset Spinal Muscular Atrophy. N. Engl. J. Med. 2017, 377, 1723–1732. [Google Scholar] [CrossRef] [Green Version]
  13. Mendell, J.R.; Al-Zaidy, S.; Shell, R.; Arnold, W.D.; Rodino-Klapac, L.R.; Prior, T.W.; Lowes, L.; Alfano, L.; Berry, K.; Church, K.; et al. Single-dose gene-replacement therapy for spinal muscular atrophy. N. Engl. J. Med. 2017, 377, 1713–1722. [Google Scholar] [CrossRef]
  14. Dhillon, S. Risdiplam: First Approval. Drugs 2020, 80, 1853–1858. [Google Scholar] [CrossRef]
  15. Chien, Y.H.; Chiang, S.C.; Weng, W.C.; Lee, N.C.; Lin, C.J.; Hsieh, W.S.; Lee, W.T.; Jong, Y.J.; Ko, T.M.; Hwu, W.L. Presymptomatic Diagnosis of Spinal Muscular Atrophy Through Newborn Screening. J. Pediatr. 2017, 190, 124–129. [Google Scholar] [CrossRef] [PubMed]
  16. Kraszewski, J.N.; Kay, D.M.; Stevens, C.F.; Koval, C.; Haser, B.; Ortiz, V.; Albertorio, A.; Cohen, L.L.; Jain, R.; Andrew, S.P.; et al. Pilot study of population-based newborn screening for spinal muscular atrophy in New York state. Genet. Med. 2018, 20, 608–613. [Google Scholar] [CrossRef] [PubMed] [Green Version]
  17. Kucera, K.S.; Taylor, J.L.; Robles, V.R.; Clinard, K.; Migliore, B.; Boyea, B.L.; Okoniewski, K.C.; Duparc, M.; Rehder, C.W.; Shone, S.M.; et al. A voluntary statewide newborn screening pilot for spinal muscular atrophy: Results from early check. Int. J. Neonatal Screen. 2021, 7, 20. [Google Scholar] [CrossRef] [PubMed]
  18. Kariyawasam, D.S.T.; D’Silva, A.M.; Vetsch, J.; Wakefield, C.E.; Wiley, V.; Farrar, M.A. “We needed this”: Perspectives of parents and healthcare professionals involved in a pilot newborn screening program for spinal muscular atrophy. EClinicalMedicine 2021, 33, 100742. [Google Scholar] [CrossRef]
  19. Vill, K.; Schwartz, O.; Blaschek, A.; Gläser, D.; Nennstiel, U.; Wirth, B.; Burggraf, S.; Röschinger, W.; Becker, M.; Czibere, L.; et al. Newborn screening for spinal muscular atrophy in Germany: Clinical results after 2 years. Orphanet J. Rare Dis. 2021, 16, 153. [Google Scholar] [CrossRef]
  20. Dangouloff, T.; Vrščaj, E.; Servais, L.; Osredkar, D.; Adoukonou, T.; Aryani, O.; Barisic, N.; Bashiri, F.; Bastaki, L.; Benitto, A.; et al. Newborn screening programs for spinal muscular atrophy worldwide: Where we stand and where to go. Neuromuscul. Disord. 2021, 31, 574–582. [Google Scholar] [CrossRef]
  21. McMillan, H.J.; Kernohan, K.D.; Yeh, E.; Amburgey, K.; Boyd, J.; Campbell, C.; Dowling, J.J.; Gonorazky, H.; Marcadier, J.; Tarnopolsky, M.A.; et al. Newborn Screening for Spinal Muscular Atrophy: Ontario Testing and Follow-up Recommendations. Can. J. Neurol. Sci. 2021, 48, 504–511. [Google Scholar] [CrossRef] [PubMed]
  22. Lin, C.W.; Kalb, S.J.; Yeh, W.S. Delay in Diagnosis of Spinal Muscular Atrophy: A Systematic Literature Review. Pediatr. Neurol. 2015, 53, 293–300. [Google Scholar] [CrossRef] [PubMed] [Green Version]
  23. Kimizu, T.; Ida, S.; Okamoto, K.; Awano, H.; Niba, E.T.E.; Wijaya, Y.O.S.; Okazaki, S.; Shimomura, H.; Lee, T.; Tominaga, K.; et al. Spinal muscular atrophy: Diagnosis, incidence, and newborn screening in Japan. Int. J. Neonatal Screen. 2021, 7, 45. [Google Scholar] [CrossRef] [PubMed]
  24. Cao, Y.; Cheng, M.; Qu, Y.; Bai, J.; Peng, X.; Ge, X.; Jin, Y.; Wang, H.; Song, F. Factors associated with delayed diagnosis of spinal muscular atrophy in China and changes in diagnostic delay. Neuromuscul. Disord. 2021, 31, 519–527. [Google Scholar] [CrossRef]
  25. Pera, M.C.; Coratti, G.; Berti, B.; D’Amico, A.; Sframeli, M.; Albamonte, E.; De Sanctis, R.; Messina, S.; Catteruccia, M.; Brigati, G.; et al. Diagnostic journey in Spinal Muscular Atrophy: Is it still an odyssey? PLoS ONE 2020, 15, 1–10. [Google Scholar] [CrossRef]
  26. McAndrew, P.E.; Parsons, D.W.; Simard, L.R.; Rochette, C.; Ray, P.N.; Mendell, J.R.; Prior, T.W.; Burghes, A.H.M. Identification of proximal spinal muscular atrophy carriers and patients by analysis of SMN(T) and SMN(C) gene copy number. Am. J. Hum. Genet. 1997, 60, 1411–1422. [Google Scholar] [CrossRef] [Green Version]
  27. Kato, N.; Sa’Adah, N.; Ar Rochmah, M.; Harahap, N.I.F.; Nurputra, D.K.; Sato, H.; Sadewa, A.H.; Astuti, I.; Haryana, S.M.; Saito, T.; et al. SMA screening system using dried blood spots on filter paper: Application of COP-PCR to the SMN1 deletion test. Kobe J. Med. Sci. 2014, 60, E78–E85. [Google Scholar]
  28. Wijaya, Y.O.S.; Nishio, H.; Niba, E.T.E.; Shiroshita, T.; Kato, M.; Bouike, Y.; Tode, C.; Ar Rochmah, M.; Harahap, N.I.F.; Nurputra, D.K.; et al. Dried Blood Spot Screening System for Spinal Muscular Atrophy with Allele-Specific Polymerase Chain Reaction and Melting Peak Analysis. Genet. Test. Mol. Biomarkers 2021, 25, 293–301. [Google Scholar] [CrossRef]
  29. Wirth, B.; Herz, M.; Wetter, A.; Moskau, S.; Hahnen, E.; Rudnik-Schöneborn, S.; Wienker, T.; Zerres, K. Quantitative analysis of survival motor neuron copies: Identification of subtle SMN1 mutations in patients with spinal muscular atrophy, genotype- phenotype correlation, and implications for genetic counseling. Am. J. Hum. Genet. 1999, 64, 1340–1356. [Google Scholar] [CrossRef] [Green Version]
  30. Saguil, A. Evaluation of the patient with muscle weakness. Am. Fam. Physician 2005, 71, 1327–1336. [Google Scholar]
  31. Murthy, P.M.; Neduvat, A.C.; Veenadhar, C.; Sundarrajan, S.; Padmanabhan, S. Human Saliva and dried saliva spots as source of DNA for PCR based HLA typing using a combination of Taq DNA polymerase and accuprimetaq polymerase. Walailak J. Sci. Technol. 2020, 17, 113–127. [Google Scholar] [CrossRef]
  32. Hu, Y.; Ehli, E.A.; Nelson, K.; Bohlen, K.; Lynch, C.; Huizenga, P.; Kittlelsrud, J.; Soundy, T.J.; Davies, G.E. Genotyping performance between saliva and blood-derived genomic DNAS on the DMET array: A comparison. PLoS ONE 2012, 7, 4–8. [Google Scholar] [CrossRef] [PubMed] [Green Version]
  33. Gudiseva, H.V.; Hansen, M.; Gutierrez, L.; Collins, D.W.; He, J.; Verkuil, L.D.; Danford, I.D.; Sagaser, A.; Bowman, A.S.; Salowe, R.; et al. Saliva DNA quality and genotyping efficiency in a predominantly elderly population. BMC Med. Genom. 2016, 9, 17. [Google Scholar] [CrossRef] [Green Version]
  34. Drogou, C.; Sauvet, F.; Erblang, M.; Detemmerman, L.; Derbois, C.; Erkel, M.C.; Boland, A.; Deleuze, J.F.; Gomez-Merino, D.; Chennaoui, M. Genotyping on blood and buccal cells using loop-mediated isothermal amplification in healthy humans. Biotechnol. Rep. 2020, 26, e00468. [Google Scholar] [CrossRef] [PubMed]
  35. Goode, M.R.; Cheong, S.Y.; Li, N.; Ray, W.C.; Bartlett, C.W. Collection and extraction of saliva DNA for next generation sequencing. J. Vis. Exp. 2014, 90, 51697. [Google Scholar] [CrossRef]
  36. Yao, R.A.; Akinrinade, O.; Chaix, M.; Mital, S. Quality of whole genome sequencing from blood versus saliva derived DNA in cardiac patients. BMC Med. Genom. 2020, 13, 11. [Google Scholar] [CrossRef] [Green Version]
  37. Ibrahim, O.; Sutherland, H.G.; Haupt, L.M.; Griffiths, L.R. Saliva as a comparable-quality source of DNA for Whole Exome Sequencing on Ion platforms. Genomics 2020, 112, 1437–1443. [Google Scholar] [CrossRef]
  38. Kisoi, M.; Moritsugu, M.; Imai, M.; Fukumoto, K.; Sakaguchi, Y.; Murata, S.; Kawai, S.; Ichikawa, A.; Kinoshita, K. Rapid and cost-effective genotyping protocol for angiotensin-converting enzyme insertion/deletion (Ins/Del) polymorphism from saliva. Biol. Pharm. Bull. 2019, 42, 1345–1349. [Google Scholar] [CrossRef]
  39. Brogna, R.; Oldenhof, H.; Sieme, H.; Wolkers, W.F. Spectral fingerprinting to evaluate effects of storage conditions on biomolecular structure of filter-dried saliva samples and recovered DNA. Sci. Rep. 2020, 10, 21442. [Google Scholar] [CrossRef]
  40. Imai, M.; Kisoi, M.; Sakaguchi, Y.; Yamamura, M.; Kawai, S.; Murata, S.; Ichikawa, A.; Kinoshita, K. Development of novel genotyping protocol and its application for genotyping of alcohol metabolism-related genes. Yakugaku Zasshi 2019, 139, 1111–1119. [Google Scholar] [CrossRef]
  41. Hayashida, M.; Ota, T.; Ishii, M.; Iwao-Koizumi, K.; Murata, S.; Kinoshita, K. Direct detection of Single Nucleotide Polymorphism (SNP) by the TaqMan PCR assay using dried saliva on water-soluble paper and hair-roots, without DNA extraction. Anal. Sci. 2014, 30, 427–429. [Google Scholar] [CrossRef] [PubMed] [Green Version]
  42. Gibbs, R.A.; Nguyen, P.N.; Caskey, C.T. Detection of single DNA base differences by competitive oligonucleotide priming. Nucleic Acids Res. 1989, 17, 2437–2448. [Google Scholar] [CrossRef] [PubMed] [Green Version]
  43. Wijaya, Y.O.S.; Purevsuren, J.; Harahap, N.I.F.; Niba, E.T.E.; Bouike, Y.; Nurputra, D.K.; Ar Rochmah, M.; Thursina, C.; Hapsara, S.; Yamaguchi, S.; et al. Assessment of Spinal Muscular Atrophy Carrier Status by Determining SMN1 Copy Number Using Dried Blood Spots. Int. J. Neonatal Screen. 2020, 6, 43. [Google Scholar] [CrossRef]
  44. Ochert, A.S.; Boulter, A.W.; Birnbaum, W.; Johnson, N.W.; Teo, C.G. Inhibitory effect of salivary fluids on PCR: Potency and removal. PCR Methods Appl. 1994, 3, 365–368. [Google Scholar] [CrossRef] [Green Version]
Figure 1. Primer locations for (A) the first-round PCR and (B) the second-round PCR. Arrows indicate the direction of the primers.
Genes 12 01621 g001
Figure 2. Detection of SMN1. (A) Agarose gel electrophoresis of the second-round PCR products indicating the SMN1 band (169 bp) and the CFTR band (111 bp). Lanes M, 1, 2, and 3 represent the DNA ladder, SMA patient, healthy control, and blank paper, respectively. (B) Melting curve and melting peak analysis to detect SMN1/CFTR in a healthy DSS (blue line), an SMA DSS (red line), and a blank paper (green line).
Genes 12 01621 g002
Figure 3. The SMN1/CFTR peak ratio (SCR) value. (A) The formula to calculate SCR. (B) The changes to the SCR value over the month(s).
Genes 12 01621 g003
Figure 4. Box-and-whisker plot of the SCR values from controls (blue box) and SMA patients (red box). The “x” mark represents the average value. The middle, lower, and upper lines of the box represent the median value, the 25th percentile, and the 75th percentile, respectively.
Genes 12 01621 g004
Publisher’s Note: MDPI stays neutral with regard to jurisdictional claims in published maps and institutional affiliations.

