The Study of the Expression of CGB1 and CGB2 in Human Cancer Tissues


Abstract
:1. Introduction
2. Materials and Methods
3. Results
4. Discussion
Author Contributions
Funding
Conflicts of Interest
Abbreviations
| ACC | Adrenocortical carcinoma |
| BLCA | Bladder urothelial carcinoma |
| BRCA | Breast invasive carcinoma |
| CESC | Cervical squamous cell carcinoma |
| CHOL | Cholangiocarcinoma |
| COAD | Colon adenocarcinoma |
| DLBC | Lymphoid neoplasm diffuse large B-cell lymphoma |
| ESCA | Esophageal carcinoma |
| GBM | Glioblastoma multiforme |
| HNSC | Head and Neck squamous cell carcinoma |
| KICH | Kidney chromophobe |
| KIRC | Kidney renal clear cell carcinoma |
| KIRP | Kidney renal papillary cell carcinoma |
| LGG | Brain lower grade glioma |
| OV | Ovarian serous cystadenocarcinoma |
| MESO | Mesothelioma |
| LIHC | Liver hepatocellular carcinoma |
| LUAD | Lung adenocarcinoma |
| LUSC | Lung squamous cell carcinoma |
| PAAD | Pancreatic adenocarcinoma |
| PRAD | Prostate adenocarcinoma |
| PCPG | Pheochromocytoma and Paraganglioma |
| READ | Rectum adenocarcinoma |
| SARC | Sarcoma |
| SKCM | Skin cutaneous melanoma |
| LAML | Acute Myeloid Leukemia |
| TGCT | Testis germ cell tumors |
| THCA | Thyroid carcinoma |
| THYM | Thymoma |
| STAD | Stomach adenocarcinoma |
| UCEC | Uterine corpus endometrial carcinoma |
| USC | Uterine carcinosarcoma |
| UVM | Uveal Melanoma |
| Mdn | Median |
References
- Pierce, J.G.; Parsons, T.F. Glycoprotein Hormones: Structure and Function. Annu. Rev. Biochem. 1981, 50, 465–495. [Google Scholar] [CrossRef] [PubMed]
- Fiddes, J.C.; Goodman, H.M. The gene encoding the common α subunit of the four human glycoprotein hormones. J. Mol. Appl. Genet. 1981, 1, 3–18. [Google Scholar]
- Policastro, P.F.; Daniels-McQueen, S.; Carle, G.; Boime, I. A map of the hCG β-LH β gene cluster. J. Biol. Chem. 1986, 261, 5907–5916. [Google Scholar] [PubMed]
- Nwabuobi, C.; Arlier, S.; Schatz, F.; Guzeloglu-Kayisli, O.; Lockwood, C.J.; Kayisli, U.A. hCG: Biological Functions and Clinical Applications. Int. J. Mol. Sci. 2017, 18, 2037. [Google Scholar] [CrossRef] [PubMed]
- Herr, F.; Baal, N.; Reisinger, K.; Lorenz, A.; McKinnon, T.; Preissner, K.T.; Zygmunt, M. hCG in the Regulation of Placental Angiogenesis. Results of an In Vitro Study. Placenta 2007, 28, S85–S93. [Google Scholar] [CrossRef] [PubMed]
- Bansal, A.S.; Bora, S.A.; Saso, S.; Smith, J.R.; Johnson, M.R.; Thum, M.-Y. Mechanism of human chorionic gonadotrophin-mediated immunomodulation in pregnancy. Expert Rev. Clin. Immunol. 2012, 8, 747–753. [Google Scholar] [CrossRef] [PubMed]
- Poloski, Z.; Linzke, N.; Woidacki, K.; Anne Schumacher, A.C.; Heinze, K.; Witte, J. Human Chorionic Gonadotropin as a Central Regulator of Pregnancy Immune Tolerance. J. Immunol. Ref. 2013, 190, 2650–2658. [Google Scholar] [CrossRef] [Green Version]
- Iles, R.K.; Delves, P.J.; Butler, S.A. Does hCG or hCGβ play a role in cancer cell biology? Mol. Cell. Endocrinol. 2010, 329, 62–70. [Google Scholar] [CrossRef] [PubMed]
- Hotakainen, K.; Lintula, S.; Jarvinen, R.; Paju, A.; Stenman, J.; Rintala, E.; Stenman, U.H. Overexpression of human chorionic gonadotropin β genes 3, 5 and 8 in tumor tissue and urinary cells of bladder cancer patients. Tumor Biol. 2007, 28, 52–56. [Google Scholar] [CrossRef] [PubMed]
- Talmadge, K.; Boorstein, W.R.; Vamvakopoulos, N.C.; Gething, M.J.; Fiddes, J.C. Only three of the seven human chorionic gonadotropin β subunit genes can be expressed in the placenta. Nucleic Acids Res. 1984, 12, 8415–8436. [Google Scholar] [CrossRef] [Green Version]
- Julier, C.; Weil, D.; Couillin, P.; Côté, J.C.; Nguyen, V.C.; Foubert, C.; Boué, A.; Thirion, J.P.; Kaplan, J.C.; Junien, C. The β chorionic gonadotropin-β luteinizing gene cluster maps to human chromosome 19. Hum. Genet. 1984, 67, 174–177. [Google Scholar] [CrossRef]
- Policastro, P.; Ovitt, C.E.; Hoshina, M.; Fukuoka, H.; Boothby, M.R.; Boime, I. The β subunit of human chorionic gonadotropin is encoded by multiple genes. J. Biol. Chem. 1983, 258, 11492–11499. [Google Scholar] [PubMed]
- Bidart, J.M.; Baudin, E.; Troalen, F.; Bellet, D.; Schlumberger, M. Eutopic and ectopic production of glycoprotein hormones α and β subunits. Ann. D’endocrinol. 1997, 58, 125–128. [Google Scholar]
- Bo, M.; Boime, I. Identification of the transcriptionally active genes of the chorionic gonadotropin β gene cluster in vivo. J. Biol. Chem. 1992, 267, 3179–3184. [Google Scholar] [PubMed]
- Fiddes, J.C.; Goodman, H.M. The cDNA for the β-subunit of human chorionic gonadotropin suggests evolution of a gene by readthrough into the 3′-untranslated region. Nature 1980, 286, 684–687. [Google Scholar] [CrossRef]
- Maston, G.A.; Ruvolo, M. Chorionic Gonadotropin Has a Recent Origin Within Primates and an Evolutionary History of Selection. Mol. Biol. Evol. 2002, 19, 320–335. [Google Scholar] [CrossRef] [Green Version]
- Hollenberg, A.N.; Pestell, R.G.; Albanese, C.; Boers, M.E.; Jameson, J.L. Multiple promoter elements in the human chorionic gonadotropin β subunit genes distinguish their expression from the luteinizing hormone β gene. Mol. Cell. Endocrinol. 1994, 106, 111–119. [Google Scholar] [CrossRef]
- Hallast, P.; Rull, K.; Laan, M. The evolution and genomic landscape of CGB1 and CGB2 genes. Mol. Cell. Endocrinol. 2007, 260–262, 2–11. [Google Scholar] [CrossRef]
- Rull, K.; Hallast, P.; Uusküla, L.; Jackson, J.; Punab, M.; Salumets, A.; Campbell, R.K.; Laan, M. Fine-scale quantification of HCG β gene transcription in human trophoblastic and non-malignant non-trophoblastic tissues. Mol. Hum. Reprod. 2008, 14, 23–31. [Google Scholar] [CrossRef]
- Madersbacher, S.; Kratzik, C.; Gerth, R.; Dirnhofer, S.; Berger, P. Human chorionic gonadotropin (hCG) and its free subunits in hydrocele fluids and neoplastic tissue of testicular cancer patients: Insights into the in vivo hCG-secretion pattern. Cancer Res. 1994, 54, 5096–5100. [Google Scholar]
- Parrott, A.M.; Sriram, G.; Liu, Y.; Mathews, M.B. Expression of type II chorionic gonadotropin genes supports a role in the male reproductive system. Mol. Cell. Biol. 2011, 31, 287–299. [Google Scholar] [CrossRef] [PubMed] [Green Version]
- Dirnhofer, S.; Hermann, M.; Hittmair, A.; Hoermann, R.; Kapelari, K.; Berger, P. Expression of the human chorionic gonadotropin-β gene cluster in human pituitaries and alternate use of exon 1. J. Clin. Endocrinol. Metab. 1996, 81, 4212–4217. [Google Scholar] [CrossRef] [PubMed] [Green Version]
- Berger, P.; Gruschwitz, M.; Spoettl, G.; Dirnhofer, S.; Madersbacher, S.; Gerth, R.; Merz, W.E.; Plas, E.; Sampson, N. Human chorionic gonadotropin (hCG) in the male reproductive tract. Mol. Cell. Endocrinol. 2007, 260–262, 190–196. [Google Scholar] [CrossRef]
- Giovangrandi, Y.; Parfait, B.; Asheuer, M.; Olivi, M.; Lidereau, R.; Vidaud, M.; Bièche, I. Analysis of the human CGB/LHB gene cluster in breast tumors by real-time quantitative RT-PCR assays. Cancer Lett. 2001, 168, 93–100. [Google Scholar] [CrossRef]
- Kubiczak, M.; Walkowiak, G.P.; Nowak-Markwitz, E.; Jankowska, A. Human chorionic gonadotropin β subunit genes CGB1 and CGB2 are transcriptionally active in ovarian cancer. Int. J. Mol. Sci. 2013, 14, 12650–12660. [Google Scholar] [CrossRef] [Green Version]
- Rull, K.; Laan, M. Expression of β-subunit of HCG genes during normal and failed pregnancy. Hum. Reprod. 2005, 20, 3360–3368. [Google Scholar] [CrossRef]
- Chandrashekar, D.S.; Bashel, B.; Balasubramanya, S.A.H.; Creighton, C.J.; Ponce-Rodriguez, I.; Chakravarthi, B.V.S.K.; Varambally, S. UALCAN: A Portal for Facilitating Tumor Subgroup Gene Expression and Survival Analyses. Neoplasia 2017, 19, 649–658. [Google Scholar] [CrossRef]
- Burczynska, B.B.; Kobrouly, L.; Butler, S.A.; Naase, M.; Iles, R.K. Novel insights into the expression of CGB1 1-2 genes by epithelial cancer cell lines secreting ectopic free. Anticancer Res. 2014, 34, 2239–2248. [Google Scholar]


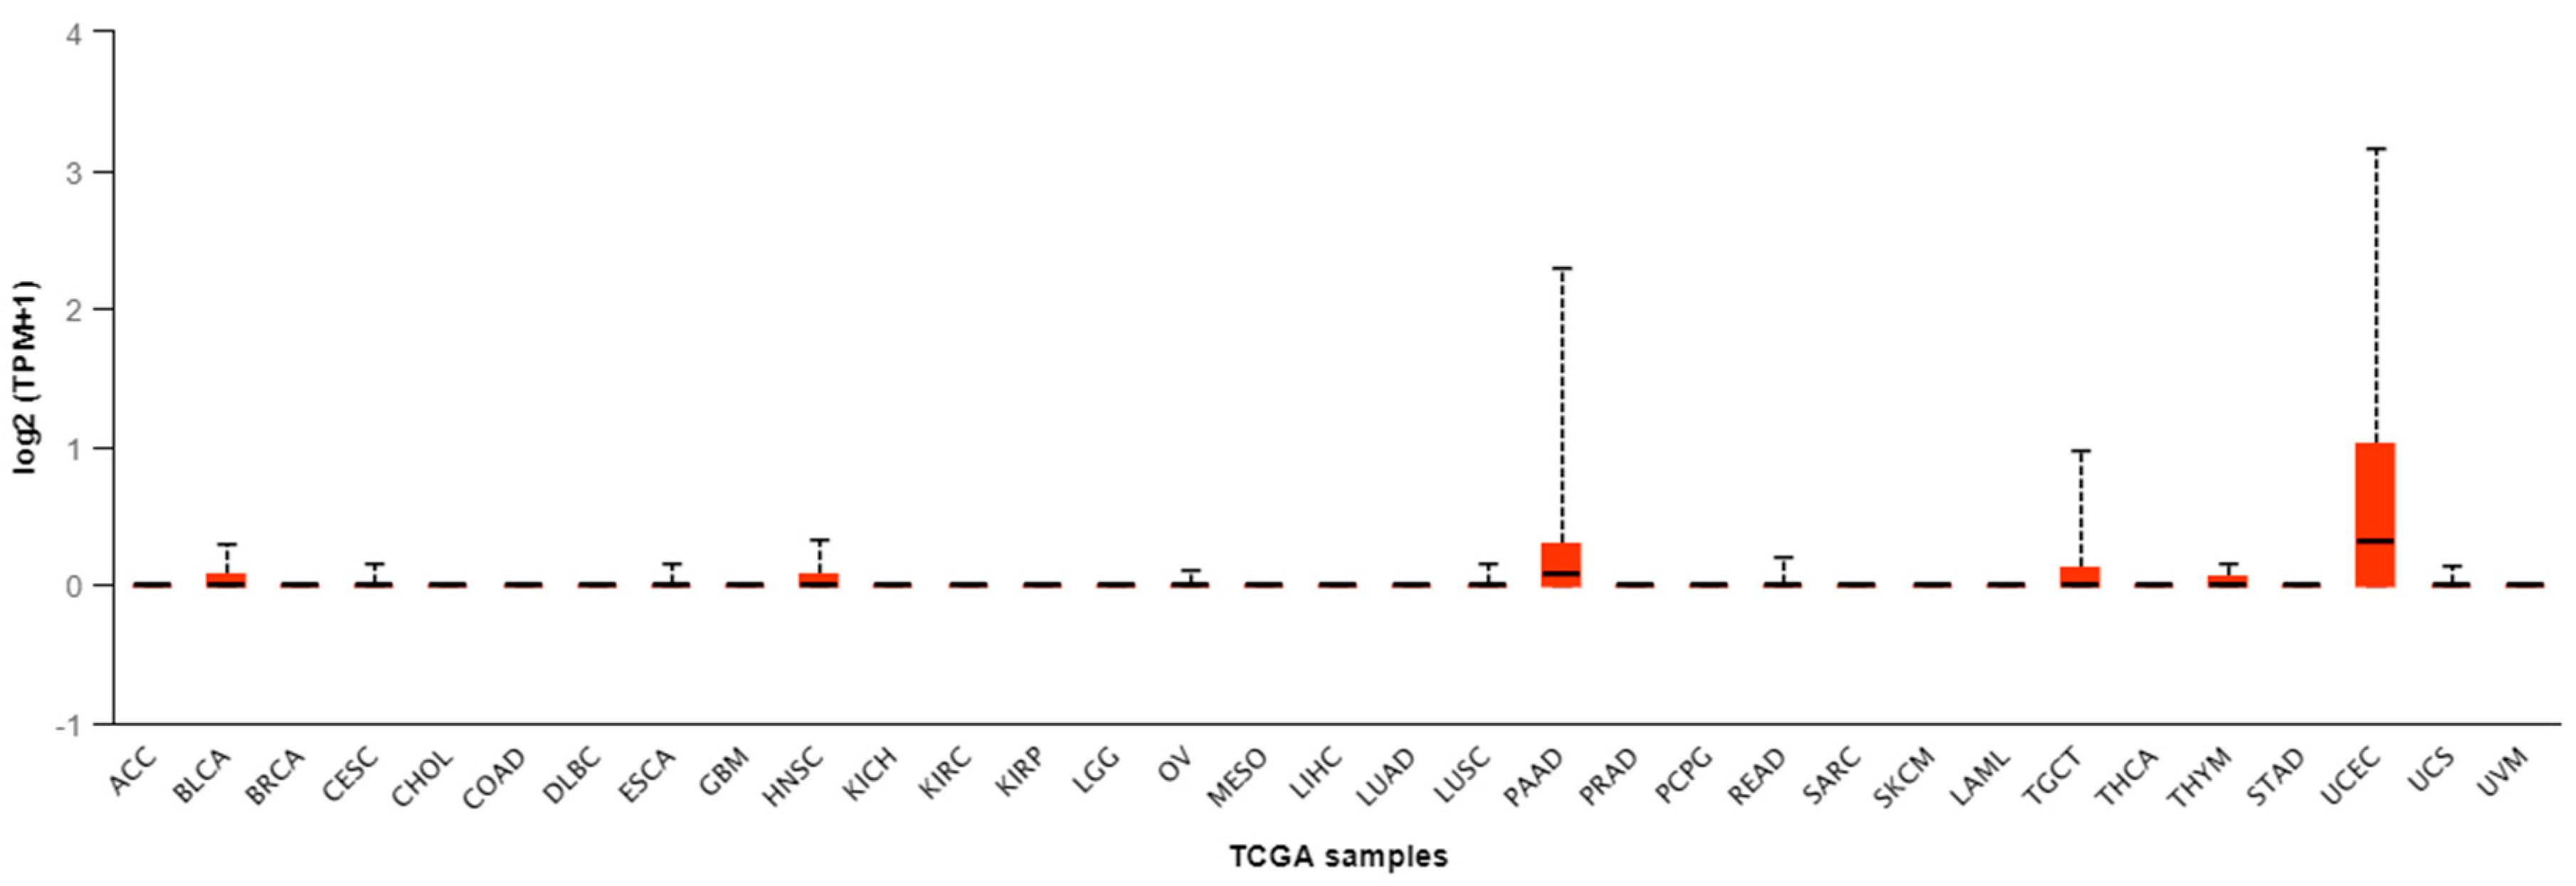
| Tumor Type | Number of Samples | Minimal Value | Lower Q | Median | Upper Q | Maximal Value |
|---|---|---|---|---|---|---|
| ACC | 79 | 0 | 0 | 0 | 0 | 0 |
| BLCA | 408 | 0 | 0 | 0 | 0.071 | 0.297 |
| BRCA | 1097 | 0 | 0 | 0 | 0 | 0 |
| CESC | 305 | 0 | 0 | 0 | 0 | 0.159 |
| CHOL | 36 | 0 | 0 | 0 | 0 | 0 |
| COAD | 286 | 0 | 0 | 0 | 0 | 0 |
| DLBC | 48 | 0 | 0 | 0 | 0 | 0 |
| ESCA | 184 | 0 | 0 | 0 | 0 | 0.152 |
| GBM | 156 | 0 | 0 | 0 | 0 | 0 |
| HNSC | 520 | 0 | 0 | 0 | 0.075 | 0.321 |
| KICH | 67 | 0 | 0 | 0 | 0 | 0 |
| KIRC | 533 | 0 | 0 | 0 | 0 | 0 |
| KIRP | 290 | 0 | 0 | 0 | 0 | 0 |
| LGG | 513 | 0 | 0 | 0 | 0 | 0 |
| OV | 305 | 0 | 0 | 0 | 0 | 0.103 |
| MESO | 87 | 0 | 0 | 0 | 0 | 0 |
| LIHC | 371 | 0 | 0 | 0 | 0 | 0 |
| LUAD | 515 | 0 | 0 | 0 | 0 | 0 |
| LUSC | 503 | 0 | 0 | 0 | 0 | 0.152 |
| PAAD | 178 | 0 | 0 | 0.078 | 0.302 | 2.291 |
| PRAD | 497 | 0 | 0 | 0 | 0 | 0 |
| PCPG | 179 | 0 | 0 | 0 | 0 | 0 |
| READ | 166 | 0 | 0 | 0 | 0 | 0.198 |
| SARC | 260 | 0 | 0 | 0 | 0 | 0 |
| SKCM | 472 | 0 | 0 | 0 | 0 | 0 |
| LAML | 173 | 0 | 0 | 0 | 0 | 0 |
| TGCT | 150 | 0 | 0 | 0 | 0.124 | 0.997 |
| THCA | 505 | 0 | 0 | 0 | 0 | 0 |
| THYM | 120 | 0 | 0 | 0 | 0.061 | 0.149 |
| STAD | 415 | 0 | 0 | 0 | 0 | 0 |
| UCEC | 546 | 0 | 0 | 0.317 | 1.016 | 3.158 |
| USC | 57 | 0 | 0 | 0 | 0 | 0.134 |
| UVM | 80 | 0 | 0 | 0 | 0 | 0 |
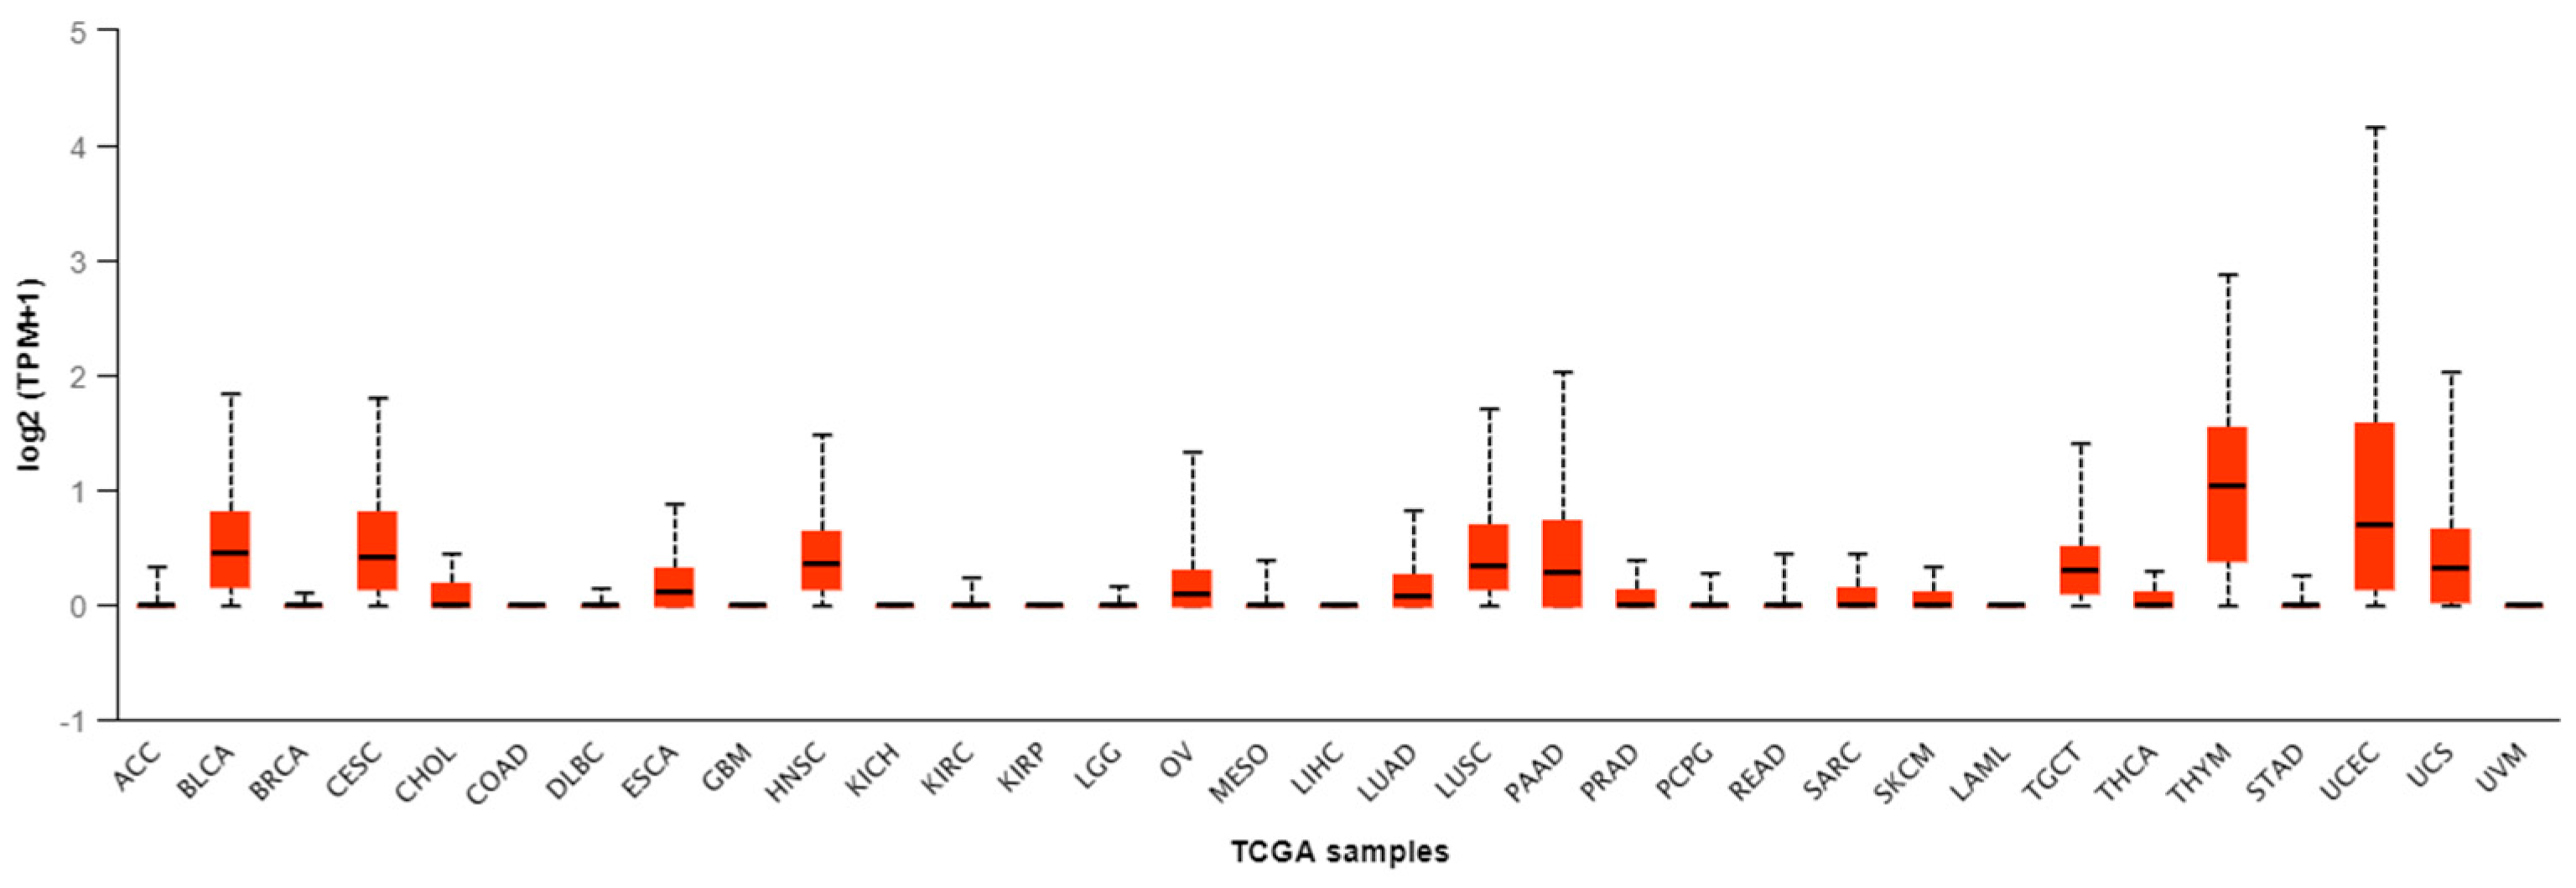
| Tumor Type | Number of Samples | Minimal Value | Lower Q | Median | Upper Q | Maximal Value |
|---|---|---|---|---|---|---|
| ACC | 79 | 0 | 0 | 0 | 0 | 0.329 |
| BLCA | 408 | 0 | 0.157 | 0.447 | 0.8 | 1.848 |
| BRCA | 1097 | 0 | 0 | 0 | 0 | 0.105 |
| CESC | 305 | 0 | 0.133 | 0.412 | 0.801 | 1.81 |
| CHOL | 36 | 0 | 0 | 0 | 0.17 | 0.44 |
| COAD | 286 | 0 | 0 | 0 | 0 | 0 |
| DLBC | 48 | 0 | 0 | 0 | 0 | 0.144 |
| ESCA | 184 | 0 | 0 | 0.112 | 0.311 | 0.869 |
| GBM | 156 | 0 | 0 | 0 | 0 | 0 |
| HNSC | 520 | 0 | 0.15 | 0.356 | 0.631 | 1.475 |
| KICH | 67 | 0 | 0 | 0 | 0 | 0 |
| KIRC | 533 | 0 | 0 | 0 | 0 | 0.236 |
| KIRP | 290 | 0 | 0 | 0 | 0 | 0 |
| LGG | 513 | 0 | 0 | 0 | 0 | 0.158 |
| OV | 305 | 0 | 0 | 0.087 | 0.299 | 1.329 |
| MESO | 87 | 0 | 0 | 0 | 0 | 0.396 |
| LIHC | 371 | 0 | 0 | 0 | 0 | 0 |
| LUAD | 515 | 0 | 0 | 0.084 | 0.257 | 0.823 |
| LUSC | 503 | 0 | 0.14 | 0.336 | 0.69 | 1.71 |
| PAAD | 178 | 0 | 0 | 0.279 | 0.725 | 2.024 |
| PRAD | 497 | 0 | 0 | 0 | 0.132 | 0.38 |
| PCPG | 179 | 0 | 0 | 0 | 0 | 0.265 |
| READ | 166 | 0 | 0 | 0 | 0 | 0.434 |
| SARC | 260 | 0 | 0 | 0 | 0.145 | 0.442 |
| SKCM | 472 | 0 | 0 | 0 | 0.098 | 0.329 |
| LAML | 173 | 0 | 0 | 0 | 0 | 0 |
| TGCT | 150 | 0 | 0.106 | 0.305 | 0.502 | 1.414 |
| THCA | 505 | 0 | 0 | 0 | 0.105 | 0.288 |
| THYM | 120 | 0 | 0.384 | 1.033 | 1.537 | 2.871 |
| STAD | 415 | 0 | 0 | 0 | 0 | 0.257 |
| UCEC | 546 | 0 | 0.135 | 0.703 | 1.572 | 4.154 |
| USC | 57 | 0 | 0.033 | 0.318 | 0.644 | 2.019 |
| UVM | 80 | 0 | 0 | 0 | 0 | 0 |
| Tumor Type | Number of Samples | Gene | Minimal Value | Lower Q | Median | Upper Q | Maximal Value |
|---|---|---|---|---|---|---|---|
| BLCA | 408 | CGB1 | 0 | 0 | 0 | 0.071 | 0.297 |
| CGB2 | 0 | 0.157 | 0.447 | 0.8 | 1.848 | ||
| CESC | 305 | CGB1 | 0 | 0 | 0 | 0 | 0.159 |
| CGB2 | 0 | 0.133 | 0.412 | 0.801 | 1.81 | ||
| ESCA | 184 | CGB1 | 0 | 0 | 0 | 0 | 0.152 |
| CGB2 | 0 | 0 | 0.112 | 0.311 | 0.869 | ||
| HNSC | 520 | CGB1 | 0 | 0 | 0 | 0.075 | 0.321 |
| CGB2 | 0 | 0.15 | 0.356 | 0.631 | 1.475 | ||
| OV | 305 | CGB1 | 0 | 0 | 0 | 0 | 0.103 |
| CGB2 | 0 | 0 | 0.087 | 0.299 | 1.329 | ||
| LUSC | 503 | CGB1 | 0 | 0 | 0 | 0 | 0.152 |
| CGB2 | 0 | 0.14 | 0.336 | 0.69 | 1.71 | ||
| PAAD | 178 | CGB1 | 0 | 0 | 0.078 | 0.302 | 2.291 |
| CGB2 | 0 | 0 | 0.279 | 0.725 | 2.024 | ||
| READ | 166 | CGB1 | 0 | 0 | 0 | 0 | 0.198 |
| CGB2 | 0 | 0 | 0 | 0 | 0.434 | ||
| TGCT | 150 | CGB1 | 0 | 0 | 0 | 0.124 | 0.997 |
| CGB2 | 0 | 0.106 | 0.305 | 0.502 | 1.414 | ||
| THYM | 120 | CGB1 | 0 | 0 | 0 | 0.061 | 0.149 |
| CGB2 | 0 | 0.384 | 1.033 | 1.537 | 2.871 | ||
| UCEC | 546 | CGB1 | 0 | 0 | 0.317 | 1.016 | 3.158 |
| CGB2 | 0 | 0.135 | 0.703 | 1.572 | 4.154 | ||
| USC | 57 | CGB1 | 0 | 0 | 0 | 0 | 0.134 |
| CGB2 | 0 | 0.033 | 0.318 | 0.644 | 2.019 |
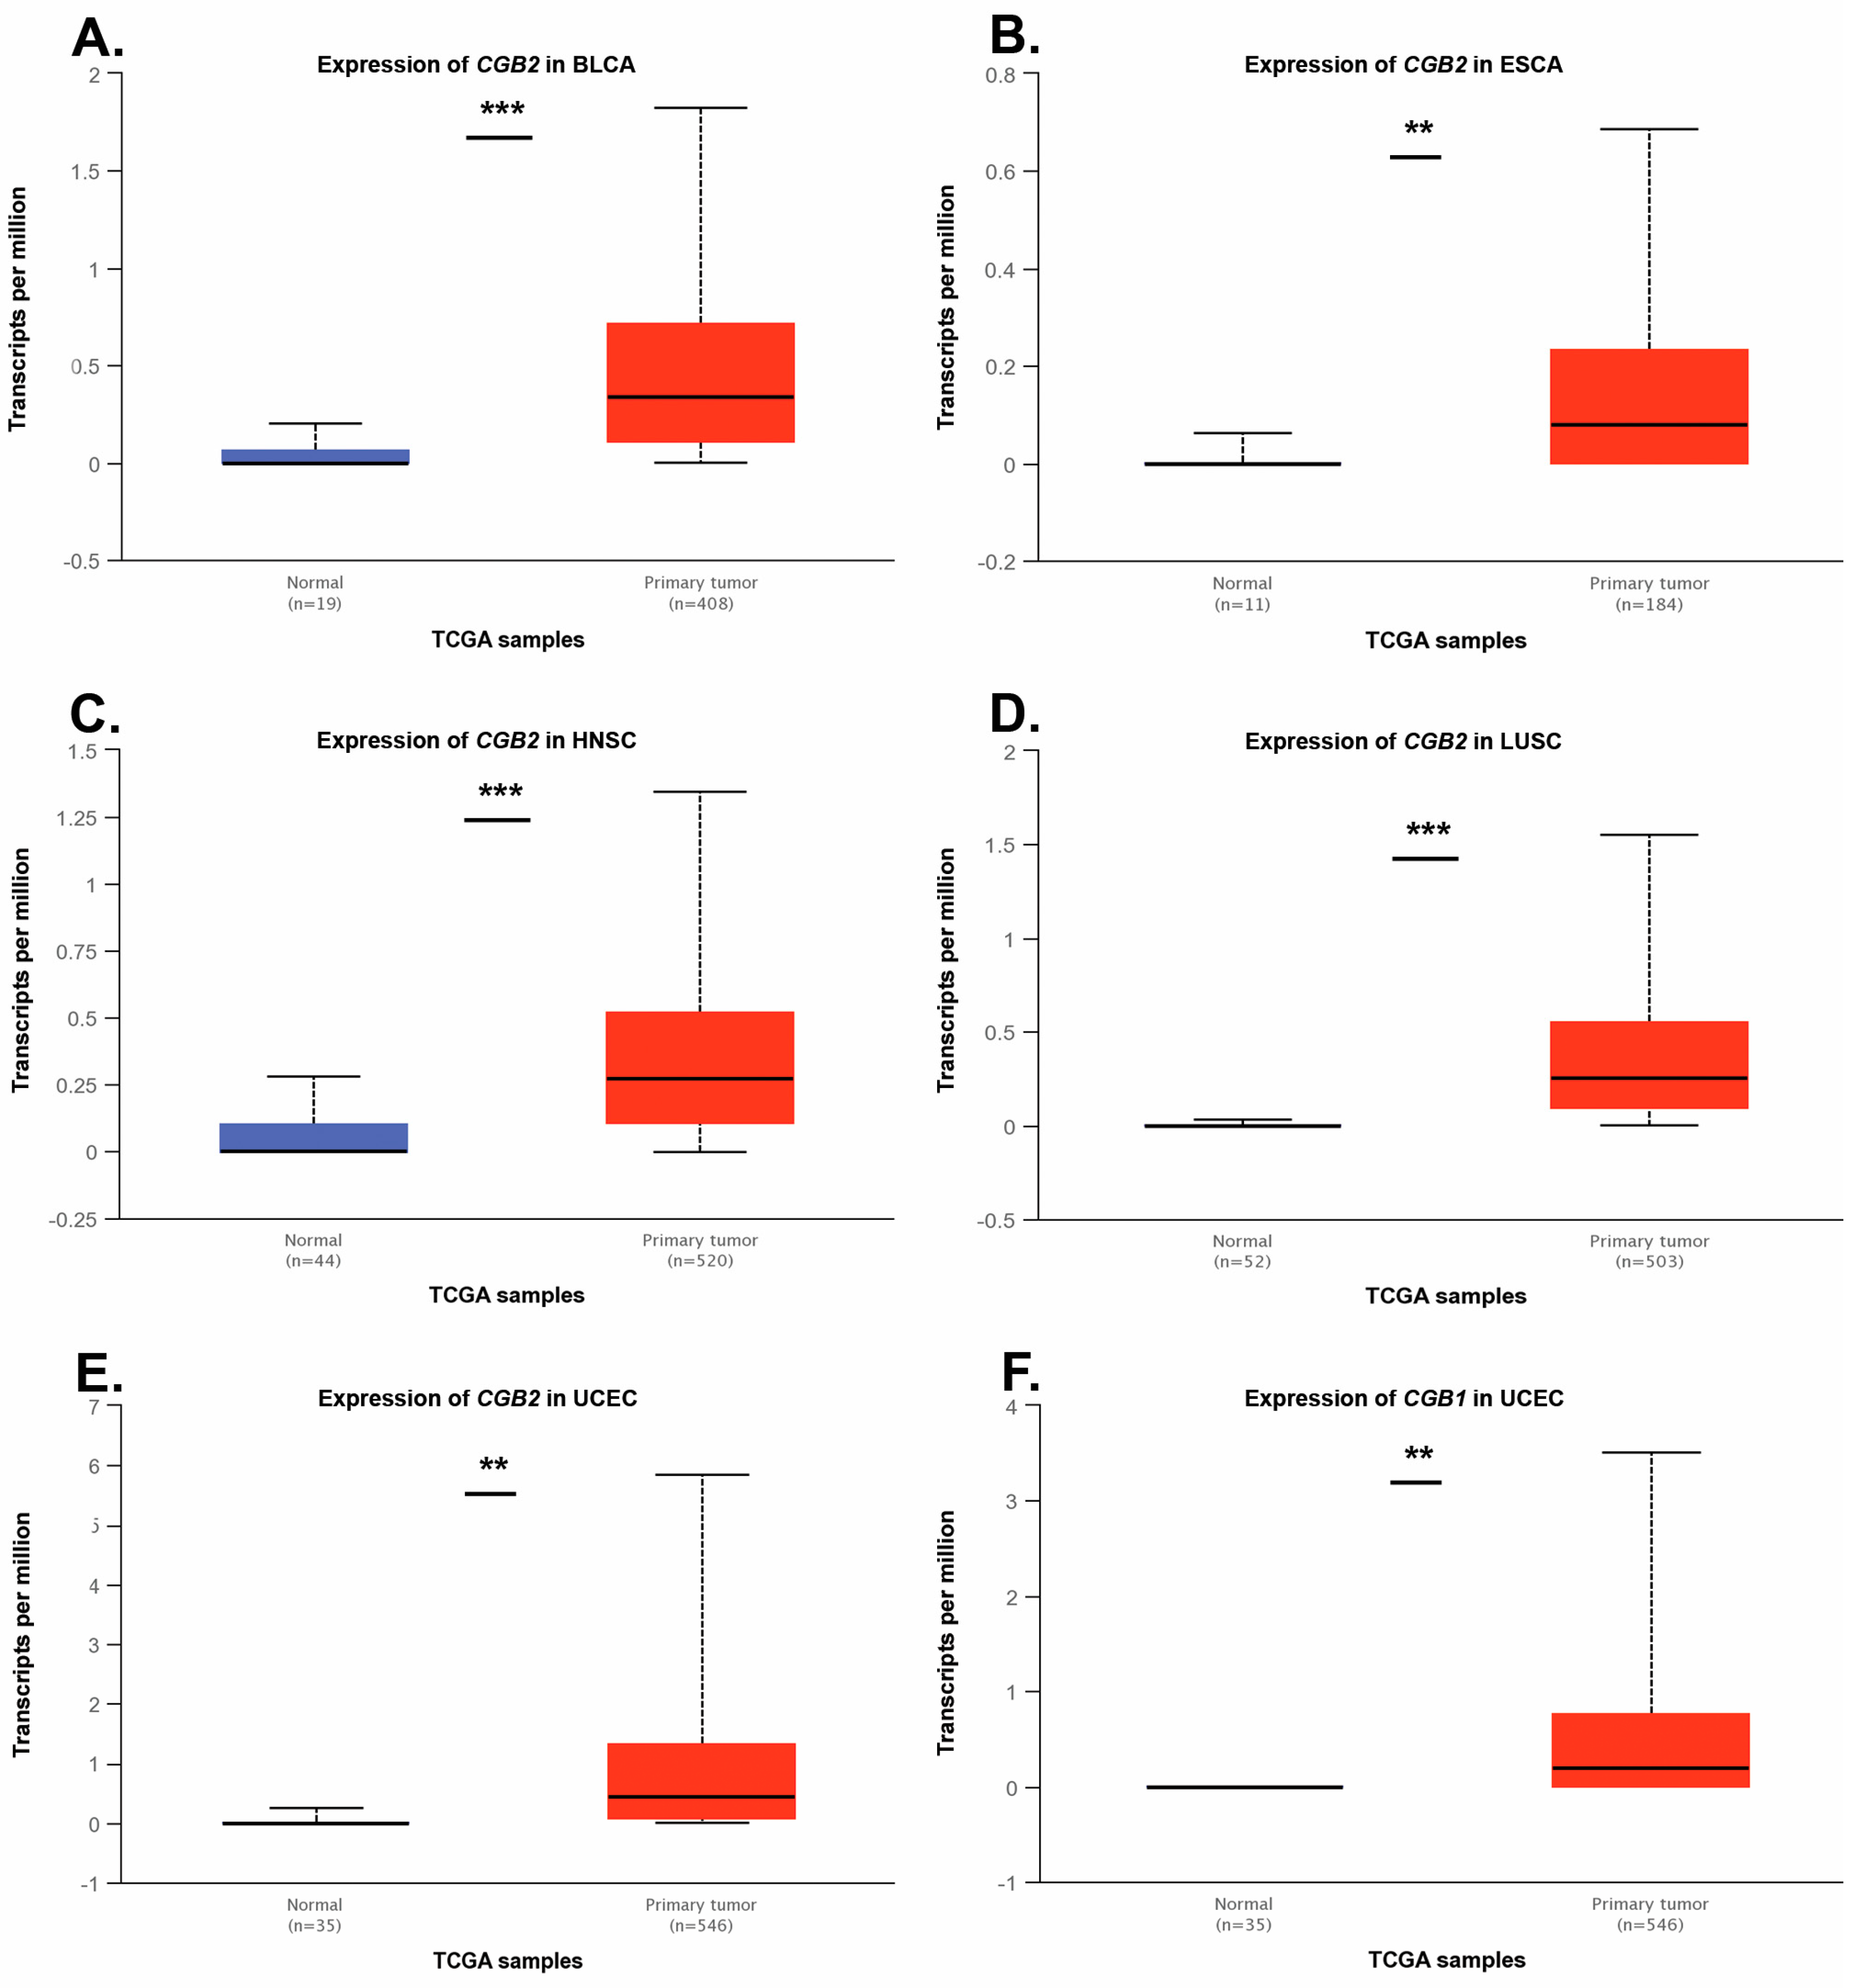
| Tumor Type | Number of Tissue Samples | Gene | p | |
|---|---|---|---|---|
| Non-Malignant | Primary Tumor | |||
| BLCA | 19 | 408 | CGB1 | 0.07 |
| CGB2 | 1 × 10⁻⁶ | |||
| CESC | 3 | 305 | CGB1 | n.a. |
| CGB2 | n.a. | |||
| ESCA | 11 | 184 | CGB1 | n.a. |
| CGB2 | 0.006 | |||
| HNSC | 44 | 520 | CGB1 | n.a. |
| CGB2 | <1 × 10⁻¹² | |||
| OV | no data | 305 | CGB1 | n.a. |
| CGB2 | n.a. | |||
| LUSC | 52 | 503 | CGB1 | n.a. |
| CGB2 | <1 × 10⁻¹² | |||
| PAAD | 4 | 178 | CGB1 | n.a. |
| CGB2 | n.a. | |||
| READ | 10 | 166 | CGB1 | n.a. |
| CGB2 | n.a. | |||
| TGCT | no data | 150 | CGB1 | n.a. |
| CGB2 | n.a. | |||
| THYM | 2 | 120 | CGB1 | n.a. |
| CGB2 | n.a. | |||
| UCEC | 35 | 546 | CGB1 | 0.0044 |
| CGB2 | 0.0017 | |||
| USC | no data | 57 | CGB1 | n.a. |
| CGB2 | n.a. | |||
© 2020 by the authors. Licensee MDPI, Basel, Switzerland. This article is an open access article distributed under the terms and conditions of the Creative Commons Attribution (CC BY) license (http://creativecommons.org/licenses/by/4.0/).
Share and Cite
Białas, P.; Śliwa, A.; Szczerba, A.; Jankowska, A. The Study of the Expression of CGB1 and CGB2 in Human Cancer Tissues. Genes 2020, 11, 1082. https://doi.org/10.3390/genes11091082
Białas P, Śliwa A, Szczerba A, Jankowska A. The Study of the Expression of CGB1 and CGB2 in Human Cancer Tissues. Genes. 2020; 11(9):1082. https://doi.org/10.3390/genes11091082
Chicago/Turabian StyleBiałas, Piotr, Aleksandra Śliwa, Anna Szczerba, and Anna Jankowska. 2020. "The Study of the Expression of CGB1 and CGB2 in Human Cancer Tissues" Genes 11, no. 9: 1082. https://doi.org/10.3390/genes11091082