Genome-Wide DNA Methylation and Gene Expression Profiles in Cows Subjected to Different Stress Level as Assessed by Cortisol in Milk

 , and
, and
Abstract
:1. Introduction
2. Material and Methods
2.1. Ethics Statement
2.2. Animals Treatment and Experimental Design
2.3. DNA Isolation, Library Preparation and RRBs Sequencing
2.4. Data Analysis
2.5. Identification of DMRs and DMGs
2.6. Association Analysis
2.7. GO and KEGG Enrichment Analysis of DMR-Related Genes
2.8. Sample Preparation for RNA—Seq Analysis
2.9. Quantification of Gene Expression Levels and Differential Expression Analysis
3. Results
3.1. Global Mapping of DNA Methylation
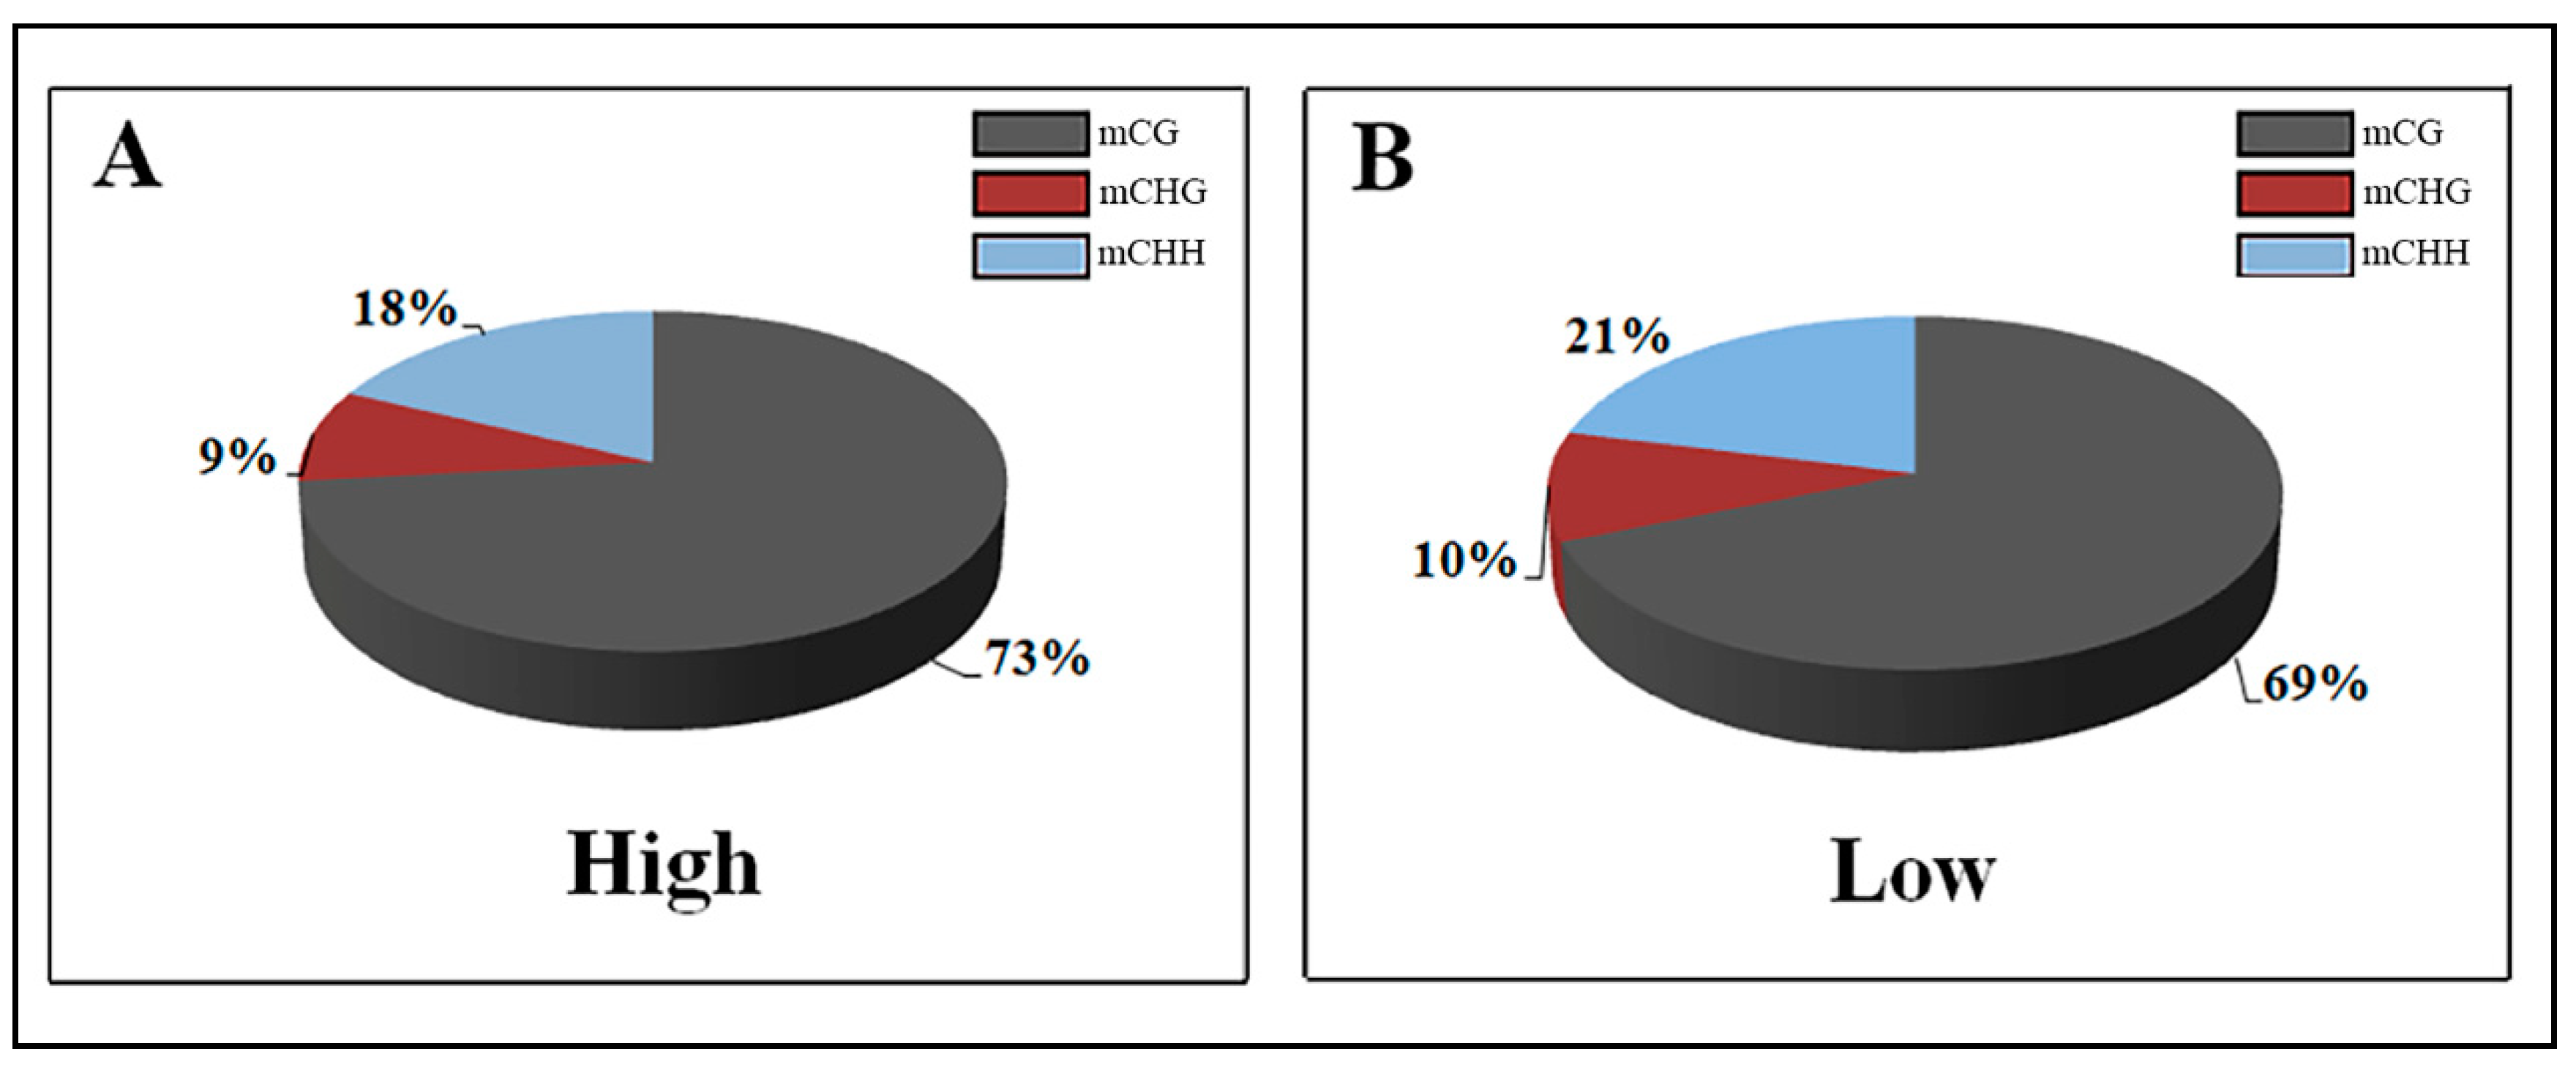
3.2. DNA Methylation Patterns
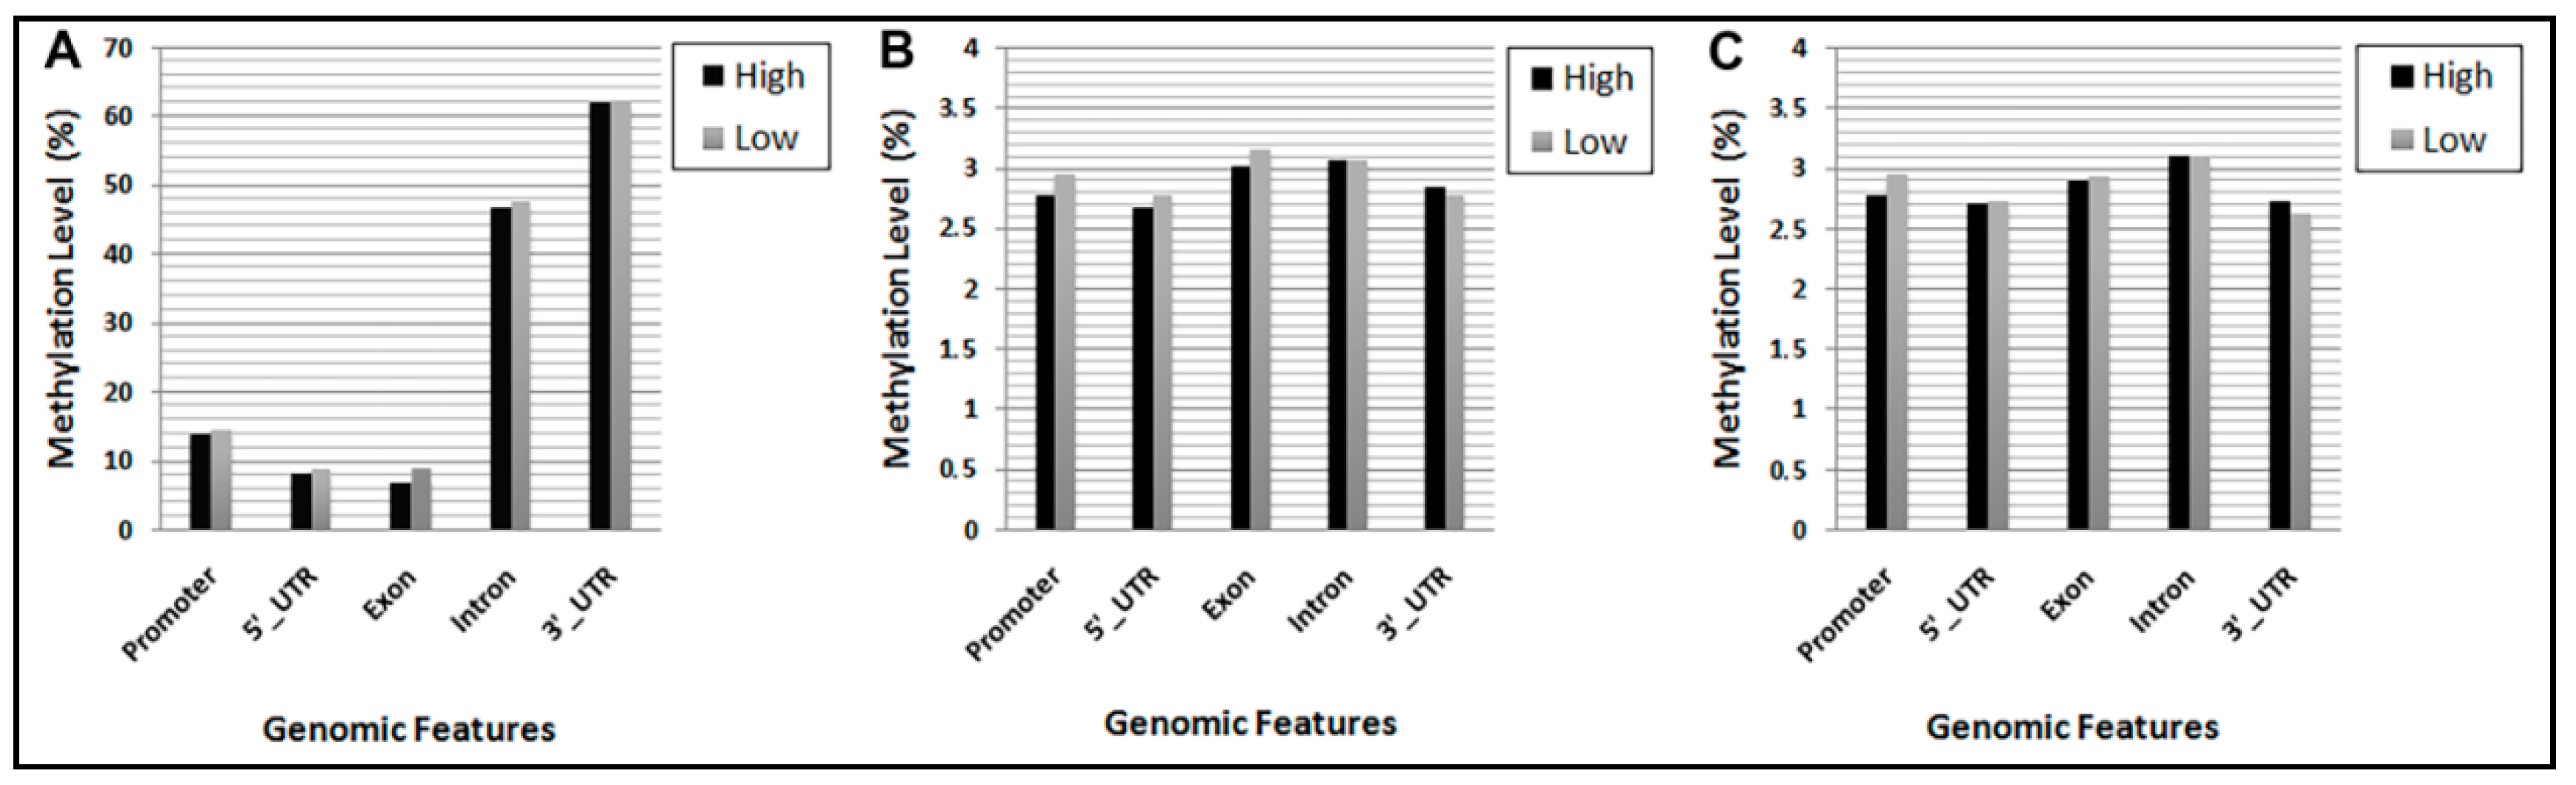
3.3. DNA Methylation Levels of Gene Features
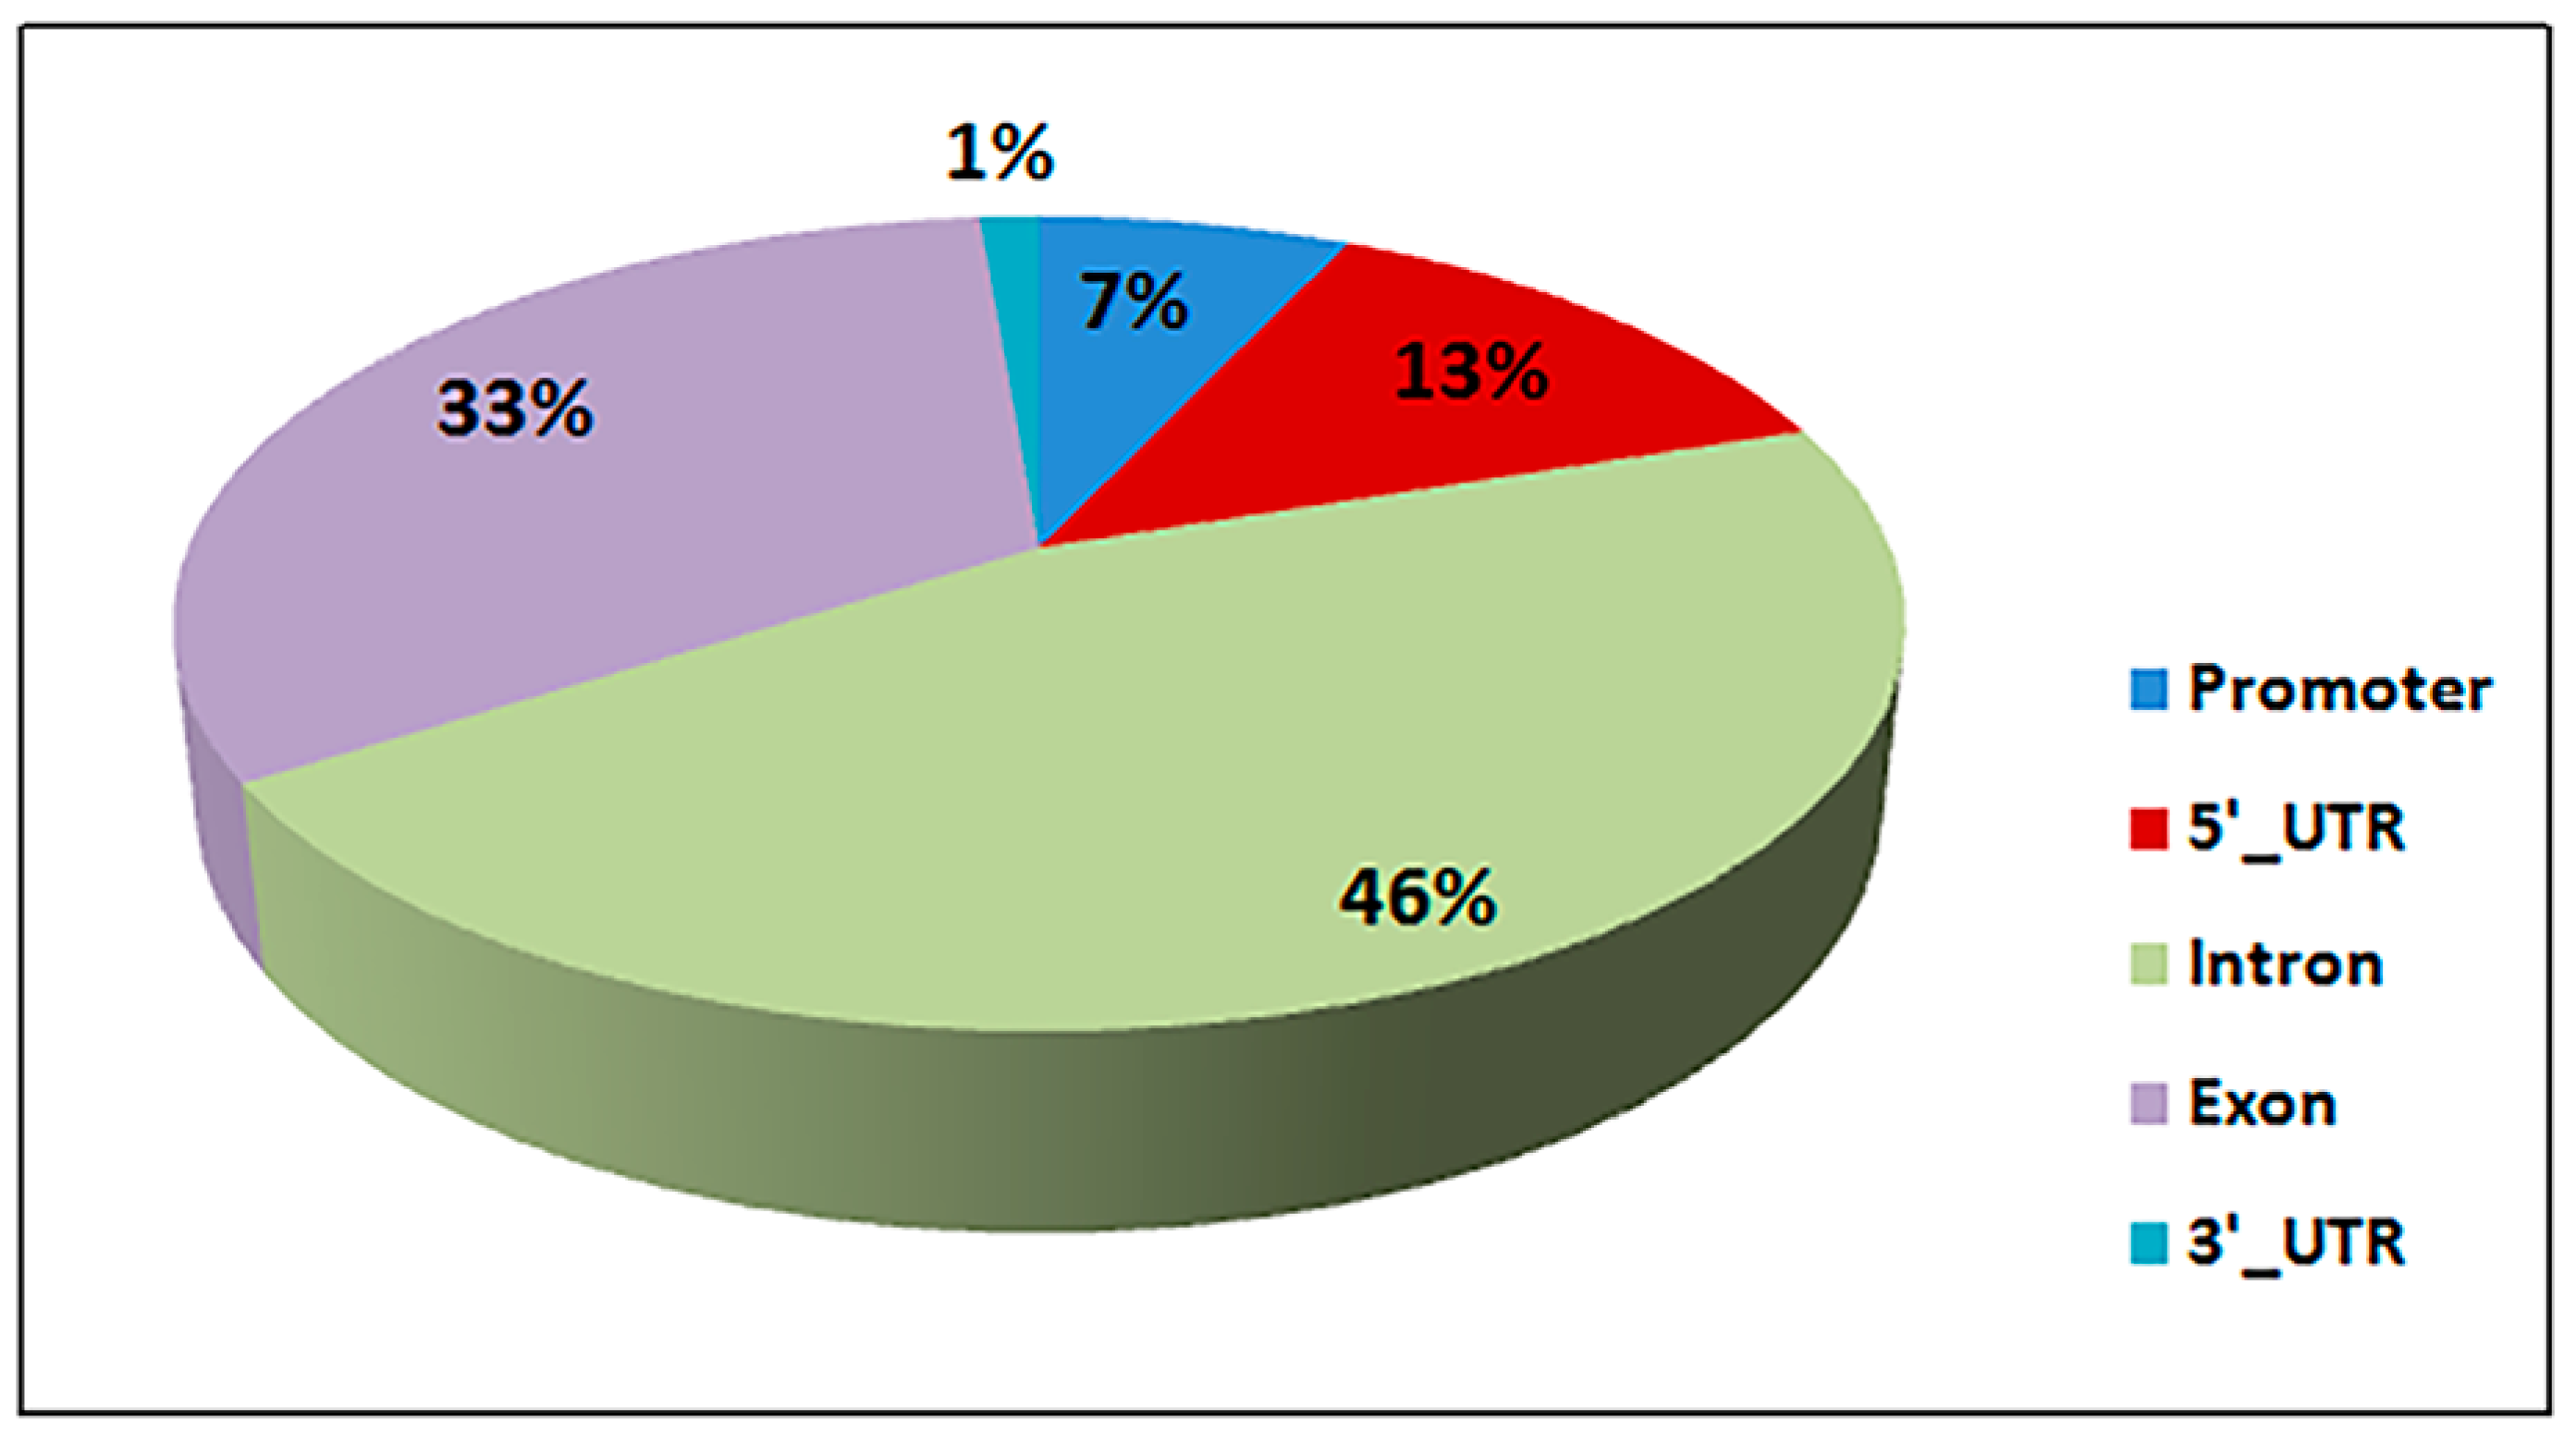
3.4. Differential Methylated Regions (DMR) and Genes (DMG)
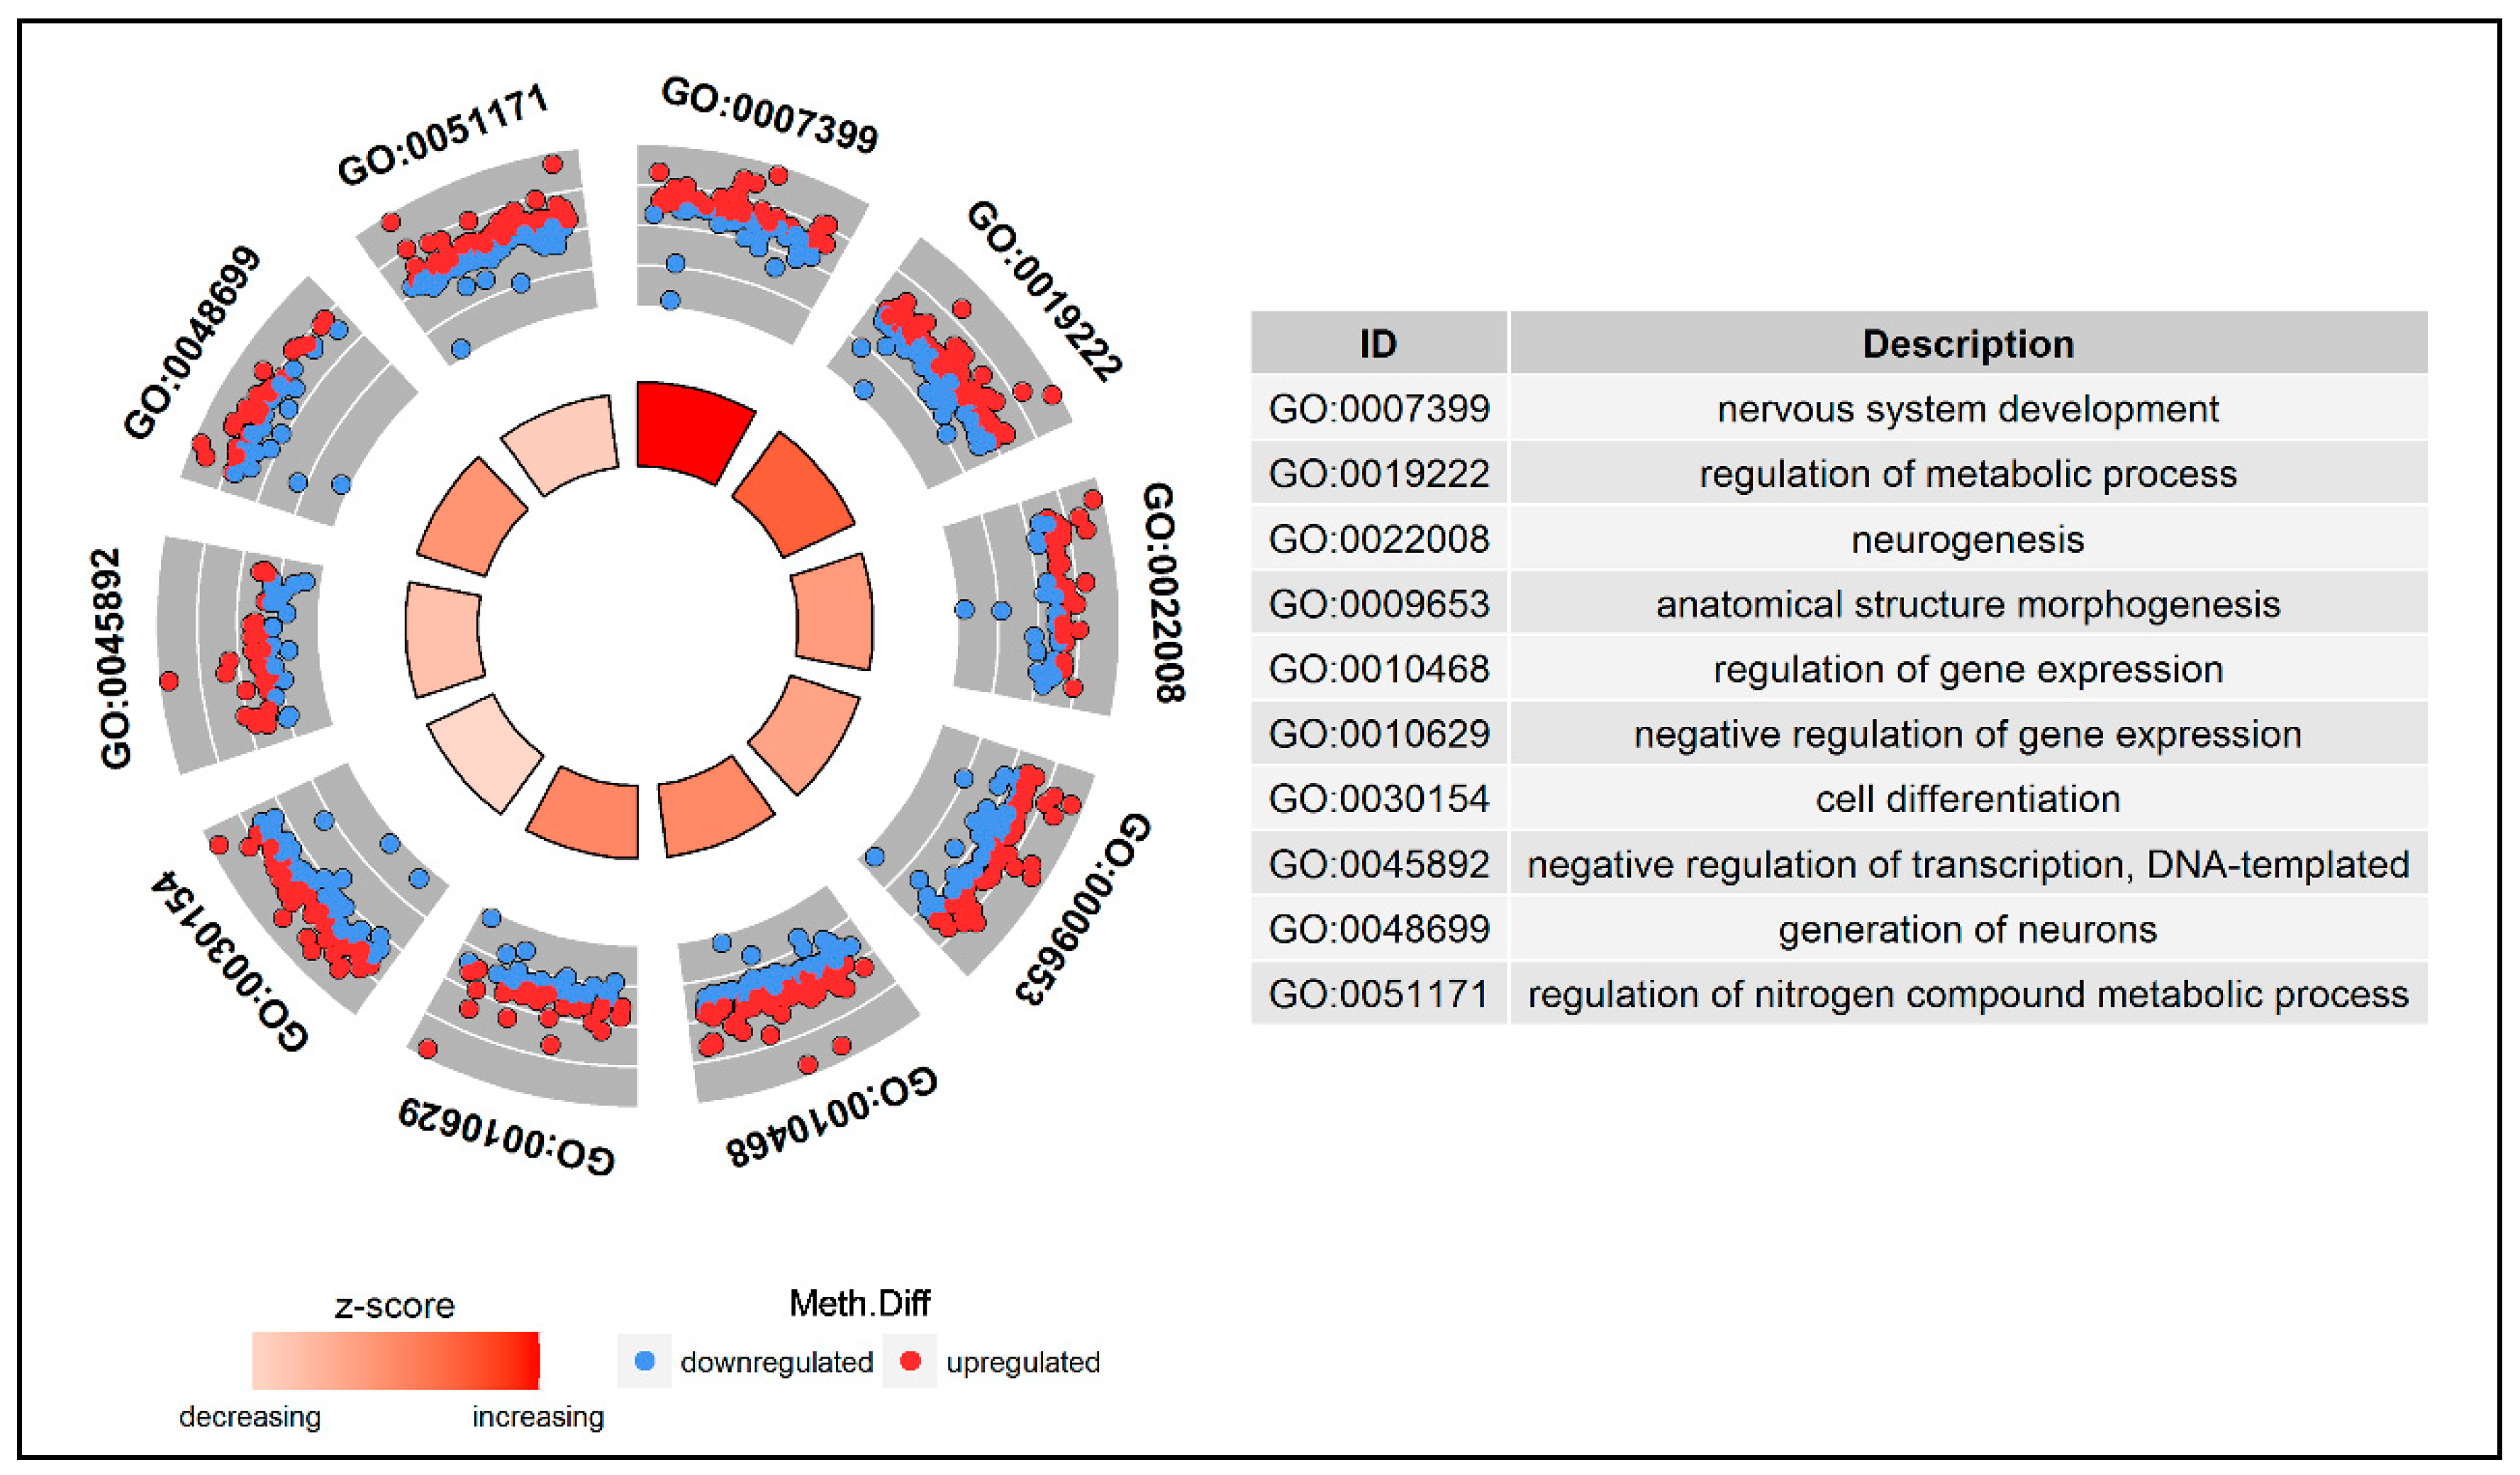
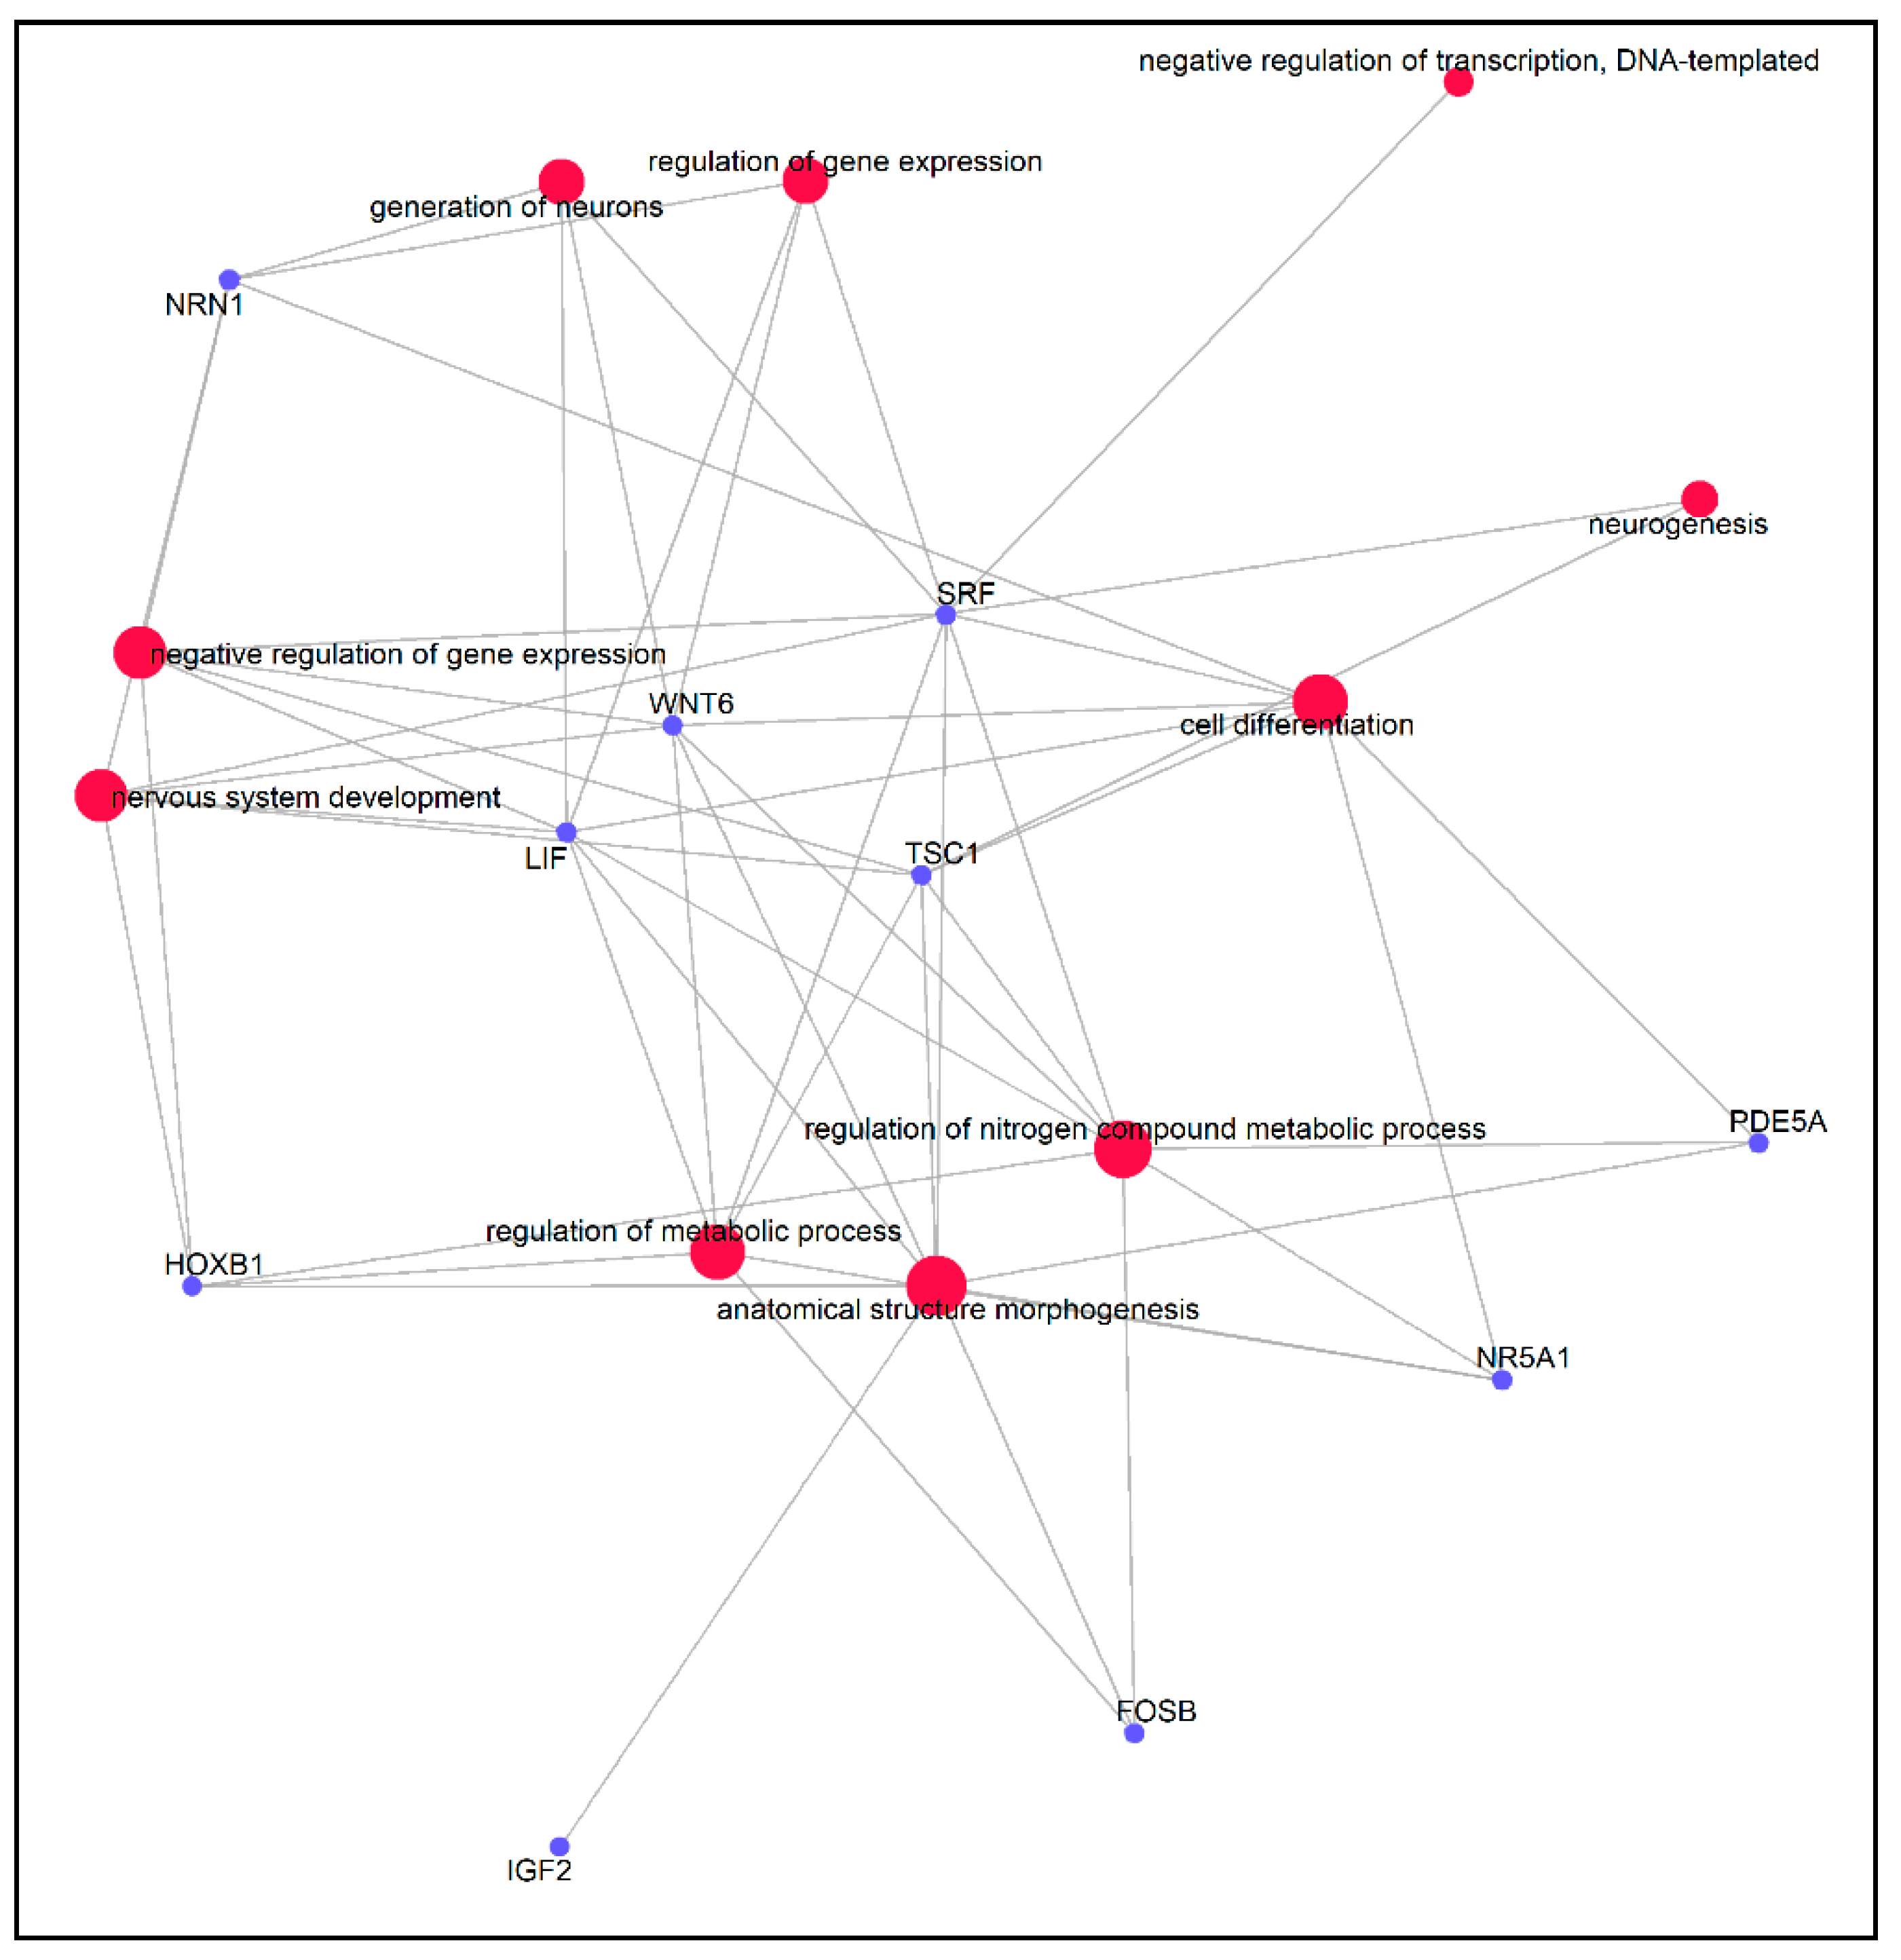
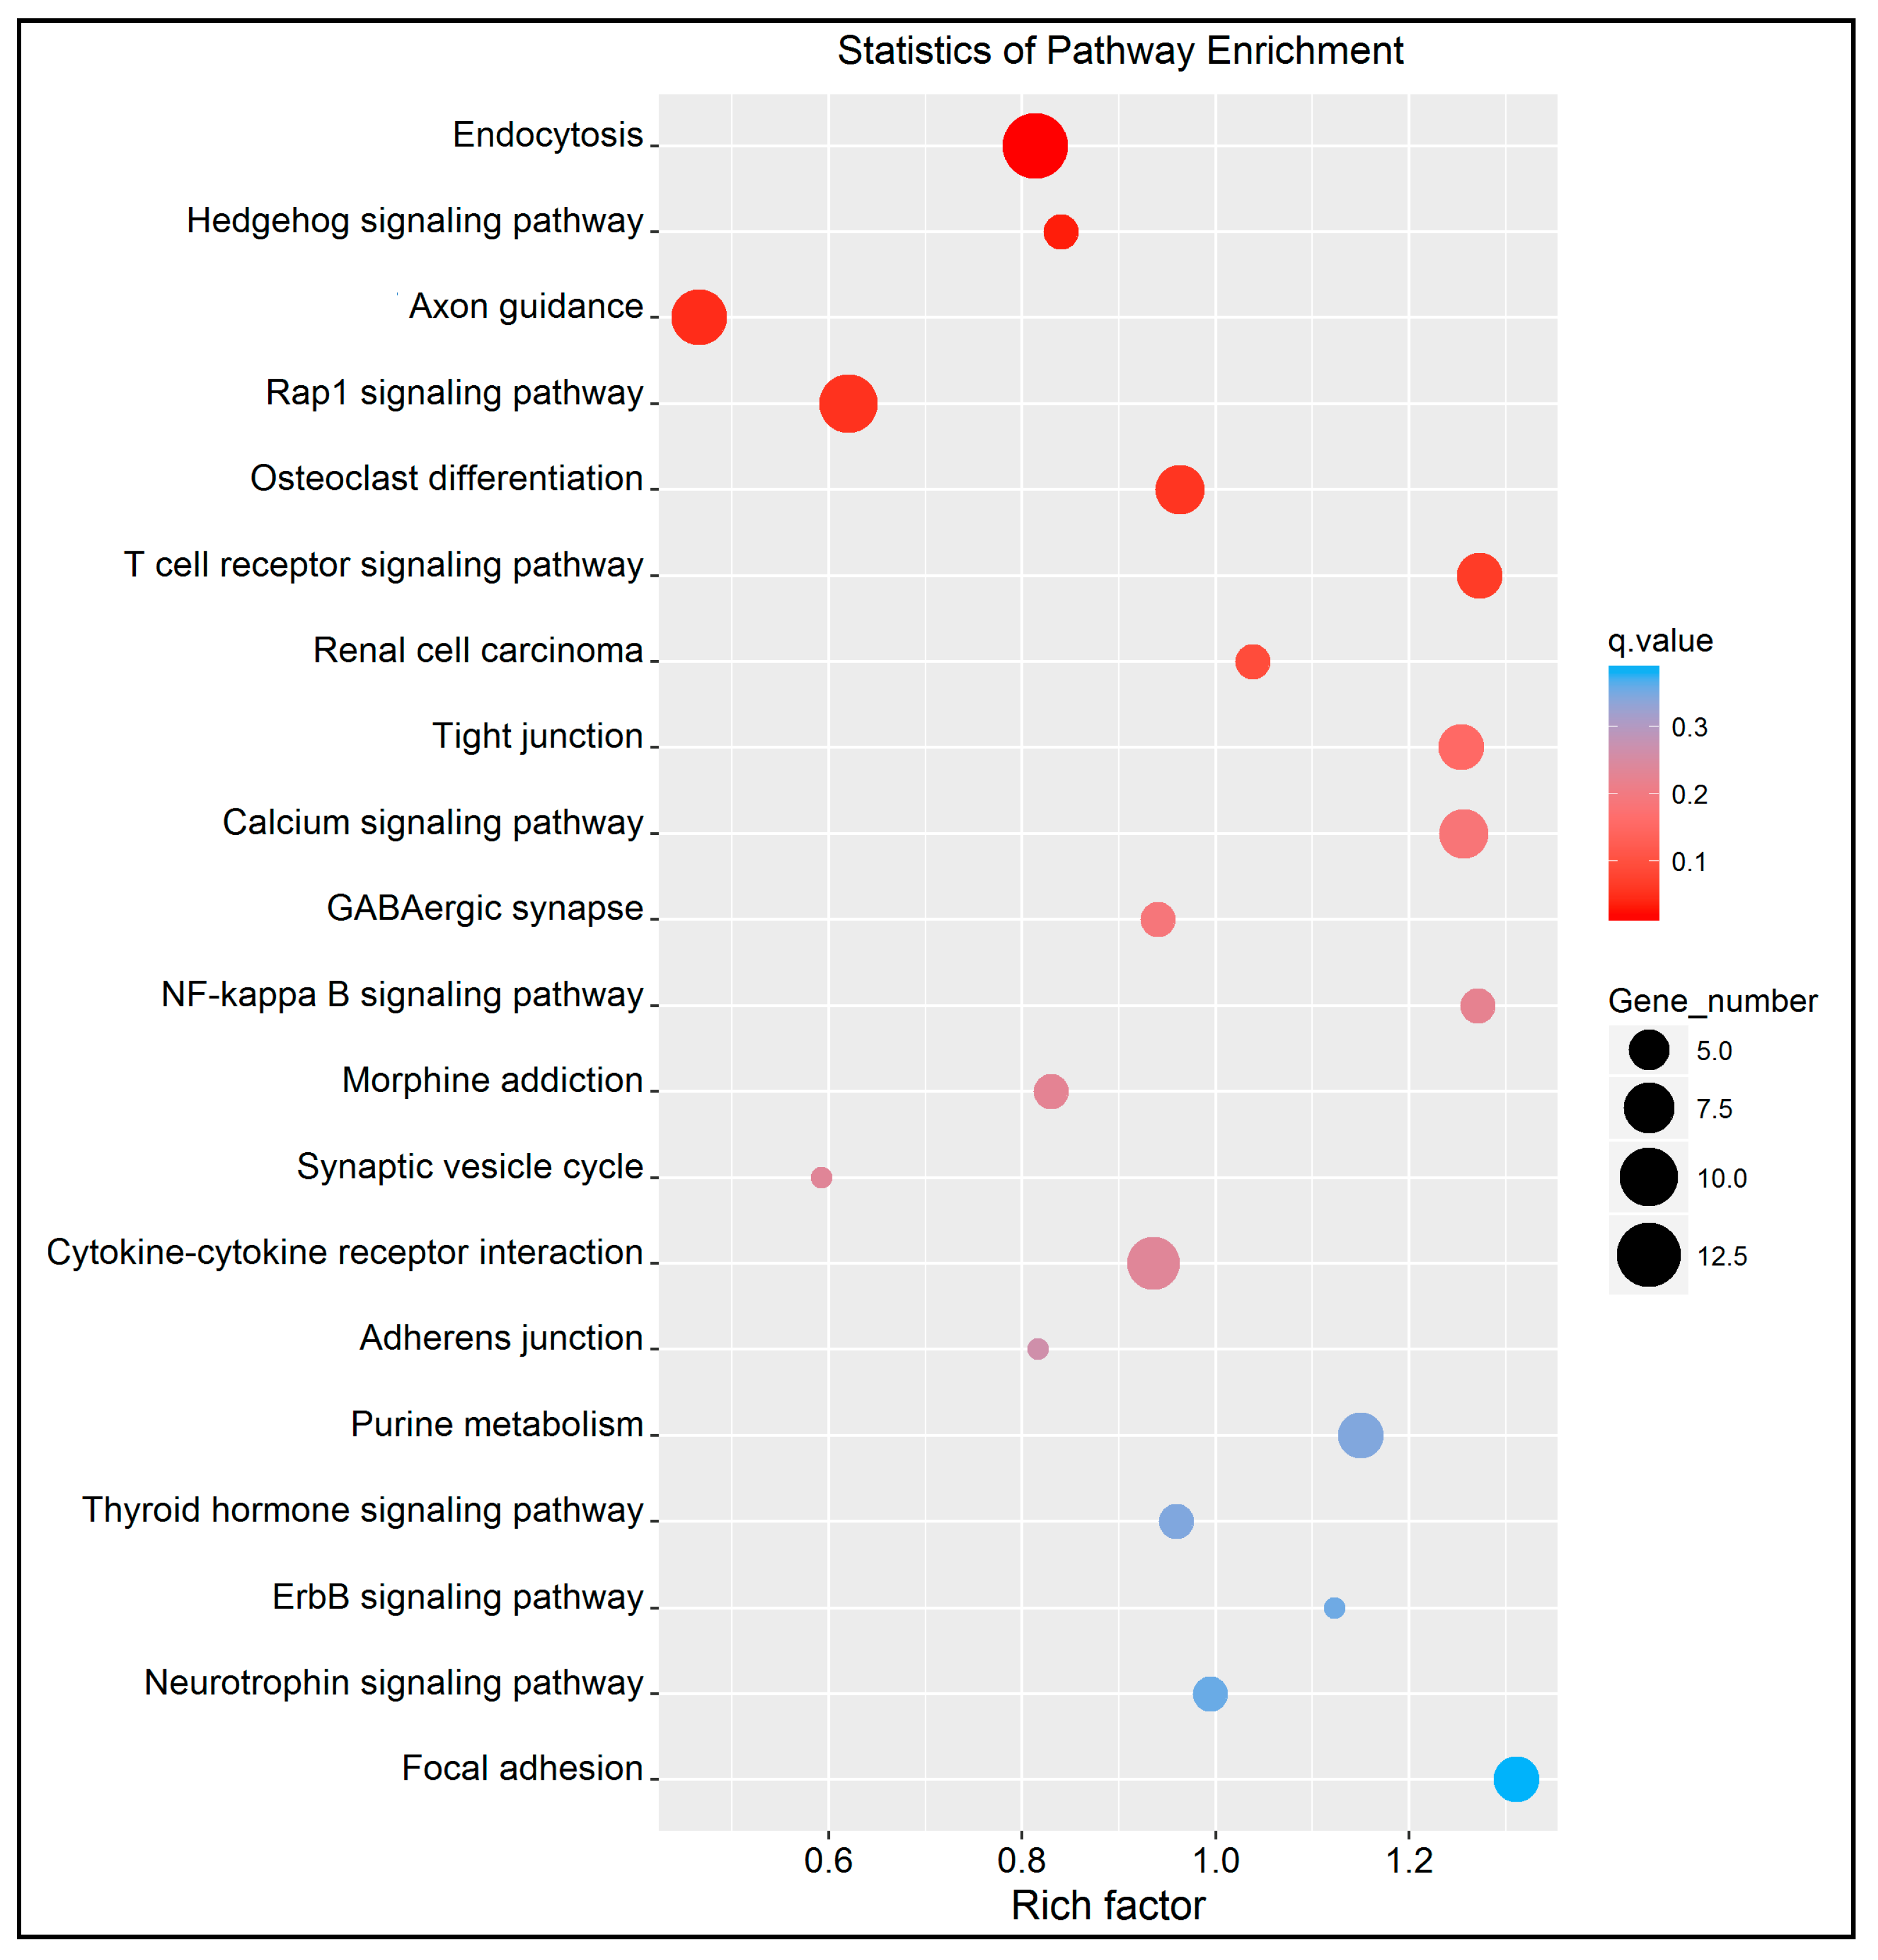
3.5. Functional Enrichment Analysis of the DMGs
3.6. Differentially Expressed Genes (DEGs)
4. Discussion
4.1. Key Differentially Methylated Genes Associated with Cellular Defense and Stress Response
4.2. Key Differentially Methylated Genes Associated with KEGG Pathways
5. Conclusions
Supplementary Materials
Author Contributions
Funding
Conflicts of Interest
References
- Kirovski, D.; Snoj, T.; Nedic, S.; Nedic, D.; Cebulj-Kadunc, N.; Kobal, S. Non-invasive methods for detecting chronic stress in dairy cows. In Proceedings of the First Dairy Care Conference, Copenhagen, Denmark, 22–23 August 2014; p. 46. [Google Scholar]
- Pelt, A.C. Glucocorticoids: Effects, Action Mechanisms, and Therapeutic Uses; Nova Science: Hauppauge, NY, USA, 2011; ISBN 978-1617287589. [Google Scholar]
- Rhen, T.; Cidlowski, J.A. Antiinflammatory Action of Glucocorticoids—New Mechanisms for Old Drugs. N. Engl. J. Med. 2005, 353, 1711–1723. [Google Scholar] [CrossRef] [PubMed] [Green Version]
- Pazirandeh, A.; Xue, Y.; Prestegaard, T.; Jondal, M.; Okret, S. Effects of altered glucocorticoid sensitivity in the T-cell lineage on thymocyte and T-cell homeostasis. FASEB J. 2002, 16, 727–729. [Google Scholar] [CrossRef] [PubMed]
- Qaid, M.M.; Abdelrahman, M.M. Role of insulin and other related hormones in energy metabolism—A review. Cogent Food Agric. 2016, 2, 1267691. [Google Scholar] [CrossRef]
- Bertulat, S.; Fischer-Tenhagen, C.; Suthar, V.; Möstl, E.; Isaka, N.; Heuwieser, W. Measurement of fecal glucocorticoid metabolites and evaluation of udder characteristics to estimate stress after sudden dry-off in dairy cows with different milk yields. J. Dairy Sci. 2013, 96, 3774–3787. [Google Scholar] [CrossRef] [PubMed]
- Horst, R.; Jorgensen, N. Elevated Plasma Cortisol during Induced and Spontaneous Hypocalcemia in Ruminants. J. Dairy Sci. 1982, 65, 2332–2337. [Google Scholar] [CrossRef]
- Sgorlon, S.; Fanzago, M.; Guiatti, D.; Gabai, G.; Stradaioli, G.; Stefanon, B. Factors affecting milk cortisol in mid lactating dairy cows. BMC Vet. Res. 2015, 11, 259. [Google Scholar] [CrossRef] [Green Version]
- Bird, A.P. Perceptions of epigenetics. Nature 2007, 447, 396–398. [Google Scholar] [CrossRef]
- Goldberg, A.D.; Allis, C.D.; Bernstein, E. Epigenetics: A Landscape Takes Shape. Cell 2007, 128, 635–638. [Google Scholar] [CrossRef] [Green Version]
- Strahl, B.D.; Allis, C.D. The language of covalent histone modifications. Nature 2000, 403, 41–45. [Google Scholar] [CrossRef]
- Mitchell, G.; Amit, I.; Garber, M.; French, C.; Lin, M.F.; Feldser, D.; Huarte, M.; Zuk, O.; Carey, B.W.; Cassady, J.P.; et al. Chromatin signature reveals over a thousand highly conserved large non-coding RNAs in mammals. Nature 2009, 458, 223–227. [Google Scholar]
- Cosma, M.P.; Tanaka, T.; Nasmyth, K. Ordered Recruitment of Transcription and Chromatin Remodeling Factors to a Cell Cycle- and Developmentally Regulated Promoter. Cell 1999, 97, 299–311. [Google Scholar] [CrossRef] [Green Version]
- Feinberg, A.P.; Tycko, B. The history of cancer epigenetics. Nat. Rev. Cancer 2004, 4, 143–153. [Google Scholar] [CrossRef] [PubMed]
- Esteller, M. Epigenetics in Cancer. N. Engl. J. Med. 2008, 358, 1148–1159. [Google Scholar] [CrossRef] [PubMed]
- Laird, P.W. The power and the promise of DNA methylation markers. Nat. Rev. Cancer 2003, 3, 253–266. [Google Scholar] [CrossRef] [PubMed]
- Cowell, I.G.; Aucott, R.; Mahadevaiah, S.K.; Huskisson, N.; Bongiorni, S.; Prantera, G.; Fanti, L.; Pimpinelli, S.; Wu, R.; Gilbert, D.M.; et al. Heterochromatin, HP1 and methylation at lysine 9 of histone H3 in animals. Chromosoma 2002, 111, 22–36. [Google Scholar] [CrossRef]
- Kourmouli, N.; Jeppesen, P.; Mahadevhaiah, S.; Burgoyne, P.; Wu, R.; Gilbert, D.M.; Bongiorni, S.; Prantera, G.; Fanti, L.; Pimpinelli, S.; et al. Heterochromatin and tri-methylated lysine 20 of histone H4 in animals. J. Cell Sci. 2004, 117, 2491–2501. [Google Scholar] [CrossRef] [PubMed] [Green Version]
- Suzuki, M.M.; Bird, A.P. DNA methylation landscapes: Provocative insights from epigenomics. Nat. Rev. Genet. 2008, 9, 465–476. [Google Scholar] [CrossRef]
- Siddeek, B.; Mauduit, C.; Simeoni, U.; Benahmed, M. Sperm epigenome as a marker of environmental exposure and lifestyle, at the origin of diseases inheritance. Mutat. Res. 2018, 778, 38–44. [Google Scholar] [CrossRef]
- Feil, R.; Fraga, M.F. Epigenetics and the environment: Emerging patterns and implications. Nat. Rev. Genet. 2012, 13, 97–109. [Google Scholar] [CrossRef]
- Ma, B.; Wilker, E.H.; Willis-Owen, S.A.G.; Byun, H.-M.; Wong, K.C.C.; Motta, V.; Baccarelli, A.; Schwartz, J.; Cookson, W.O.C.M.; Khabbaz, K.; et al. Predicting DNA methylation level across human tissues. Nucleic Acids Res. 2014, 42, 3515–3528. [Google Scholar] [CrossRef]
- Pošćić, N.; Gabai, G.; Stefanon, B.; Da Dalt, L.; Sgorlon, S. Milk cortisol response to group relocation in lactating cows. J. Dairy Res. 2017, 84, 36–38. [Google Scholar] [CrossRef] [PubMed] [Green Version]
- Gabai, G.; Mollo, A.; Marinelli, L.; Badan, M.; Bono, G. Endocrine and Ovarian Responses to Prolonged Adrenal Stimulation at the Time of Induced Corpus Luteum Regression. Reprod. Domest. Anim. 2006, 41, 485–493. [Google Scholar] [CrossRef] [PubMed]
- Edmonson, A.; Lean, I.; Weaver, L.; Farver, T.; Webster, G. A Body Condition Scoring Chart for Holstein Dairy Cows. J. Dairy Sci. 1989, 72, 68–78. [Google Scholar] [CrossRef]
- Krueger, F.; Andrews, S.R. Bismark: A flexible aligner and methylation caller for Bisulfite-Seq applications. Bioinformatics 2011, 27, 1571–1572. [Google Scholar] [CrossRef] [PubMed]
- Langmead, B.; Salzberg, S. Fast gapped-read alignment with Bowtie 2. Nat. Methods 2012, 9, 357–359. [Google Scholar] [CrossRef] [PubMed] [Green Version]
- Akalin, A.; Kormaksson, M.; Li, S.; Garrett-Bakelman, F.E.; Figueroa, M.E.; Melnick, A.; Mason, C. methylKit: A comprehensive R package for the analysis of genome-wide DNA methylation profiles. Genome Biol. 2012, 13, R87. [Google Scholar] [CrossRef] [PubMed] [Green Version]
- Wang, H.-Q.; Tuominen, L.; Tsai, C.-J. SLIM: A sliding linear model for estimating the proportion of true null hypotheses in datasets with dependence structures. Bioinformatics 2010, 27, 225–231. [Google Scholar] [CrossRef] [Green Version]
- Yu, G.; Wang, L.-G.; Han, Y.; He, Q.-Y. clusterProfiler: An R Package for Comparing Biological Themes Among Gene Clusters. OMICS J. Integr. Biol. 2012, 16, 284–287. [Google Scholar] [CrossRef]
- Yu, G. Enrichplot: Visualization of Functional Enrichment Result, R Package Version 1.1.2. 2018. Available online: https://github.com/GuangchuangYu/enrichplot. (accessed on 24 July 2020).
- Shin, H.; Shannon, C.P.; Fishbane, N.; Ruan, J.; Zhou, M.; Balshaw, R.; Wilson-McManus, J.E.; Ng, R.T.; McManus, B.M.; Tebbutt, S.J. Variation in RNA-SeqTranscriptome Profiles of Peripheral Whole Blood from Healthy Individuals with and without Globin Depletion. PLoS ONE 2014, 9, e91041. [Google Scholar] [CrossRef]
- Dobin, A.; Davis, C.A.; Schlesinger, F.; Drenkow, J.; Zaleski, C.; Jha, S.; Batut, P.; Chaisson, M.; Gingeras, T.R. STAR: Ultrafast universal RNA-seq aligner. Bioinformatics 2012, 29, 15–21. [Google Scholar] [CrossRef]
- Liao, Y.; Smyth, G.K.; Shi, W. featureCounts: An efficient general purpose program for assigning sequence reads to genomic features. Bioinformatics 2013, 30, 923–930. [Google Scholar] [CrossRef] [PubMed] [Green Version]
- Love, M.I.; Huber, W.; Anders, S. Moderated estimation of fold change and dispersion for RNA-seq data with DESeq2. Genome Biol. 2014, 15, 31. [Google Scholar] [CrossRef] [PubMed] [Green Version]
- Benjamini, Y.; Hochberg, Y. Controlling the False Discovery Rate: A Practical and Powerful Approach to Multiple Testing. J. R. Stat. Soc. Ser. B (Methodol.) 1995, 57, 289–300. [Google Scholar] [CrossRef]
- Nagano, J.; Nagase, S.; Sudo, N.; Kubo, C. Psychosocial Stress, Personality, and the Severity of Chronic Hepatitis, C. Psychosomatics 2004, 45, 100–106. [Google Scholar] [CrossRef] [PubMed]
- Lyles, J.L.; Calvo-Lorenzo, M.S. BILL E. KUNKLE INTERDISCIPLINARY BEEF SYMPOSIUM: Practical developments in managing animal welfare in beef cattle: What does the future hold? J. Anim. Sci. 2014, 92, 5334–5344. [Google Scholar] [CrossRef] [Green Version]
- Heimbürge, S.; Kanitz, E.; Otten, W. The use of hair cortisol for the assessment of stress in animals. Gen. Comp. Endocrinol. 2018, 270, 10–17. [Google Scholar] [CrossRef]
- Palme, R.; Robia, C.H.; Messmann, S.; Hofer, J.; Möstl, E. Measurement of faecal cortisol metabolites in ruminants: A non-invasive parameter of adrenocortical function. Wien.Tierarztl. Monatsschr. 1999, 86, 237–241. [Google Scholar]
- Schwinn, A.-C.; Knight, C.H.; Bruckmaier, R.; Gross, J.J. Suitability of saliva cortisol as a biomarker for hypothalamic–pituitary–adrenal axis activation assessment, effects of feeding actions, and immunostimulatory challenges in dairy cows1. J. Anim. Sci. 2016, 94, 2357–2365. [Google Scholar] [CrossRef]
- Lefcourt, A.; Bitman, J.; Kahl, S.; Wood, D. Circadian and Ultradian Rhythms of Peripheral Cortisol Concentrations in Lactating Dairy Cows. J. Dairy Sci. 1993, 76, 2607–2612. [Google Scholar] [CrossRef]
- Shutt, D.; Fell, L. Comparison of Total and Free Cortisol in Bovine Serum and Milk or Colostrum. J. Dairy Sci. 1985, 68, 1832–1834. [Google Scholar] [CrossRef]
- Thinh, N.; Yoshida, C.; Long, S.; Yusuf, M.; Nakao, T. Adrenocortical Response in Cows after Intramuscular Injection of Long-Acting Adrenocorticotropic Hormone (Tetracosactide Acetate Zinc Suspension). Reprod. Domest. Anim. 2011, 46, 296–300. [Google Scholar] [CrossRef]
- Fukasawa, M.; Tsukada, H.; Kosako, T.; Yamada, A. Effect of lactation stage, season and parity on milk cortisol concentration in Holstein cows. Livest. Sci. 2008, 113, 280–284. [Google Scholar] [CrossRef]
- Waki, T.; Nakao, T.; Moriyoshi, M.; Kawata, K. A practical test of adrenocortical function in dairy cows: Cortisol levels in defatted milk and its response to ACTH. J. Coll. Dairy. 1987, 12, 231–243. [Google Scholar]
- Verkerk, G.A.; Phipps, A.M.; Carragher, J.F.; Matthews, L.R.; Stelwagen, K. Characterization of milk cortisol concentrations as a measure of short-term stress responses in lactating dairy cows. Anim. Welf. 1998, 7, 77–86. [Google Scholar]
- Colitti, M.; Sgorlon, S.; Licastro, D.; Stefanon, B. Differential expression of miRNAs in milk exosomes of cows subjected to group relocation. Res. Vet. Sci. 2019, 122, 148–155. [Google Scholar] [CrossRef] [PubMed]
- Stachowicz, M.; Lebiedzińska, A. The effect of diet components on the level of cortisol. Eur. Food Res. Technol. 2016, 242, 2001–2009. [Google Scholar] [CrossRef] [Green Version]
- Gladkevich, A.; Kauffman, H.F.; Korf, J. Lymphocytes as a neural probe: Potential for studying psychiatric disorders. Prog. Neuropsychopharmacol. Biol. Psychiatry 2004, 28, 559–576. [Google Scholar] [CrossRef]
- Braun, P.R.; Han, S.; Hing, B.; Nagahama, Y.; Gaul, L.N.; Heinzman, J.T.; Grossbach, A.J.; Close, L.; Dlouhy, B.J.; Howard, M.A.; et al. Genome-wide DNA methylation comparison between live human brain and peripheral tissues within individuals. Transl. Psychiatry 2019, 9, 1–10. [Google Scholar] [CrossRef] [Green Version]
- Ramamoorthy, S.; Cidlowski, J.A. Corticosteroids. Rheum. Dis. Clin. N. Am. 2016, 42, 15–31. [Google Scholar] [CrossRef] [Green Version]
- Bancos, I.; Hazeldine, J.; Chortis, V.; Hampson, P.; Taylor, A.E.; Lord, J.M.; Arlt, W. Primary adrenal insufficiency is associated with impaired natural killer cell function: A potential link to increased mortality. Eur. J. Endocrinol. 2017, 176, 471–480. [Google Scholar] [CrossRef]
- Lorincz, M.C.; Dickerson, D.R.; Schmitt, M.; Groudine, M. Intragenic DNA methylation alters chromatin structure and elongation efficiency in mammalian cells. Nat. Struct. Mol. Biol. 2004, 11, 1068–1075. [Google Scholar] [CrossRef]
- Won, S.-Y.; Park, M.-H.; You, S.-T.; Choi, S.-W.; Kim, H.K.; McLean, C.; Bae, S.-C.; Kim, S.R.; Jin, B.-K.; Lee, K.H.; et al. Nigral dopaminergic PAK4 prevents neurodegeneration in rat models of Parkinsons disease. Sci. Transl. Med. 2016, 8, 367ra170. [Google Scholar] [CrossRef] [PubMed]
- Trovato, A.; Panelli, S.; Strozzi, F.; Cambulli, C.; Barbieri, I.; Martinelli, N.; Lombardi, G.; Capoferri, R.; Williams, J.L. Expression of genes involved in the T cell signalling pathway in circulating immune cells of cattle 24 months following oral challenge with Bovine Amyloidotic Spongiform Encephalopathy (BASE). BMC Vet. Res. 2015, 11, 1–9. [Google Scholar] [CrossRef] [PubMed] [Green Version]
- Summer, A.; Lora, I.; Formaggioni, P.; Gottardo, F. Impact of heat stress on milk and meat production. Anim. Front. 2018, 9, 39–46. [Google Scholar] [CrossRef] [PubMed]
- Skibiel, A.L.; Peñagaricano, F.; Amorín, R.; Ahmed, B.M.; Dahl, G.E.; LaPorta, J. In Utero Heat Stress Alters the Offspring Epigenome. Sci. Rep. 2018, 8, 14609. [Google Scholar] [CrossRef] [PubMed] [Green Version]
- Gems, D. Insulin/IGF signalling and ageing: Seeing the bigger picture. Curr. Opin. Genet. Dev. 2001, 11, 287–292. [Google Scholar] [CrossRef]
- Kenyon, C. The genetics of ageing. Nature 2010, 464, 504–512. [Google Scholar] [CrossRef] [PubMed]
- Leroith, D.; Yakar, S. Mechanisms of Disease: Metabolic effects of growth hormone and insulin-like growth factor 1. Nat. Clin. Pr. Endocrinol. Metab. 2007, 3, 302–310. [Google Scholar] [CrossRef]
- Geng, X.-R.; Yang, G.; Li, M.; Song, J.-P.; Liu, Z.-Q.; Qiu, S.; Liu, Z.; Yang, P.-C. Insulin-like Growth Factor-2 Enhances Functions of Antigen (Ag)-specific Regulatory B Cells. J. Biol. Chem. 2014, 289, 17941–17950. [Google Scholar] [CrossRef] [Green Version]
- Chao, W.; D’Amore, P.A. IGF2: Epigenetic regulation and role in development and disease. Cytokine Growth Factor Rev. 2008, 19, 111–120. [Google Scholar] [CrossRef] [Green Version]
- Van Laere, A.-S.; Nguyen, M.; Braunschweig, M.; Nezer, C.; Collette, C.; Moreau, L.; Archibald, A.L.; Haley, C.S.; Buys, N.; Tally, M.; et al. A regulatory mutation in IGF2 causes a major QTL effect on muscle growth in the pig. Nature 2003, 425, 832–836. [Google Scholar] [CrossRef]
- Barroca, V.; Lewandowski, D.; Jaracz-Ros, A.; Hardouin, S.-N. Paternal Insulin-like Growth Factor 2 (Igf2) Regulates Stem Cell Activity During Adulthood. EBioMedicine 2016, 15, 150–162. [Google Scholar] [CrossRef] [PubMed] [Green Version]
- Vangeel, E.; Izzi, B.; Hompes, T.; Vansteelandt, K.; Lambrechts, D.; Freson, K.; Claes, S. DNA methylation in imprinted genesIGF2andGNASXLis associated with prenatal maternal stress. Genes Brain Behav. 2015, 14, 573–582. [Google Scholar] [CrossRef] [PubMed] [Green Version]
- Bland, M.L.; Jamieson, C.A.M.; Akana, S.F.; Bornstein, S.R.; Eisenhofer, G.; Dallman, M.F.; Ingraham, H.A. Haploinsufficiency of steroidogenic factor-1 in mice disrupts adrenal development leading to an impaired stress response. Proc. Natl. Acad. Sci. USA 2000, 97, 14488–14493. [Google Scholar] [CrossRef] [Green Version]
- Berton, O.; Covington, H.E., III; Ebner, K.; Tsankova, N.M.; Carle, T.L.; Ulery, P.; Bhonsle, A.; Barrot, M.; Krishnan, V.; Singewald, G.M.; et al. Induction of ΔFosB in the periaqueductal gray by stress promotes active coping responses. Neuron 2007, 55, 289–300. [Google Scholar] [CrossRef] [PubMed] [Green Version]
- Vialou, V.; Robison, A.J.; LaPlant, Q.C.; Iii, H.E.C.; Dietz, D.M.; Ohnishi, Y.N.; Mouzon, E.; Rush, A.J.; Watts, E.L.; Wallace, D.L.; et al. ΔFosB in brain reward circuits mediates resilience to stress and antidepressant responses. Nat. Neurosci. 2010, 13, 745–752. [Google Scholar] [CrossRef] [Green Version]
- Levine, A.A.; Guan, Z.; Barco, A.; Xu, S.; Kandel, E.R.; Schwartz, J.H. CREB-binding protein controls response to cocaine by acetylating histones at the fosB promoter in the mouse striatum. Proc. Natl. Acad. Sci. USA 2005, 102, 19186–19191. [Google Scholar] [CrossRef] [PubMed] [Green Version]
- Hao, Y.; Cui, Y.; Gu, X. Genome-wide DNA methylation profiles changes associated with constant heat stress in pigs as measured by bisulfite sequencing. Sci. Rep. 2016, 6, 27507. [Google Scholar] [CrossRef] [Green Version]
- Sun, X.; Dai, L.; Zhang, H.; He, X.; Hou, F.; He, W.; Tang, S.; Zhao, D. Neuritin Attenuates Neuronal Apoptosis Mediated by Endoplasmic Reticulum Stress In Vitro. Neurochem. Res. 2018, 43, 1383–1391. [Google Scholar] [CrossRef] [Green Version]
- Son, H.-T.; Banasr, M.; Choi, M.; Chae, S.Y.; Licznerski, P.; Lee, B.; Voleti, B.; Li, N.; Lepack, A.; Fournier, N.M.; et al. Neuritin produces antidepressant actions and blocks the neuronal and behavioral deficits caused by chronic stress. Proc. Natl. Acad. Sci. USA 2012, 109, 11378–11383. [Google Scholar] [CrossRef] [Green Version]
- Bettelli, E.; Carrier, Y.; Gao, W.; Korn, T.; Strom, T.B.; Oukka, M.; Weiner, H.L.; Kuchroo, V.K. Reciprocal developmental pathways for the generation of pathogenic effector TH17 and regulatory T cells. Nature 2006, 441, 235–238. [Google Scholar] [CrossRef]
- Barbi, J.; Vignali, P.; Yu, H.; Pan, F.; Pardoll, D. The Neurotrophic Factor Neuritin Maintains and Promotes the Function of Regulatory T cells in Autoimmunity and Cancer. J. Immunol. 2016, 196 (Suppl. 1), 58.12. [Google Scholar]
- Gonçalves, C.S.; De Castro, J.V.; Pojo, M.; Martins, E.P.; Queirós, S.; Chautard, E.; Taipa, R.; Pires, M.M.; Pinto, A.A.; Pardal, F.; et al. WNT6 is a novel oncogenic prognostic biomarker in human glioblastoma. Theranostics 2018, 8, 4805–4823. [Google Scholar] [CrossRef] [PubMed]
- Brandenburg, J.; Reiling, N. The Wnt Blows: On the Functional Role of Wnt Signaling in Mycobacterium tuberculosis Infection and Beyond. Front. Immunol. 2016, 7. [Google Scholar] [CrossRef] [PubMed] [Green Version]
- Ayroldi, E.; Cannarile, L.; Migliorati, G.; Nocentini, G.; Delfino, D.V.; Riccardi, C. Mechanisms of the anti-inflammatory effects of glucocorticoids: Genomic andnongenomic interference with MAPK signaling pathways. FASEB J. 2012, 26, 4805–4820. [Google Scholar] [CrossRef] [PubMed]
- Morgan, R.; Whiting, K. Differential expression of HOX genes upon activation of leukocyte sub-populations. Int. J. Hematol. 2008, 87, 246–249. [Google Scholar] [CrossRef] [PubMed] [Green Version]
- Garcia-Fernàndez, J. The genesis and evolution of homeobox gene clusters. Nat. Rev. Genet. 2005, 6, 881–892. [Google Scholar] [CrossRef]
- Bonzon-Kulichenko, E.; Schwudke, D.; Gallardo, N.; Moltó, E.; Fernández-Agulló, T.; Shevchenko, A.; Andrés, A. Central Leptin Regulates Total Ceramide Content and Sterol Regulatory Element Binding Protein-1C Proteolytic Maturation in Rat White Adipose Tissue. Endocrinology 2009, 150, 169–178. [Google Scholar] [CrossRef] [Green Version]
- Mesika, A.; Ben-Dor, S.; Laviad, E.L.; Futerman, A.H. A New Functional Motif in Hox Domain-containing Ceramide Synthases. J. Biol. Chem. 2007, 282, 27366–27373. [Google Scholar] [CrossRef] [Green Version]
- Hulea, L.; Nepveu, A. CUX1 transcription factors: From biochemical activities and cell-based assays to mouse models and human diseases. Gene 2012, 497, 18–26. [Google Scholar] [CrossRef]
- Sansregret, L.; Nepveu, A. The multiple roles of CUX1: Insights from mouse models and cell-based assays. Gene 2008, 412, 84–94. [Google Scholar] [CrossRef]
- Vadnais, C.; A Awan, A.; Harada, R.; Clermont, P.-L.; Leduy, L.; Bérubé, G.; Nepveu, A. Long-range transcriptional regulation by the p110 CUX1 homeodomain protein on the ENCODE array. BMC Genom. 2013, 14, 258. [Google Scholar] [CrossRef] [PubMed] [Green Version]
- Palazzo, E.; Kellett, M.; Cataisson, C.; Gormley, A.; Bible, P.W.; Pietroni, V.; Radoja, N.; Hwang, J.; Blumenberg, M.; Yuspa, S.H.; et al. The homeoprotein DLX3 and tumor suppressor p53 co-regulate cell cycle progression and squamous tumor growth. Oncogene 2015, 35, 3114–3124. [Google Scholar] [CrossRef] [PubMed] [Green Version]
- Radoja, N.; Guerrini, L.; Iacono, N.L.; Merlo, G.R.; Costanzo, A.; Weinberg, W.C.; La Mantia, G.; Morasso, M.I.; Calabrò, V. Homeobox gene Dlx3 is regulated by p63 during ectoderm development: Relevance in the pathogenesis of ectodermal dysplasias. Development 2007, 134, 13–18. [Google Scholar] [CrossRef] [PubMed] [Green Version]
- Mills, J.; Zarlenga, D.; Dyer, R. Bovine coronary region keratinocyte colony formation is supported by epidermal-dermal interactions. J. Dairy Sci. 2009, 92, 1913–1923. [Google Scholar] [CrossRef]
- Refaai, W.; Ducatelle, R.; Geldhof, P.; Mihi, B.; El-Shair, M.; Opsomer, G. Digital dermatitis in cattle is associated with an excessive innate immune response triggered by the keratinocytes. BMC Vet. Res. 2013, 9, 193. [Google Scholar] [CrossRef] [Green Version]
- Chen, Y.-W.; Das, M.; Oyarzabal, E.A.; Cheng, Q.; Plummer, N.W.; Smith, K.G.; Jones, G.K.; Malawsky, D.; Yakel, J.L.; Shih, Y.-Y.I.; et al. Genetic identification of a population of noradrenergic neurons implicated in attenuation of stress-related responses. Mol. Psychiatry 2018, 24, 710–725. [Google Scholar] [CrossRef]
- Lewis, M.T.; Ross, S.; Strickland, P.A.; Snyder, C.J.; Daniel, C.W. Regulated expression patterns of IRX-2, an Iroquois-class homeobox gene, in the human breast. Cell Tissue Res. 1999, 296, 549–554. [Google Scholar] [CrossRef]
- Star, E.N.; Zhu, M.; Shi, Z.; Liu, H.; Pashmforoush, M.; Sauve, Y.; Bruneau, B.G.; Chow, R.L. Regulation of retinal interneuron subtype identity by the Iroquois homeobox gene Irx6. Development 2012, 139, 4644–4655. [Google Scholar] [CrossRef] [Green Version]
- Miquelajauregui, A.; Sandoval-Schaefer, T.; Martínez-Armenta, M.; Perez-Martinez, L.; Cárabez, A.; Zhao, Y.; Heide, M.; Alvarez-Bolado, G.; Varela-Echavarria, A. LIM homeobox protein 5 (Lhx5) is essential for mamillary body development. Front. Neuroanat. 2015, 9. [Google Scholar] [CrossRef] [Green Version]
- Cepeda-Nieto, A.C.; Pfaff, S.L.; Varela-Echavarria, A. Homeodomain transcription factors in the development of subsets of hindbrain reticulospinal neurons. Mol. Cell. Neurosci. 2005, 28, 30–41. [Google Scholar] [CrossRef]
- Richetto, J.; Massart, R.; Weber-Stadlbauer, U.; Szyf, M.; Riva, M.A.; Meyer, U. Genome-wide DNA Methylation Changes in a Mouse Model of Infection-Mediated Neurodevelopmental Disorders. Biol. Psychiatry 2017, 81, 265–276. [Google Scholar] [CrossRef] [PubMed]
- Chen, Y.; Arsenault, R.; Napper, S.; Griebel, P.J. Models and Methods to Investigate Acute Stress Responses in Cattle. Animals 2015, 5, 1268–1295. [Google Scholar] [CrossRef] [PubMed]
- Morrow-Tesch, J.; Woollen, N.; Hahn, L. Response of gamma delta T-lymphocytes to heat stress in Bostaurus and Bosindicus crossbred cattle. J. Therm. Biol. 1996, 21, 101–108. [Google Scholar] [CrossRef]
- Won, S.-Y.; Park, J.-J.; Shin, E.-Y.; Kim, E.-G. PAK4 signaling in health and disease: Defining the PAK4–CREB axis. Exp. Mol. Med. 2019, 51, 1–9. [Google Scholar] [CrossRef] [Green Version]
- Hewitt, S.A.; Wamsteeker, J.I.; Kurz, E.U.; Bains, J.S. Altered chloride homeostasis removes synaptic inhibitory constraint of the stress axis. Nat. Neurosci. 2009, 12, 438–443. [Google Scholar] [CrossRef]
- Lerch, J.K.; Alexander, J.K.; Madalena, K.M.; Motti, D.; Quach, T.; Dhamija, A.; Zha, A.; Gensel, J.C.; Webster-Marketon, J.; Lemmon, V.P.; et al. Stress Increases Peripheral Axon Growth and Regeneration through Glucocorticoid Receptor-Dependent Transcriptional Programs. Eneuro 2017, 4. [Google Scholar] [CrossRef] [Green Version]
- Jie, F.; Yin, G.; Yang, W.; Yang, M.; Gao, S.; Lv, J.; Li, B. Stress in Regulation of GABA Amygdala System and Relevance to Neuropsychiatric Diseases. Front. Mol. Neurosci. 2018, 12. [Google Scholar] [CrossRef]
- Davis, M.C.; McColl, K.S.; Zhong, F.; Wang, Z.; Malone, M.H.; Distelhorst, C.W. Dexamethasone-induced Inositol 1,4,5-Trisphosphate Receptor Elevation in Murine Lymphoma Cells Is Not Required for Dexamethasone-mediated Calcium Elevation and Apoptosis. J. Biol. Chem. 2008, 283, 10357–10365. [Google Scholar] [CrossRef] [Green Version]
- Mehta, D.; Klengel, T.; Conneely, K.N.; Smith, A.K.; Altmann, A.; Pace, T.W.; Rex-Haffner, M.; Loeschner, A.; Gonik, M.; Mercer, K.B.; et al. Childhood maltreatment is associated with distinct genomic and epigenetic profiles in posttraumatic stress disorder. Proc. Natl. Acad. Sci. USA 2013, 110, 8302–8307. [Google Scholar] [CrossRef] [Green Version]


| Item | Low Cortisol | High Cortisol | ||||
|---|---|---|---|---|---|---|
| Mean | Sd | Mean | Sd | p Value | ||
| BCS | Score | 3.23 | 0.38 | 3.10 | 0.47 | 0.262 |
| Parity | n° | 1.70 | 0.95 | 2.10 | 0.88 | 0.170 |
| DIM | Days | 156.2 | 62.8 | 143.3 | 69.3 | 0.334 |
| Milk | Kg/d | 26.20 | 6.54 | 30.38 | 6.23 | 0.080 |
| Fat | % | 3.68 | 1.03 | 3.95 | 0.70 | 0.254 |
| Protein | % | 3.61 | 0.25 | 3.59 | 0.39 | 0.441 |
| Casein | % | 2.84 | 0.20 | 2.81 | 0.32 | 0.415 |
| Urea | mmol/L | 21.39 | 5.12 | 21.01 | 6.13 | 0.442 |
| SCC | Number | 133.50 | 89.09 | 153.40 | 110.02 | 0.331 |
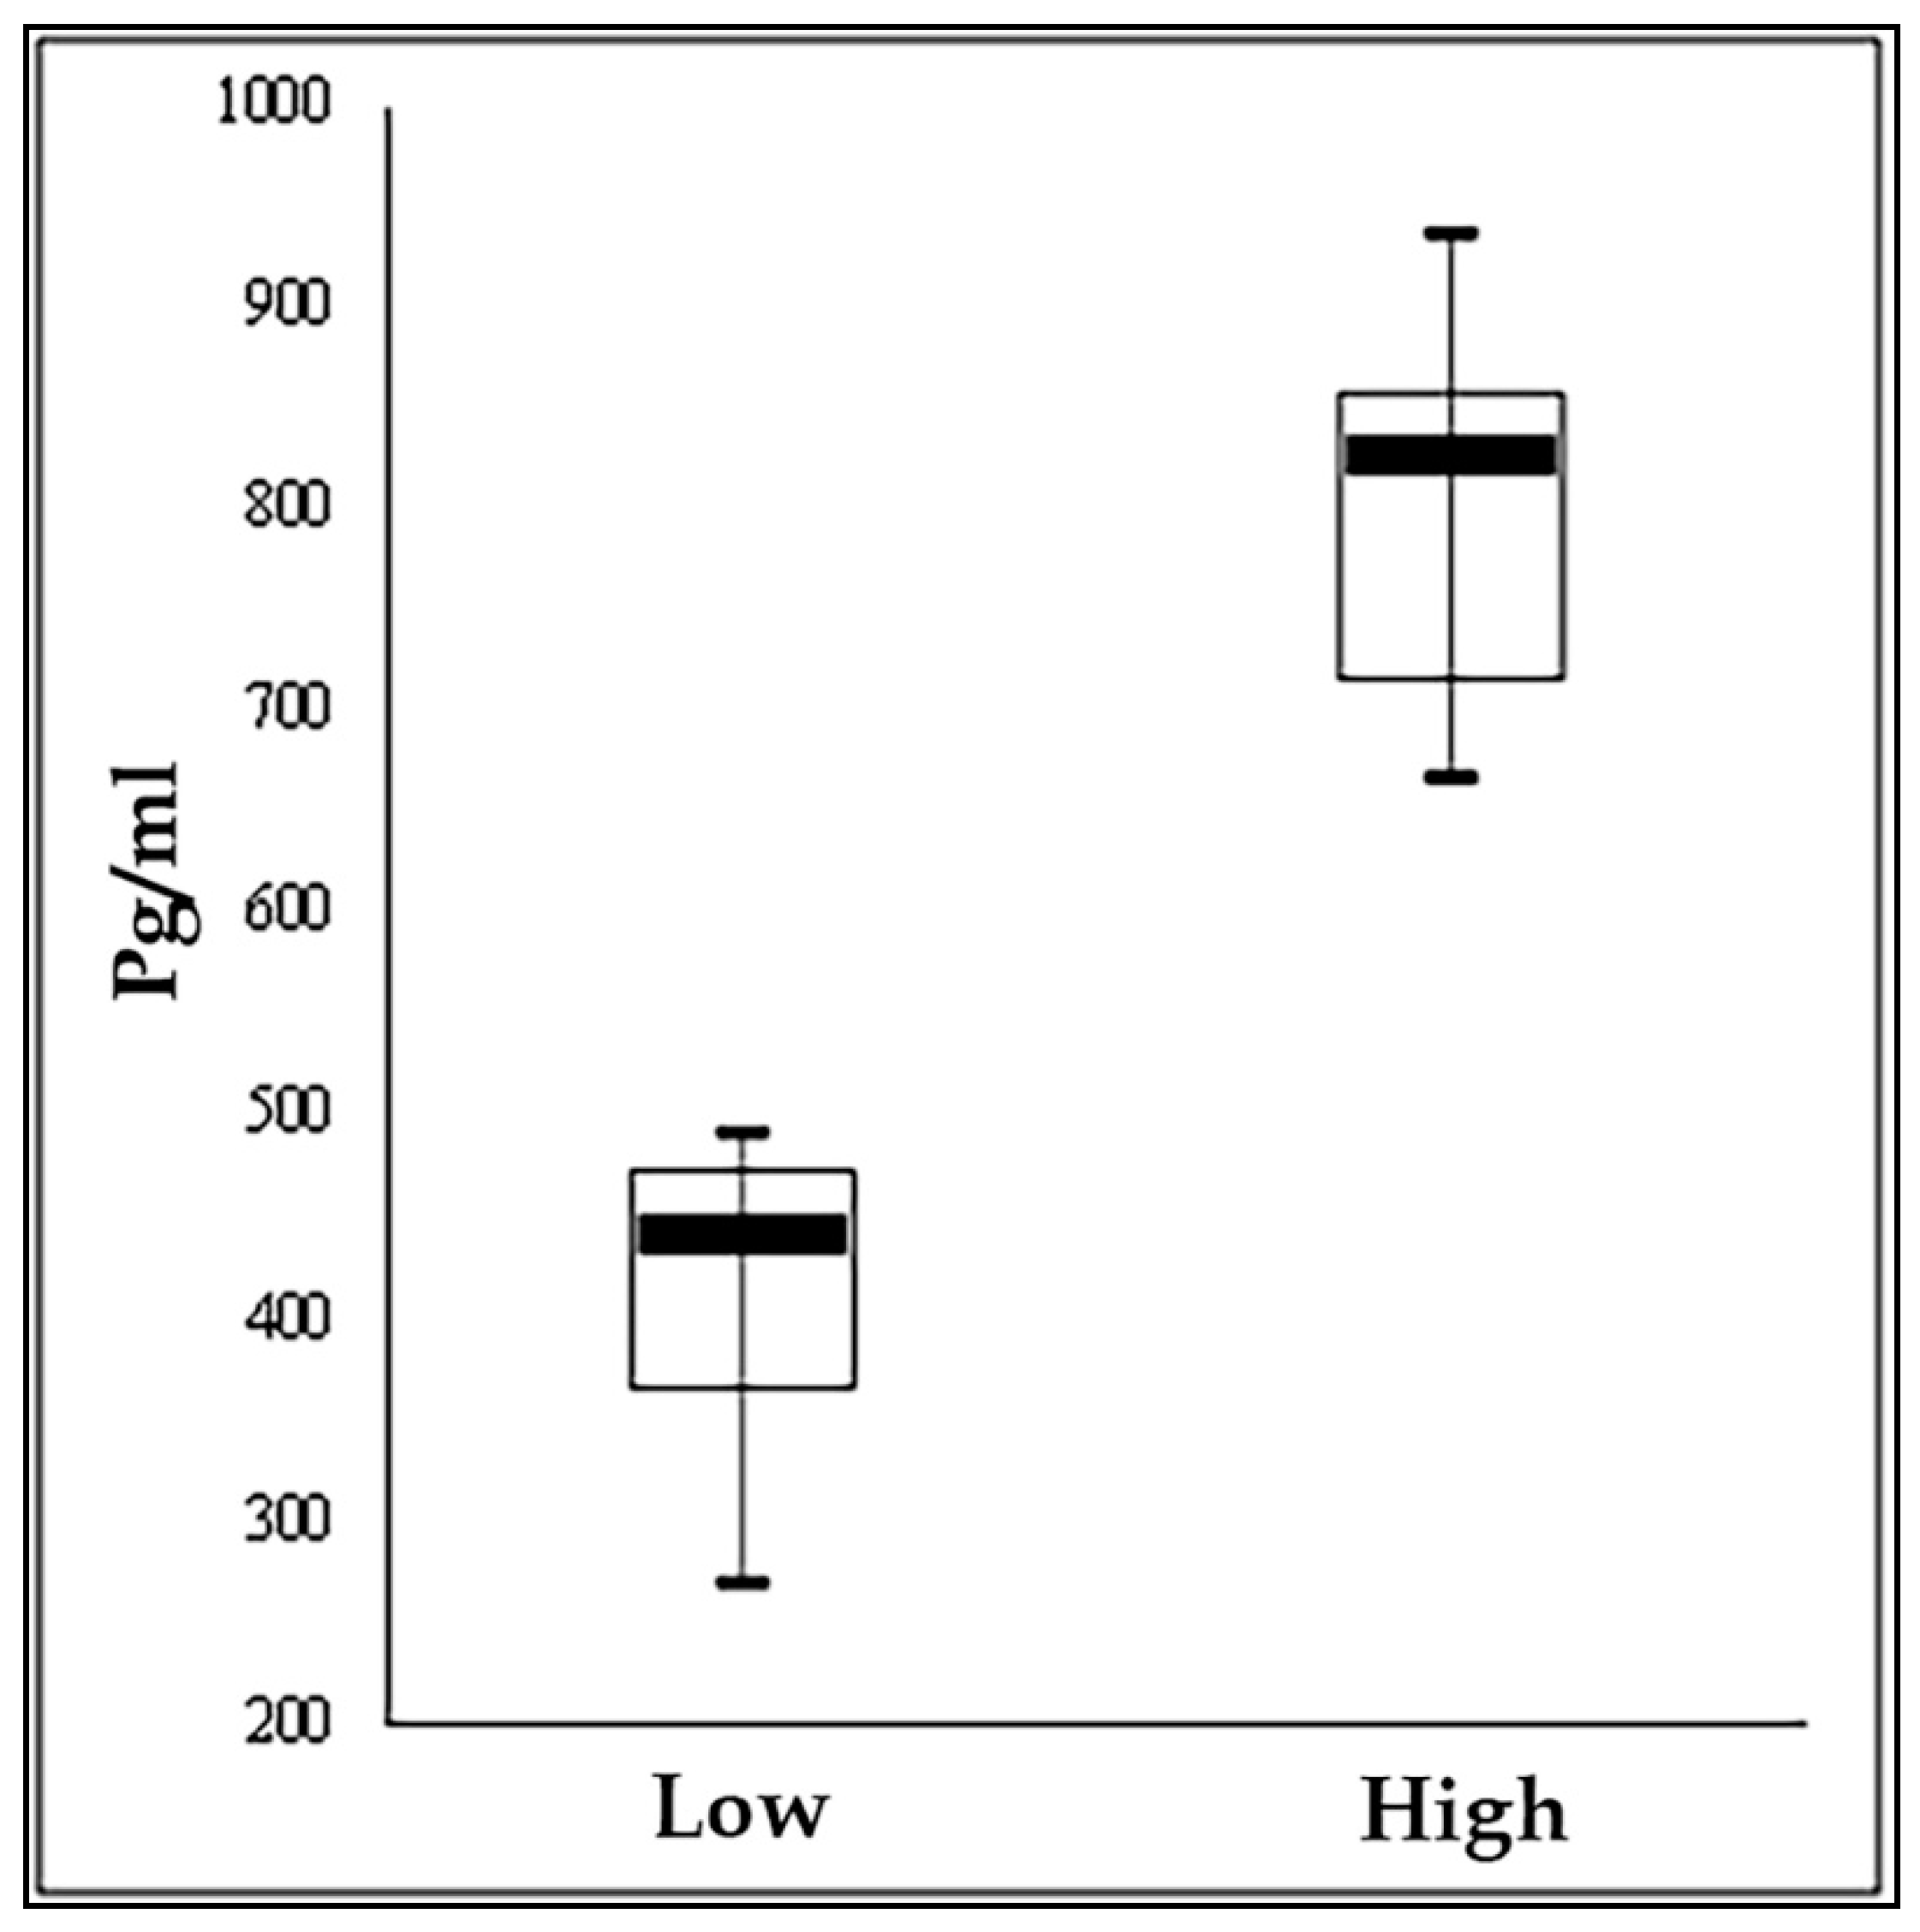
| Cortisol | pg/mL | 399.9 | 79.7 | 814.8 | 88.6 | 0.000 |
| Samples | Raw Reads | Clean Reads | Mapped Paired End Reads | Average Mapping Rate (%) |
|---|---|---|---|---|
| High | 278,881,124 | 139,639,195 | 36,779,144 | 35.15 |
| Low | 262,917,162 | 132,458,581 | 35,048,383 | 35.71 |
| Samples | mCpG(%) | mCHG(%) | mCHH (%) |
|---|---|---|---|
| High | 50.48 | 6.82 | 7.82 |
| Low | 53.58 | 7.11 | 8.14 |
| Gene ID | Gene Name | DMRs | Methylation Stat (High vs. Low) | UP/DOWN Regulation (High vs. Low) |
|---|---|---|---|---|
| ENSBTAG00000035744 | TRIM26 | exon | Hyper | Down |
| ENSBTAG00000021566 | PAX2 | exon, intron | Hyper | Up |
| ENSBTAG00000005765 | SYNGR1 | intron | Hyper | Up |
| ENSBTAG00000009803 | SNCB | utr3, exon, promoter | Hyper | Down |
| ENSBTAG00000008428 | UPP1 | intron | Hypo | Down |
| ENSBTAG00000008389 | HTRA1 | exon | Hypo | Up |
© 2020 by the authors. Licensee MDPI, Basel, Switzerland. This article is an open access article distributed under the terms and conditions of the Creative Commons Attribution (CC BY) license (http://creativecommons.org/licenses/by/4.0/).
Share and Cite
Del Corvo, M.; Bongiorni, S.; Stefanon, B.; Sgorlon, S.; Valentini, A.; Ajmone Marsan, P.; Chillemi, G. Genome-Wide DNA Methylation and Gene Expression Profiles in Cows Subjected to Different Stress Level as Assessed by Cortisol in Milk. Genes 2020, 11, 850. https://doi.org/10.3390/genes11080850
Del Corvo M, Bongiorni S, Stefanon B, Sgorlon S, Valentini A, Ajmone Marsan P, Chillemi G. Genome-Wide DNA Methylation and Gene Expression Profiles in Cows Subjected to Different Stress Level as Assessed by Cortisol in Milk. Genes. 2020; 11(8):850. https://doi.org/10.3390/genes11080850
Chicago/Turabian StyleDel Corvo, Marcello, Silvia Bongiorni, Bruno Stefanon, Sandy Sgorlon, Alessio Valentini, Paolo Ajmone Marsan, and Giovanni Chillemi. 2020. "Genome-Wide DNA Methylation and Gene Expression Profiles in Cows Subjected to Different Stress Level as Assessed by Cortisol in Milk" Genes 11, no. 8: 850. https://doi.org/10.3390/genes11080850