Gene Expression Profile in Similar Tissues Using Transcriptome Sequencing Data of Whole-Body Horse Skeletal Muscle

 , ,
, ,
Abstract
:1. Introduction
2. Materials and Methods
2.1. Ethics Statements
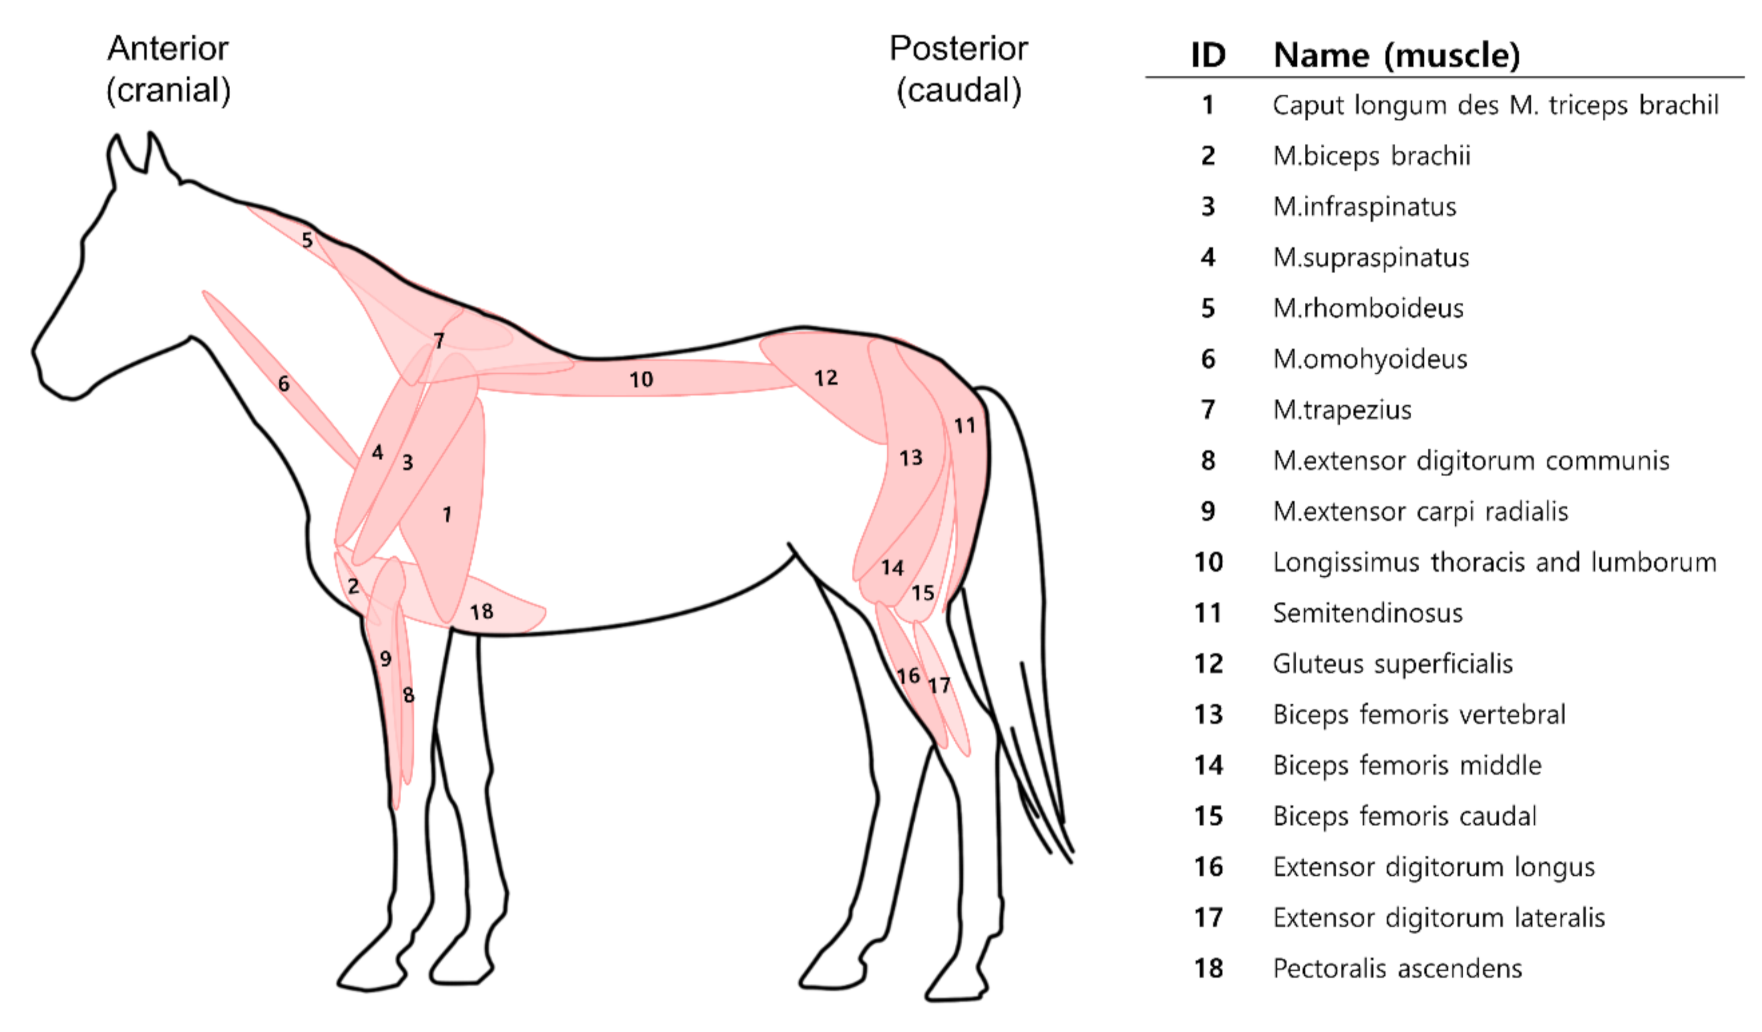
2.2. Sample Collection
2.3. RNA Sequencing
2.4. Data Processing
2.5. Differential Expression Analysis
2.6. IPA Analysis
2.7. Gene Ontology
3. Results
3.1. Read Alignments and Results
3.2. Differential Expression Analysis
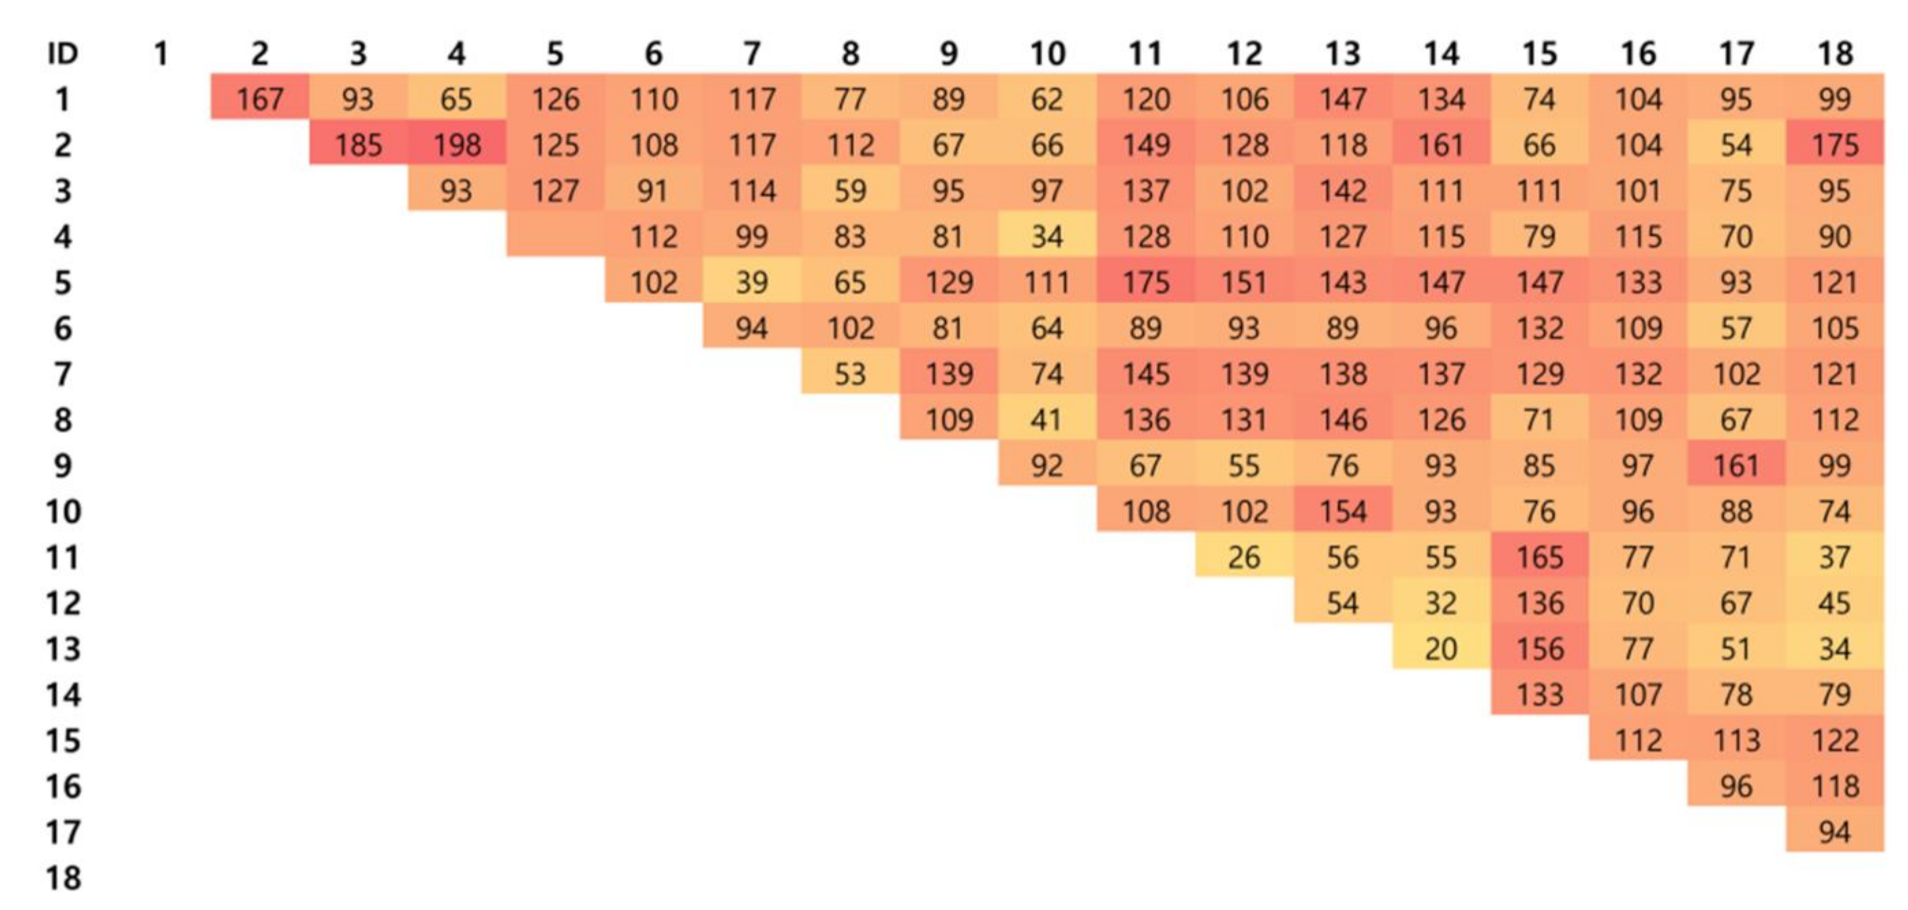
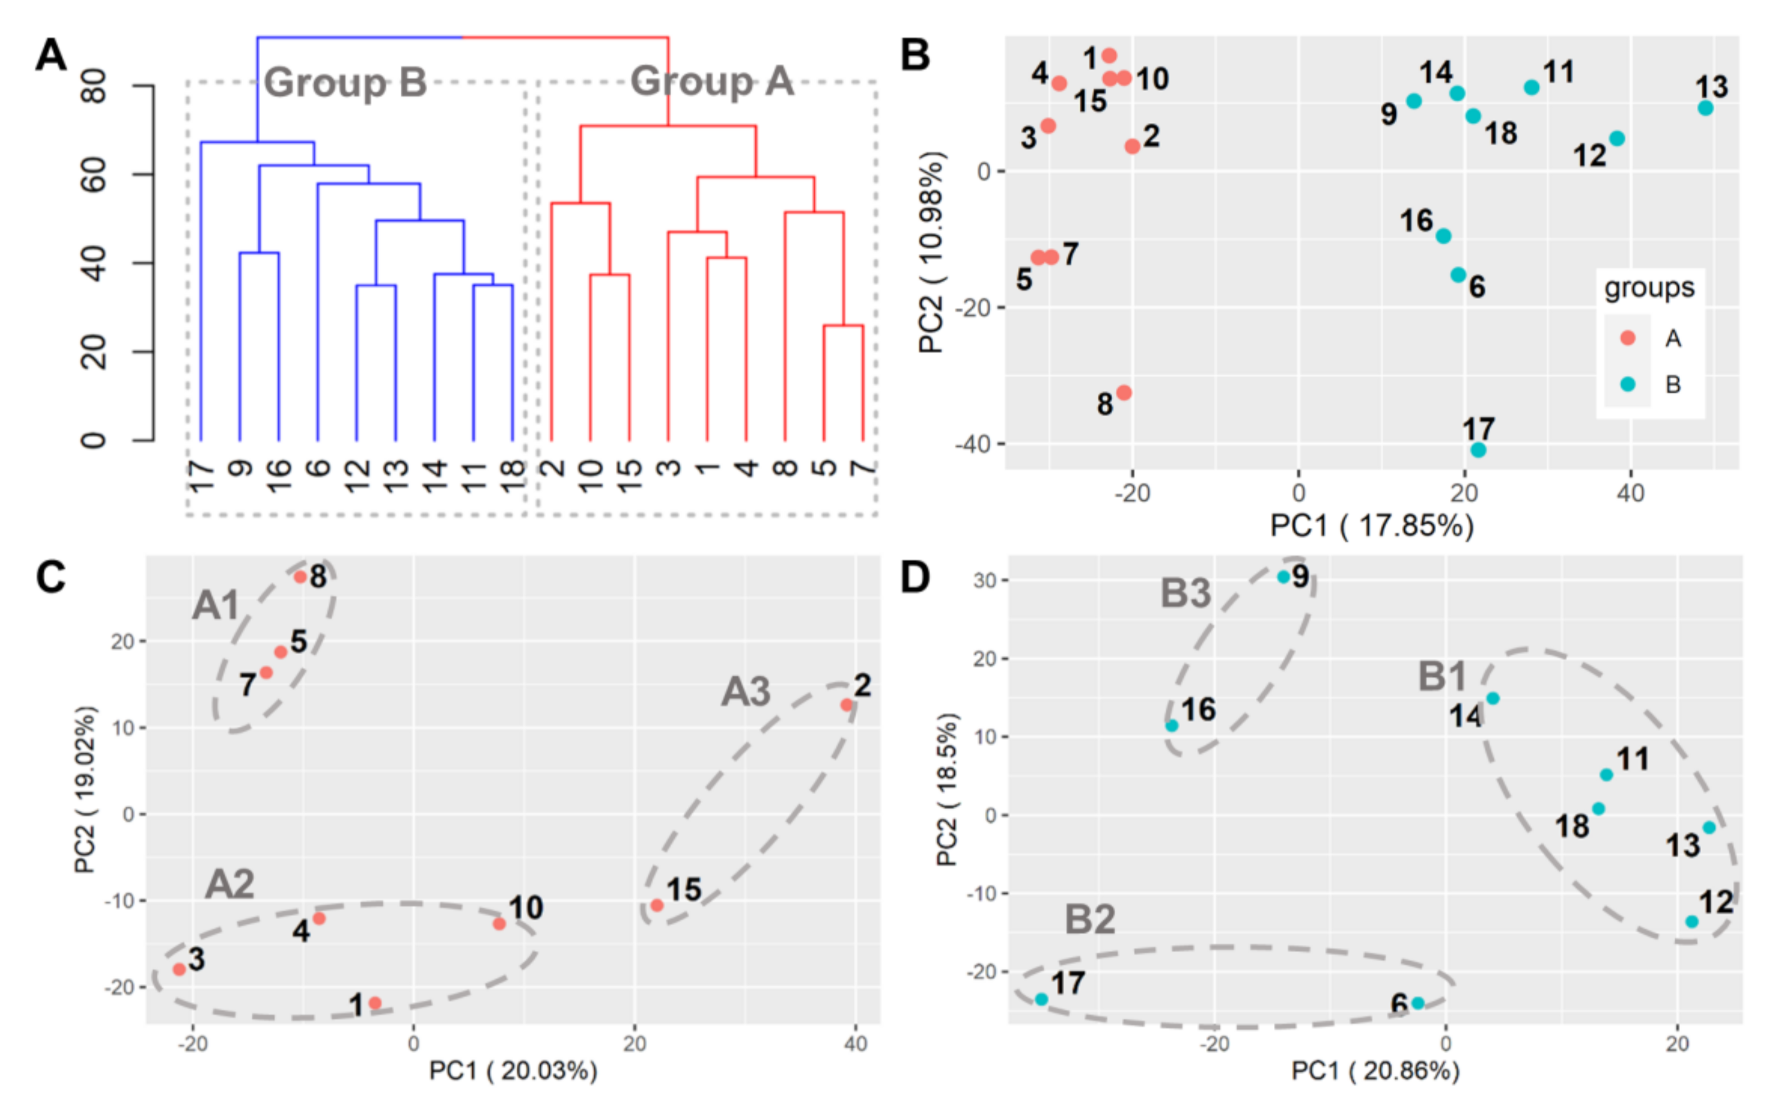
3.2.1. Classification
3.2.2. Comparison of A vs. B
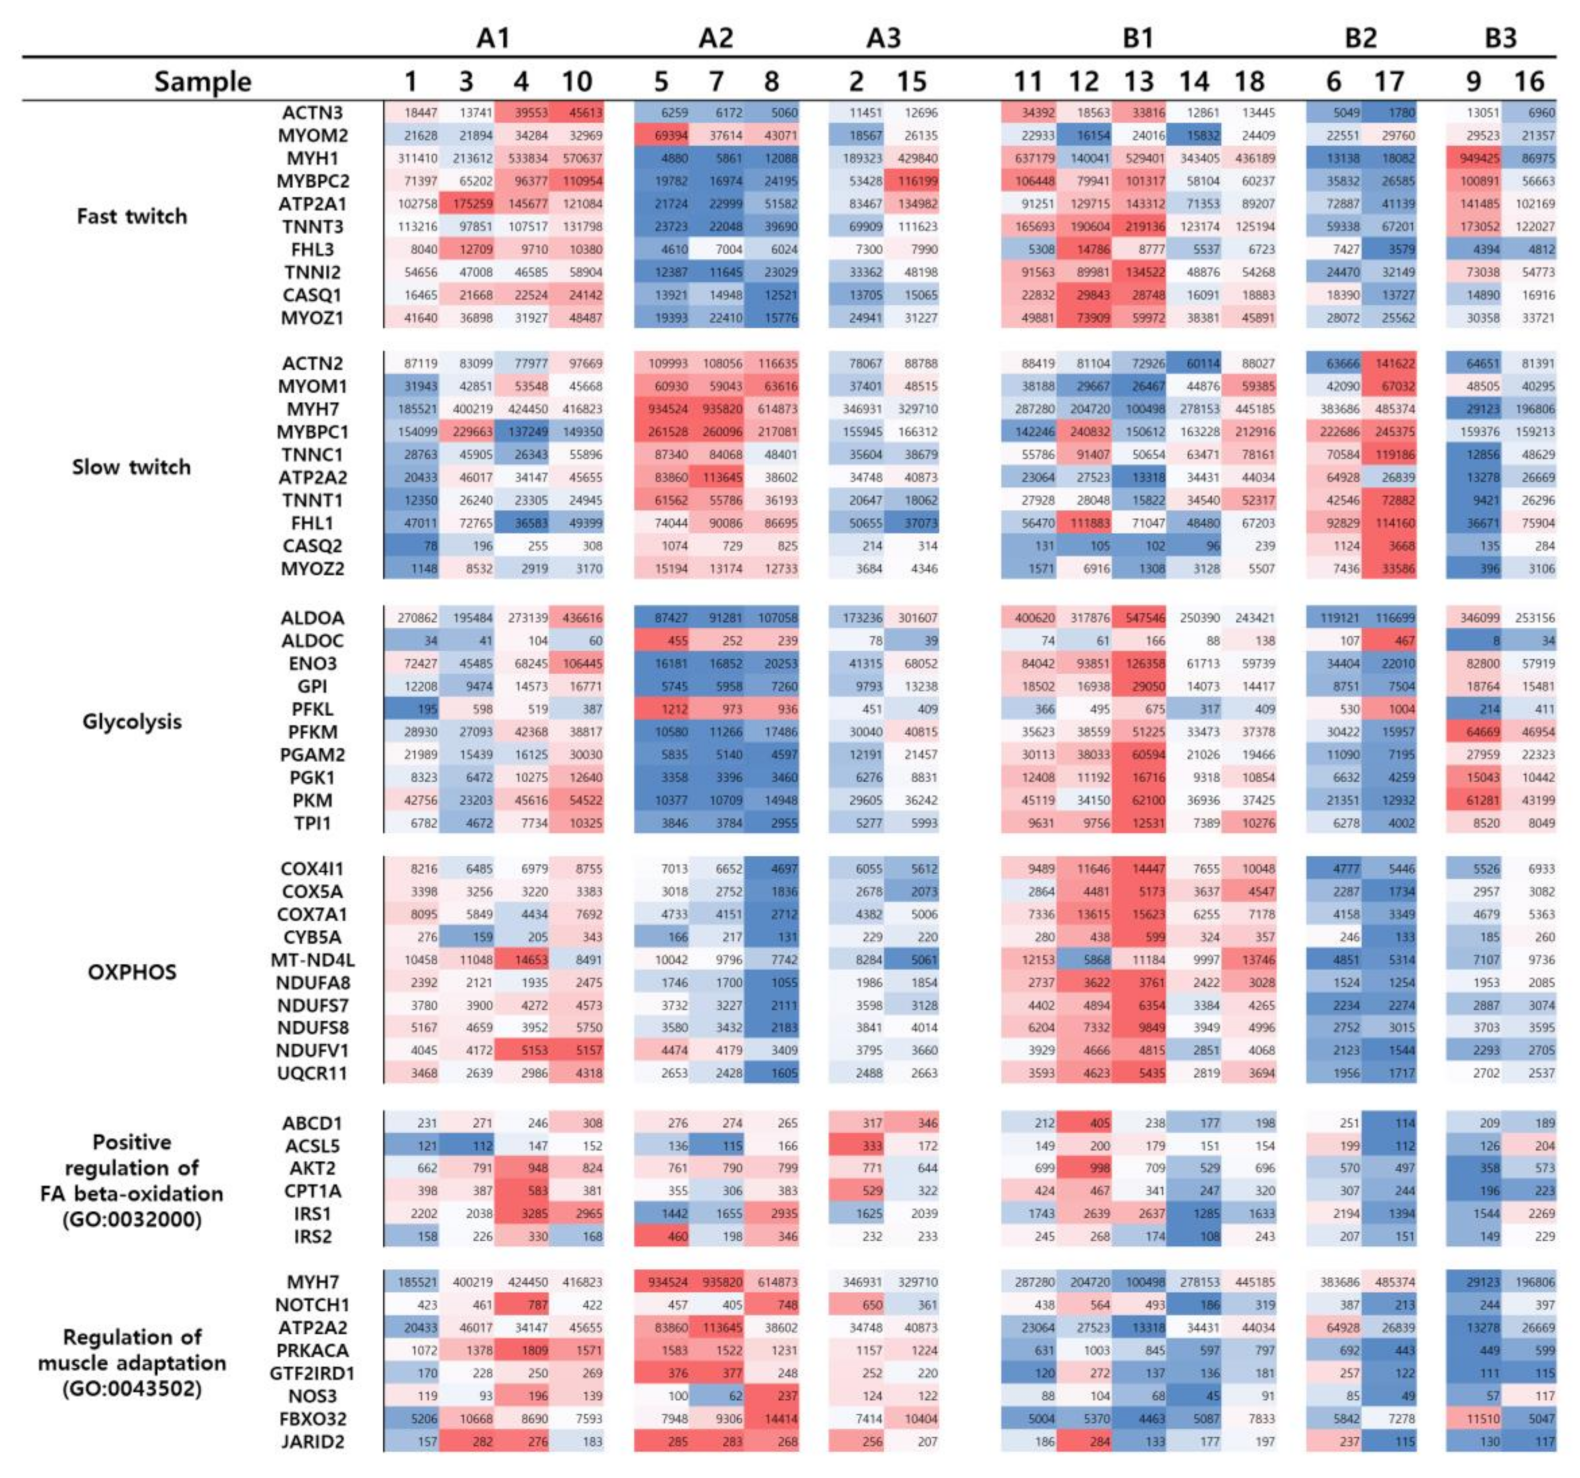
3.2.3. Group A
3.2.4. Group B
4. Discussion
5. Conclusions
Supplementary Materials
Author Contributions
Funding
Conflicts of Interest
References
- Keel, B.N.; Zarek, C.M.; Keele, J.W.; Kuehn, L.A.; Snelling, W.M.; Oliver, W.T.; Freetly, H.C.; Lindholm-Perry, A.K. Rna-seq meta-analysis identifies genes in skeletal muscle associated with gain and intake across a multi-season study of crossbred beef steers. BMC Genom. 2018, 19, 430. [Google Scholar] [CrossRef]
- Kong, B.W.; Hudson, N.; Seo, D.; Lee, S.; Khatri, B.; Lassiter, K.; Cook, D.; Piekarski, A.; Dridi, S.; Anthony, N.; et al. Rna sequencing for global gene expression associated with muscle growth in a single male modern broiler line compared to a foundational barred plymouth rock chicken line. BMC Genom. 2017, 18, 82. [Google Scholar] [CrossRef] [PubMed] [Green Version]
- Ropka-Molik, K.; Bereta, A.; Zukowski, K.; Piorkowska, K.; Gurgul, A.; Zak, G. Transcriptomic gene profiling of porcine muscle tissue depending on histological properties. Anim. Sci. J. 2017, 88, 1178–1188. [Google Scholar] [CrossRef] [PubMed]
- Li, Y.; Xu, Z.; Li, H.; Xiong, Y.; Zuo, B. Differential transcriptional analysis between red and white skeletal muscle of chinese meishan pigs. Int. J. Biol. Sci. 2010, 6, 350–360. [Google Scholar] [CrossRef] [PubMed]
- Francisco, C.L.; Jorge, A.M.; Dal-Pai-Silva, M.; Carani, F.R.; Cabeco, L.C.; Silva, S.R. Muscle fiber type characterization and myosin heavy chain (myhc) isoform expression in mediterranean buffaloes. Meat Sci. 2011, 88, 535–541. [Google Scholar] [CrossRef] [PubMed] [Green Version]
- Ryu, Y.C.; Kim, B.C. The relationship between muscle fiber characteristics, postmortem metabolic rate, and meat quality of pig longissimus dorsi muscle. Meat Sci. 2005, 71, 351–357. [Google Scholar] [CrossRef] [PubMed]
- Hyytiainen, H.K.; Mykkanen, A.K.; Hielm-Bjorkman, A.K.; Stubbs, N.C.; McGowan, C.M. Muscle fibre type distribution of the thoracolumbar and hindlimb regions of horses: Relating fibre type and functional role. Acta Vet. Scand. 2014, 56, 8. [Google Scholar] [CrossRef] [Green Version]
- Ropka-Molik, K.; Stefaniuk-Szmukier, M.; K, Z.U.; Piorkowska, K.; Bugno-Poniewierska, M. Exercise-induced modification of the skeletal muscle transcriptome in arabian horses. Physiol. Genom. 2017, 49, 318–326. [Google Scholar] [CrossRef] [Green Version]
- Ropka-Molik, K.; Stefaniuk-Szmukier, M.; Zukowski, K.; Piorkowska, K.; Gurgul, A.; Bugno-Poniewierska, M. Transcriptome profiling of arabian horse blood during training regimens. BMC Genet. 2017, 18, 31. [Google Scholar] [CrossRef] [Green Version]
- Serrano, A.L.; Rivero, J.L. Myosin heavy chain profile of equine gluteus medius muscle following prolonged draught-exercise training and detraining. J. Muscle Res. Cell Motil. 2000, 21, 235–245. [Google Scholar] [CrossRef]
- Bryan, K.; McGivney, B.A.; Farries, G.; McGettigan, P.A.; McGivney, C.L.; Gough, K.F.; MacHugh, D.E.; Katz, L.M.; Hill, E.W. Equine skeletal muscle adaptations to exercise and training: Evidence of differential regulation of autophagosomal and mitochondrial components. BMC Genom. 2017, 18, 595. [Google Scholar] [CrossRef] [PubMed]
- Catoire, M.; Mensink, M.; Boekschoten, M.V.; Hangelbroek, R.; Muller, M.; Schrauwen, P.; Kersten, S. Pronounced effects of acute endurance exercise on gene expression in resting and exercising human skeletal muscle. PLoS ONE 2012, 7, e51066. [Google Scholar] [CrossRef] [PubMed] [Green Version]
- Nader, G.A.; von Walden, F.; Liu, C.; Lindvall, J.; Gutmann, L.; Pistilli, E.E.; Gordon, P.M. Resistance exercise training modulates acute gene expression during human skeletal muscle hypertrophy. J. Appl. Physiol. 2014, 116, 693–702. [Google Scholar] [CrossRef] [PubMed] [Green Version]
- Popov, D.V.; Lysenko, E.A.; Makhnovskii, P.A.; Kurochkina, N.S.; Vinogradova, O.L. Regulation of PPARGC1A gene expression in trained and untrained human skeletal muscle. Physiol. Rep. 2017, 5, e13543. [Google Scholar] [CrossRef] [Green Version]
- Perry, C.G.R.; Hawley, J.A. Molecular Basis of Exercise-Induced Skeletal Muscle Mitochondrial Biogenesis: Historical Advances, Current Knowledge, and Future Challenges. Cold Spring Harb. Perspect. Med. 2017, 8, a029686. [Google Scholar] [CrossRef] [Green Version]
- Stuart, C.A.; Stone, W.L.; Howell, M.E.A.; Brannon, M.F.; Hall, H.K.; Gibson, A.L.; Stone, M.H. Myosin content of individual human muscle fibers isolated by laser capture microdissection. Am. J. Physiol. Physiol. 2016, 310, C381–C389. [Google Scholar] [CrossRef] [Green Version]
- Schiaffino, S.; Reggiani, C. Fiber Types in Mammalian Skeletal Muscles. Physiol. Rev. 2011, 91, 1447–1531. [Google Scholar] [CrossRef] [Green Version]
- Armstrong, E.; Iriarte, A.; Nicolini, P.; Santos, J.D.L.; Ithurralde, J.; Bielli, A.; Bianchi, G.; Peñagaricano, F. Comparison of transcriptomic landscapes of different lamb muscles using RNA-Seq. PLoS ONE 2018, 13, e0200732. [Google Scholar] [CrossRef]
- Yoon, S.H.; Kim, J.; Cho, S.; Kwak, W.; Lee, H.-K.; Park, K.D.; Shin, D.; Kim, H. Complete mitochondrial genome sequences of Korean native horse from Jeju Island: Uncovering the spatio-temporal dynamics. Mol. Biol. Rep. 2017, 44, 233–242. [Google Scholar] [CrossRef] [PubMed]
- Watson, J.; Wilson, A.M. Muscle architecture of biceps brachii, triceps brachii and supraspinatus in the horse. J. Anat. 2007, 210, 32–40. [Google Scholar] [CrossRef]
- Crook, T.C.; Cruickshank, S.E.; McGowan, C.M.; Stubbs, N.; Wakeling, J.M.; Wilson, A.M.; Payne, R.C. Comparative anatomy and muscle architecture of selected hind limb muscles in the Quarter Horse and Arab. J. Anat. 2008, 212, 144–152. [Google Scholar] [CrossRef] [PubMed]
- Patel, R.K.; Jain, M. NGS QC toolkit: A toolkit for quality control of next generation sequencing data. PLoS ONE 2012, 7, e30619. [Google Scholar] [CrossRef] [PubMed]
- Dobin, A.; Davis, C.A.; Schlesinger, F.; Drenkow, J.; Zaleski, C.; Jha, S.; Batut, P.; Chaisson, M.; Gingeras, T.R. STAR: Ultrafast universal RNA-seq aligner. Bioinformatics 2013, 29, 15–21. [Google Scholar] [CrossRef] [PubMed]
- Anders, S.; Huber, W. Differential expression analysis for sequence count data. Genome Biol. 2010, 11, R106. [Google Scholar] [CrossRef] [PubMed] [Green Version]
- Love, M.I.; Huber, W.; Anders, S. Moderated estimation of fold change and dispersion for rna-seq data with deseq2. Genome Biol. 2014, 15, 550. [Google Scholar] [CrossRef] [PubMed] [Green Version]
- Kramer, A.; Green, J.; Pollard, J., Jr.; Tugendreich, S. Causal analysis approaches in ingenuity pathway analysis. Bioinformatics 2014, 30, 523–530. [Google Scholar] [CrossRef] [PubMed]
- Thomas, P.D.; Muruganujan, A.; Ebert, D.; Huang, X.; Thomas, P.D. PANTHER version 14: More genomes, a new PANTHER GO-slim and improvements in enrichment analysis tools. Nucleic Acids Res. 2018, 47, D419–D426. [Google Scholar]
- Lynch, C.J.; Xu, Y.; Hajnal, A.; Salzberg, A.C.; Kawasawa, Y.I. RNA Sequencing Reveals a Slow to Fast Muscle Fiber Type Transition after Olanzapine Infusion in Rats. PLoS ONE 2015, 10, e0123966. [Google Scholar] [CrossRef]
- Musumeci, O.; Bruno, C.; Mongini, T.; Rodolico, C.; Aguennouz, M.; Barca, E.; Amati, A.; Cassandrini, D.; Serlenga, L.; Vita, G.; et al. Clinical features and new molecular findings in muscle phosphofructokinase deficiency (GSD type VII). Neuromuscul. Disord. 2012, 22, 325–330. [Google Scholar] [CrossRef]
- Scott, W.; Stevens, J.; A Binder–Macleod, S. Human Skeletal Muscle Fiber Type Classifications. Phys. Ther. 2001, 81, 1810–1816. [Google Scholar] [CrossRef]
- Peshavaria, M.; Day, I.N. Molecular structure of the human muscle-specific enolase gene (ENO3). Biochem. J. 1991, 275, 427–433. [Google Scholar] [CrossRef] [PubMed] [Green Version]
- Tsujino, S.; Sakoda, S.; Mizuno, R.; Kobayashi, T.; Suzuki, T.; Kishimoto, S.; Shanske, S.; DiMauro, S.; A Schon, E. Structure of the gene encoding the muscle-specific subunit of human phosphoglycerate mutase. J. Biol. Chem. 1989, 264, 15334–15337. [Google Scholar] [PubMed]
- Wei, B.; Jin, J.-P. TNNT1, TNNT2, and TNNT3: Isoform genes, regulation, and structure–function relationships. Gene 2016, 582, 1–13. [Google Scholar] [CrossRef] [PubMed] [Green Version]
- Ikeda, K.; Horie-Inoue, K.; Inoue, S. Functions of estrogen and estrogen receptor signaling on skeletal muscle. J. Steroid Biochem. Mol. Biol. 2019, 191, 105375. [Google Scholar] [CrossRef] [PubMed]
- Brown, E.L.; Hazen, B.C.; Eury, E.; Wattez, J.-S.; Gantner, M.L.; Albert, V.; Chau, S.; Sanchez-Alavez, M.; Conti, B.; Kralli, A. Estrogen-Related Receptors Mediate the Adaptive Response of Brown Adipose Tissue to Adrenergic Stimulation. iScience 2018, 2, 221–237. [Google Scholar] [CrossRef] [Green Version]
- Frank, A.P.; Palmer, B.F.; Clegg, D.J. Do estrogens enhance activation of brown and beiging of adipose tissues? Physiol. Behav. 2018, 187, 24–31. [Google Scholar] [CrossRef]
- Sánchez-Aguilera, A.; Arranz, L.; Martín-Pérez, D.; García-García, A.; Stavropoulou, V.; Kubovcakova, L.; Isern, J.; Martín-Salamanca, S.; Langa, X.; Skoda, R.C.; et al. Estrogen Signaling Selectively Induces Apoptosis of Hematopoietic Progenitors and Myeloid Neoplasms without Harming Steady-State Hematopoiesis. Cell Stem Cell 2014, 15, 791–804. [Google Scholar] [CrossRef] [Green Version]
- Radovick, S.; Levine, J.E.; Wolfe, A.M. Estrogenic Regulation of the GnRH Neuron. Front. Endocrinol. 2012, 3, 52. [Google Scholar] [CrossRef] [Green Version]
- Lefeuvre, R.A.; Rothwell, N.J.; Stock, M.J. Activation of brown fat thermogenesis in response to central injection of corticotropin releasing hormone in the rat. Neuropharmacology 1987, 26, 1217–1221. [Google Scholar] [CrossRef]
- Schiaffino, S.; Sandri, M.; Murgia, M. Activity-Dependent Signaling Pathways Controlling Muscle Diversity and Plasticity. Physiology 2007, 22, 269–278. [Google Scholar] [CrossRef] [Green Version]
- Solinas, G.; Summermatter, S.; Mainieri, D.; Gubler, M.; Montani, J.P.; Seydoux, J.; Smith, S.R.; Dulloo, A.G. Corticotropin-Releasing Hormone Directly Stimulates Thermogenesis in Skeletal Muscle Possibly through Substrate Cycling between de Novo Lipogenesis and Lipid Oxidation. Endocrinology 2006, 147, 31–38. [Google Scholar] [CrossRef] [PubMed]
- Ubaida-Mohien, C.; Lyashkov, A.; Gonzalez-Freire, M.; Tharakan, R.; Shardell, M.; Moaddel, R.; Semba, R.D.; Chia, C.W.; Gorospe, M.; Rosen, C.J.; et al. Discovery proteomics in aging human skeletal muscle finds change in spliceosome, immunity, proteostasis and mitochondria. eLife 2019, 8, 8. [Google Scholar] [CrossRef] [PubMed]
- Chen, M.; Feng, H.Z.; Gupta, D.; Kelleher, J.; Dickerson, K.E.; Wang, J.; Hunt, D.; Jou, W.; Gavrilova, O.; Jin, J.P.; et al. G(s)α deficiency in skeletal muscle leads to reduced muscle mass, fiber-type switching, and glucose intolerance without insulin resistance or deficiency. Am. J. Physiol. Cell Physiol. 2009, 296, C930–C940. [Google Scholar] [CrossRef] [PubMed] [Green Version]
- Hood, D.A.; Memme, J.M.; Oliveira, A.N.; Triolo, M. Maintenance of Skeletal Muscle Mitochondria in Health, Exercise, and Aging. Annu. Rev. Physiol. 2019, 81, 19–41. [Google Scholar] [CrossRef] [PubMed]
- Roth, L.; Koncina, E.; Satkauskas, S.; Crémel, G.; Aunis, D.; Bagnard, D. The many faces of semaphorins: From development to pathology. Cell. Mol. Life Sci. 2008, 66, 649–666. [Google Scholar] [CrossRef]
- Ubaida-Mohien, C.; Gonzalez-Freire, M.; Lyashkov, A.; Moaddel, R.; Chia, C.W.; Simonsick, E.M.; Sen, R.; Ferrucci, L. Physical Activity Associated Proteomics of Skeletal Muscle: Being Physically Active in Daily Life May Protect Skeletal Muscle From Aging. Front. Physiol. 2019, 10, 312. [Google Scholar] [CrossRef]
- Xiang, W.; Zhang, B.; Lv, F.; Feng, G.; Chen, L.; Yang, F.; Zhang, K.; Cao, C.; Wang, P.; Chu, M. The potential regulatory mechanisms of the gonadotropin-releasing hormone in gonadotropin transcriptions identified with bioinformatics analyses. Reprod. Biol. Endocrinol. 2017, 15, 46. [Google Scholar] [CrossRef]
- Krzeminski, K. The Role of Adrenomedullin in Cardiovascular Response to Exercise—A Review. J. Hum. Kinet. 2016, 53, 127–142. [Google Scholar] [CrossRef] [Green Version]
- Shimizu, I.; Yoshida, Y.; Moriya, J.; Nojima, A.; Uemura, A.; Kobayashi, Y.; Minamino, T. Semaphorin3E-Induced Inflammation Contributes to Insulin Resistance in Dietary Obesity. Cell Metab. 2013, 18, 491–504. [Google Scholar] [CrossRef] [Green Version]
- Rivero, J.-L.L. A Scientific Background for Skeletal Muscle Conditioning in Equine Practice. J. Vet. Med. Ser. A 2007, 54, 321–332. [Google Scholar] [CrossRef]
- McAllister, R.M.; Reiter, B.L.; Amann, J.F.; Laughlin, M.H. Skeletal muscle biochemical adaptations to exercise training in miniature swine. J. Appl. Physiol. 1997, 82, 1862–1868. [Google Scholar] [CrossRef] [PubMed] [Green Version]
- Harrison, S.M.; Whitton, R.C.; King, M.; Haussler, K.K.; Kawcak, C.E.; Stover, S.M.; Pandy, M.G. Forelimb muscle activity during equine locomotion. J. Exp. Biol. 2012, 215, 2980–2991. [Google Scholar] [CrossRef] [PubMed] [Green Version]


| Ingenuity Canonical Pathways | -log (p-Value) | z-Score | Molecules |
|---|---|---|---|
| Estrogen Receptor Signaling | 4.1 | 1.569 | ADCY1, ADCY5, ADCY9, CACNA1C, CARM1, CREB5, CREBBP, DDX5, FBXO32, FOXO4, GNAZ, GPS2, IGF2R, MAP2K2, MED4, MMP14, MMP15, MMP16, MMP2, NCOR2, NOS3, NOTCH1, PIK3CB, PLCB3, PRKACA, TRIM63 |
| Endocannabinoid Cancer Inhibition Pathway | 3.89 | −1.807 | ADCY1, ADCY5, ADCY9, CREB5, CREBBP, DDIT3, MAP2K2, MAP2K7, MMP2, NOS1, NOS2, NOS3, NUPR1, PIK3CB, PRKACA |
| Semaphorin Neuronal Repulsive Signaling Pathway | 3.48 | −0.535 | CSPG4, ITGA3, MAP2K2, MAP2K7, MAPT, PAK4, PDE4A, PIK3CB, PLXNA1, PLXNA2, PLXND1, PRKACA, SEMA3E, SMC3 |
| GNRH Signaling | 3.47 | 1.941 | ADCY1, ADCY5, ADCY9, CACNA1C, CACNA1G, CACNA1H, CREB5, CREBBP, HBEGF, MAP2K2, MAP2K7, MAP3K11, MMP2, PAK4, PLCB3, PRKACA |
| Corticotropin Releasing Hormone Signaling | 3.3 | 1.387 | ADCY1, ADCY5, ADCY9, CACNA1C, CACNA1G, CACNA1H, CREB5, CREBBP, MAP2K2, NOS1, NOS2, NOS3, PRKACA, SLC39A7 |
| Gαs Signaling | 2.93 | 2.111 | ADCY1, ADCY5, ADCY9, ADD3, ADRB2, CREB5, CREBBP, MAP2K2, PRKACA, RAPGEF2, RYR1 |
| Spliceosomal Cycle | 2.92 | −2.646 | DDX46, DHX15, MAGOH, PRPF18, RBM8A, SLU7, ZNF830 |
| Adrenomedullin signaling pathway | 2.86 | 2.673 | ADCY1, ADCY5, ADCY9, KCNH2, KCNN3, MAP2K2, MAP2K7, MMP2, MYLK2, NOS3, PIK3CB, PLCB3, PRKACA, RAMP2, RXRA, SLC39A7 |
| White Adipose Tissue Browning Pathway | 2.77 | 2.887 | ADCY1, ADCY5, ADCY9, CACNA1C, CACNA1G, CACNA1H, CREB5, CREBBP, LDHD, PPARA, PRKACA, RXRA |
| Calcium Signaling | 2.66 | 1.897 | ATP2A2, CACNA1C, CACNA1G, CACNA1H, CHRNG, CREB5, CREBBP, MICU1, MYH14, MYH7, MYH8, PPP3CB, PRKACA, RCAN1, RYR1, TP63 |
| Ingenuity Canonical Pathways | -log (p-Value) | z-Score | Molecules |
|---|---|---|---|
| A1 vs. A2 | |||
| Glycolysis I | 14 | 1.897 | ALDOA, ALDOC, ENO3, GPI, PFKL, PFKM, PGAM2, PGK1, PKM, TPI1 |
| Gluconeogenesis I | 7.11 | 1.633 | ALDOA, ALDOC, ENO3, GPI, PGAM2, PGK1 |
| Calcium Signaling | 5.71 | 1 | ATP2A1, ATP2B2, CASQ2, CREB3L4, MYH1, MYH11, MYL1, MYL6B, TNNI2, TNNT3, TPM1 |
| Actin Cytoskeleton Signaling | 5.47 | 1.667 | ACTN3, DIAPH3, EGF, FGF9, HRAS, LIMK1, MYH1, MYH11, MYL1, MYL6B, MYLPF |
| Protein Kinase A Signaling | 4.96 | 1.265 | CREB3L4, MYL1, MYL6B, MYLPF, NAPEPLD, PGP, PHKB, PLCL1, PLCL2, PPP1R3D, PTPN3, PYGM, TNNI2, UBASH3B |
| Estrogen Receptor Signaling | 3.84 | 1.508 | BCL2, CREB3L4, EGF, HRAS, LIMK1, MYL1, MYL6B, MYLPF, PLCL1, PLCL2, SETD7 |
| Apelin Cardiomyocyte Signaling Pathway | 3.65 | 1.633 | ATP2A1, MYL1, MYL6B, MYLPF, PLCL1, PLCL2 |
| Synaptic Long Term Potentiation | 3.03 | 0.816 | CREB3L4, HRAS, PLCL1, PLCL2, PPP1R1A, PPP1R3D |
| Semaphorin Neuronal Repulsive Signaling Pathway | 3.02 | 0.816 | DPYSL2, LIMK1, MYL1, MYL6B, MYLPF, VCAN |
| PAK Signaling | 2.8 | 1.342 | HRAS, LIMK1, MYL1, MYL6B, MYLPF |
| A1 vs. A3 | |||
| iCOS-iCOSL Signaling in T Helper Cells | 24.8 | −4.359 | CAMK4, CD247,CD28, CD3D, CD3E, CD3G, CD4, CD80, CD86, FCER1G, HLA-DOA, HLA-DOB, HLA-DRA, ICOS, IKBKE, IL2RA, IL2RB, IL2RG, ITK, LAT, LCK, LCP2, PIK3CG, PTPRC, VAV1, ZAP70 |
| CD28 Signaling in T Helper Cells | 23.8 | −3.771 | ARPC1B, CAMK4, CARD11, CD247, CD28, CD3D, CD3E, CD3G, CD4, CD80, CD86, FCER1G, HLA-DOA, HLA-DOB, HLA-DRA, IKBKE, ITK, LAT, LCK, LCP2, PIK3CG, PTPN6, PTPRC, SYK, VAV1, ZAP70 |
| Th2 Pathway | 19.8 | −3.638 | CCR1, CD247, CD28, CD3D, CD3E, CD3G, CD4, CD80, CD86, CXCR4, HLA-DOA, HLA-DOB, HLA DRA, ICOS, IKZF1, IL2RA, IL2RB, IL2RG, ITGB2, JAK3, PIK3CG, SPI1, TIMD4, VAV1 |
| Th1 Pathway | 17.2 | −3.638 | CD247, CD28, CD3D, CD3E, CD3G, CD4, CD80, CD86, CD8A, CXCR3, HLA-DOA, HLA-DOB, HLA-DRA, ICOS, IL10RA, IL18R1, IRF1, ITGB2, JAK3, PIK3CG, VAV1 |
| PKCθ Signaling in T Lymphocytes | 16.1 | −4.69 | CARD11, CD247, CD28, CD3D, CD3E, CD3G, CD4, CD80, CD86, FCER1G, HLA-DOA, HLA-DOB, HLA-DRA, IKBKE, LAT, LCK, LCP2, PIK3CG, RAC2, VAV1, VAV3, ZAP70 |
| Role of NFAT in Regulation of the Immune Response | 15.7 | −4.796 | CAMK4, CD247, CD28, CD3D, CD3E, CD3G, CD4, CD80, CD86, FCER1G, FCGR2C, HLA-DOA, HLA-DOB, HLA-DRA, IKBKE, ITK, LAT, LCK, LCP2, PIK3CG, PLCB2, SYK, ZAP70 |
| Calcium-induced T Lymphocyte Apoptosis | 12.9 | −3.606 | ATP2A3, CAMK4, CD247, CD3D, CD3E, CD3G, CD4, FCER1G, HLA-DOA, HLA-DOB, HLA-DRA, LCK, PRKCB, ZAP70 |
| PD-1, PD-L1 cancer immunotherapy pathway | 11.1 | 3.873 | CD247, CD28, CD80, HLA-DOA, HLA-DOB, HLA-DRA, IL2RA, IL2RB, IL2RG, JAK3, LAT, LCK, LCP2, PIK3CG, ZAP70 |
| Type I Diabetes Mellitus Signaling | 10.8 | −2.828 | CASP8, CD247, CD28, CD3D, CD3E, CD3G, CD80, CD86, FCER1G, HLA-DOA, HLA-DOB, HLA-DRA, IKBKE, IRF1, PRF1 |
| B Cell Receptor Signaling | 10.4 | −3.051 | APBB1IP, CAMK4, DAPP1, FCGR2C, IGHE, IGHG4, IGHM, IKBKE, PIK3AP1, PIK3CG, PRKCB, PTK2B, PTPN6, PTPRC, RAC2, SYK, VAV1, VAV3 |
| A2 vs. A3 | |||
| iCOS-iCOSL Signaling in T Helper Cells | 12.3 | −3.464 | CD3D, CD3E, CD4, FCER1G, HLA-DOA, ICOS, IL2RA, IL2RG, ITK, LCK, LCP2, PIK3CD, PIK3CG, PTPRC, VAV1, ZAP70 |
| B Cell Receptor Signaling | 10.8 | −2.496 | CD22, CREB3L4, DAPP1, FCGR2C, IGHE, IGHG4, IGHM, MAP2K6, PIK3AP1, PIK3CD, PIK3CG, PLCG2, PRKCB, PTPRC, RAC2, RASSF5, SYNJ2, VAV1 |
| Phospholipase C Signaling | 10.1 | −2.138 | CD3D, CD3E, CREB3L4, FCER1G, FCGR2C, IGHG4, ITGA4, ITK, LCK, LCP2, MYL2, MYL6B, MYLPF, NAPEPLD, PLCB2, PLCG2, PLD4, PRKCB, RAC2, ZAP70 |
| Glycolysis I | 9.21 | −1.414 | ALDOA, ALDOC, ENO3, PFKL, PFKM, PGAM2, PGK1, PKM |
| Actin Cytoskeleton Signaling | 8.71 | −1.604 | EGF, FGD3, FGF9, ITGA4, LIMK1, MYH1, MYH10, MYL2, MYL6B, MYLPF, NCKAP1L, PIK3CD, PIK3CG, RAC2, TIAM2, TMSB4Y, VAV1 |
| CD28 Signaling in T Helper Cells | 8.51 | −3 | CD3D, CD3E, CD4, FCER1G, HLA-DOA, ITK, LCK, LCP2, PIK3CD, PIK3CG, PTPRC, VAV1, ZAP70 |
| Calcium-induced T Lymphocyte Apoptosis | 8.11 | −3 | ATP2A1, ATP2A3, CD3D, CD3E, CD4, FCER1G, HLA-DOA, LCK, PRKCB, ZAP70 |
| Ingenuity Canonical Pathways | -log (p-Value) | z-Score | Molecules |
|---|---|---|---|
| B1 vs. B2 | |||
| Actin Cytoskeleton Signaling | 6.57 | 0.632 | ACTN3, ARHGAP24, EGF, FGF1, FGF10, FGF7, FGF9, HRAS, MYH1, MYH10, MYH3, MYL6B, MYLPF, PAK1, PFN2, TIAM2 |
| Glycolysis I | 5.67 | 2.449 | ALDOA, ENO3, GPI, PGAM2, PGK1, PKM |
| Oxidative Phosphorylation | 5.17 | 3.162 | COX4I1, COX5A, COX7A1, CYB5A, MT-ND4L, NDUFA8, NDUFS7, NDUFS8, NDUFV1, UQCR11 |
| Gluconeogenesis I | 4.39 | 2.236 | ALDOA, ENO3, GPI, PGAM2, PGK1 |
| Sirtuin Signaling Pathway | 3.78 | −1.732 | ARG2, IDH2, LDHA, MT-ND4L, NDUFA8, NDUFS7, NDUFS8, NDUFV1, PFKFB3, PGAM2, PGK1, PPIF, SREBF1, TUBA8 |
| Calcium Signaling | 3.46 | −1 | CAMKK2, CASQ2, CREB3L4, MYH1, MYH10, MYH3, MYL6B, SLC8A3, TNNI2, TNNT3, TPM1 |
| FGF Signaling | 2.74 | −0.816 | CREB3L4, FGF1, FGF10, FGF7, FGF9, HRAS |
| Neuregulin Signaling | 2.45 | 0.447 | BTC, EGF, ERBIN, HRAS, RNF41, STAT5A |
| Bladder Cancer Signaling | 2.43 | −0.447 | EGF, FGF1, FGF10, FGF7, FGF9, HRAS |
| LPS/IL-1 Mediated Inhibition of RXR Function | 1.66 | 0.0357 | ABCB9, ACOX3, APOE, FABP4, MAOB, PLTP, SREBF1, TNFRSF11B |
| B1 vs. B3 | |||
| AMPK Signaling | 3.34 | 0.816 | ACACB, ADIPOQ, EIF4EBP1, PCK2, PFKFB3, PIK3R6, TBC1D1 |
| Senescence Pathway | 2.07 | 1.633 | ACVR1C, DHCR24, E2F8, EIF4EBP1, PIK3R6, TGFB3 |
| Synaptogenesis Signaling Pathway | 1.82 | 1.633 | APOE, CDH15, EIF4EBP1, GSK3B, PIK3R6, SNCG |
| Factors Promoting Cardiogenesis in Vertebrates | 1.8 | 2 | ACVR1C, BMPR1B, GSK3B, TGFB3 |
| Colorectal Cancer Metastasis Signaling | 1.63 | 2 | BAX, GSK3B, PIK3R6, PTGER3, TGFB3 |
| Adrenomedullin signaling pathway | 1.42 | 1 | BAX, GSK3B, GUCY2C, PIK3R6 |
| B2 vs. B3 | |||
| Glycolysis I | 11.6 | −2.121 | ALDOA, ALDOC, ENO3, GPI, PFKM, PGAM2, PGK1, PKM |
| Calcium Signaling | 8.23 | −0.447 | ATP2A1, CAMKK2, CASQ2, CREB3L4, MYH1, MYH3, MYL2, MYL6B, PPP3CA, TNNI2, TNNT3, TPM3 |
| Gluconeogenesis I | 7.99 | −1.633 | ALDOA, ALDOC, ENO3, GPI, PGAM2, PGK1 |
| Semaphorin Neuronal Repulsive Signaling Pathway | 4.79 | −0.378 | DPYSL2, DPYSL3, MYL2, MYL6B, PAK1, PDE4D, PLXNA3 |
| Actin Cytoskeleton Signaling | 4.2 | −1.134 | ACTN3, EGF, MYH1, MYH3, MYL2, MYL6B, PAK1, SSH2 |
| PFKFB4 Signaling Pathway | 3.74 | 1 | CREB3L4, GPI, PFK M, TGFB3 |
| HIF1α Signaling | 2.76 | −1.633 | ADM, EGF, GPI, LDHA, PKM, PPP3CA |
| Colanic Acid Building Blocks Biosynthesis | 2.49 | #NUM! | GPI, UGP2 |
| White Adipose Tissue Browning Pathway | 2.08 | 1 | CAMKK2, CREB3L4, FNDC5, LDHA |
| AMPK Signaling | 1.97 | 1 | CAMKK2, CREB3L4, GYS1, PFKM, ULK1 |
Publisher’s Note: MDPI stays neutral with regard to jurisdictional claims in published maps and institutional affiliations. |
© 2020 by the authors. Licensee MDPI, Basel, Switzerland. This article is an open access article distributed under the terms and conditions of the Creative Commons Attribution (CC BY) license (http://creativecommons.org/licenses/by/4.0/).
Share and Cite
Lee, H.-Y.; Kim, J.-Y.; Kim, K.H.; Jeong, S.; Cho, Y.; Kim, N. Gene Expression Profile in Similar Tissues Using Transcriptome Sequencing Data of Whole-Body Horse Skeletal Muscle. Genes 2020, 11, 1359. https://doi.org/10.3390/genes11111359
Lee H-Y, Kim J-Y, Kim KH, Jeong S, Cho Y, Kim N. Gene Expression Profile in Similar Tissues Using Transcriptome Sequencing Data of Whole-Body Horse Skeletal Muscle. Genes. 2020; 11(11):1359. https://doi.org/10.3390/genes11111359
Chicago/Turabian StyleLee, Ho-Yeon, Jae-Yoon Kim, Kyoung Hyoun Kim, Seongmun Jeong, Youngbum Cho, and Namshin Kim. 2020. "Gene Expression Profile in Similar Tissues Using Transcriptome Sequencing Data of Whole-Body Horse Skeletal Muscle" Genes 11, no. 11: 1359. https://doi.org/10.3390/genes11111359