1. Introduction
Corn (
Zea may L.) is the main feed and food crop, worldwide, with its quality directly affecting the healthy development and edibility by human beings, livestock, and poultry. The nutritional quality of corn grains generally refers to the nutritional components in corn grain, including protein, fat, starch, and various vitamins, as well as mineral element contents. Among them, lysine, from proteins, is a necessary amino acid for humans and monogastric animals. The content of lysine in wild-type maize is low (less than 0.3%) and cannot meet the nutritional quality requirements for human consumption and food processing (more than 0.5%). Furthermore, it cannot even meet the requirements for the content of lysine in livestock and poultry feed (0.6–0.8%) [
1].
Singleton and Jones first discovered the mutation of
opaque1 (
o1) and
opaque2 (
o2) in maize. Mertz et al. found that the mutation of
o2 could significantly increase the content of lysine in the endosperm of maize seeds [
2]. The
O2 gene, located on chromosome 7, encodes the transcription factors of the basic leucine zipper family, recognizes the promoter of the zein gene through the
O2 box (TCCACGT) and regulates the expression of 22 kDa α-zein and 15 kDa β-zein genes [
3,
4]. Following this, new similar mutations were discovered successively, such as
floury1 (
fl1) [
5],
floury2 (
fl2) [
6], and
floury3 (
fl3) [
7],
opaque4 (
o4) [
8,
9],
opaque5 (
o5) [
10,
11],
opaque6 (
o6) [
12,
13],
opaque7 (
o7) [
14,
15,
16],
opaque15 (
o15) [
17],
proline1 (
pro1) [
18],
De*-B30 [
19], and
Mc [
19], amongst others. However, it is difficult to use these mutations in breeding and production, due to the death of seedlings or complex genetic patterns. To expand upon the available high-lysine corn germplasm resources, we previously applied
Mu transposon technology to create a new high-lysine mutation,
opaque16 (
o16), which has a lysine content of 0.36%. This gene is located on the long arm of chromosome 8, between molecular markers umc1141 and umc1121 [
20].
To further improve the nutritional quality of maize, the
o16 and
o2 genes were pyramided by a marker-assisted selection (MAS) using Qi205 (
o2o2) and QCL3021 (
o16o16) as parents. The content of lysine in the grain increased by 6% and 30%, compared with that of the
o2 parent and
o16 parent, respectively [
20]. Zhang et al. used Tai19 (
o2o2) as the recurrent parent and QCL3021 (
o16o16) as the donor parent. Marker-assisted backcross selection (MABS) were then used to introgress the
o16 gene into the
o2 lines, which allowed us to obtain 17 families, with increases in lysine content of 22.33% and 65.86%, compared with Tai 19 (
o2o2) and QCL3021 (
o16o16), respectively [
21]. Sarika et al. used MABS to introgress
o2 and
o16 genes into different recurrent parents. Compared with the recurrent parents, the content of lysine and tryptophan increased by 76% and 91%, respectively [
22,
23]. Therefore, the polymerization of high-lysine mutant genes could improve the nutritional quality of corn seeds.
The introgression of
o2 gene into wild-type maize with different genetic backgrounds could cause varying degrees of changes in transcription patterns [
24]. The
o2 gene introgression into waxy corn could not only cause varying degrees of physiological, biochemical, and proteomic changes, but could also change the expression of endosperm proteins, amino acids, biosynthesis, starch, stress response, and signal transduction [
25]. The
O2 gene-regulated multiple metabolic pathways related to biological process and molecular function during waxy maize endosperm development—
Zm00001d029385.1 and
Zm00001d012262.1—which encode the EF-1α and LHT1, were upregulated, but the gene that encodes sulfur-rich proteins was downregulated in the
o2o2wxwx lines, raising the waxy grain lysine content [
26]. In addition, the pyramiding of the
o2 and
o7 genes could affect amino acid metabolism; carbon metabolism; storage protein synthesis, transcription and translation; and signal transduction [
27]. However, it is unknown which physiological and metabolic changes are induced by the pyramiding of
o2 and
o16 genes, and what the underlying molecular mechanisms are that result in the increase in lysine.
To dissect the molecular mechanisms behind the improved quality of the maize double recessive mutant line (o2o2o16o16), the o2 and o16 genes were introgressed into wild-type maize lines by MABS. The kernels of the o2o2o16o16 line and their parents (18 DAP, 28 DAP, and 38 DAP) were subject to RNA sequencing (RNA-Seq). The transcriptional differences between the double recessive mutants (o2o2o16o16) and the wild-type parent were compared. The results provided a foundation for studying the underlying molecular mechanisms that underlay the improvement in grain nutrient quality through the introgression of the o2 and o16 genes.
2. Materials and Methods
2.1. Plant Materials
CML530 is a maize inbred line (wild-type, WT) from CIMMYT. QCL8003_2 is a double mutant line (o2o2o16o16) bred by our research group. Using CML530 as a recurrent parent and QCL8003_2 as a donor parent, the o2o2o16o16 mutant was converted to the CML530 background, through two backcrossing cycles, using MABS. Co-dominant SSR markers phi112 and umc1141, were used to select heterozygous (O2o2O16o16) individuals at BC1F1 and BC2F1, while selecting homozygous (o2o2o16o16) individuals at BC2F2, which was followed by several rounds of self-pollination. The bred o2o2o16o16 mutant line was named QCL8011_2. According to the 55 K SNP microarray analysis, the recovery rate of the genomic genetic background of QCL8011_2 (o2o2o16o16) was 92.62% to QCL530, which was higher than the theoretical background recovery rate (87.50%).
The maize inbred line CML530 and the endosperm mutant line QCL8011_2 (o2o2o16o16) in the CML530 background, were grown in an experimental field in the Guizhou Academy of Agricultural Sciences (Guiyang, China) (N26°30′14″ and E106°39′21″) during spring 2017.
Generally, kernels are sampled at 18 DAP for RNA-Seq of maize endosperm, such as that done by Zhou et al. [
25]. In order to dissect the transcriptome dynamics of
o2o2o16o16 mutant at different stages of endosperm development, the kernels of QCL8011_2 (
o2o2o16o16) and CML530 (WT) were again sampled at 28 DAP and 38 DAP. A minimum of five well-filled kernels for each genotype were sampled at 18 DAP, 28 DAP, and 38 DAP, and then immediately frozen in liquid nitrogen for RNA extraction.
Mature kernels were harvested after physiological maturity and dried in a drying room. To minimize the effect of biological variation between ears, equal numbers of four well-filled ears were pooled and treated as one sample for nutritional evaluation.
2.2. Kernel Characteristics and Submicroscopic Structure
The mature and dry kernels of QCL8011_2 and CML530 were selected to observe the ear and kernel under natural light, while the transparency of the grain was observed on the light box. The kernel was cross cut by a blade and the farinaceous and keratinous degree of kernel was observed under natural light and photographed.
After the peel was removed from the mature and dry kernels, a blade was used to cut the endosperm from the middle and a small piece of endosperm was taken. An ion sputtering instrument (E-1010, Hitach, Tokyo, Japan) was used to embed platinum, which was subsequently observed under scanning electron microscopy (SEM) (S3400N, Hitach, Tokyo, Japan) in the Guizhou Key Laboratory of Agricultural Biotechnology.
2.3. Amino Acid Analyses
Amino acid contents of mature maize grains were analyzed using an automatic amino acid analyzer (S-433D, Sykam, Munich, Germany). Approximately 120–150 mg of the dried powder of each sample was weighed and transferred to a glass tube with a cover (20 mL), before 5 mL of HCL (6 M) was added. Each tube was incubated at 110 °C, in a water bath for 24 h. After this was cooled to room temperature, the pH was adjusted to 2.0 and the solution was diluted to a volume to 100 mL using ddH2O. Each sample was then filtered through the membrane (0.45 μm) into the liquid chromatographic sample bottle (2 mL) and used for determination of the contents of 17 free amino acids (FAAs), which were aspartate (Asp), threonine (Thr), serine (Ser), glutamate (Glu), glycine (Gly), alanine (Ala), cysteine (Cys), valine (Val), methionine (Met), isoleucine (Ile), leucine (Leu), tyrosine (Tyr), phenylalanine (Phe), histidine (His), lysine (Lys), arginine (Arg), and proline (Pro).
Tryptophan (Trp) content was measured using a spectrophotometer (Synergy 2, Biotek, Vermont, USA) by reading the absorbance at 590 nm, according to the national standard (GB7650-87 of China). Three replicates were performed for each sample.
2.4. RNA-Sequencing Library Construction and Sequencing
The total RNA of the whole kernels from 18 DAP, 28 DAP, and 38 DAP was isolated using a plant RNA kit (OMEGA), according to manufacturer’s protocol. The concentration and quality of each RNA sample was checked using an Agilent 2100 Bioanalyzer (Agilent Technologies, Palo Alto, CA, USA). The first step in the workflow involves purifying the poly(A)-containing mRNA molecules using poly(T) oligo-attached magnetic beads. After purification, the mRNA was fragmented into small pieces, using divalent cations at a high temperature. The cleaved RNA fragments were used in the synthesis of first strand cDNA, using reverse transcriptase and random primers. This was followed by second strand cDNA synthesis using DNA Polymerase I and RNase H. A single ‘A’ base was then added to these cDNA fragments, followed by subsequent ligation of the adapter. The products were then purified and enriched using PCR amplification. We then quantified the PCR yield by Qubit and pooled samples together to make a single strand DNA circle (ssDNA circle), which gave the final library. DNA nanoballs (DNBs) were generated with the ssDNA circle, by rolling circle replication (RCR), to enlarge the fluorescent signals during the sequencing process. The DNBs were loaded into the patterned nanoarrays and they were read using a single-end read of 50 bp on the BGISEQ-500 platform, for the following data analysis study. For this step, the BGISEQ-500 platform combined the DNA nanoball-based nanoarrays and stepwise sequencing, using the combinatorial probe-anchor synthesis sequencing method. Transcriptome sequencing was carried out on a BGISEQ-500 sequencing platform by Shenzhen Huada Gene Technology Co. Two replicates of each sample were sequenced.
2.5. Identification of Differentially Expressed Genes
In this study, low-quality reads and reads containing adapters or having an unknown base percentage >10% were removed from the original sequencing data, using SOAPnuke soft (v1.5.2,
https://github.com/BGI-flexlab/SOAPnuke) [
28]. The resulting clean reads were aligned to the reference genome (B73 version 4) [
29] using HISAT (v2.0.4, Hierarchical Indexing for Spliced Alignment of Transcripts) [
30] and aligned to the reference gene using Bowtie2 (v2.2.5,
http://bowtie-bio.sourceforge.net/Bowtie2/index.shtml) [
31], to calculate the gene alignment rate. FPKM (fragments per kilobase million) was calculated as the expression level of genes and transcripts by using RSEM software (v1.2.12,
http://deweylab.biostat.wisc.edu/RSEM) [
32]. NOISeq2 [
33] was used to identify differentially expressed genes (DEGs). DEGs were screened according to the following criteria—fold change ≥ 2 and corrected
p ≤ 0.05.
2.6. Gene Ontology and Pathway Enrichment Analysis of Differentially Expressed Genes
Gene Ontology (GO) enrichment analysis provided all GO terms that were significantly enriched in a list of DEGs compared to a genome background, and filtered the DEGs that corresponded to specific biological functions. This method firstly mapped all DEGs to the GO terms in the database (
http://www.geneontology.org/), calculating gene numbers for every term, before using the hypergeometric test to find significantly enriched GO terms in the input list of DEGs. In this study, the calculated
p values were subjected to the Bonferroni correction [
34], and GO terms that were enriched in DEGs were identified, based on
p ≤ 0.05. Typically, functions with FDR ≤ 0.01 were considered to indicate significant enrichment.
Pathway enrichment analysis of DEGs was performed with the guidance of the Kyoto Encyclopedia of Genes and Genomes (KEGG) database (
https://www.genome.jp/kegg/). KEGG pathway enrichment was calculated in the same way as the GO functional enrichment analysis [
35]. In this study, pathways with a
p value ≤ 0.05 and FDR ≤ 0.01 were considered to be significantly enriched in DEGs.
2.7. qRT-PCR Analysis
A total of 28 DEGs were selected for qRT-PCR verification at 18 DAP, 28 DAP, and 38 DAP. The primers, shown in
Table S1, were designed online (
https://sg.idtdna.com/site/account/login?returnurl=%2Fprimerquest%2FHome%2FIndex). Total RNA used for RNA-Seq was reversely transcribed into cDNA, using a Thermo Scientific RevertAid First Stand cDNA Synthesis (BIO-RAD, Hercules, CA, USA). Quantitative analysis was conducted using CFX Connect Real-Time PCR System (BIO-RAD, Hercules, CA, USA), according to the method used by Liu et al. [
36]. Three replicates were used for each sample and actin was used as an internal standard. The 2
−ΔΔCT method was used to calculate relative changes in gene expression.
2.8. Accession Numbers
The raw data of RNA-Seq reads were deposited in the National Center for Biotechnology Information (NCBI) database, under the accession number PRJNA 517535. Biosample accessions were as follows: SAMN10836467, SAMN10836468, SAMN10836469, SAMN10836470, SAMN10836471, SAMN10836472, SAMN10836473, SAMN10836474, SAMN10836475, SAMN10836476, SAMN10836477, and SAMN10836478.
3. Results
3.1. Kernel Characteristics and Submicroscopic Structure
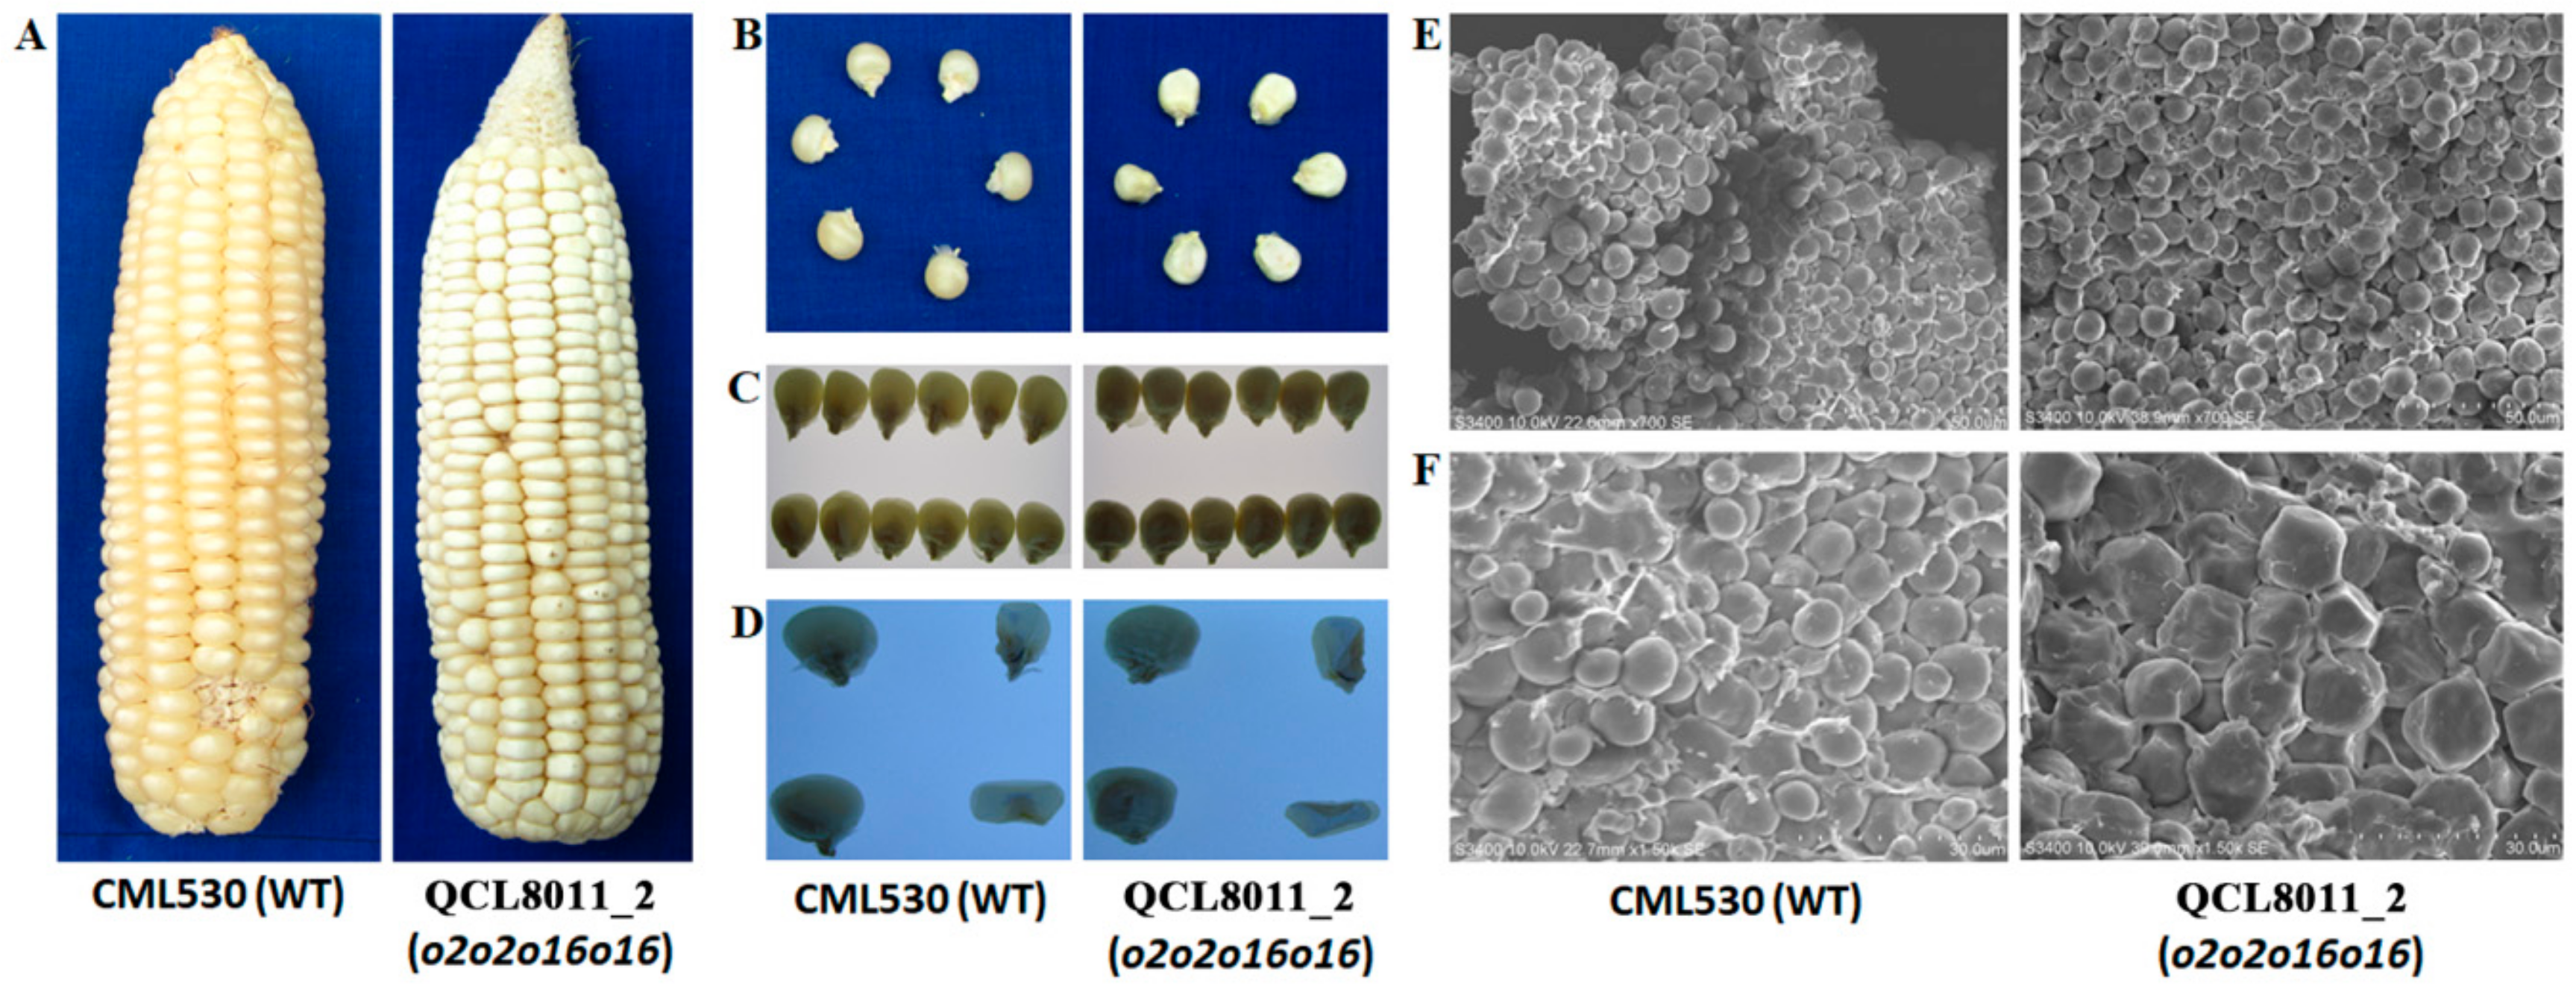
The ear characteristics of the
o2o2o16o16 mutant line, QCL8011_2, and its recurrent parent CML530 were observed under natural light, while the phenotypes and cross-sections of the kernels were observed under projected light. The ear of QCL8011_2 was a cylindrical type (
Figure 1A), the kernel was dull and basically opaque (
Figure 1B,C) and the endosperm was farinaceous (
Figure 1D). The kernel of CML530 showed a smooth and shiny seed coat, a full keratinous endosperm, and a vitreous seed (
Figure 1B–D).
Scanning electron microscopy (SEM) showed that the starch granules of QCL8011_2 were mostly irregular in shape and slightly larger in size than that of CML530. There was a high density of matrix proteins that were scattered with the starch granules in the gap. The endosperm starch granules of CML530 were mostly ellipsoidal or spheroidal, with a low density of matrix proteins that encapsulated starch granules (
Figure 1E,F).
3.2. Changes of Free Amino Acids Composition in o2o2o16o16 Endosperm
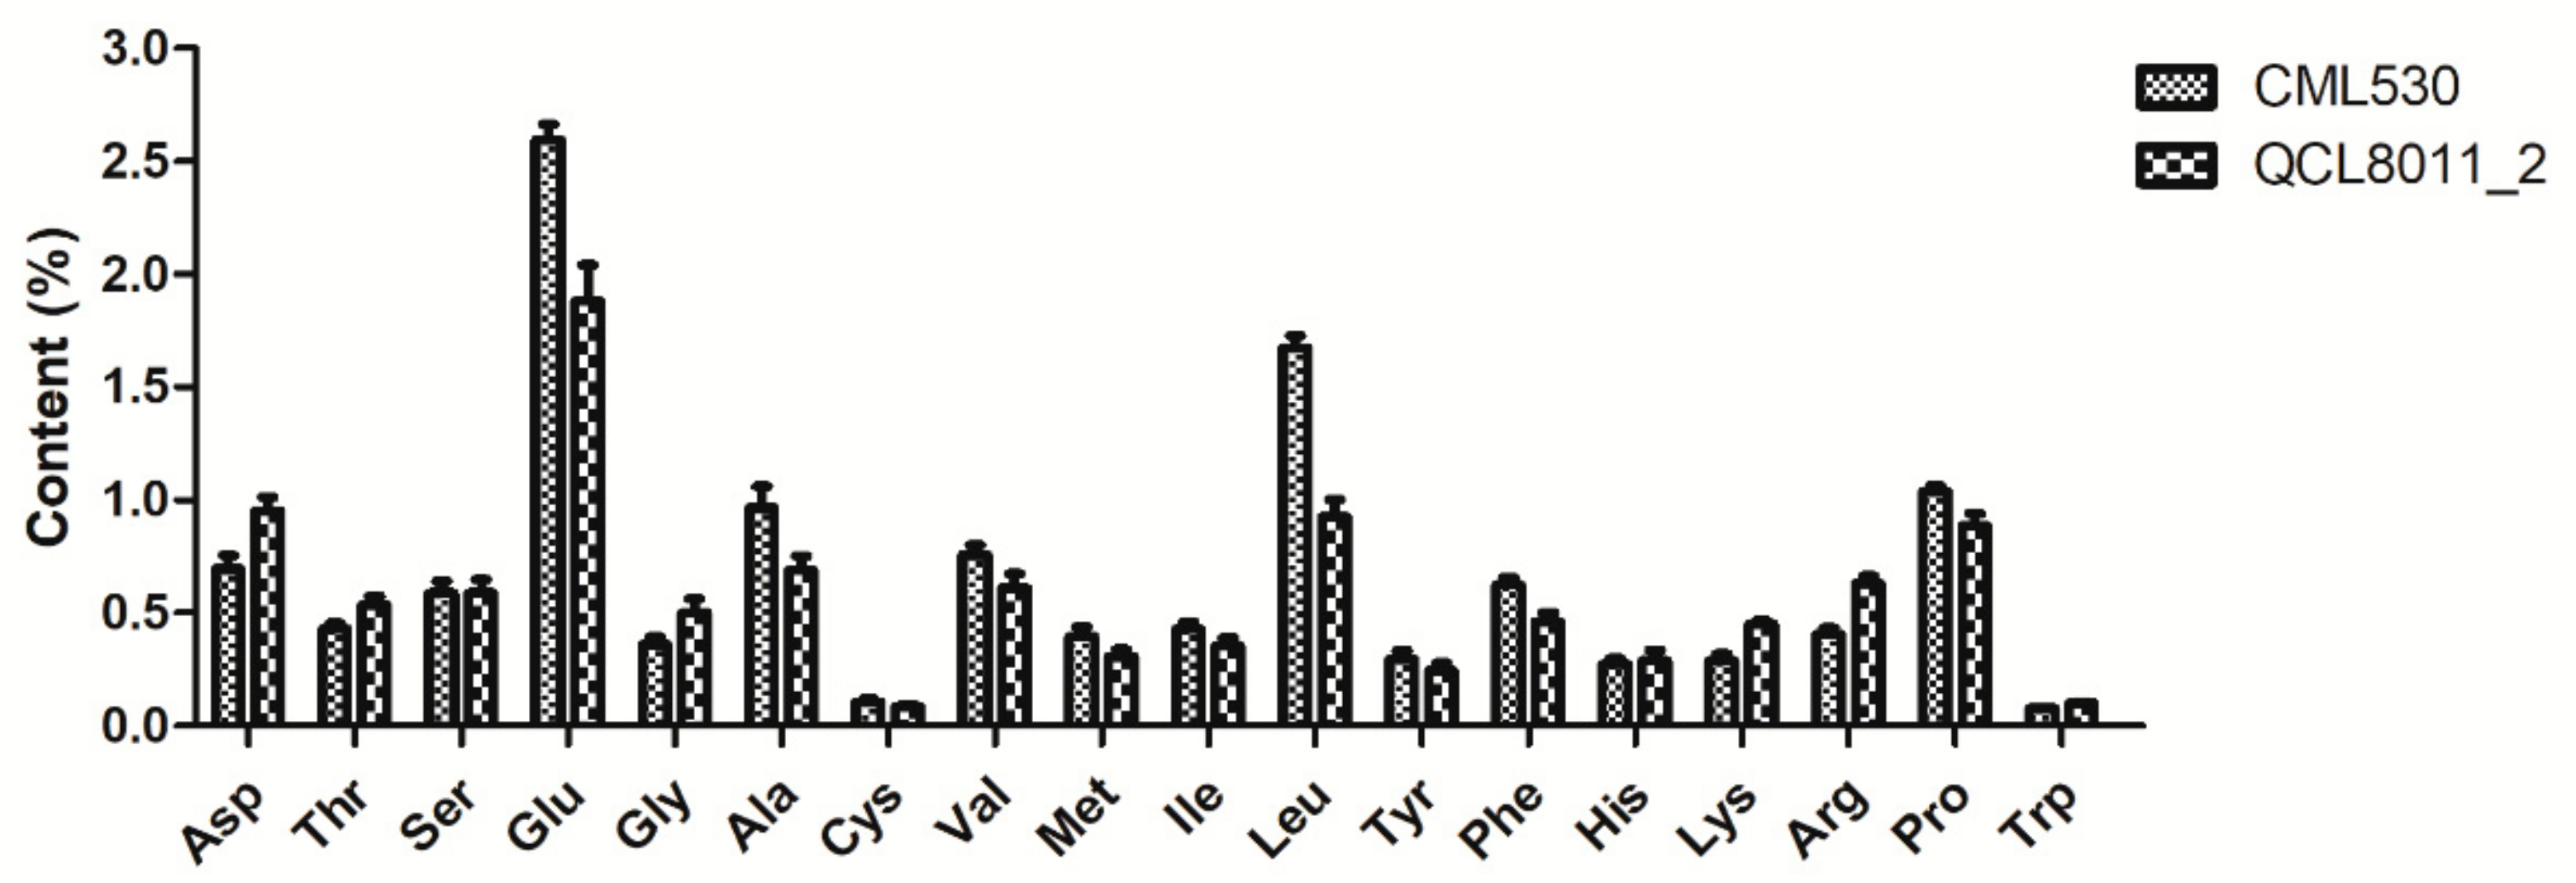
Compared with CML530, the contents of all 17 FAAs changed to different degrees in the QCL8011_2 mutant line.
Figure 2 shows that Asp, Thr, Ser, Gly, His, Lys, and Arg contents were higher in QCL8011_2. Among them, Lys, Arg, Gly, Asp, and Trp greatly increased by 56.08%, 55.16%, 38.75%, 36.96%, and 22.17%, respectively. However, Leu, Ala, Glu, Phe, Met, Val, Cys, Ile, Tyr, and Pro contents were decreased. Among them, Leu, Ala, Glu, Phe, and Met greatly decreased by 44.65%, 28.57%, 27.63%, 26.30%, and 22.55%, respectively.
3.3. The Quality of RNA-Sequencing
To dissect the regulation network of the
o2o2o16o16 line, kernels (18 DAP, 28 DAP, and 38 DAP) of the QCL8011_2 and CML530 were used for the RNA-Seq analysis. Two biological replicates were used in this study. For each replicate, we generated 23,984,698 clean reads on average (
Table S2). A total of 86.76% clean reads were successfully aligned to the maize B73 reference genome (
Zea mays L. AGPv4.38) and 81.27% clean reads were distributed in the gene regions (
Table S3). The average Q20 and Q30 (the percentage of the number of bases with sequencing base mass value greater than 20 or 30, respectively, out of the total number of bases in the original data) of all samples were 97.58% and 90.17%, respectively (
Table S4).
More than 29,000 genes were detected in each sample, which corresponded to more than 70% of the total number of genes (
Figure S1 and
Table S5). The correlation coefficients among the two sequencing repeats were more than 0.95 (
Figure S2), which indicated that the transcriptome sequencing data in all samples were highly reliable and, thus, suitable for analyzing differentially expressed genes.
3.4. Identification of Differentially Expressed Genes
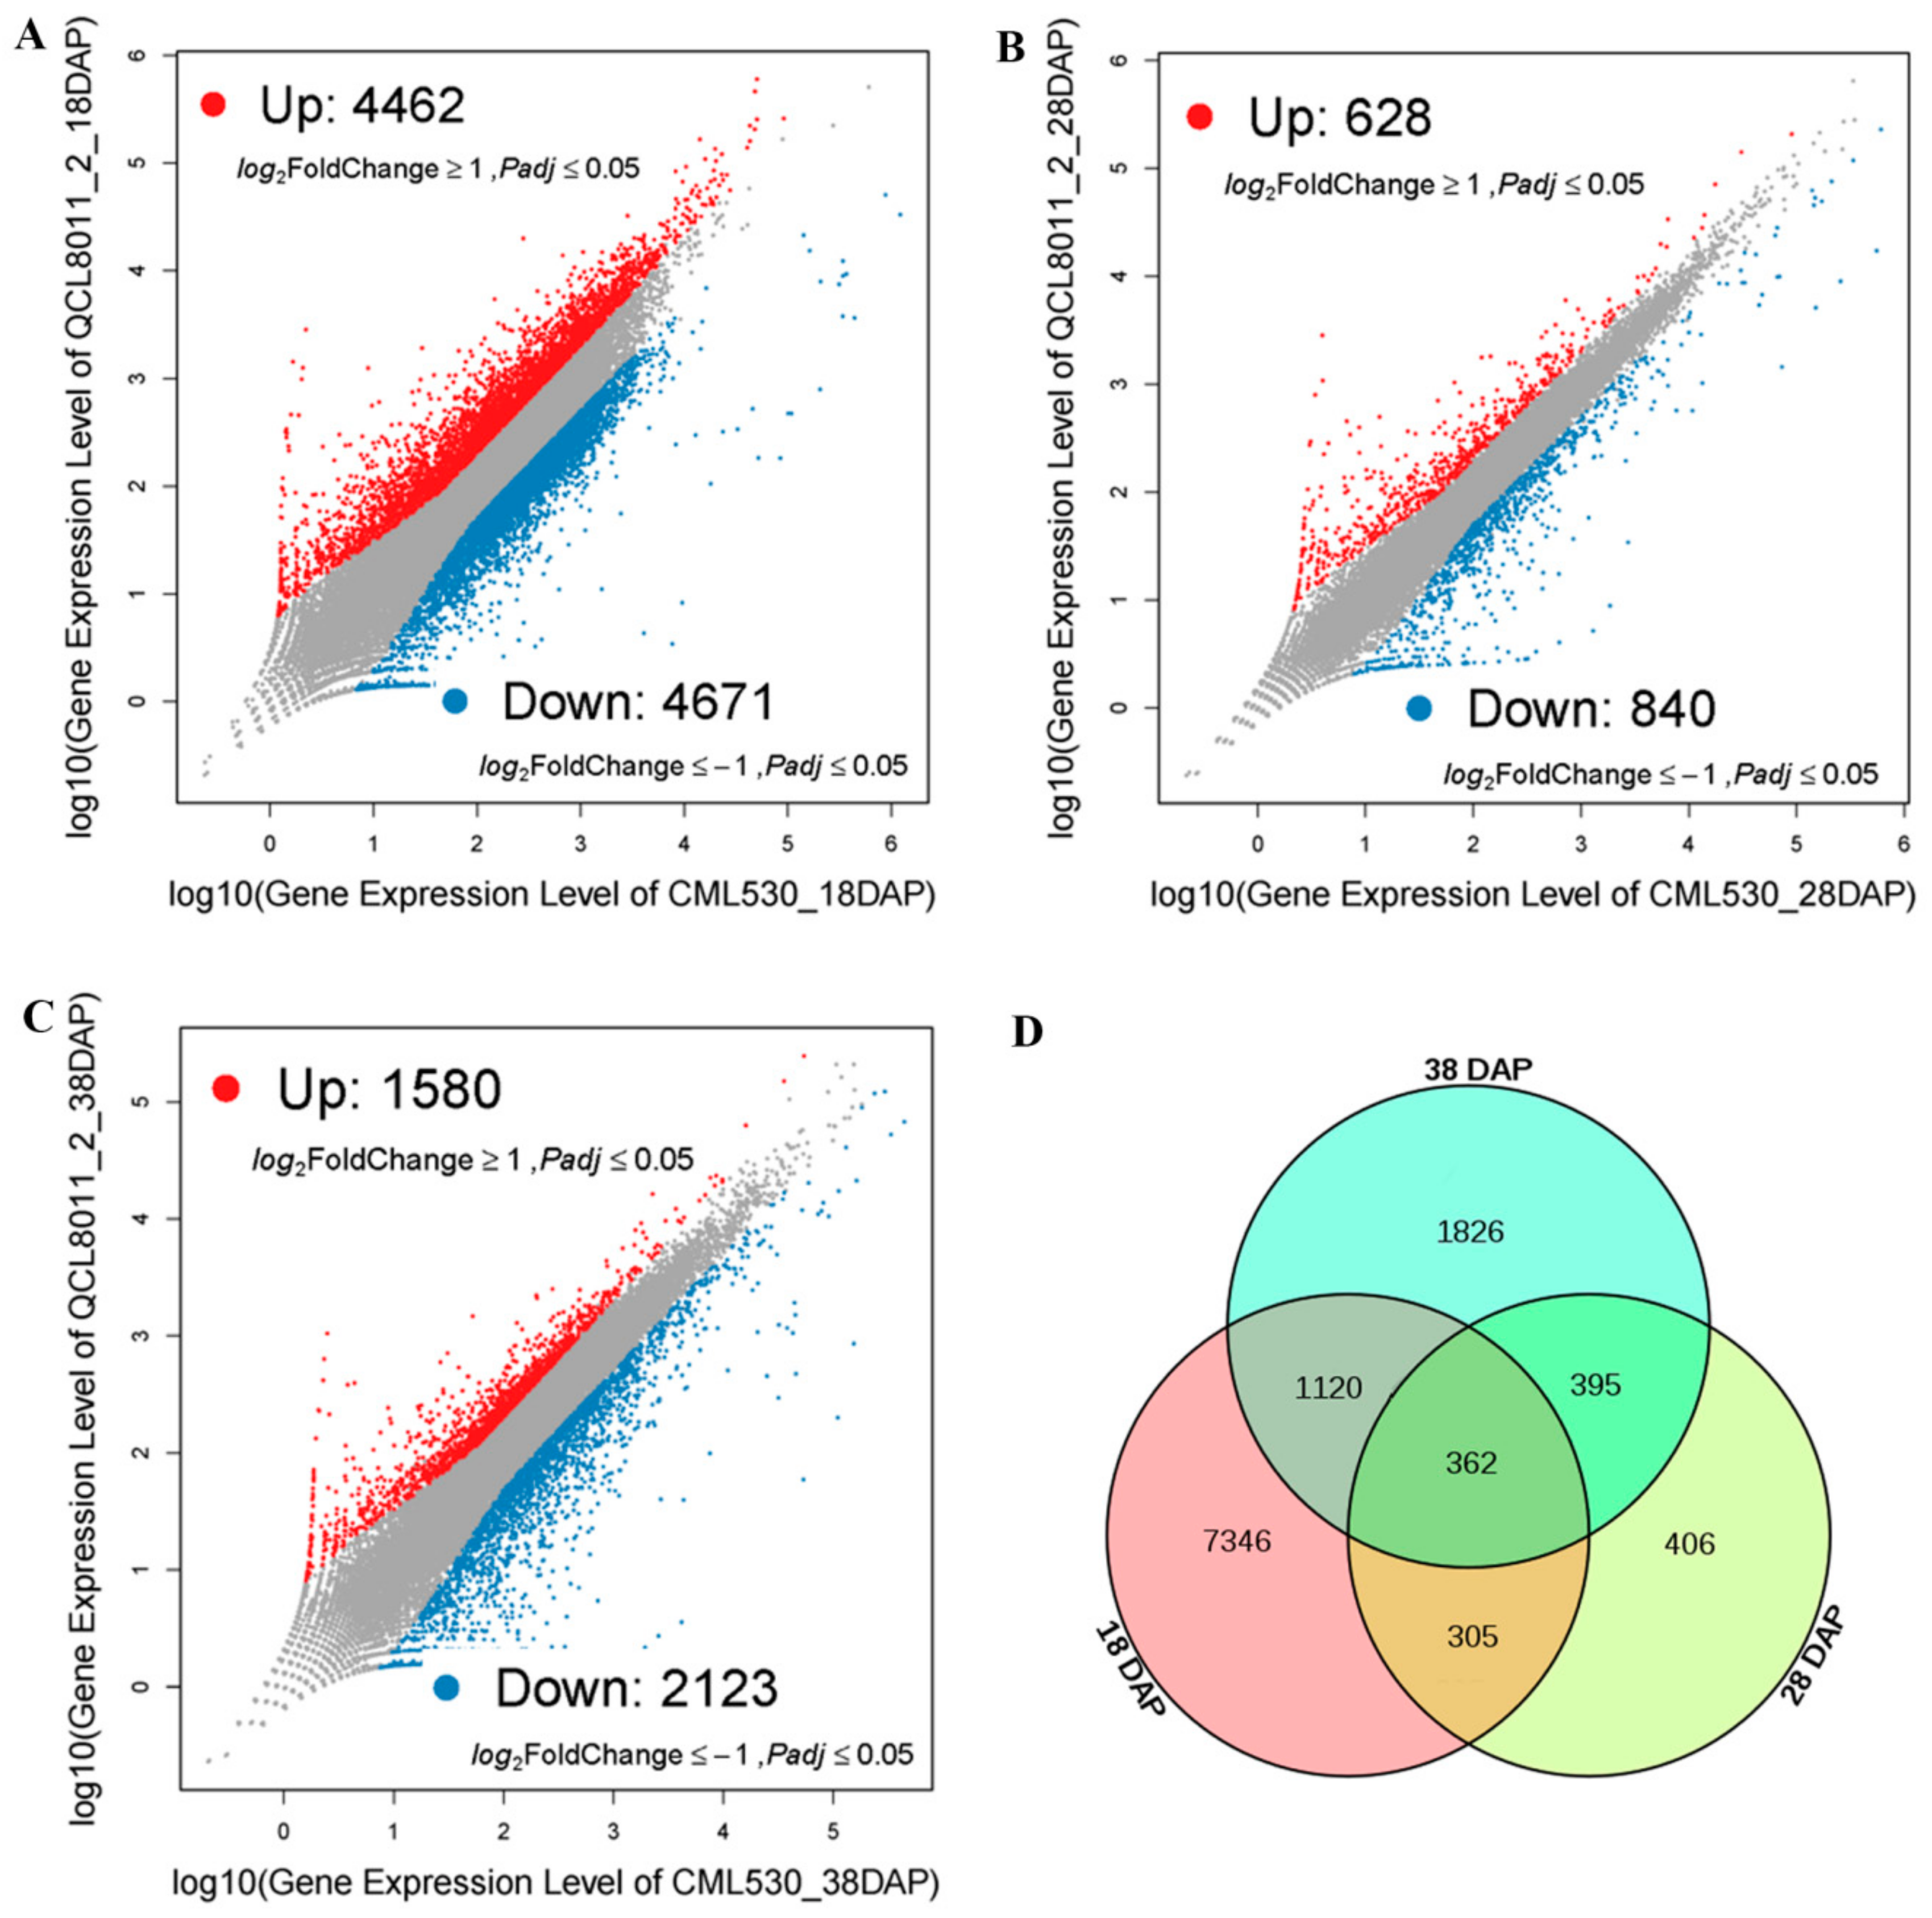
To identify significantly DEGs, we compared the transcript abundance in QCL8011_2 relative to CML530, using the NOISeq software. Compared with CML530, 9,133 genes were differentially expressed in QCL8011_2 at 18 DAP, among which 4,462 were upregulated and 4,671 were downregulated (
Figure 3A). A total of 1,468 genes were differentially expressed in QCL8011_2 at 28 DAP, among which 628 were upregulated and 840 were downregulated (
Figure 3B). A total of 3,703 genes were differentially expressed in QCL8011_2 at 38 DAP, among which 1,580 were upregulated and 2,123 were downregulated (
Figure 3C). A total of 667 DEGs were detected at both 18 DAP and 28 DAP, 757 DEGs were found at both 28 DAP and 38 DAP, 1,482 DEGs at both 18 DAP and 38 DAP, and 362 DEGs were detected at all three 18 DAP, 28 DAP, and 38 DAP (
Figure 3D).
3.5. Functional Annotations of Differentially Expressed Genes
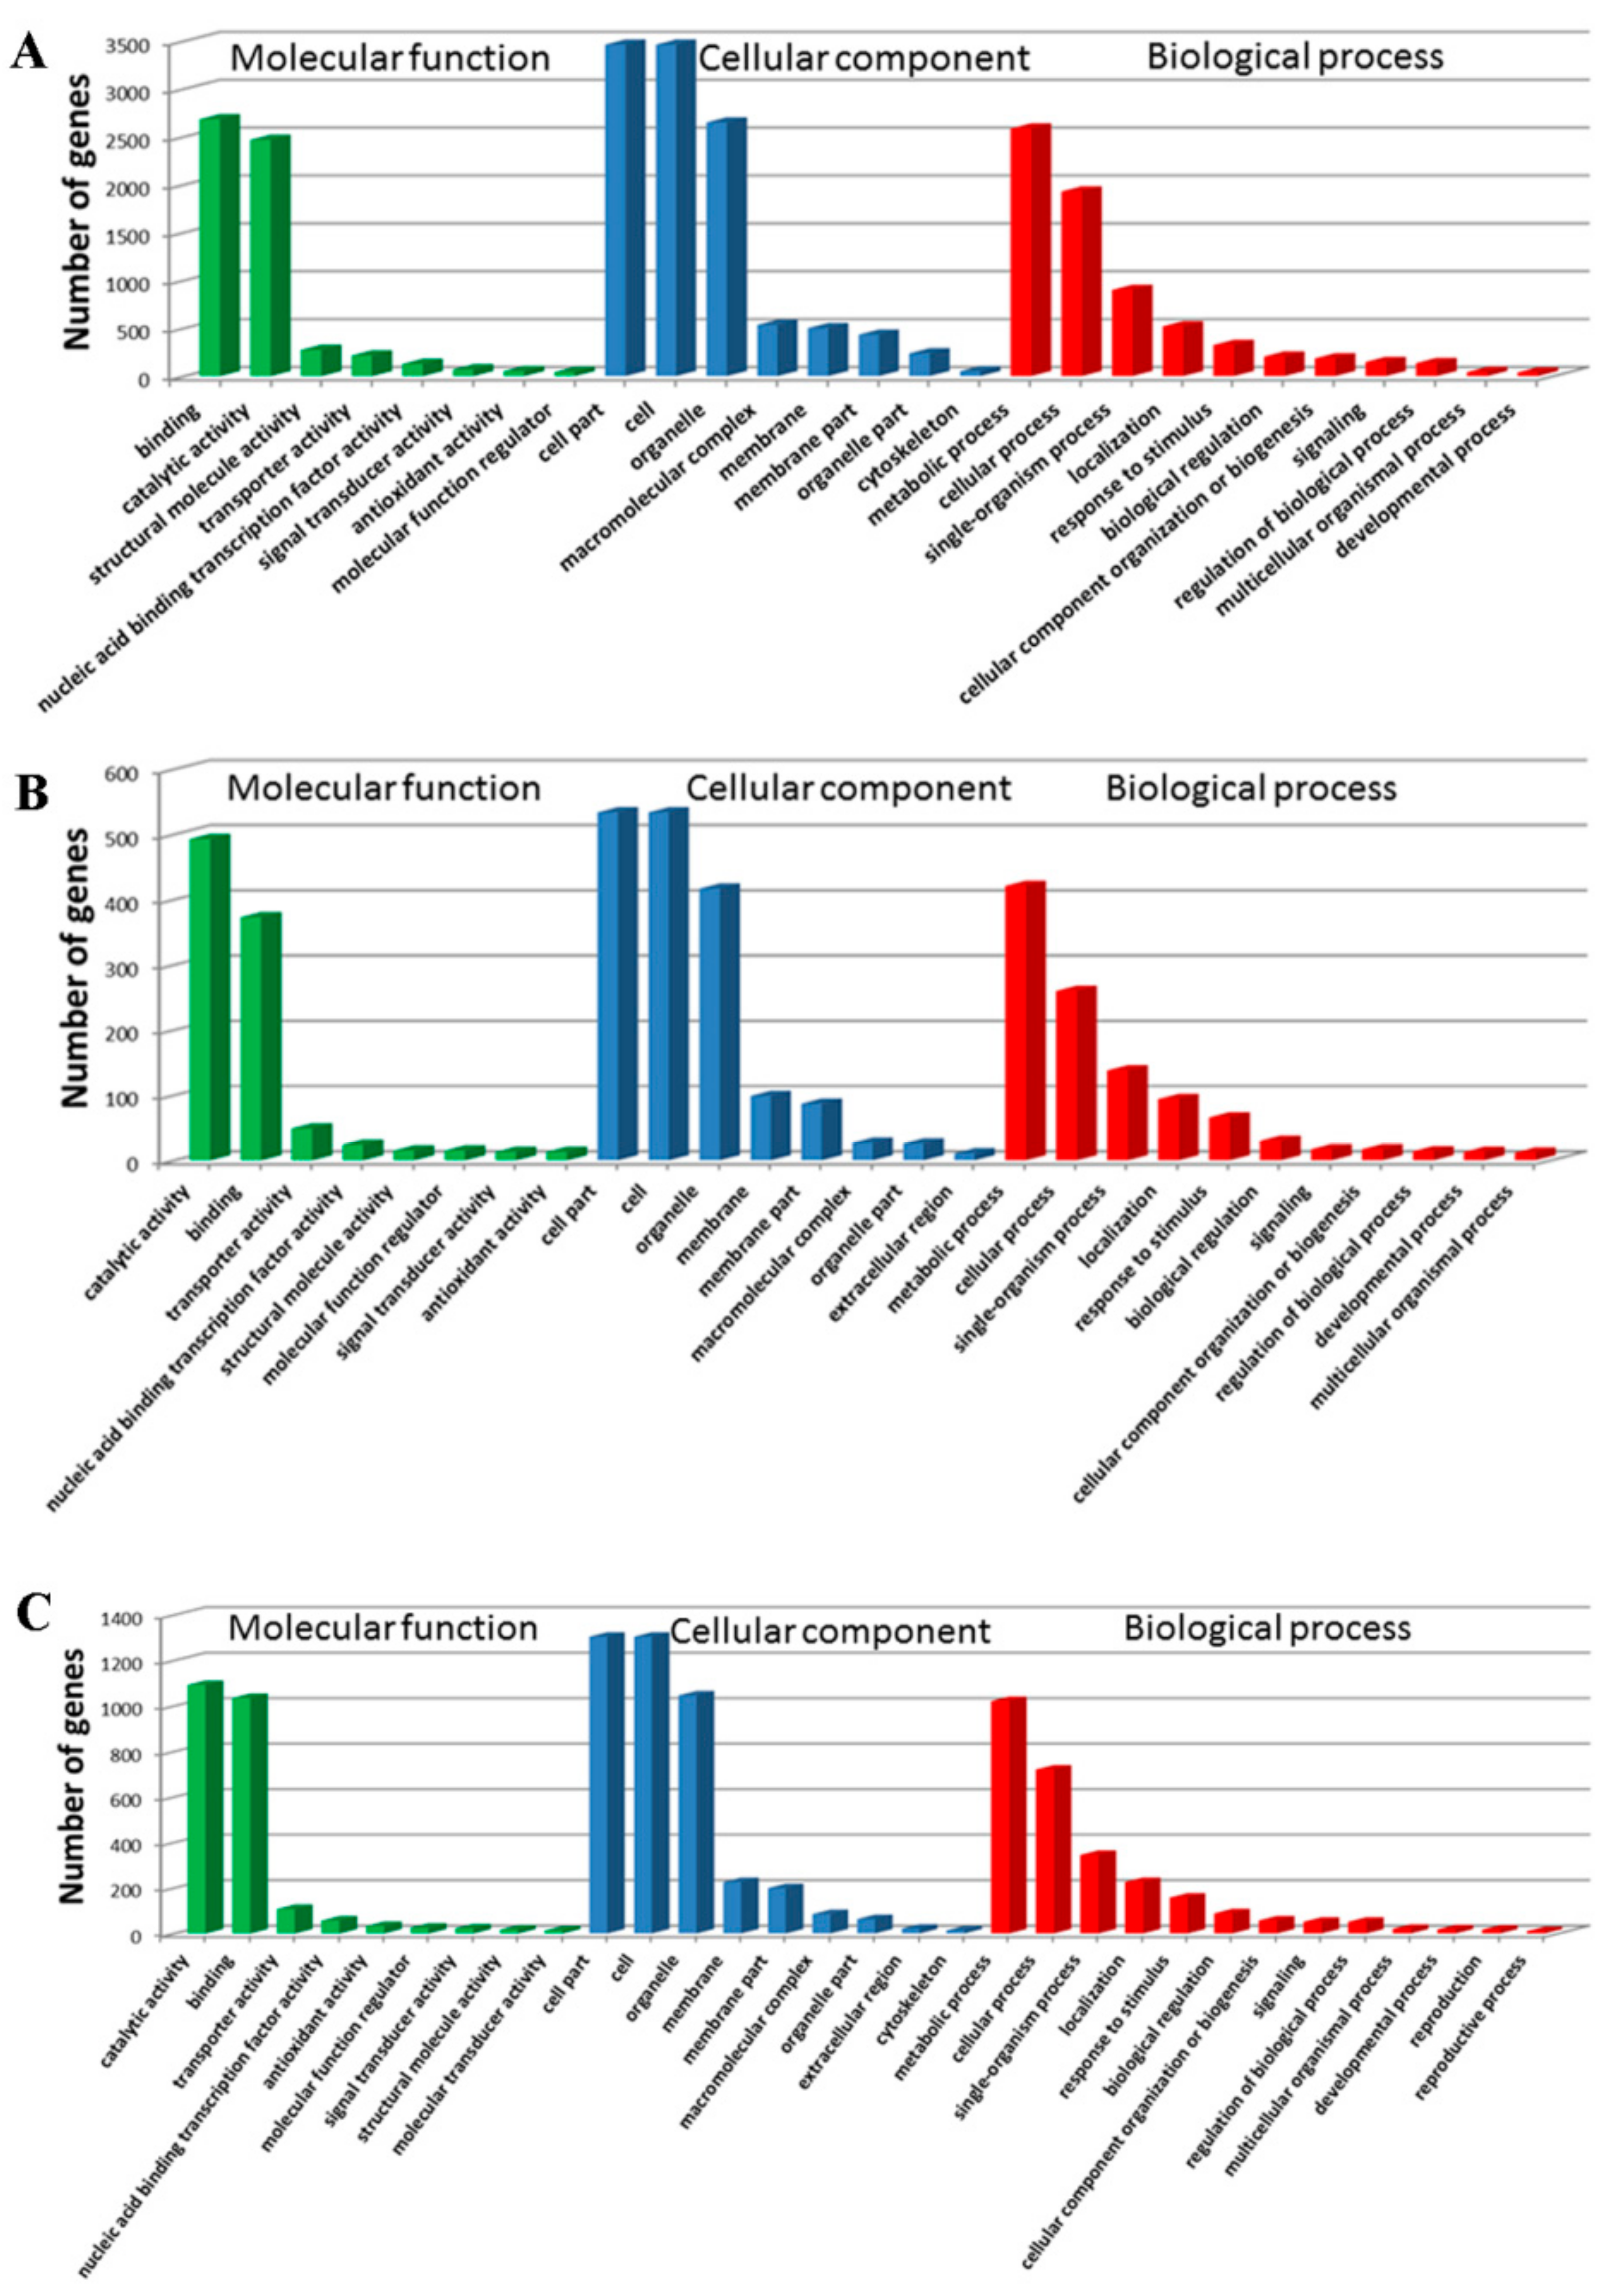
The WEGO software was used to classify the DEGs at 18 DAP, 28 DAP, and 38 DAP into GO functional categories related to the biological process (BP), cellular component (CC), and molecular function (MF). At 18 DAP, a total of 5,639 DEGs were classified into 20 terms (BP), 11 terms (CC), and 11 terms (MF) (
Figure 4A). At 28 DAP, a total of 944 DEGs were classified into 18 terms (BP), 11 terms (CC), and 10 terms (MF) (
Figure 4B). At 38 DAP, a total of 2,240 DEGs were classified into 18 terms (BP), 11 terms (CC), and 11 terms (MF) (
Figure 4C). In BP, the DEGs were mainly enriched in metabolic process (GO: 0008152) and cellular process (GO: 0009987). In CC, the DEGs were mainly enriched in the cell (GO: 0005623), cell part (GO: 0044464), and organelle (GO: 0043226). In MF, the DEGs were mainly enriched in binding (GO: 0005488) and catalytic activity (GO: 0003824).
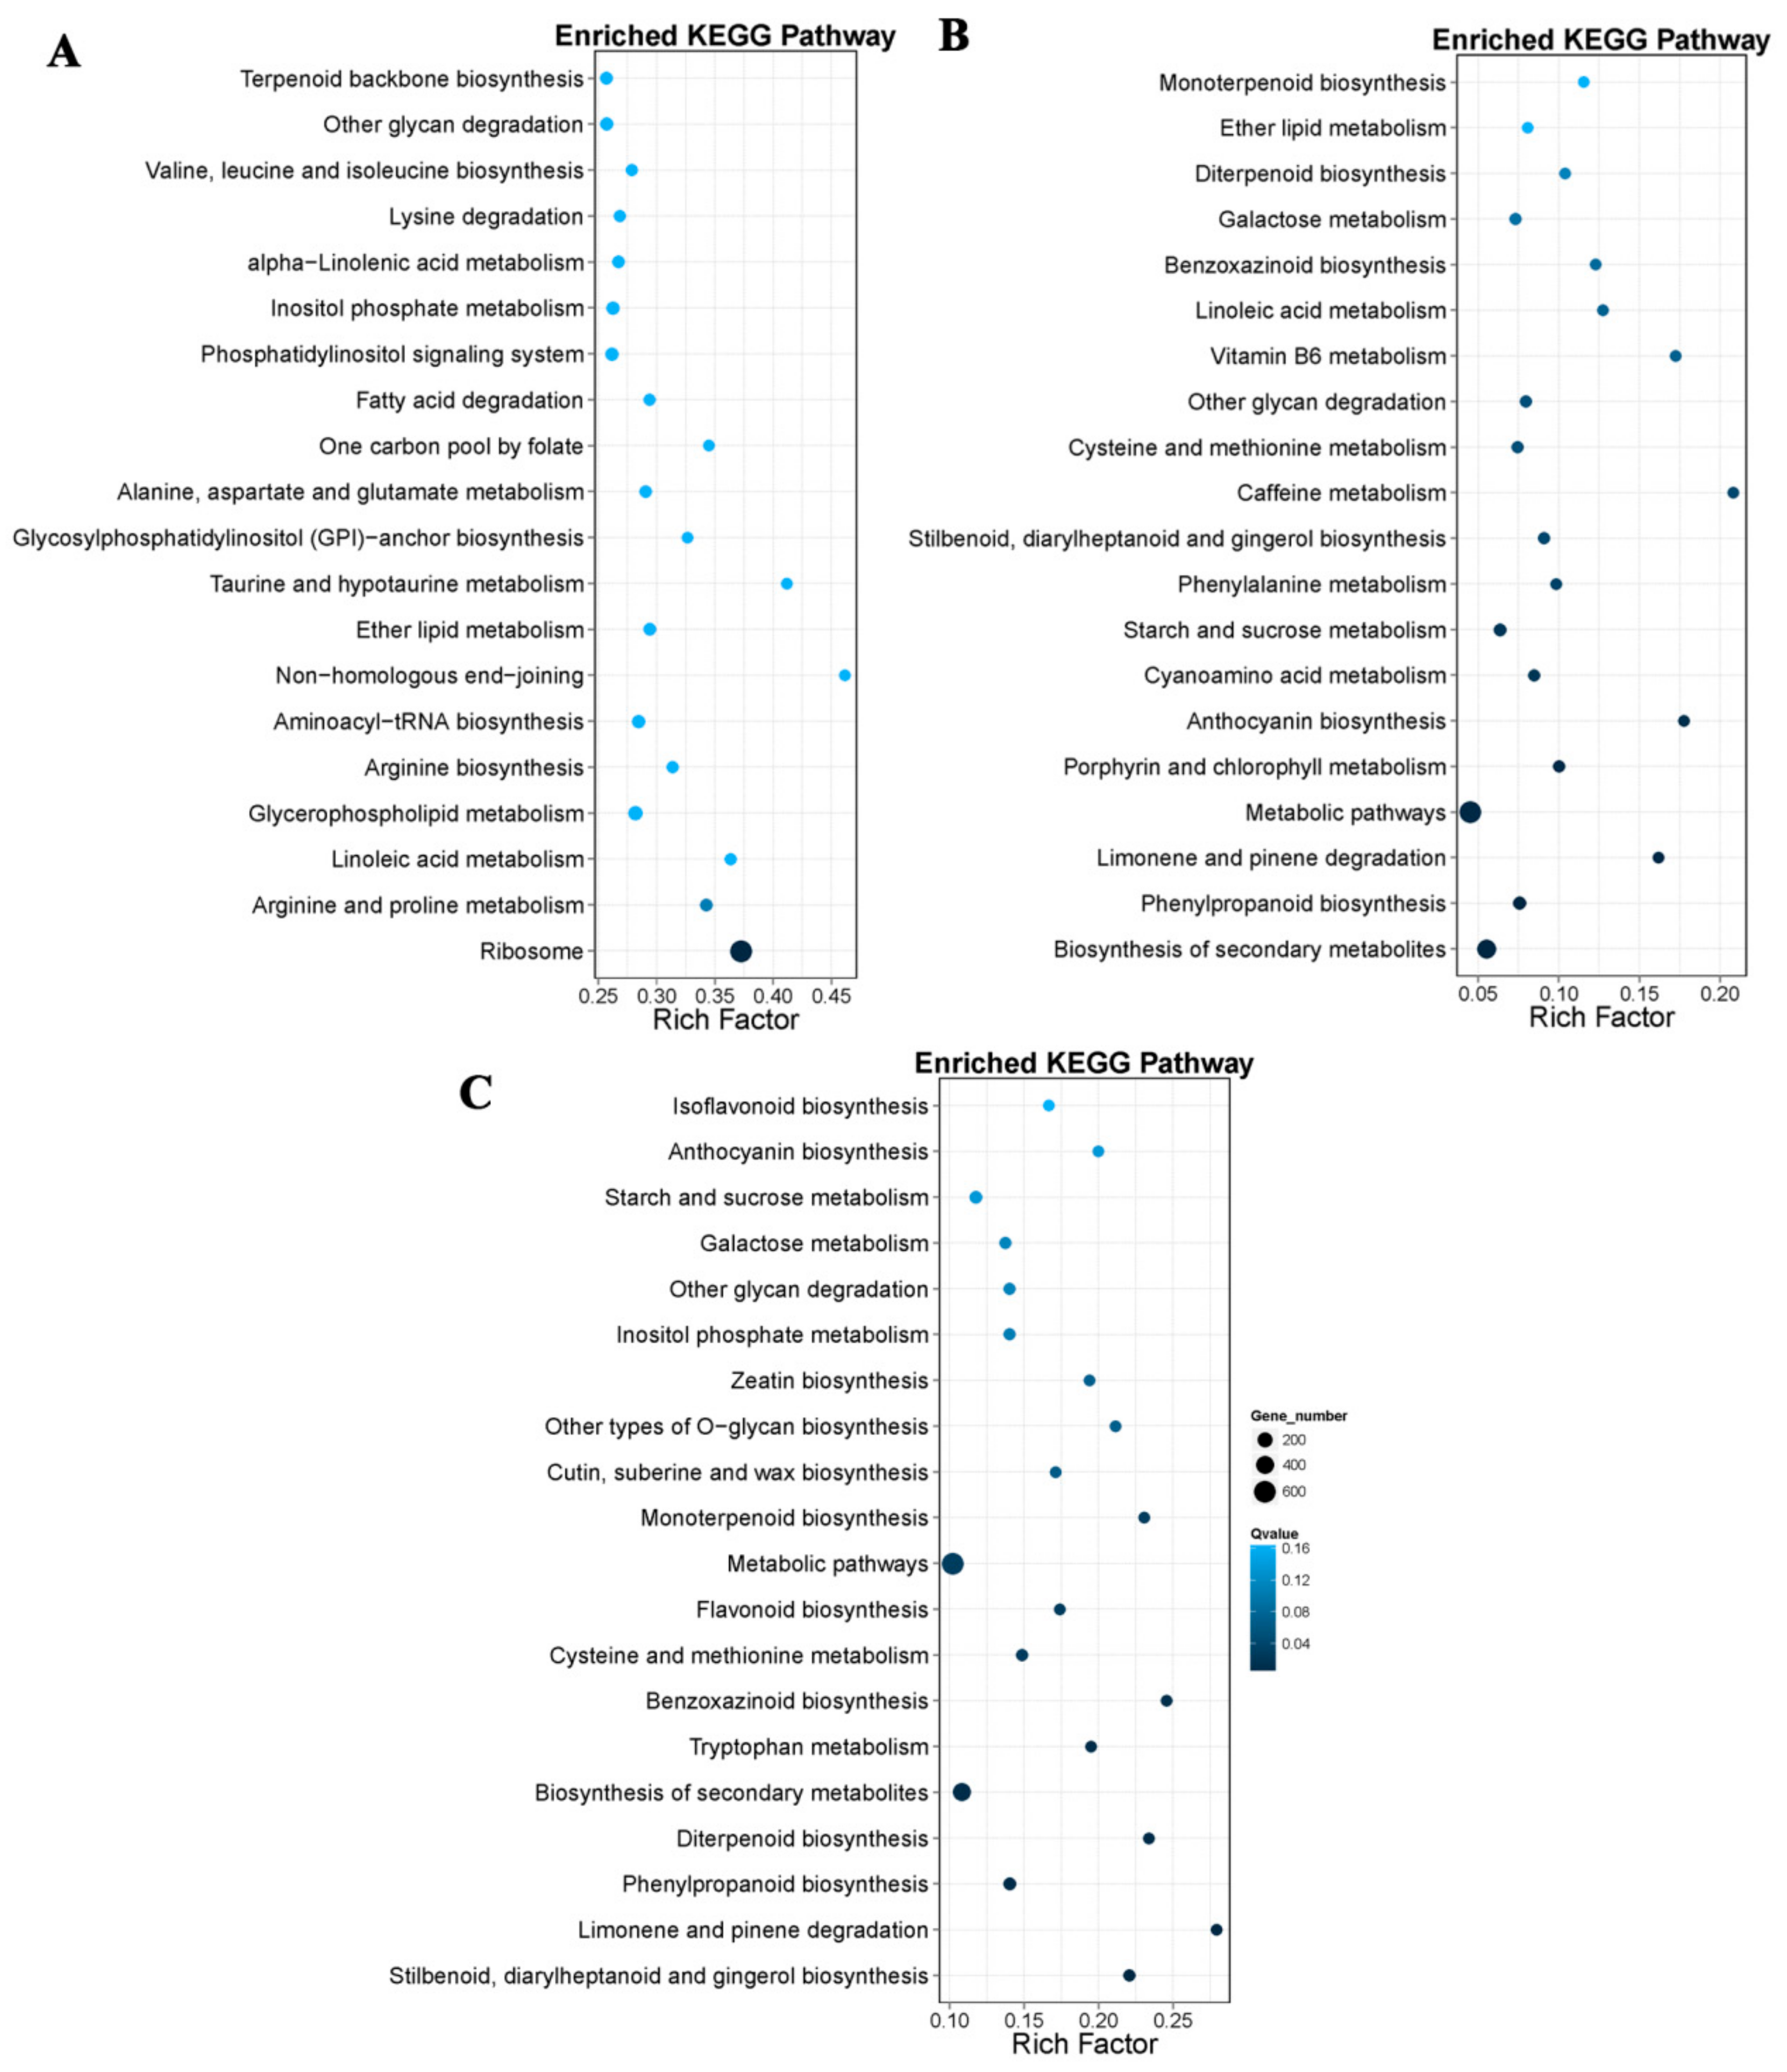
For further functional characterization of DEGs, we analyzed the pathway enrichment in DEGs based on the KEGG database. At 18 DAP, 28 DAP, and 38 DAP, 3,547, 608, and 1,406 DEGs were annotated into 19 pathways, respectively, and most genes were annotated as related to the metabolism. Among the DEGs related to the metabolic pathways, 297 DEGs were related to the amino acid metabolism at 18 DAP, and 46 DEGs were involved in lysine metabolism, 23 DEGs were involved in tryptophan metabolism (
Figure 5A). A total of 69 DEGs were related to amino acid metabolism at 28 DAP, 8 DEGs involved in lysine metabolism, and 10 DEGs involved in tryptophan metabolism (
Figure 5B). Of the 135 DEGs related to amino acid metabolism at 38 DAP, 23 DEGs were involved in lysine metabolism and 24 DEGs were involved in tryptophan metabolism (
Figure 5C).
3.6. Differentially Expressed Genes Involved in Lysine Metabolism
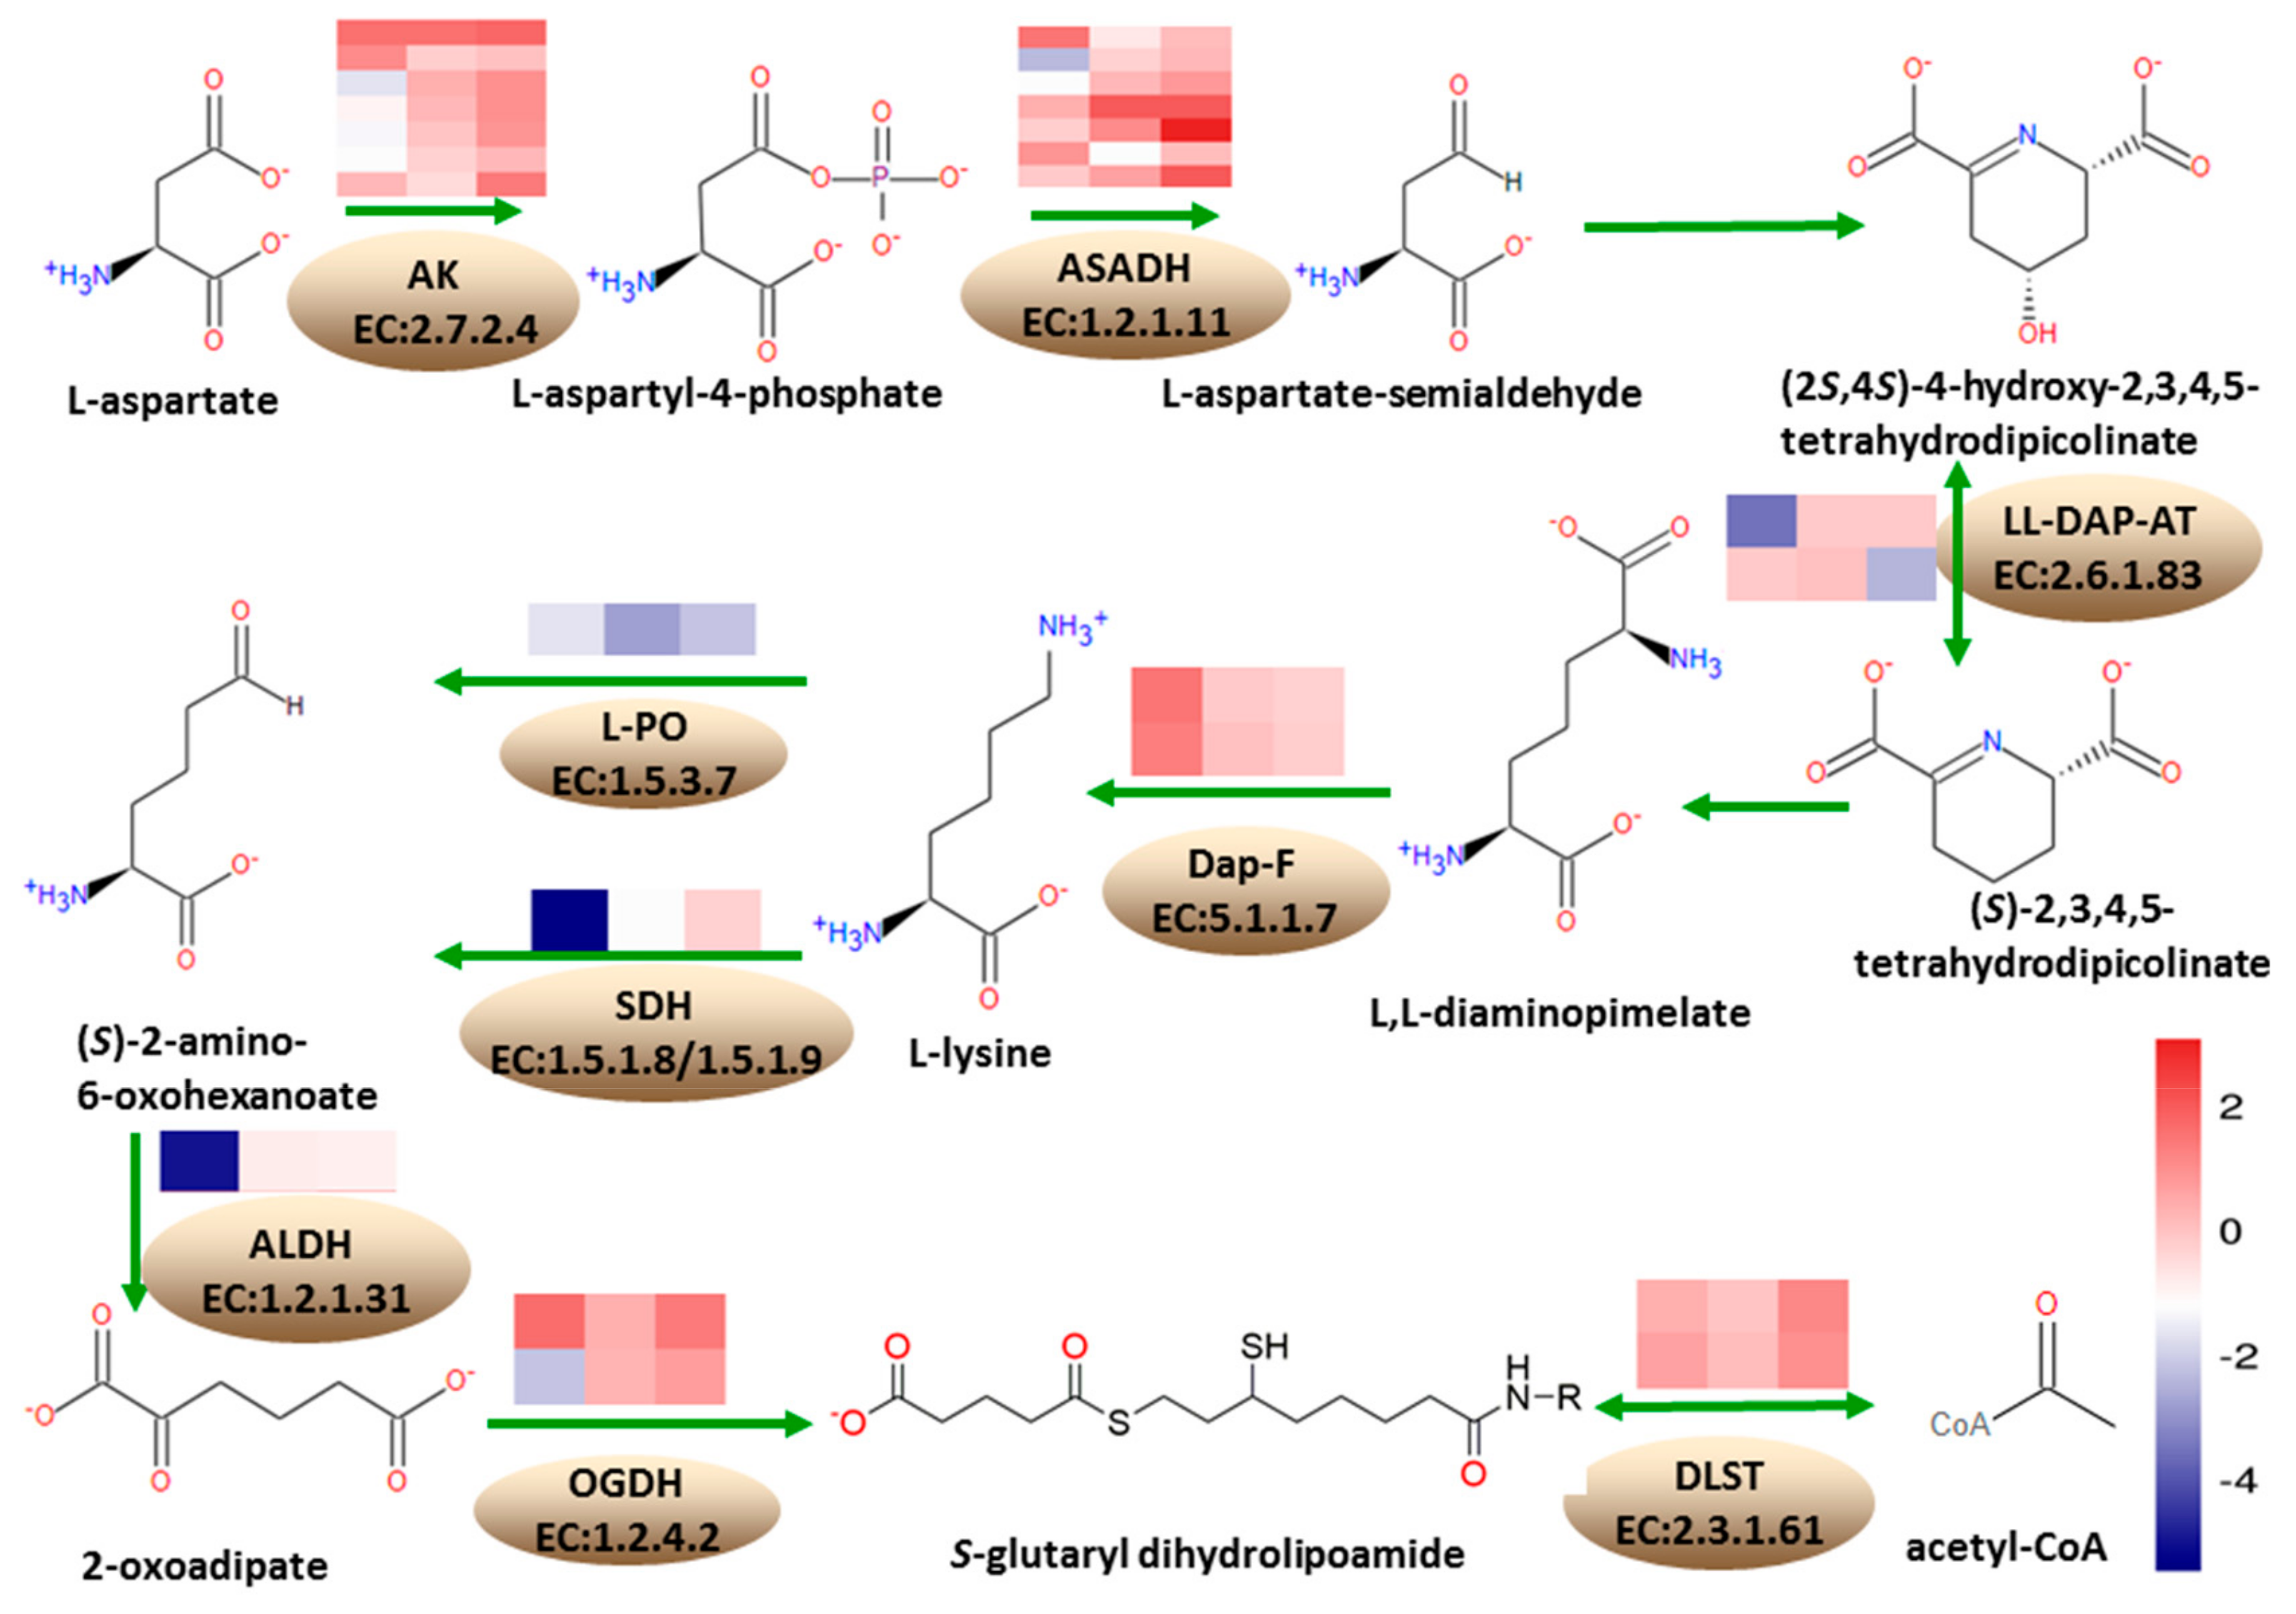
According to the KEGG annotation results, at 18 DAP, 13 DEGs were annotated into the lysine biosynthesis pathway, with five being upregulated and eight downregulated. A total of 33 DEGs were annotated into the lysine degradation pathway, where four were upregulated while 29 were downregulated. At 28 DAP, three DEGs were annotated into lysine biosynthesis pathway, where two were upregulated and one was downregulated. Five DEGs were annotated into lysine degradation pathways, where two were upregulated and three were downregulated. At 38 DAP, five DEGs were annotated into lysine biosynthesis pathway, where four were upregulated and one was downregulated. A total of 18 genes were annotated into lysine degradation, where 14 were upregulated while four were downregulated (
Figure 6).
Under the lysine biosynthesis metabolism, seven DEGs encode aspartate kinase (AK, EC: 2.7.2.4), involved in the conversion of L-aspartate to L-aspartyl-4-phosphate, in the first step of lysine biosynthesis pathway; of these, Zm00001d050134, Zm00001d021142, Zm00001d050133, and Zm00001d005151, were downregulated at 18 DAP. Furthermore, Zm00001d042471 and Zm00001d023278 were upregulated while Zm00001d005535 gene was upregulated at 38 DAP. A total of seven DEGs encoded the aspartate-semialdehyde dehydrogenase (ASADH, EC: 1.2.1.11), involved in the conversion of L-aspartyl-4-phosphate to L-asparte-4-semialdehyde in the lysine biosynthesis pathway, and Zm00001d042275 was upregulated at 18 DAP, while Zm00001d033836 and Zm00001d052231 were downregulated. At 28 DAP, Zm00001d012847 was downregulated, while Zm00001d034765 was upregulated. Zm00001d009968 and Zm00001d033837 were upregulated at 38 DAP. Zm00001d008615 and Zm00001d028165, encoding L,L-diaminopimelate aminotransferase (L,L-DAP-AT, EC: 2.6.1.83) involved in the conversion of (2S,4S)-4-hydroxy-2,3,4,5-tetrahydrodipicolinate to (S)-2,3,4,5-tetrahydrodipicolinate, were downregulated at 28 DAP and 38 DAP, respectively. Zm00001d030677 and Zm00001d041575, encoding diaminopimelate epimerase (Dap-F, EC: 5.1.1.7) involved in the conversion of L,L-2,6-diaminopimelate to meso-diaminopimelate, were upregulated at 18 DAP.
Under the lysine degradation metabolism, Zm00001d052079, encoding saccharopine dehydrogenase (SDH, EC: 1.5.1.8/1.5.1.9) involved in the conversion of lysine to (S)-2-aminoadipate-6-semialdehyde in the lysine degradation pathway, was downregulated at 18 DAP and 28 DAP, while Zm00001d020984 encoding L-pipecolate oxidase (L-PO, EC: 1.5.3.7) was downregulated at 18 DAP, 28 DAP, and 38 DAP. Zm00001d050495 encoding aldehyde dehydrogenase family seven member A1 (ALDH, EC: 1.2.1.31) in the conversion of 2-aminoadipate-6-semialdehyde to L-2-aminoadipate was downregulated at 18 DAP. Zm00001d023552 encoding 2-oxoglutarate dehydrogenase (OGDH, EC: 1.2.4.2) in the conversion of 2-oxoadipate to S-glutaryl-dihydrolipoamide was upregulated at 18 DAP and 38 DAP, while Zm00001d021889 was downregulated at 18 DAP. Zm00001d003923 and Zm00001d025258 encoding dihydrolipoamide succinyltransferase (DLST, EC: 2.3.1.61) in the conversion of S-glutaryl-dihydrolipoamide to glutaryl-CoA were upregulated.
3.7. Differentially Expressed Genes Involved in the Tryptophan Metabolism
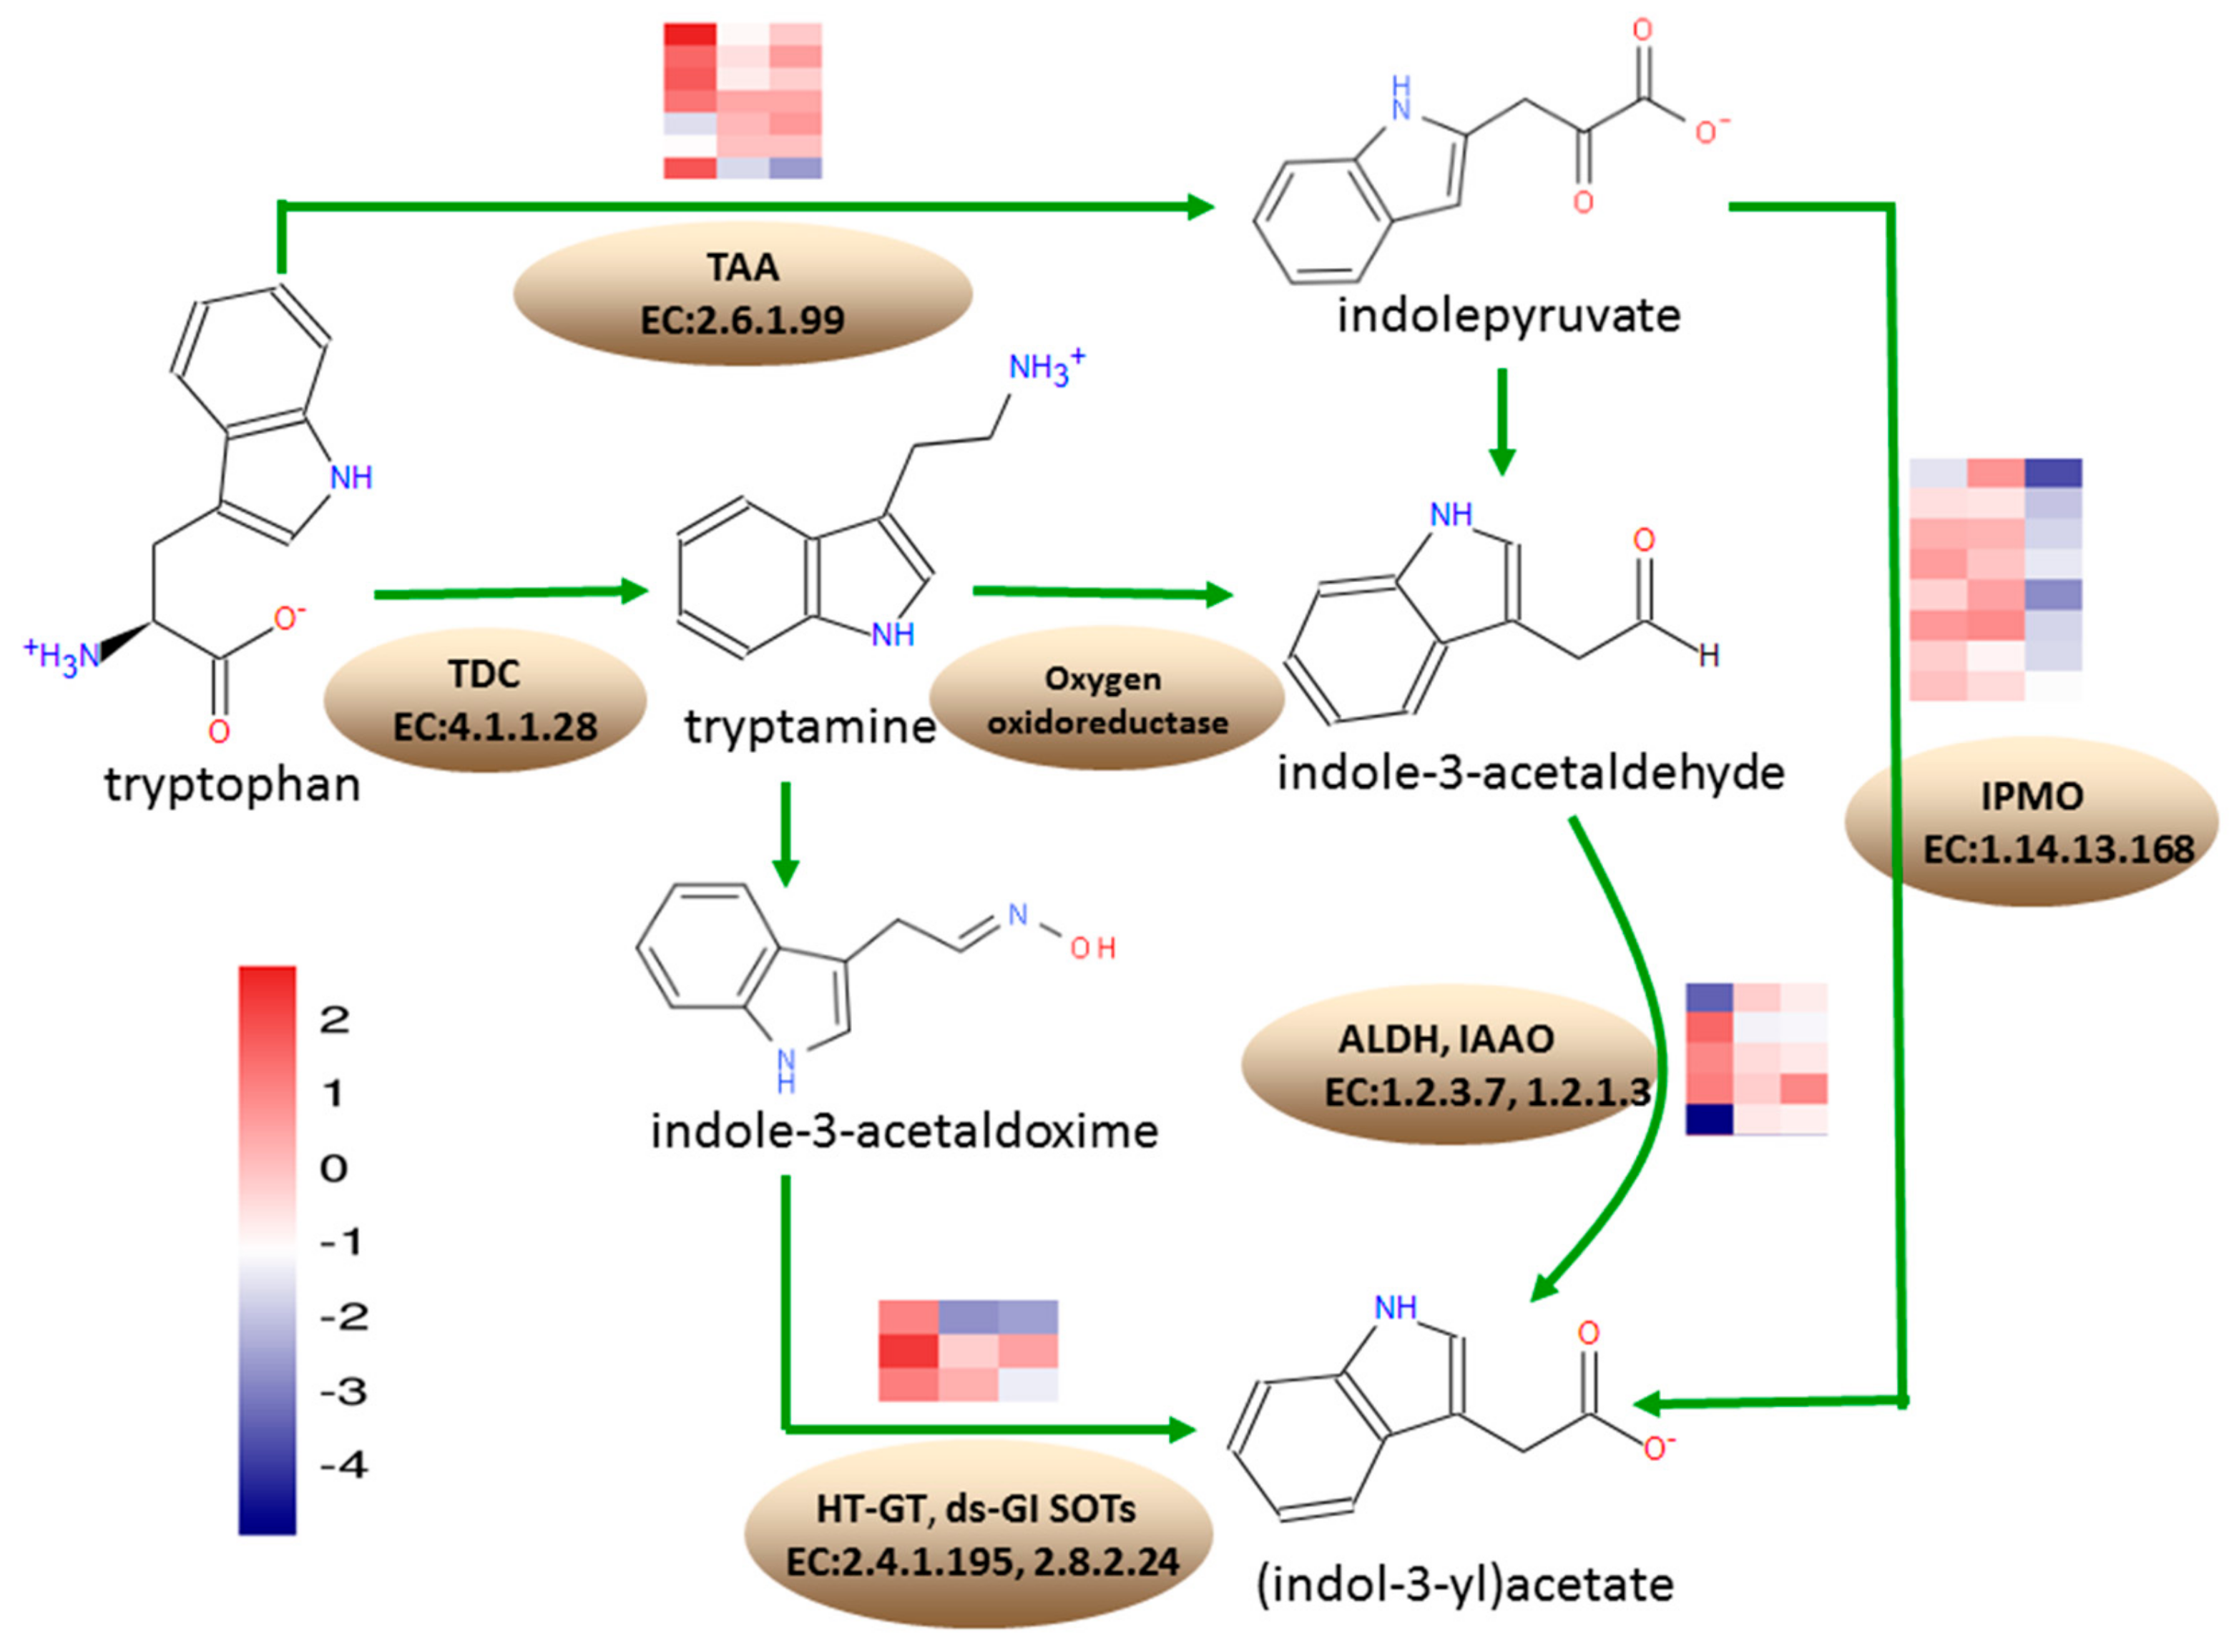
According to the KEGG annotation results, at 18 DAP, 23 DEGs were annotated into the tryptophan metabolism pathway, where 13 were upregulated and 10 DEGs were downregulated. At 28 DAP, 10 DEGs were annotated into the tryptophan metabolism pathway, which were all downregulated. At 38 DAP, 24 DEGs were annotated into tryptophan metabolism pathway, where one DEG was upregulated and 23 DEGs were downregulated (
Figure 7).
Under tryptophan metabolism, eight DEGs encoding L-tryptophan-pyruvate aminotransferase (TAA, EC: 2.6.1.99), involved in the conversion of tryptophan to indolepyruvate, Zm00001d037674, Zm00001d043650, Zm00001d037498, and Zm00001d008700, were upregulated at 18 DAP, while Zm00001d012728 and Zm00001d008708 were downregulated. Zm00001d011562 and Zm00001d037674 were downregulated at 28 DAP. Zm00001d043651 was downregulated at 38 DAP. A total of four DEGs encoding aldehyde dehydrogenase (ALDH, EC: 1.2.1.3), involved in the conversion of indole-3-acetaldehyde to indoleacetate, Zm00001d023580 and Zm00001d025958, were upregulated at 18 DAP, while Zm00001d050495 was downregulated. Zm00001d004731 was upregulated at 18 DAP but downregulated at 28 DAP and 38 DAP. Zm00001d034388, encoding indole-3-acetaldehyde oxidase (IAAO, EC: 1.2.3.7) involved in the conversion of indole-3-acetaldehyde to indoleacetate, was downregulated at 18 DAP. The 8 DEGs encoding indole-3-pyruvate monooxygenase (IPMO, EC: 1.14.13.168), involved in the conversion of indolepyruvate to indoleacetate, were downregulated at 38 DAP. Zm00001d043165 encoding N-hydroxythioamide S-beta-glucosyltransferase (HT-GT, EC: 2.4.1.195), involved in the conversion of indole-3-thiohydroximate to indolylmethyldesulfo-glucosinolate, was upregulated, while Zm00001d00424 was downregulated, at 28 DAP and 38 DAP. Zm00001d039669 encoding aromatic desulfoglucosinolate sulfotransferase (ds-GI SOTs, EC: 2.8.2.24), involved in the conversion of indolylmethyldesulfo-glucosinolate to glucobrassicin, was downregulated at 38 DAP.
3.8. qRT-PCR Validation
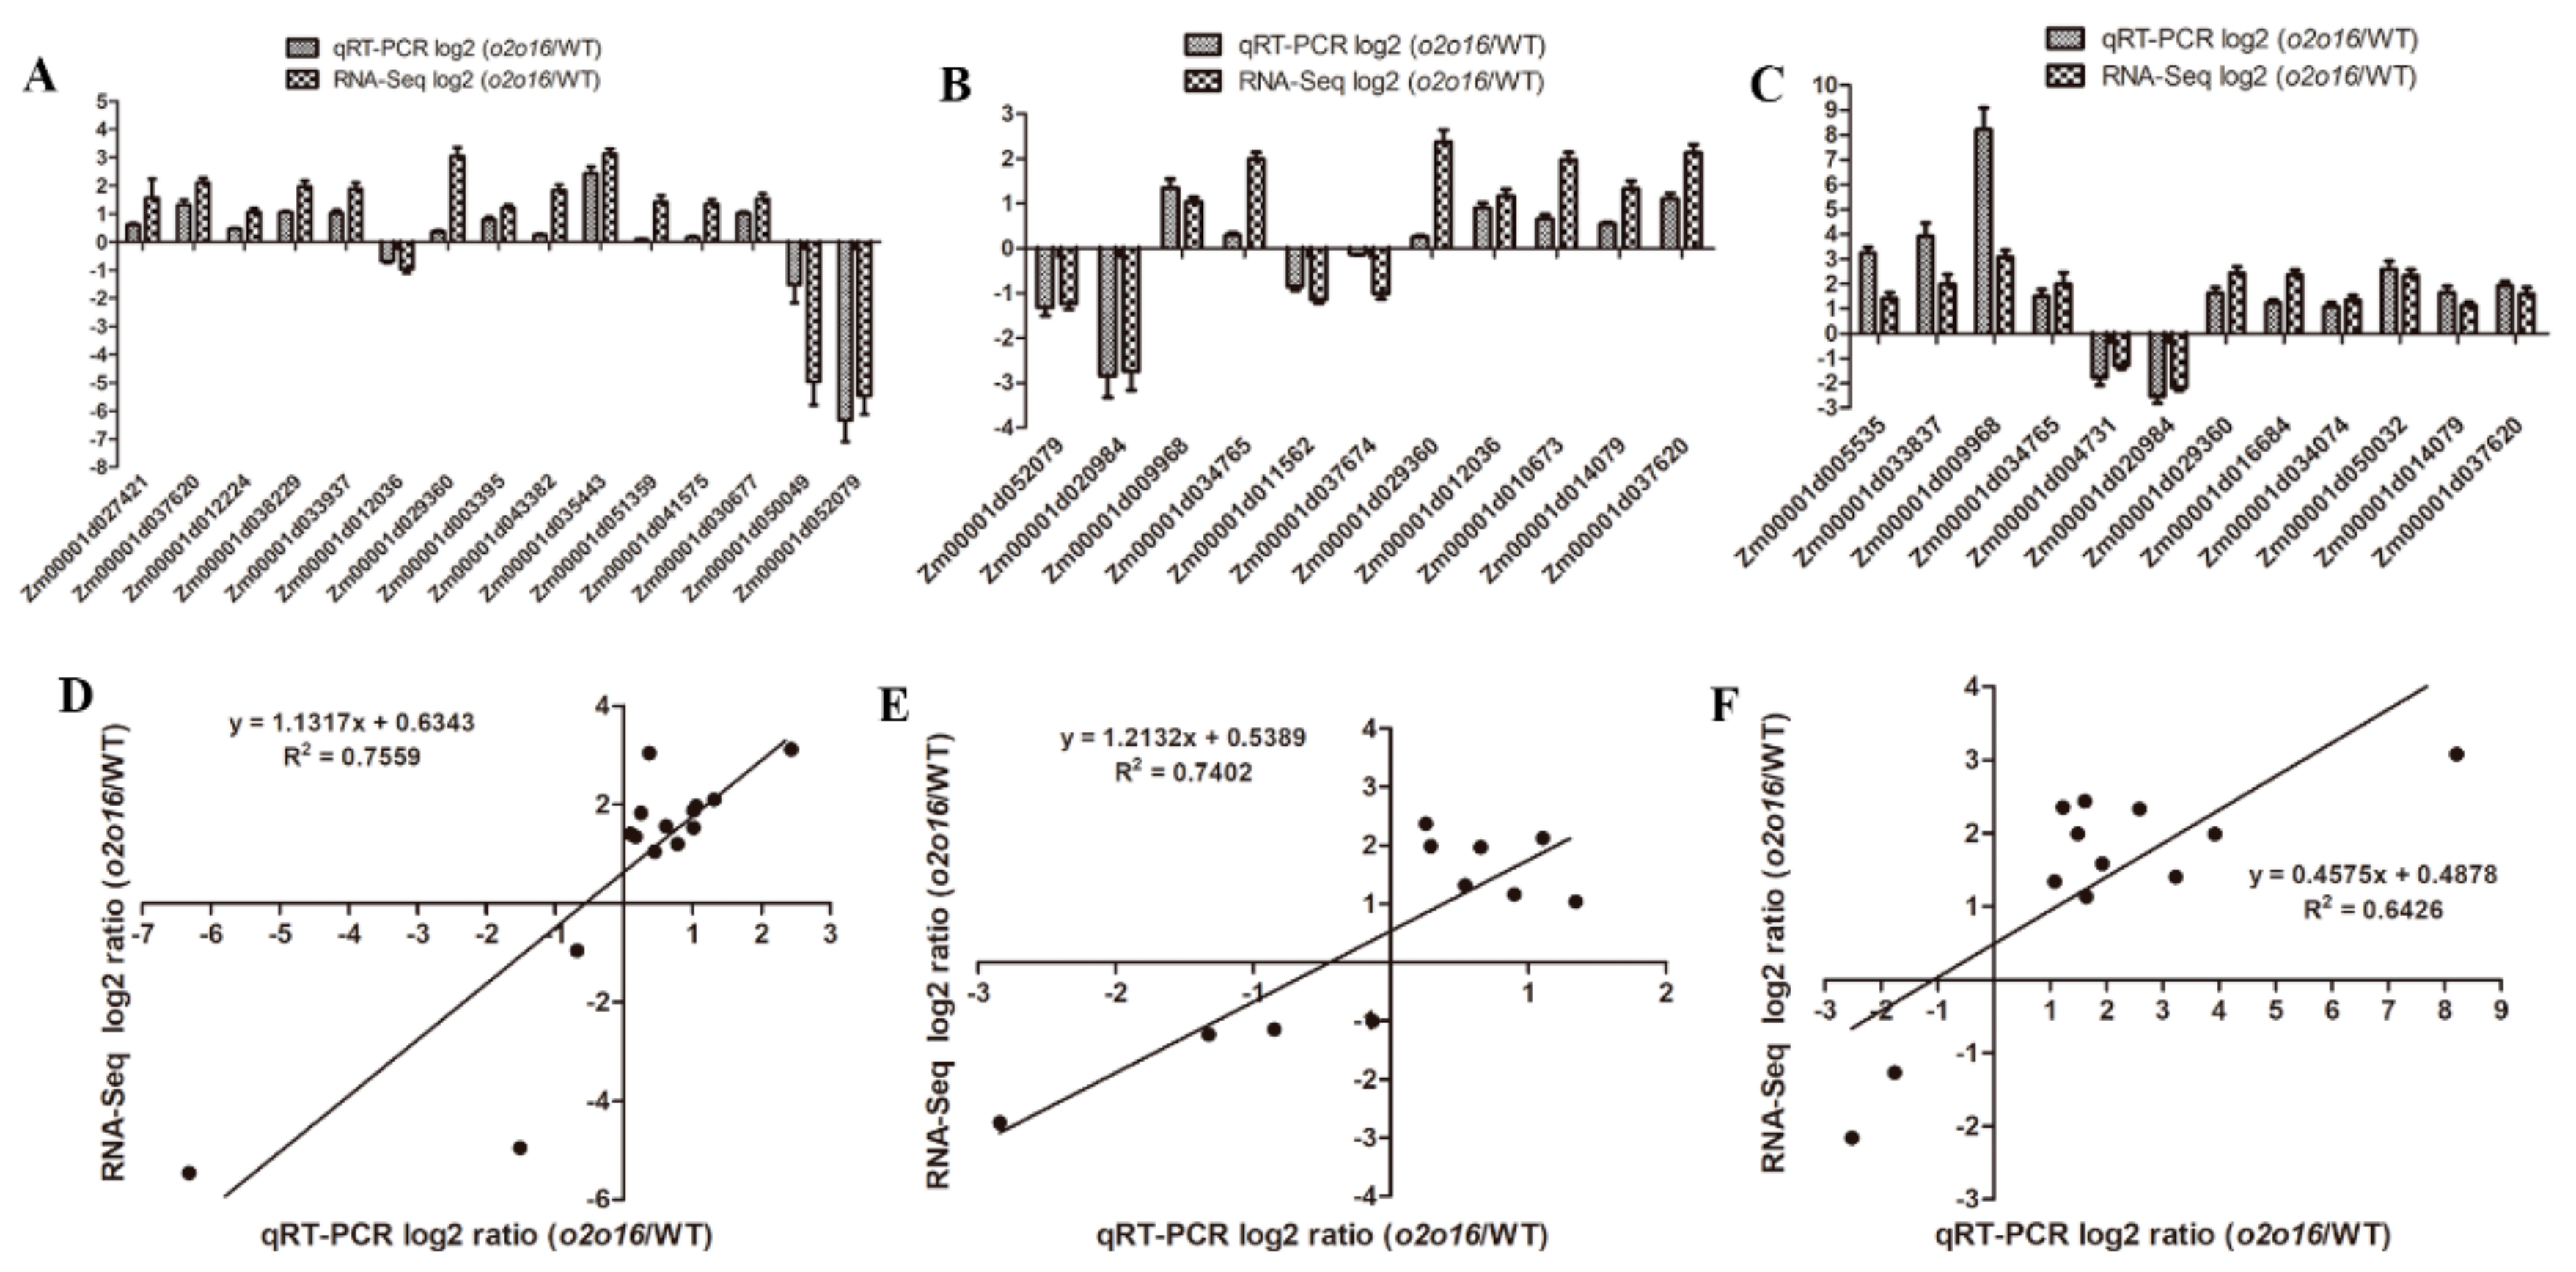
The DEGs identified by RNA-Seq were further validated by qRT-PCR. A total of 28 DEGs were selected for qRT-PCR, which were involved in lysine and tryptophan metabolism. The results showed that the expression patterns of these 28 DEGs were similar to those measured by RNA-Seq (
Figure 8A–C). The coefficient of determination, R
2, between the relative expression levels of qRT-PCR and RNA-Seq, was 0.7559, 0.7402, and 0.6426 at 18 DAP, 28 DAP, and 38 DAP, respectively (
Figure 8D–F), indicating the reliability of the RNA-Seq data.
4. Discussion
In the present study, we introgressed the o2 and o16 alleles into wild-type maize inbred line CML530, using the MABS technique, and acquired the double recessive gene mutant line, QCL8011_2 (o2o2o16o16). The lysine content of this line was increased by 56.08%, compared with wild-type line, CML530. By SNP chip scanning, the genetic background recovery rate of QCL8011_2 was 92.62%, which was higher than the theoretical background recovery rate of 87.50%. RNA-Seq analysis showed that, 46, 8, and 23 DEGs were involved in lysine metabolism at 18 DAP, 28 DAP, and 38 DAP, respectively, while 23, 10, and 25 DEGs were mainly involved in the tryptophan metabolism. These could help uncover the transcriptional regulation mechanism in the increase in lysine and tryptophan content, through the introgression of o2 and o16 alleles into the wild-type maize.
Hartings et al. determined that Asp, Glu, Gly, Val, Met, Ile, Leu, Phe, Lys, His, and Arg were increased, to varying degrees, in double mutant
o2o2o7o7 seeds, compared with the recurrent parent A69Y [
27]. In our study, we found that the contents of Asp, Gly, Phe, Lys, His, and Arg in
o2o2o16o16 were all increased to varying extents, which was consistent with the results tested by Hartings et al. However, the content of Glu, Val, Met, Ile, Leu, and Phe decreased, which was different from the results of Hartings et al. This difference may be related to the introgression of the
o16 allele and the different genetic background (A69Y vs CML530).
Hartings et al. [
27] reported that the
o2o7 endosperm showed a reduced transcription level of the 19 and 22 kDa α-zein, and the 10, 27, and 50 kDa γ-zein. Li et al. [
37] discovered that O2 could directly bind to the promoters of the known targets of 22 kDa α-zein, 19 kDa α-zein, and 14 kDa β-zein genes. Zhan et al. [
38] discovered that O2 directly regulated 23 zein genes, which were, 13 genes of 19 kDa α-zein, 8 genes of 22 kDa α-zein, and one gene, each, of 15 kDa β-zein, 18 kDa δ-zein, 27 kDa γ-zein, and 50 kDa γ-zein. In this study, 16, 15, and 14 genes encoding α-zein were detected at 18 DAP, 28 DAP, and 38 DAP, respectively, and were downregulated in the
o2o2o16o16 mutant as compared to the wild-type (
Table S6,
Figure S3). Fourteen α-zein genes were detected at all of 18 DAP, 28 DAP, and 38 DAP, of them seven α-zein genes were detected by Zhan et al., and the
GRMZM2G044152 (
Zm00001d048813) gene was also detected by Li et al. These α-zein genes were downregulated in the
o2o2o16o16 mutant, resulting in a decrease of the zein synthesis and increase in the lysine content. Aspartate kinase (AK, EC: 2.7.2.4) was committed in the first step of the Asp-derived amino acid pathway, in microorganisms and plants, leading to the biosynthesis of essential amino acids, such as lysine, threonine, methionine, and isoleucine [
39,
40,
41,
42]. There were at least two isoforms of this enzyme, one feedback inhibited by lysine and the other feedback inhibited by threonine [
43]. The gene encoding the lysine-sensitive aspartate kinase (Ask1) might be regulated by the
o2 mutation in maize [
44]. The β-aspartyl phosphate produced in the reaction catalyzed by AK, was then converted to β-aspartyl semialdehyde (ASA), in a reaction catalyzed by the enzyme aspartate semialdehyde dehydrogenase (ASADH, EC 1.2.1.11), in an NADPH-dependent reaction [
43]. In this study, aspartate kinase homoserine dehydrogenase 2 (akh2), encoding AK involved in the conversion of L-aspartate to L-aspartyl-4-phosphate, was upregulated at 38 DAP in QCL8011_2. ASADH was the second key enzyme in the aspartic acid metabolic pathways, which functions as a catalyst in the conversion of L-aspartyl-4-phosphate to L-asparte-4-semialdehyde.
Zm00001d009968 and
Zm00001d034765, encoding ASADH involved in the conversion of L-aspartyl-4-phosphateto L-asparte-4-semialdehyde, were upregulated at 28 DAP and 38 DAP in QCL8011_2.
Zm00001d030677 and
Zm00001d041575, encoding Dap-F involved in the conversion of L,L-2,6-diaminopimelateto
meso-diaminopimelate, were upregulated at 18 DAP. These changes might promote lysine synthesis and increase the grain lysine content of the QCL8011_2 lines.
Lysine α-ketoglutarate reductase/saccharopine dehydrogenase (LKR/SDH), which was a bifunctional enzyme involved in lysine catabolism, was also regulated by O2 [
45]. The O2-regulated LKR/SDH gene (
GRMZM2G181362), which was involved in lysine catabolism, was downregulated by 4.57-fold in the
o2 endosperm [
37]. Kemper et al. found that the transcription level of LKR/SDH mRNA in maize
o2 mutants was decreased by more than 90% and that the enzyme activity was significantly decreased, which reduced the degradation of lysine [
45]. In this study, consistent with the above observations,
lkrsdh1 encoding LKR/SDH, involved in the conversion of lysine to 2-aminoadipate-6-semialdehyde, was downregulated at 18 DAP and 28 DAP in QCL8011_2. Meanwhile,
Zm00001d020984, encoding LOP, was downregulated at 18 DAP, 28 DAP, and 38 DAP. These changes inhibited lysine degradation and increased the grain lysine content of the QCL8011_2.
Trp was first converted to indole-3-pyruvate (IPA) by the TAA family of aminotransferases and, subsequently, indol-3-acetic acid (IAA) was produced from IPA by the YUCCA (YUC) family of flavin monooxygenases. The two-step conversion of Trp to IAA was the main auxin biosynthesis pathway that played an essential role in many developmental processes [
46,
47]. When we focused on
Zm00001d011562 and
Zm00001d037674, which encode the TAA involved in the conversion of tryptophan to indolepyruvate, we found that
Zm00001d011562 was downregulated at 28 DAP and
Zm00001d037674 was downregulated at 38 DAP in QCL8011_2. A total of eight DEGs encoding IPMO, involved in the conversion of indolepyruvate to indoleacetate, were downregulated at 38 DAP. The aldehyde dehydrogenase (ALDH) superfamily is composed of a wide variety of enzymes involved in endogenous and exogenous aldehyde metabolism. ALDH enzymes use either NAD
+ or NADP
+ as a cofactor to convert aldehydes to their corresponding carboxylic acids and NADH or NADPH [
48]. When we focused on
Zm00001d050495 and
Zm00001d004731, which encode ALDH in the conversion of indole-3-acetaldehyde to indoleacetate in tryptophan metabolism, we found that
Zm00001d050495 was downregulated at 18 DAP and
Zm00001d004731 was downregulated at 28 DAP and 38 DAP. Aldehyde oxidase (AO; EC: 1.2.3.1) could oxidize indole-3-acetaldehyde into indole-3-acetic acid [
49].
Zm00001d034388 encoding IAAO was downregulated at 18 DAP. These changes inhibited the tryptophan degradation and increased the grain tryptophan content of the QCL8011_2.
In this study, the key genes responsible for the increase in lysine and tryptophan content after introgression of o2 and o16 alleles into the wild-type maize were identified at the transcriptional level. Among them, genes encoding AK, ASADH, and Dap-F, in the lysine synthesis pathway, were upregulated at different stages of endosperm development (18 DAP, 28 DAP, and 38 DAP), which promoted the synthesis of lysine. Meanwhile, genes encoding LKR/SDH and L-PO in the lysine degradation pathway were downregulated, which inhibited the degradation of lysine. In addition, genes encoding TAA and YUC in the tryptophan metabolic pathway were downregulated, which inhibited the degradation of tryptophan. These would help to uncover the transcriptional regulation mechanisms involved in the increase in lysine and tryptophan content, through the introgression of o2 and o16 alleles into wild-type maize.


