Multi-Tissue Transcriptomes Yield Information on High-Altitude Adaptation and Sex-Determination in Scutiger cf. sikimmensis


Abstract
:1. Introduction
2. Materials and Methods
2.1. Animal Sampling and Ethics Statement
2.2. RNA Extraction, cDNA Library Construction, and Illumina Sequencing
2.3. Filtering, De Novo Assembly, Functional Annotation and Gene Expression
2.4. Tests for Episodic Diversification in Selected Genes, Relevant for High Altitude Adaptation
2.5. Identification of Genes Involved in Sex Determination or Sex Differentiation
3. Results
3.1. Transcriptome
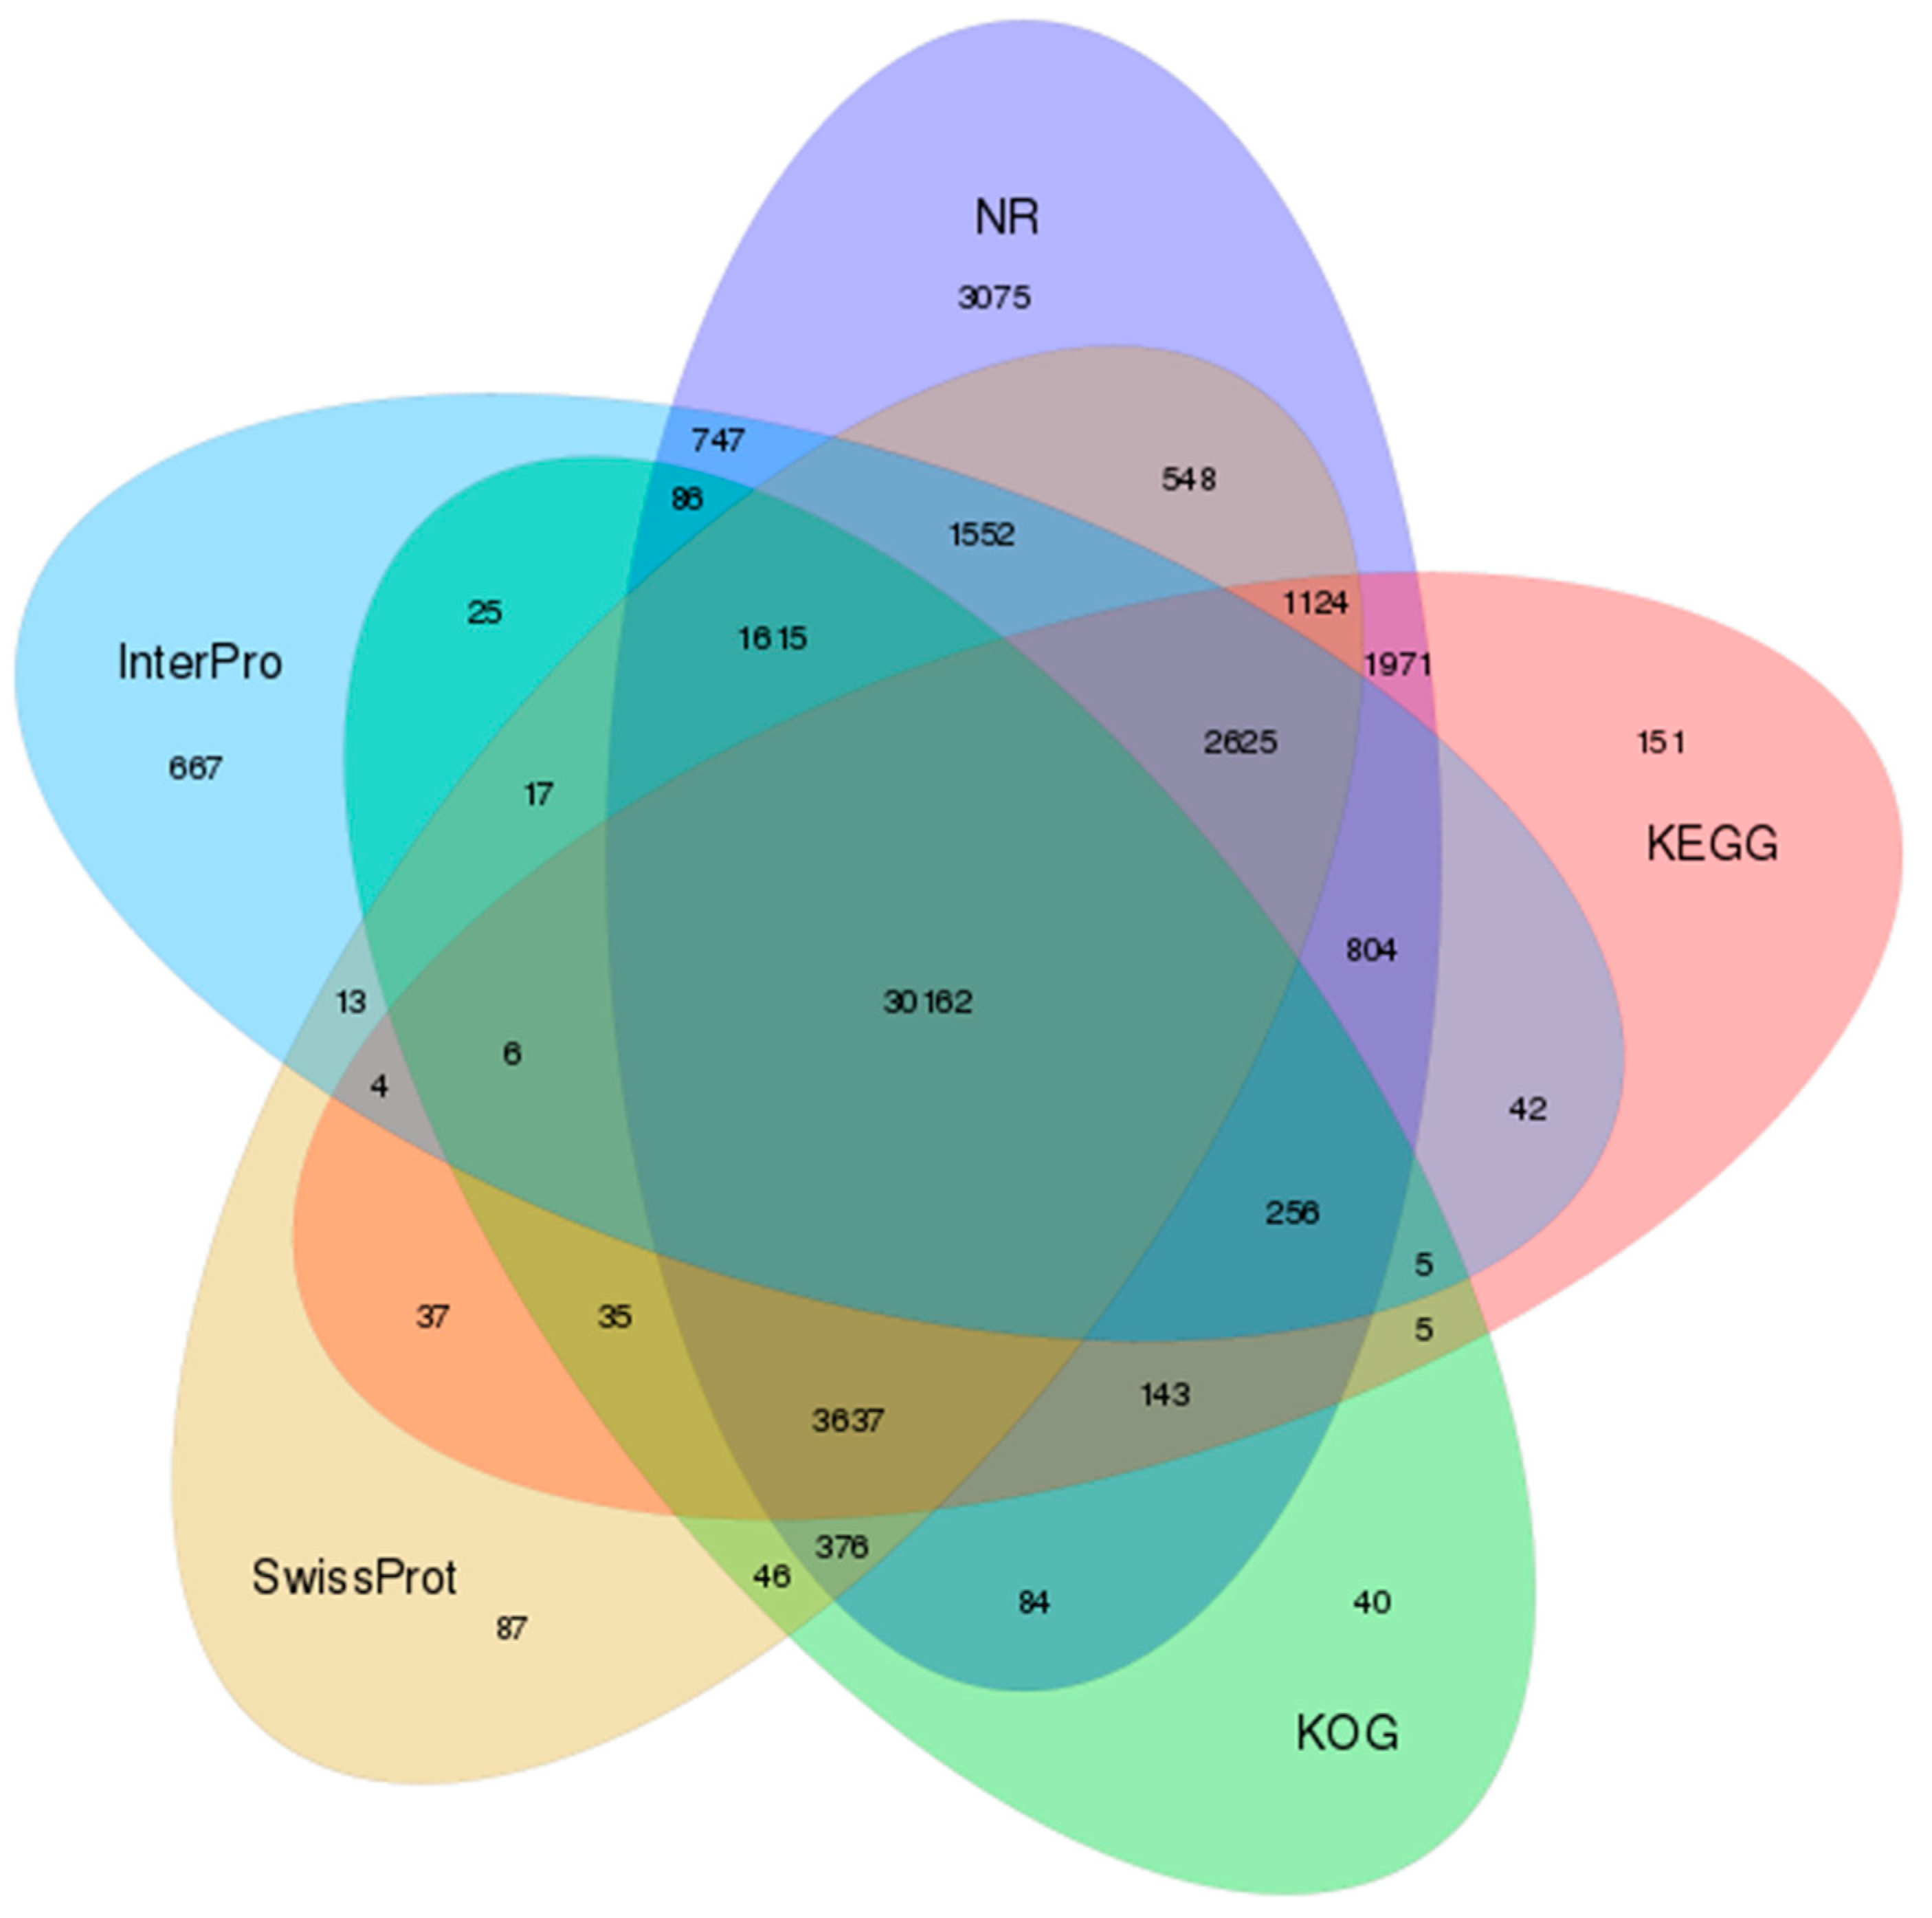
3.2. Functional Annotation
3.3. Testing Potential Genetic Adaptation to High Elevations
3.4. Genes Related to Sex Determination or Sex Differentiation and Their Expression Levels
4. Discussion
4.1. Indications for Potential Genetic Adaptation to High Elevations in Scutiger
4.2. Expression of Genes Involved in Sex Determination or Sex Differentiation
5. Conclusions
Supplementary Materials
Author Contributions
Funding
Acknowledgments
Conflicts of Interest
References
- Mittermeier, R.A.; Robles-Gil, P.; Hoffman, M.; Pilgrim, J.; Brooks, T.; Mittermeier, C.G.; Lamoreux, J.; da Fonseca, G.A.B. Hotspots Revisited; CEMEX: Mexico City, Mexico, 2004; p. 392. [Google Scholar]
- Hofmann, S.; Stoeck, M.; Zheng, Y.; Ficetola, F.G.; Li, J.T.; Scheidt, U.; Schmidt, J. Molecular Phylogenies Indicate a Paleo-Tibetan Origin of Himalayan Lazy Toads (Scutiger). Sci. Rep. 2017, 7, 3308. [Google Scholar] [CrossRef] [PubMed]
- Yang, W.; Qi, Y.; Fu, J. Exploring the Genetic Basis of Adaption to High Elevations in Reptiles: A Comparative Transcriptome Analysis of Two Toad Headed Agamas (Genus Phrynocephalus). PLoS ONE 2014, 9, e112218. [Google Scholar]
- Wang, G.-D.; Zhang, B.-L.; Zhou, W.-W.; Li, Y.-X.; Jin, J.-Q.; Shao, Y.; Yang, H.-C.; Liu, Y.-H.; Yan, F.; Chen, H.-M.; et al. Selection and Environmental Adaptation Along a Path to Speciation in the Tibetan Frog Nanorana parkeri. Proc. Natl. Acad. Sci. USA 2018, 115, E5056–E5065. [Google Scholar] [CrossRef] [PubMed]
- Che, J.; Zhou, W.-W.; Hu, J.-S.; Yan, F.; Papenfuss, T.J.; Wake, D.B.; Zhang, Y.-P. Spiny frogs (Paini) illuminate the history of the Himalayan region and Southeast Asia. Proc. Natl. Acad. Sci. USA 2010, 107, 13765–13770. [Google Scholar] [CrossRef] [PubMed] [Green Version]
- Sun, Y.B.; Fu, T.T.; Jin, J.Q.; Murphy, R.W.; Hillis, D.M.; Zhang, Y.P.; Che, J. Species Groups Distributed across Elevational Gradients Reveal Convergent and Continuous Genetic Adaptation to High Elevations. Proc. Natl. Acad. Sci. USA 2018, 115, E10634–E10641. [Google Scholar] [CrossRef]
- Yang, W.J.; Qi, Y.; Bi, K.; Fu, J. Toward Understanding the Genetic Basis of Adaption to High-Elevation Life in Poikilothermic Species: A Comparative Transcriptomic Analysis of Two Ranid Frogs, Rana chensinensis and R. kukunoris. BMC Genom. 2012, 13, 588. [Google Scholar] [CrossRef]
- Yang, W.; Qi, Y.; Fu, J. Genetic Signals of High-Altitude Adaption in Amphibians: A Comparative Transcriptome Analysis. BMC Genet. 2016, 17, 134. [Google Scholar] [CrossRef]
- Mosbrugger, V.; Favre, L.; Müllner-Riehl, A.; Päckert, M.; Mulch, A. Cenozoic Evolution of Geo-Biodiversity in the Tibeto-Himalayan Region. In Mountains, Climate and Biodiversity; Hoorn, C., Perrigo, A., Antonelli, A., Eds.; Wiley-Blackwell: Oxford, UK, 2018; pp. 429–449. [Google Scholar]
- Bolch, T.; Kulkarni, A.; Kääb, A.; Huggel, C.; Paul, F.; Cogley, J.G.; Fey, H.; Kargel, J.S.; Fujita, K.; Scheel, M.; et al. The State and the Fate of Himalayan Glaciers. Science 2012, 336, 310–314. [Google Scholar] [CrossRef]
- Mittermeier, R.A.; Turner, W.R.; Larsen, F.W.; Brooks, T.M.; Gascon, C. Global Biodiversity Conservation: The Critical Role of Hotspots. In Biodiversity Hotspots; Zachos, F.E., Habel, J.C., Eds.; Springer: Berlin/Heidelberg, Germany, 2011; pp. 3–22. [Google Scholar]
- Pandit, M.K.; Navjot, S.S.; Koh, L.P.; Bhaskar, A.; Brook, B.W. Unreported yet Massive Deforestation Driving Loss of Endemic Biodiversity in Indian Himalaya. Biodivers. Conserv. 2017, 16, 153–163. [Google Scholar] [CrossRef]
- Price, T.D.; Hooper, D.M.; Buchanan, C.D.; Johansson, U.S.; Tietze, D.T.; Alström, P.; Olsson, U.; Ghosh-Harihar, M.; Ishtiaq, F.; Gupta, S.K.; et al. Niche Filling Slows the Diversification of Himalayan Songbirds. Nature 2014, 509, 222–225. [Google Scholar] [CrossRef]
- Huang, L.; Li, J.; Anboukaria, H.; Luo, Z.; Zhao, M.; Wu, H. Comparative Transcriptome Analyses of Seven Anurans Reveal Functions and Adaptations of Amphibian Skin. Sci. Rep. 2016, 6, 24069. [Google Scholar] [CrossRef] [PubMed]
- Zhu, W.; Liu, L.; Wang, X.; Gao, X.; Jiang, J.; Wang, B. Transcriptomics Reveals the Molecular Processes of Light-Induced Rapid Darkening of the Non-Obligate Cave Dweller Oreolalax Rhodostigmatus (Megophryidae, Anura) and Their Genetic Basis of Pigmentation Strategy. BMC Genom. 2018, 19, 422. [Google Scholar] [CrossRef] [PubMed]
- Zhang, W.; Guo, Y.; Li, J.; Huang, L.; Kazitsa, E.G.; Wu, H. Transcriptome Analysis Reveals the Genetic Basis Underlying the Seasonal Development of Keratinized Nuptial Spines in Leptobrachium boringii. BMC Genom. 2016, 17, 978. [Google Scholar] [CrossRef] [PubMed]
- Pyron, R.A.; Wiens, J.J. A Large-Scale Phylogeny of Amphibia Including over 2800 Species, and a Revised Classification of Extant Frogs, Salamanders, and Caecilians. Mol. Phylogenet. Evol. 2011, 61, 543–583. [Google Scholar] [CrossRef] [PubMed]
- Zhang, P.; Liang, D.; Mao, R.L.; Hillis, D.M.; Wake, D.B.; Cannatella, D. Efficient Sequencing of Anuran Mtdnas and a Mitogenomic Exploration of the Phylogeny and Evolution of Frogs. Mol. Biol. Evol. 2013, 30, 1899–1915. [Google Scholar] [CrossRef] [PubMed]
- Irisarri, I.; Vences, M.; San Mauro, D.; Glaw, F.; Zardoya, R. Reversal to Air-Driven Sound Production Revealed by a Molecular Phylogeny of Tongueless Frogs, Family Pipidaex. BMC Evol. Biol. 2011, 11, 114–123. [Google Scholar] [CrossRef]
- Frost, D.R.; Grant, T.; Faivovich, J.N.; Bain, R.H.; Haas, A.; Haddad, C.F.B.; De Sa, R.O.; Channing, A.; Wilkinson, M.; Donnellan, S.C.; et al. The Amphibian Tree of Life. Bull. Am. Mus. Nat. Hist. 2006, 2006, 1–291. [Google Scholar] [CrossRef]
- Roelants, K.; Bossuyt, F. Archaeobatrachian Paraphyly and Pangaean Diversification of Crown-Group Frogs. Syst. Biol. 2005, 54, 111–126. [Google Scholar] [CrossRef]
- Roelants, K.; Gower, D.J.; Wilkinson, M.; Loader, S.P.; Biju, S.D.; Guillaume, K.; Moriau, L.; Bossuyt, F. Global Patterns of Diversification in the History of Modern Amphibians. Proc. Natl. Acad. Sci. USA 2007, 104, 887–892. [Google Scholar] [CrossRef]
- Wiens, J.J. Global Patterns of Diversification and Species Richness in Amphibians. Am. Nat. 2007, 170, 86–106. [Google Scholar] [CrossRef]
- Ohler, A.; Wollenberg, K.C.; Grosjean, S.; Hendrix, R.; Vences, M.; Ziegler, T.; Dubois, A. Sorting out Lalos: Description of New Species and Additional Taxonomic Data on Megophryid Frogs from Northern Indochina (Genus Leptolalax, Megophryidae, Anura). Zootaxa 2011, 3147, 1–83. [Google Scholar] [CrossRef]
- Yang, J.-H.; Huang, X.-Y. A New Species of Scutiger (Anura: Megophryidae) from the Gaoligongshan Mountain Range, China. Copeia 2019, 107, 10–21. [Google Scholar] [CrossRef]
- Fei, L. Atlas of Amphibians of China; Henan Science and Technology Press: Zhengzhou, China, 1999; p. 432. [Google Scholar]
- Frost, D.R. Amphibian Species of the World: An Online Reference. Version 6.0. Electronic Database. American Museum of Natural History. Available online: http://research.amnh.org/herpetology/amphibia/index.html (accessed on 4 September 2019).
- Chen, W.; Bi, K.; Fu, J. Frequent Mitochondrial Gene Introgression among High Elevation Tibetan Megophryid Frogs Revealed by Conflicting Genegenealogies. Mol. Ecol. 2019, 18, 2856–2876. [Google Scholar] [CrossRef] [PubMed]
- Meng, H.; Li, X.; Qiao, P. Population Structure, Historical Biogeography and Demographic History of the Alpine Toad Scutiger ningshanensis in the Tsinling Mountains of Central China. PLoS ONE 2014, 9, e100729. [Google Scholar] [CrossRef] [PubMed]
- Hartmann, M.; Weipert, J. Biodiversität Und Naturausstattung Im Himalaya V; Verein der Freunde und Förderer des Naturkundemuseums Erfurt e.V.: Erfurt, Germany, 2015. [Google Scholar]
- Hartmann, M.; Weipert, J.; Weigel, A. Die Zoologischen Nepal-Expeditionen Des Naturkundemuseums Erfurt [the Zoological Expeditions of the Natural History Museum of Erfurt 1992 to 1997]. Veröffentlichungen Naturkundemuseums Erfurt 1998, 17, 15–30. [Google Scholar]
- Grabherr, M.G.; Haas, B.J.; Yassour, M.; Levin, J.Z.; Thompson, D.A.; Amit, I.; Adiconis, X.; Fan, L.; Raychowdhury, R.; Zeng, Q.; et al. Trinity: Reconstructing a Full-Length Transcriptome without a Genome from RNA-Seq Data. Nat. Biotechnol. 2011, 29, 644–652. [Google Scholar] [CrossRef]
- Pertea, G.; Huang, X.; Liang, F.; Antonescu, V.; Sultana, R.; Karamycheva, S.; Lee, Y.; White, J.; Cheung, F.; Parvizi, B.; et al. Tigr Gene Indices Clustering Tools (Tgicl): A Software System for Fast Clustering of Large Est Datasets. Bioinformatics 2003, 19, 651–652. [Google Scholar] [CrossRef]
- Buchfink, B.; Xie, C.; Huson, D.H. Fast and Sensitive Protein Alignment Using Diamond. Nat. Methods 2015, 12, 59–60. [Google Scholar] [CrossRef]
- Altschul, S.F.; Gish, W.; Miller, W.; Myers, E.W.; Lipman, D.J. Basic Local Aligment Search Tool. J. Mol. Biol. 1990, 215, 403–410. [Google Scholar] [CrossRef]
- Conesa, A.; Gotz, S. Blast2go: A Comprehensive Suite for Functional Analysis in Plant Genomics. Int. J. Plant Genom. 2008, 2008, 619832. [Google Scholar] [CrossRef]
- Quevillon, E.; Silventoinen, V.; Pillai, S.; Harte, N.; Mulder, N.; Apweiler, R.; Lopez, R. Interproscan: Protein Domains Identifier. Nucleic Acids Res. 2005, 33, W116–W120. [Google Scholar] [CrossRef] [PubMed]
- Mistry, J.; Finn, R.D.; Eddy, S.R.; Bateman, A.; Punta, M. Challenges in Homology Search: Hmmer3 and Convergent Evolution of Coiled-Coil Regions. Nucleic Acids Res. 2013, 41, e121. [Google Scholar] [CrossRef] [PubMed]
- Rice, P.; Longden, I.; Bleasby, A. Emboss: The European Molecular Biology Open Software Suite. Trends Genet. 2000, 16, 276–277. [Google Scholar] [CrossRef]
- Langmead, B.; Salzberg, S.L. Fast Gapped-Read Alignment with Bowtie 2. Nat. Methods 2012, 9, 357–359. [Google Scholar] [CrossRef] [PubMed]
- Li, B.; Dewey, C.N. Rsem: Accurate Transcript Quantification from RNA-Seq Data with or without a Reference Genome. BMC Bioinform. 2011, 12, 323. [Google Scholar] [CrossRef]
- Abascal, F.; Zardoya, R.; Telford, M.J. TranslatorX: Multiple Alignment of Nucleotide Sequences Guided by Amino Acid Translations. Nucleic Acids Res. 2010, 38, 7–13. [Google Scholar] [CrossRef]
- Weaver, S.; Shank, S.D.; Spielman, S.J.; Li, M.; Muse, S.V.; Kosakovsky Pond, S.L. Datamonkey 2.0: A Modern Web Application for Characterizing Selective and Other Evolutionary Processes. Mol. Biol. Evol. 2018, 35, 773777. [Google Scholar] [CrossRef]
- Delport, W.; Poon, A.F.; Frost, S.D.W.; Kosakovsky Pond, S.L. Datamonkey 2010: A Suite of Phylogenetic Analysis Tools for Evolutionary Biology. Bioinformatics 2010, 26, 2455–2457. [Google Scholar] [CrossRef]
- Gerchen, J.F.; Reichert, S.J.; Röhr, J.T.; Dieterich, C.; Kloas, W.; Stöck, M. A Single Transcriptome of a Green Toad (Bufo viridis) Yields Candidate Genes for Sex Determination and -Differentiation and Non-Anonymous Population Genetic Markers. PLoS ONE 2016, 11, e0156419. [Google Scholar] [CrossRef]
- James-Zorn, C.; Ponferrada, V.G.; Burns, K.A.; Fortriede, J.D.; Lotay, V.S.; Liu, Y.; Brad Karpinka, J.; Karimi, K.; Zorn, A.M.; Vize, P.D. Xenbase: Core Features, Data Acquisition, and Data Processing. Genesis 2015, 53, 486–497. [Google Scholar] [CrossRef]
- Kent, W.J. Blat--the Blast-Like Alignment Tool. Genome Res. 2002, 12, 656–664. [Google Scholar] [CrossRef] [PubMed]
- Altschul, S.F.; Madden, T.L.; Schaffer, A.A.; Zhang, J.; Zhang, Z.; Miller, W.; Lipman, D.J. Gapped Blast and Psi-Blast: A New Generation of Protein Database Search Programs. Nucleic Acids Res. 1997, 25, 3389–3402. [Google Scholar] [CrossRef] [PubMed]
- Dubois, A. Amphibia Mundi. 1.1. An Ergotaxonomy of Recent Amphibians. Alytes 2005, 23, 1–24. [Google Scholar]
- San Mauro, D.; Vences, M.; Alcobendas, M.; Zardoya, R.; Meyer, A. Initial Diversification of Living Amphibians Predated the Breakup of Pangaea. Am. Nat. 2005, 165, 590–599. [Google Scholar] [CrossRef]
- Witt, K.E.; Huerta-Sánchez, E. Convergent evolution in human and domesticate adaptation to high-altitude environments. Philos. Trans. R. Soc. Lond. B Biol. Sci. 2019, 374, 20180235. [Google Scholar] [CrossRef]
- Miura, I. An Evolutionary Witness: The Frog Rana rugosa Underwent Change of Heterogametic Sex from Xy Male to Zw Female. Sex. Dev. 2007, 1, 323–331. [Google Scholar] [CrossRef]
- Furman, B.L.S.; Evans, B.J. Sequential Turnovers of Sex Chromosomes in African Clawed Frogs (Xenopus) Suggest Some Genomic Regions Are Good at Sex Determination. G3 Genes Genomes Genet. 2016, 6, 3625–3633. [Google Scholar] [CrossRef]
- Beukeboom, L.W.; Perrin, N. The Evolution of Sex Determination; Oxford University Press: Oxford, UK, 2014. [Google Scholar]
- Ma, W.J.; Veltsos, P.; Sermier, R.; Parker, D.J.; Perrin, N. Evolutionary and Developmental Dynamics of Sex-Biased Gene Expression in Common Frogs with Proto-Y Chromosomes. Genome Biol. 2018, 19, 156. [Google Scholar] [CrossRef]
- Eggert, C. Sex Determination: The Amphibian Models. Reprod. Nutr. Dev. 2004, 44, 539–549. [Google Scholar] [CrossRef]


| Brain | Heart | Kidney | Liver | Lung | Testis | |
|---|---|---|---|---|---|---|
| Number of raw reads | 62,192,592 | 73,368,700 | 66,429,410 | 64,241,792 | 87,261,442 | 71,858,834 |
| Clean Reads | 60,440,140 | 70,845,324 | 64,422,228 | 63,141,364 | 85,147,870 | 69,426,236 |
| Clean Bases (Gb) | 6.04 | 7.08 | 6.44 | 6.31 | 8.52 | 6.94 |
| Clean Reads Q20 (%) | 97.08 | 97.32 | 97.11 | 96.93 | 97.06 | 96.84 |
| Clean Reads Q30 (%) | 93.51 | 93.86 | 93.55 | 93.23 | 93.44 | 93.00 |
| GC Clean Reads (%) | 44.78 | 45.53 | 46.19 | 45.65 | 45.48 | 45.90 |
| Brain | Heart | Kidney | Liver | Lung | Testis | All Unigenes | |
|---|---|---|---|---|---|---|---|
| Number of unigenes | 63,189 | 50,037 | 67,145 | 44,915 | 62,363 | 53,203 | 110,889 |
| Total length | 57,057,129 | 40,054,175 | 51,103,731 | 34,377,766 | 49,335,973 | 43,320,879 | 104,314,420 |
| Mean length | 902 | 800 | 761 | 765 | 791 | 814 | 940 |
| N50 length | 1740 | 1448 | 1301 | 1310 | 1426 | 1461 | 1926 |
| GC content % | 44.51 | 44.73 | 45.75 | 44.20 | 44.34 | 44.55 | 44.70 |
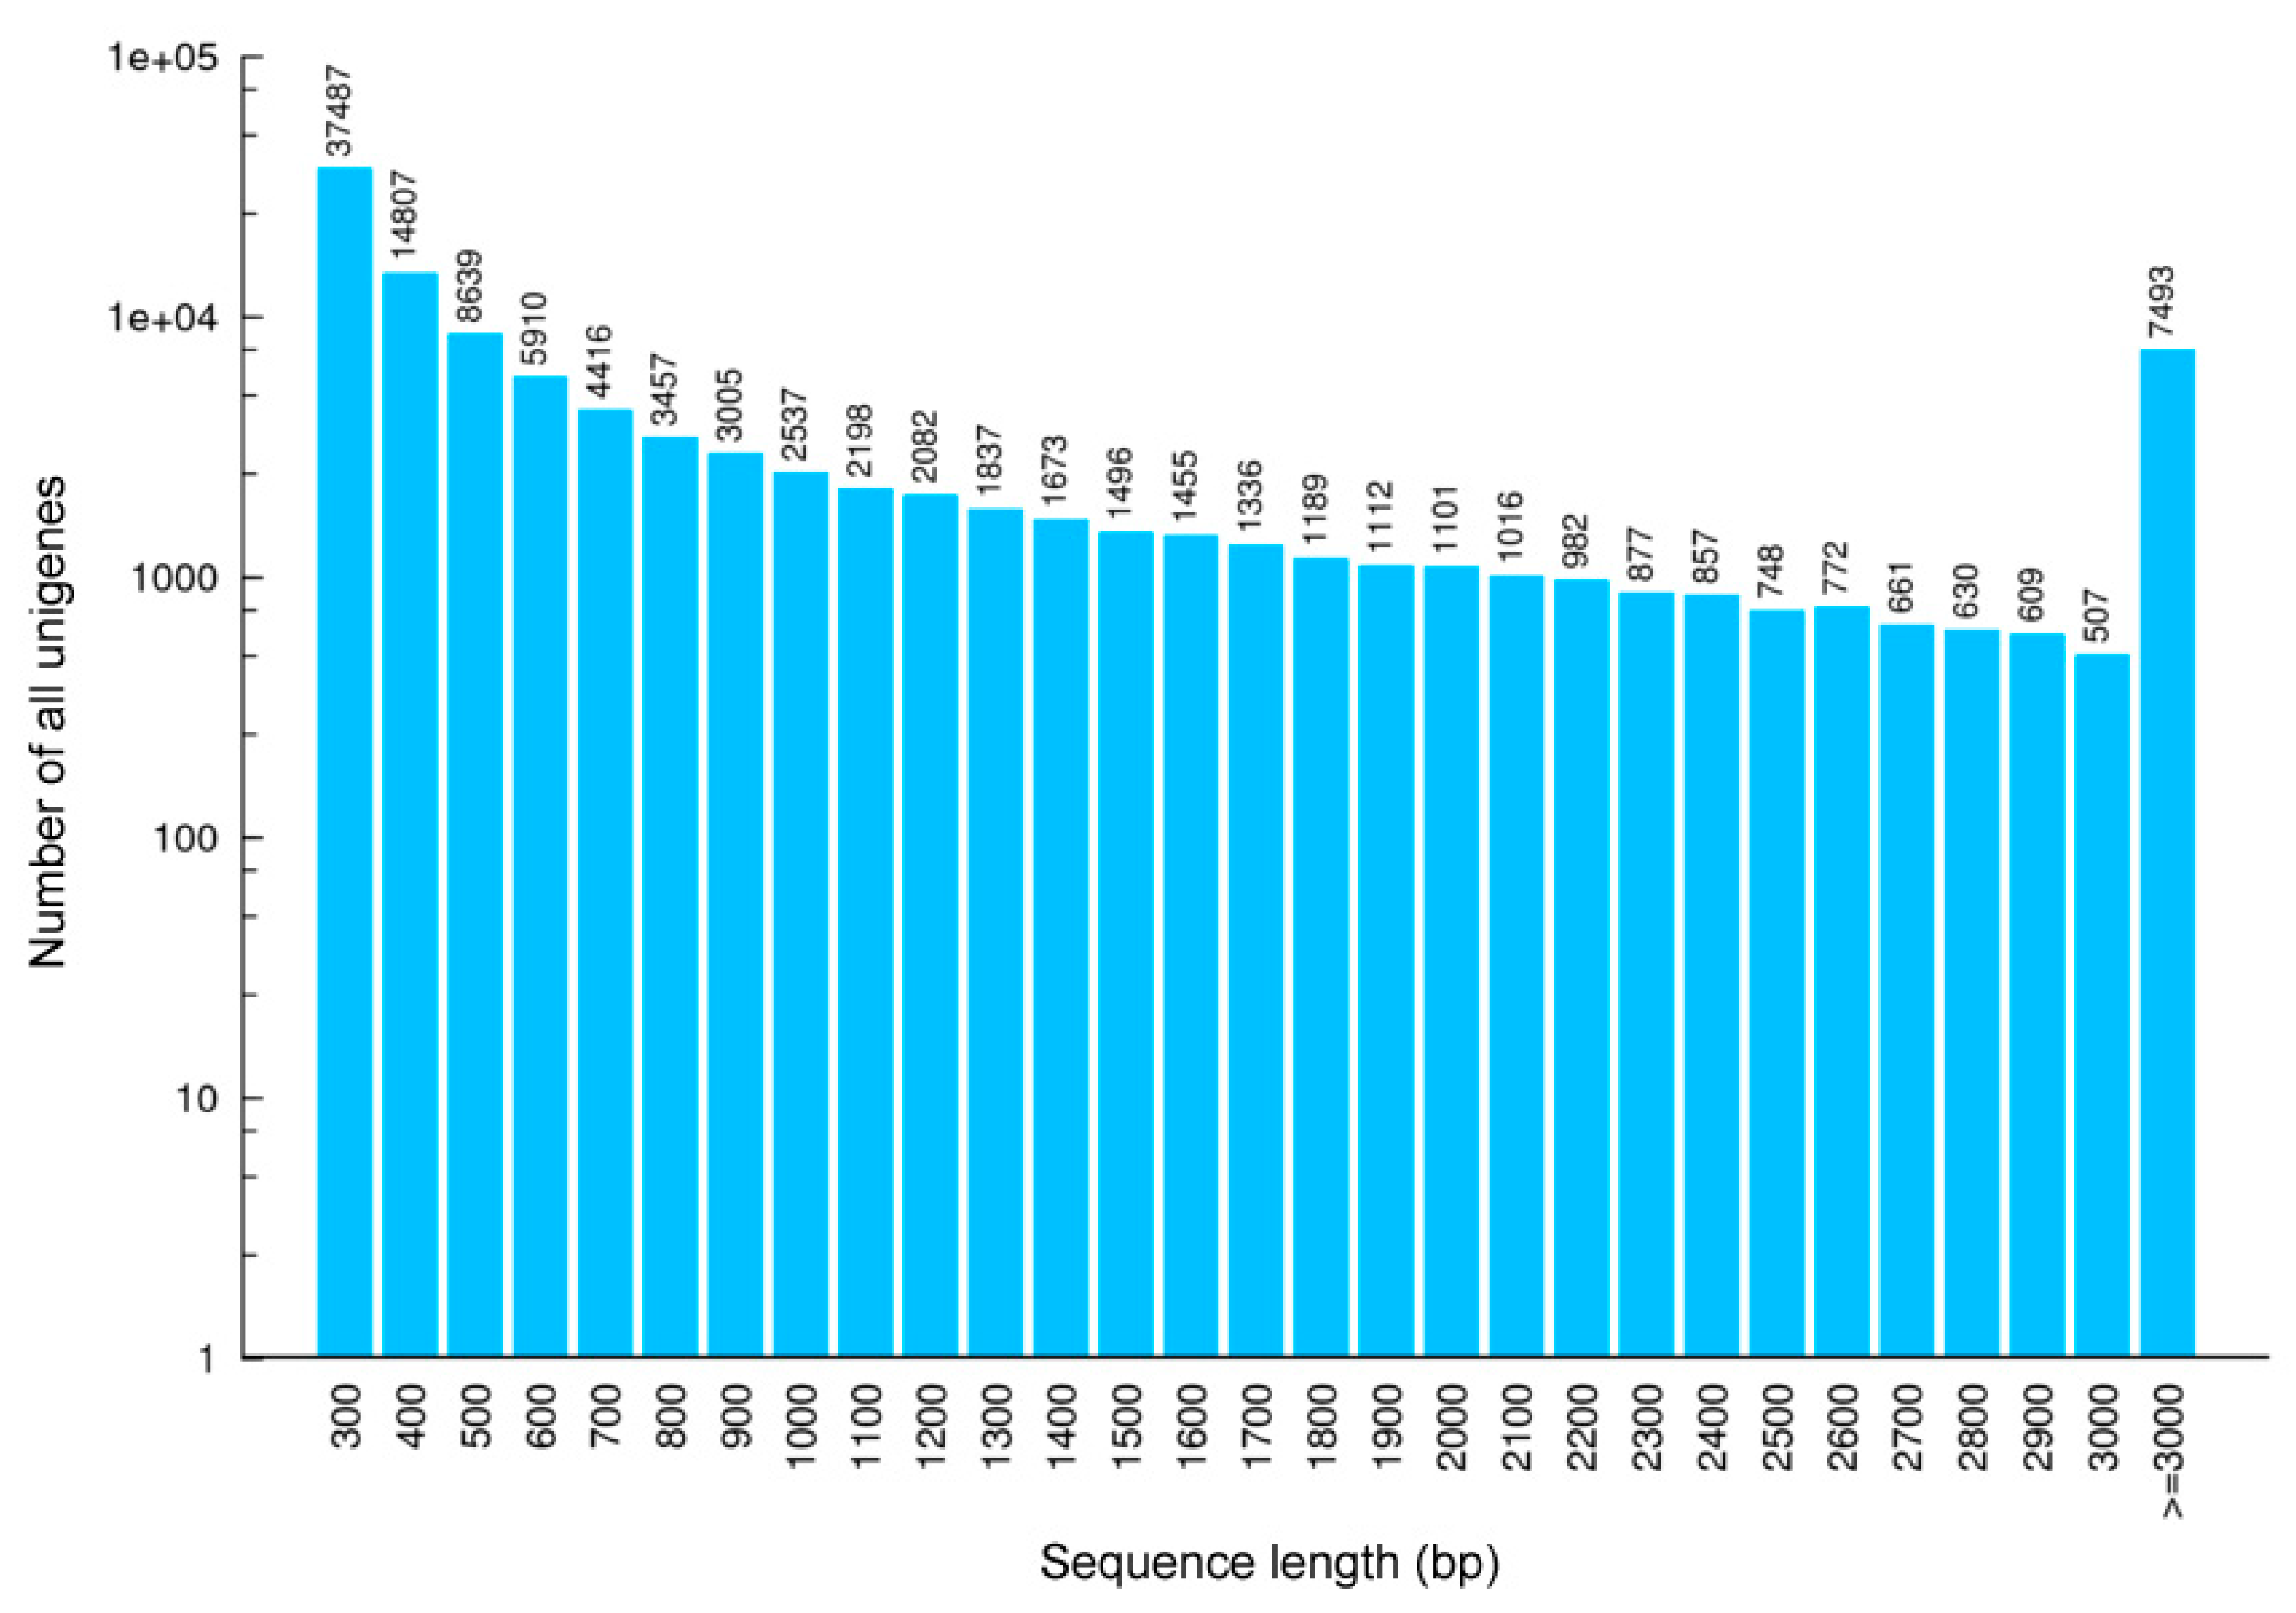
| 300–500 bp | 34,328 (54.33%) | 28,492 (56.94%) | 38,309 (57.05%) | 25,402 (56.56%) | 35,569 (57.04%) | 29,194 (54.87%) | 60,933 (54.95%) |
| 600–1000 bp | 11,604 (18.36%) | 9438 (18.86%) | 13,503 (20.11%) | 8933 (19.89%) | 11,547 (18.52%) | 10,152 (19.08%) | 19,325 (17.43%) |
| 1100–2000 bp | 9286 (14.70%) | 7310 (14.61%) | 9800 (14.60%) | 6744 (15.02%) | 9297 (14.91%) | 8476 (15.93%) | 15,479 (13.96%) |
| 2100–3000 | 4476 (7.08%) | 2970 (5.94%) | 3576 (5.33%) | 2651 (5.90%) | 3851 (6.18%) | 3680 (6.92%) | 7659 (6.91%) |
| ≥ 3000 bp | 3495 (5.53%) | 1827 (3.65%) | 1957 (2.91%) | 1185 (2.64%) | 2099 (3.37%) | 1701 (3.20%) | 7493 (6.76%) |
| Xenopus Protein Sequence | S. cf. sikimmensis Transcript | Expression in Tissue (FPKM) | |||||||||||
|---|---|---|---|---|---|---|---|---|---|---|---|---|---|
| Gene | Organism | Accession No. | mRNA length, nt | Protein length, amino acids | unigene | E-Value | Length, nt | Brain | Heart | Kidney | Liver | Lung | Testis |
| ALDH1A2 | X. tropicalis | AAI57514.1 | 633 | 211 | Unigene17092_All | 0.00 | 2208 | 3.88 | 1.33 | 1.25 | 1.56 | 6.60 | 6.97 |
| ALDH1A3 | X. tropicalis | XP_002939310.1 | 4056 | 512 | Unigene17754_All | 0.00 | 2443 | 3.87 | 10.22 | 13.05 | 6.00 | 7.19 | 6.42 |
| AR | X. tropicalis | XP_002941888.2 | 3497 | 788 | Unigene59002_All | 2.00 × 10⁻³³ | 247 | 0.00 | 0.64 | 0.00 | 0.39 | 0.00 | 0.00 |
| AR | X. tropicalis | XP_002941888.2 | 3497 | 788 | Unigene61378_All | 9.00 × 10−55 | 247 | 0.00 | 1.27 | 0.00 | 0.00 | 0.00 | 0.00 |
| CTNNB1 | X. tropicalis | NP_001016958.1 | 3382 | 781 | Unigene8277_All | 0.00 | 3640 | 182.62 | 88.56 | 60.64 | 29.71 | 57.76 | 83.16 |
| CTNNB1 | X. tropicalis | NP_001016958.1 | 3382 | 781 | Unigene10320_All | 1.00 × 10⁻⁴ | 815 | 7.56 | 1.32 | 2.78 | 1.17 | 3.02 | 1.13 |
| CXCR4B | X. laevis | NP_001080681.1 | 2115 | 358 | Unigene12380_All | 0.00 | 3085 | 8.85 | 3.18 | 5.29 | 11.14 | 104.79 | 2.93 |
| CYP26A1 | X. tropicalis | AAI71087.1 | 1458 | 492 | Unigene67459_All | 0.00 | 1560 | 0.45 | 0.00 | 0.00 | 0.00 | 0.00 | 6.07 |
| CYP26B1 | X. tropicalis | AAI35552.1 | 6137 | 511 | Unigene661_All | 0.00 | 3759 | 5.93 | 4.97 | 0.07 | 0.43 | 0.14 | 0.17 |
| CYP26C1 | X.tropicalis | XP_002939137.2 | 4692 | 533 | Unigene43005_All | 0.00 | 2481 | 6.28 | 0.07 | 0.03 | 0.03 | 0.13 | 0.03 |
| DHH | X. tropicalis | NM_001097169.1 | 4372 | 396 | Unigene27079_All | 2.00 × 10−130 | 1359 | 0.53 | 0.09 | 2.18 | 0.10 | 0.99 | 4.17 |
| DHH | X. tropicalis | NM_001097169.1 | 4372 | 396 | Unigene63854_All | 5.00 × 10−71 | 366 | 0.75 | 0.00 | 0.90 | 0.23 | 0.69 | 1.55 |
| DMRT1 | X. tropicalis | XP_012808036.1 | 1011 | 337 | Unigene30377_All | 2.00 × 10⁻³³ | 312 | 0.61 | 0.47 | 0.00 | 0.00 | 1.06 | 0.00 |
| FGF9 | X. tropicalis | XP_002938621.1 | 624 | 208 | Unigene13573_All | 0.00 | 933 | 1.92 | 0.00 | 0.23 | 0.16 | 0.00 | 0.60 |
| FOXL2 | X. tropicalis | XP_004917868.1 | 978 | 326 | Unigene52644_All | 1.00 × 10⁻¹⁹ | 271 | 1.10 | 0.00 | 0.00 | 0.00 | 0.00 | 0.00 |
| GATA-4 | X. tropicalis | NP_001016949.1 | 1599 | 394 | CL10318.Contig1_All | 5.00 × 10−178 | 4385 | 0.00 | 11.62 | 0.00 | 3.04 | 0.00 | 0.00 |
| GATA-4 | X. tropicalis | NP_001016949.1 | 1599 | 394 | CL10318.Contig2_All | 0.00 | 4283 | 0.04 | 12.70 | 0.03 | 3.56 | 0.02 | 0.29 |
| HHIP | X. tropicalis | NM_001007190.1 | 2717 | 669 | Unigene21373_All | 0.00 | 861 | 0.47 | 0.00 | 0.17 | 3.31 | 1.61 | 0.08 |
| HHIP | X. tropicalis | NM_001007190.1 | 2717 | 669 | Unigene57656_All | 3.00 × 10−93 | 448 | 0.00 | 0.00 | 0.00 | 0.72 | 0.41 | 0.00 |
| LRPPRC | X. tropicalis | NP_001039203.1 | 4347 | 1391 | Unigene19789_All | 0.00 | 4425 | 16.93 | 23.44 | 18.77 | 9.94 | 9.55 | 31.14 |
| NR0B1 | X. tropicalis | XP_002933661.1 | 834 | 278 | CL4129.Contig1_All | 1.00 × 10−122 | 772 | 0.00 | 0.33 | 0.00 | 1.61 | 0.07 | 0.00 |
| NR0B1 | X. tropicalis | XP_002933661.1 | 834 | 278 | CL4129.Contig2_All | 4.00 × 10−179 | 1108 | 1.11 | 0.00 | 0.00 | 11.54 | 0.00 | 0.00 |
| NR0B1 | X. tropicalis | XP_002933661.1 | 834 | 278 | Unigene53513_All | 4.00 × 10−46 | 540 | 0.26 | 0.00 | 0.00 | 0.89 | 0.00 | 0.00 |
| PDGFa | X. tropicalis | NM_001170497.1 | 1574 | 660 | Unigene15273_All | 2.00 × 10−116 | 1671 | 4.89 | 0.87 | 0.80 | 0.79 | 0.25 | 2.46 |
| PDGFb | X. tropicalis | AAI60575.1 | 2140 | 240 | Unigene19730_All | 2.00 × 10−81 | 1802 | 5.74 | 3.99 | 3.56 | 5.27 | 14.62 | 1.19 |
| PTCH2 | X. tropicalis | XP_002937129.2 | 6786 | 1423 | Unigene8457_All | 0.00 | 2946 | 3.35 | 0.12 | 0.86 | 0.12 | 0.41 | 1.12 |
| RSPO-1 | X. tropicalis | NP_001121500.1 | 1946 | 257 | Unigene19575_All | 3.00 × 10−118 | 1913 | 1.27 | 0.32 | 2.84 | 2.10 | 1.69 | 3.29 |
| SOX10 | X. tropicalis | NP_001093691.1 | 2895 | 436 | Unigene39328_All | 0.00 | 3641 | 15.94 | 0.28 | 0.04 | 0.06 | 0.14 | 0.16 |
| SOX8 | X. tropicalis | XP_002932315.2 | 2389 | 466 | Unigene17029_All | 0.00 | 3334 | 7.16 | 1.44 | 0.55 | 0.29 | 0.41 | 0.40 |
| SOX9 | X. tropicalis | AAT72000.1 | 2538 | 482 | Unigene17030_All | 0.00 | 1955 | 10.67 | 1.20 | 1.14 | 1.73 | 0.00 | 0.34 |
| SRD5A1 | X. tropicalis | NP_001006841.1 | 1537 | 257 | CL1692.Contig1_All | 9.00 × 10⁻⁵ | 1964 | 2.31 | 0.92 | 2.07 | 1.12 | 0.15 | 1.51 |
| SRD5A1 | X. tropicalis | NP_001006841.1 | 1537 | 257 | Unigene12175_All | 1.00 × 10−125 | 1559 | 2.33 | 0.70 | 3.87 | 5.56 | 0.79 | 5.99 |
| SRD5A3 | X. laevis | AAH42255.1 | 957 | 319 | CL10211.Contig1_All | 1.00 × 10⁻³² | 295 | 0.79 | 0.00 | 0.00 | 0.00 | 0.63 | 0.29 |
| SRD5A3 | X. laevis | AAH42255.1 | 957 | 319 | CL10211.Contig2_All | 1.00 × 10−95 | 931 | 3.37 | 3.70 | 3.26 | 1.48 | 4.23 | 3.69 |
| WNT4 | X. tropicalis | NP_001239015.1 | 1962 | 351 | Unigene64864_All | 2.00 × 10−44 | 216 | 0.00 | 0.00 | 0.00 | 0.00 | 0.00 | 1.34 |
| WT1 | X. tropicalis | NP_001135625.1 | 6193 | 413 | CL1216.Contig4_All | 0.00 | 3364 | 0.86 | 1.28 | 2.58 | 0.55 | 6.20 | 4.09 |
| WT1 | X. tropicalis | NP_001135625.1 | 6193 | 413 | CL4987.Contig2_All | 3.00 × 10⁻³³ | 308 | 0.00 | 0.00 | 1.39 | 0.00 | 0.00 | 0.28 |
| WT1 | X. tropicalis | NP_001135625.1 | 6193 | 413 | Unigene71862_All | 1.00 × 10⁻²⁶ | 264 | 0.00 | 0.58 | 1.01 | 0.00 | 0.00 | 0.00 |
© 2019 by the authors. Licensee MDPI, Basel, Switzerland. This article is an open access article distributed under the terms and conditions of the Creative Commons Attribution (CC BY) license (http://creativecommons.org/licenses/by/4.0/).
Share and Cite
Hofmann, S.; Kuhl, H.; Baniya, C.B.; Stöck, M. Multi-Tissue Transcriptomes Yield Information on High-Altitude Adaptation and Sex-Determination in Scutiger cf. sikimmensis. Genes 2019, 10, 873. https://doi.org/10.3390/genes10110873
Hofmann S, Kuhl H, Baniya CB, Stöck M. Multi-Tissue Transcriptomes Yield Information on High-Altitude Adaptation and Sex-Determination in Scutiger cf. sikimmensis. Genes. 2019; 10(11):873. https://doi.org/10.3390/genes10110873
Chicago/Turabian StyleHofmann, Sylvia, Heiner Kuhl, Chitra Bahadur Baniya, and Matthias Stöck. 2019. "Multi-Tissue Transcriptomes Yield Information on High-Altitude Adaptation and Sex-Determination in Scutiger cf. sikimmensis" Genes 10, no. 11: 873. https://doi.org/10.3390/genes10110873