Novel Approaches for Identifying the Molecular Background of Schizophrenia


Abstract
:1. Introduction
2. Identifying Schizophrenia Genes
2.1. Tissues and Cell Models Used in Studies of Schizophrenia Functional Genetics
2.2. Massive Transcriptomic Studies and the Comprehensive Mapping of Genomic Regulatory Elements in Brain Cells
2.3. Description of Brain Transcriptomic Landscape
2.4. Identification of Brain-Specific Enhancers within GWAS Regions
2.5. Prediction of Target Genes for Enhancers Located within GWAS Regions
2.6. Prioritization of Schizophrenia Candidate Genes in Transcriptomic and Epigenomic Studies
3. System-Level Data Analysis in Post-GWAS Research
3.1. Basic Approaches for Identification of Molecular Networks Associated with a Genetic Predisposition to Schizophrenia
3.2. Brain Cell Populations Relevant to Schizophrenia
3.3. Genes Encoding Master-Regulators of Molecular Modules Associated with Schizophrenia
3.4. Disease Molecular Modelling as a Path to the Inference of Etiological Mechanisms
3.5. Genetically Informed Schizophrenia Categorization and Understanding of Disease Biology
4. Conclusions
Author Contributions
Funding
Conflicts of Interest
References
- Owen, M.J.; Sawa, A.; Mortensen, P.B. Schizophrenia. Lancet 2016, 388, 86–97. [Google Scholar] [CrossRef] [Green Version]
- Lichtenstein, P.; Bjork, C.; Hultman, C.M.; Scolnick, E.; Sklar, P.; Sullivan, P.F. Recurrence risks for schizophrenia in a Swedish national cohort. Psychol. Med. 2006, 36, 1417–1425. [Google Scholar] [CrossRef] [PubMed]
- Sullivan, P.F.; Kendler, K.S.; Neale, M.C. Schizophrenia as a complex trait: Evidence from a meta-analysis of twin studies. Arch. Gen. Psychiatry 2003, 60, 1187–1192. [Google Scholar] [CrossRef] [PubMed] [Green Version]
- Gottesman, I.I.; Shields, J. A polygenic theory of schizophrenia. Proc. Natl. Acad. Sci. USA 1967, 58, 199–205. [Google Scholar] [CrossRef] [PubMed] [Green Version]
- Gratten, J.; Wray, N.R.; Keller, M.C.; Visscher, P.M. Large-scale genomics unveils the genetic architecture of psychiatric disorders. Nat. Neurosci. 2014, 17, 782–790. [Google Scholar] [CrossRef] [PubMed]
- Sullivan, P.F.; Geschwind, D.H. Defining the genetic, genomic, cellular, and diagnostic architectures of psychiatric disorders. Cell 2019, 177, 162–183. [Google Scholar] [CrossRef] [Green Version]
- Lee, S.H.; DeCandia, T.R.; Ripke, S.; Yang, J.; Schizophrenia Psychiatric Genome-Wide Association Study Consortium (PGC-SCZ); International Schizophrenia Consortium (ISC); Molecular Genetics of Schizophrenia Collaboration (MGS); Sullivan, P.F.; Goddard, M.E.; Keller, M.C.; et al. Estimating the proportion of variation in susceptibility to schizophrenia captured by common SNPs. Nat. Genet. 2012, 44, 247–250. [Google Scholar] [CrossRef] [Green Version]
- Purcell, S.M.; Moran, J.L.; Fromer, M.; Ruderfer, D.; Solovieff, N.; Roussos, P.; O’Dushlaine, C.; Chambert, K.; Bergen, S.E.; Kahler, A.; et al. A polygenic burden of rare disruptive mutations in schizophrenia. Nature 2014, 506, 185–190. [Google Scholar] [CrossRef] [Green Version]
- Corvin, A.; Sullivan, P.F. What next in schizophrenia genetics for the psychiatric genomics consortium? Schizophr. Bull. 2016, 42, 538–541. [Google Scholar] [CrossRef] [Green Version]
- Mrc Centre for Neuropsychiatric Genetics and Genomics. Available online: https://walters.psycm.cf.ac.uk/ (accessed on 17 January 2020).
- Pardinas, A.F.; Holmans, P.; Pocklington, A.J.; Escott-Price, V.; Ripke, S.; Carrera, N.; Legge, S.E.; Bishop, S.; Cameron, D.; Hamshere, M.L.; et al. Common schizophrenia alleles are enriched in mutation-intolerant genes and in regions under strong background selection. Nat. Genet. 2018, 50, 381–389. [Google Scholar] [CrossRef] [Green Version]
- Altshuler, D.; Daly, M.J.; Lander, E.S. Genetic mapping in human disease. Science 2008, 322, 881–888. [Google Scholar] [CrossRef] [PubMed] [Green Version]
- Schaid, D.J.; Chen, W.; Larson, N.B. From genome-wide associations to candidate causal variants by statistical fine-mapping. Nat. Rev. Genet. 2018, 19, 491–504. [Google Scholar] [CrossRef] [PubMed]
- Hormozdiari, F.; Kostem, E.; Kang, E.Y.; Pasaniuc, B.; Eskin, E. Identifying causal variants at loci with multiple signals of association. Genetics 2014, 198, 497–508. [Google Scholar] [CrossRef] [PubMed] [Green Version]
- Tak, Y.G.; Farnham, P.J. Making sense of gwas: Using epigenomics and genome engineering to understand the functional relevance of SNPs in non-coding regions of the human genome. Epigenet. Chromatin 2015, 8, 57. [Google Scholar] [CrossRef] [PubMed] [Green Version]
- Rees, E.; Han, J.; Morgan, J.; Carrera, N.; Escott-Price, V.; Pocklington, A.J.; Duffield, M.; Hall, L.; Legge, S.E.; Pardiñas, A.F.; et al. Analyses of rare and common alleles in parent-proband trios implicate rare missense variants in SLC6A1 in schizophrenia and confirm the involvement of loss of function intolerant and neurodevelopmental disorder genes. bioRxiv 2019, 607549. [Google Scholar] [CrossRef]
- Amiel, J.; Rio, M.; de Pontual, L.; Redon, R.; Malan, V.; Boddaert, N.; Plouin, P.; Carter, N.P.; Lyonnet, S.; Munnich, A.; et al. Mutations in tcf4, encoding a class i basic helix-loop-helix transcription factor, are responsible for pitt-hopkins syndrome, a severe epileptic encephalopathy associated with autonomic dysfunction. Am. J. Hum. Genet. 2007, 80, 988–993. [Google Scholar] [CrossRef] [Green Version]
- Thyme, S.B.; Pieper, L.M.; Li, E.H.; Pandey, S.; Wang, Y.; Morris, N.S.; Sha, C.; Choi, J.W.; Herrera, K.J.; Soucy, E.R.; et al. Phenotypic landscape of schizophrenia-associated genes defines candidates and their shared functions. Cell 2019, 177, 478–491. [Google Scholar] [CrossRef] [Green Version]
- Won, H.; de la Torre-Ubieta, L.; Stein, J.L.; Parikshak, N.N.; Huang, J.; Opland, C.K.; Gandal, M.J.; Sutton, G.J.; Hormozdiari, F.; Lu, D.; et al. Chromosome conformation elucidates regulatory relationships in developing human brain. Nature 2016, 538, 523–527. [Google Scholar] [CrossRef] [Green Version]
- de la Torre-Ubieta, L.; Stein, J.L.; Won, H.; Opland, C.K.; Liang, D.; Lu, D.; Geschwind, D.H. The dynamic landscape of open chromatin during human cortical neurogenesis. Cell 2018, 172, 289–304. [Google Scholar] [CrossRef] [Green Version]
- Fromer, M.; Roussos, P.; Sieberts, S.K.; Johnson, J.S.; Kavanagh, D.H.; Perumal, T.M.; Ruderfer, D.M.; Oh, E.C.; Topol, A.; Shah, H.R.; et al. Gene expression elucidates functional impact of polygenic risk for schizophrenia. Nat. Neurosci. 2016, 19, 1442–1453. [Google Scholar] [CrossRef] [Green Version]
- Gandal, M.J.; Zhang, P.; Hadjimichael, E.; Walker, R.L.; Chen, C.; Liu, S.; Won, H.; van Bakel, H.; Varghese, M.; Wang, Y.; et al. Transcriptome-wide isoform-level dysregulation in ASD, schizophrenia, and bipolar disorder. Science 2018, 362, eaat8127. [Google Scholar] [CrossRef] [PubMed] [Green Version]
- Li, M.; Santpere, G.; Imamura Kawasawa, Y.; Evgrafov, O.V.; Gulden, F.O.; Pochareddy, S.; Sunkin, S.M.; Li, Z.; Shin, Y.; Zhu, Y.; et al. Integrative functional genomic analysis of human brain development and neuropsychiatric risks. Science 2018, 362, eaat7615. [Google Scholar] [CrossRef] [PubMed] [Green Version]
- Wang, D.; Liu, S.; Warrell, J.; Won, H.; Shi, X.; Navarro, F.C.P.; Clarke, D.; Gu, M.; Emani, P.; Yang, Y.T.; et al. Comprehensive functional genomic resource and integrative model for the human brain. Science 2018, 362, eaat8464. [Google Scholar] [CrossRef] [PubMed] [Green Version]
- Bryois, J.; Garrett, M.E.; Song, L.; Safi, A.; Giusti-Rodriguez, P.; Johnson, G.D.; Shieh, A.W.; Buil, A.; Fullard, J.F.; Roussos, P.; et al. Evaluation of chromatin accessibility in prefrontal cortex of individuals with schizophrenia. Nat. Commun. 2018, 9, 3121. [Google Scholar] [CrossRef]
- Rajarajan, P.; Borrman, T.; Liao, W.; Schrode, N.; Flaherty, E.; Casino, C.; Powell, S.; Yashaswini, C.; LaMarca, E.A.; Kassim, B.; et al. Neuron-specific signatures in the chromosomal connectome associated with schizophrenia risk. Science 2018, 362, eaat4311. [Google Scholar] [CrossRef] [Green Version]
- Eckart, N.; Song, Q.; Yang, R.; Wang, R.; Zhu, H.; McCallion, A.S.; Avramopoulos, D. Functional characterization of schizophrenia-associated variation in cacna1c. PLoS ONE 2016, 11, e0157086. [Google Scholar] [CrossRef] [Green Version]
- Schrode, N.; Ho, S.M.; Yamamuro, K.; Dobbyn, A.; Huckins, L.; Matos, M.R.; Cheng, E.; Deans, P.J.M.; Flaherty, E.; Barretto, N.; et al. Synergistic effects of common schizophrenia risk variants. Nat. Genet. 2019, 51, 1475–1485. [Google Scholar] [CrossRef]
- Lam, M.; Chen, C.Y.; Li, Z.; Martin, A.R.; Bryois, J.; Ma, X.; Gaspar, H.; Ikeda, M.; Benyamin, B.; Brown, B.C.; et al. Comparative genetic architectures of schizophrenia in east Asian and European populations. Nat. Genet. 2019, 51, 1670–1678. [Google Scholar] [CrossRef]
- Bigdeli, T.B.; Genovese, G.; Georgakopoulos, P.; Meyers, J.L.; Peterson, R.E.; Iyegbe, C.O.; Medeiros, H.; Valderrama, J.; Achtyes, E.D.; Kotov, R.; et al. Contributions of common genetic variants to risk of schizophrenia among individuals of African and Latino ancestry. Mol. Psychiatry 2019, 1–13. [Google Scholar] [CrossRef] [Green Version]
- Gusev, A.; Mancuso, N.; Won, H.; Kousi, M.; Finucane, H.K.; Reshef, Y.; Song, L.; Safi, A.; Schizophrenia Working Group of the Psychiatric Genomics Consortium; McCarroll, S.; et al. Transcriptome-wide association study of schizophrenia and chromatin activity yields mechanistic disease insights. Nat. Genet. 2018, 50, 538–548. [Google Scholar] [CrossRef] [Green Version]
- Hall, L.S.; Medway, C.W.; Pardinas, A.F.; Rees, E.G.; Escott-Price, V.; Pocklington, A.; Holmans, P.A.; Walters, J.T.; Owen, M.J.; O’Donovan, M.C. A transcriptome wide association study implicates specific pre- and post-synaptic abnormalities in schizophrenia. bioRxiv 2018, 384560. [Google Scholar] [CrossRef] [PubMed] [Green Version]
- Radulescu, E.; Jaffe, A.E.; Straub, R.E.; Chen, Q.; Shin, J.H.; Hyde, T.M.; Kleinman, J.E.; Weinberger, D.R. Identification and prioritization of gene sets associated with schizophrenia risk by co-expression network analysis in human brain. Mol. Psychiatry 2018. [Google Scholar] [CrossRef] [PubMed]
- Skene, N.G.; Bryois, J.; Bakken, T.E.; Breen, G.; Crowley, J.J.; Gaspar, H.A.; Giusti-Rodriguez, P.; Hodge, R.D.; Miller, J.A.; Munoz-Manchado, A.B.; et al. Genetic identification of brain cell types underlying schizophrenia. Nat. Genet. 2018, 50, 825–833. [Google Scholar] [CrossRef] [PubMed]
- Psychiatric Genomics Consortium. Available online: https://www.med.unc.edu/pgc/results-and-downloads/ (accessed on 17 January 2020).
- Encode. Available online: https://www.encodeproject.org/ (accessed on 17 January 2020).
- Roadmap Epigenomics Project. Available online: http://www.roadmapepigenomics.org/ (accessed on 17 January 2020).
- Fantom5. Available online: http://fantom.gsc.riken.jp/5/ (accessed on 17 January 2020).
- Gtex. Available online: https://gtexportal.org/home/ (accessed on 17 January 2020).
- Commonmind Consortium Knowledge Portal. Available online: https://www.synapse.org/#!Synapse:syn2759792/wiki/ (accessed on 17 January 2020).
- Psychencode Consortium Knowledge Portal. Available online: http://resource.psychencode.org/ (accessed on 17 January 2020).
- Kegg Pathways Database. Available online: https://www.genome.jp/kegg/pathway.html (accessed on 17 January 2020).
- Go Database. Available online: http://geneontology.org/ (accessed on 17 January 2020).
- Mouse Genome Informatics Database. Available online: http://www.mousemine.org/mousemine/begin.do (accessed on 17 January 2020).
- Kichaev, G.; Pasaniuc, B. Leveraging functional-annotation data in trans-ethnic fine-mapping studies. Am. J. Hum. Genet. 2015, 97, 260–271. [Google Scholar] [CrossRef] [Green Version]
- Schizophrenia Working Group of the Psychiatric Genomics Consortium. Biological insights from 108 schizophrenia-associated genetic loci. Nature 2014, 511, 421–427. [Google Scholar] [CrossRef] [Green Version]
- Stefansson, H.; Meyer-Lindenberg, A.; Steinberg, S.; Magnusdottir, B.; Morgen, K.; Arnarsdottir, S.; Bjornsdottir, G.; Walters, G.B.; Jonsdottir, G.A.; Doyle, O.M.; et al. Cnvs conferring risk of autism or schizophrenia affect cognition in controls. Nature 2014, 505, 361–366. [Google Scholar] [CrossRef] [Green Version]
- Singh, T.; Kurki, M.I.; Curtis, D.; Purcell, S.M.; Crooks, L.; McRae, J.; Suvisaari, J.; Chheda, H.; Blackwood, D.; Breen, G.; et al. Rare loss-of-function variants in setd1a are associated with schizophrenia and developmental disorders. Nat. Neurosci. 2016, 19, 571–577. [Google Scholar] [CrossRef] [Green Version]
- Splawski, I.; Timothy, K.W.; Sharpe, L.M.; Decher, N.; Kumar, P.; Bloise, R.; Napolitano, C.; Schwartz, P.J.; Joseph, R.M.; Condouris, K.; et al. Ca(v)1.2 calcium channel dysfunction causes a multisystem disorder including arrhythmia and autism. Cell 2004, 119, 19–31. [Google Scholar] [CrossRef] [Green Version]
- Clark, M.J.; Chen, R.; Lam, H.Y.; Karczewski, K.J.; Chen, R.; Euskirchen, G.; Butte, A.J.; Snyder, M. Performance comparison of exome DNA sequencing technologies. Nat. Biotechnol. 2011, 29, 908–914. [Google Scholar] [CrossRef] [Green Version]
- Warr, A.; Robert, C.; Hume, D.; Archibald, A.; Deeb, N.; Watson, M. Exome sequencing: Current and future perspectives. G3 Genes Genomes Genet. 2015, 5, 1543–1550. [Google Scholar] [CrossRef] [Green Version]
- Steinberg, S.; Gudmundsdottir, S.; Sveinbjornsson, G.; Suvisaari, J.; Paunio, T.; Torniainen-Holm, M.; Frigge, M.L.; Jonsdottir, G.A.; Huttenlocher, J.; Arnarsdottir, S.; et al. Truncating mutations in rbm12 are associated with psychosis. Nat. Genet. 2017, 49, 1251–1254. [Google Scholar] [CrossRef] [PubMed]
- Satterstrom, F.K.; Kosmicki, J.A.; Wang, J.; Breen, M.S.; De Rubeis, S.; An, J.-Y.; Peng, M.; Collins, R.; Grove, J.; Klei, L.; et al. Large-scale exome sequencing study implicates both developmental and functional changes in the neurobiology of autism. bioRxiv 2019, 484113. [Google Scholar] [CrossRef]
- Harrington, A.J.; Raissi, A.; Rajkovich, K.; Berto, S.; Kumar, J.; Molinaro, G.; Raduazzo, J.; Guo, Y.; Loerwald, K.; Konopka, G.; et al. Mef2c regulates cortical inhibitory and excitatory synapses and behaviors relevant to neurodevelopmental disorders. Elife 2016, 5, e20059. [Google Scholar] [CrossRef] [PubMed]
- Pak, J.H.; Huang, F.L.; Li, J.; Balschun, D.; Reymann, K.G.; Chiang, C.; Westphal, H.; Huang, K.P. Involvement of neurogranin in the modulation of calcium/calmodulin-dependent protein kinase ii, synaptic plasticity, and spatial learning: A study with knockout mice. Proc. Natl. Acad. Sci. USA 2000, 97, 11232–11237. [Google Scholar] [CrossRef] [Green Version]
- Gusev, A.; Lee, S.H.; Trynka, G.; Finucane, H.; Vilhjalmsson, B.J.; Xu, H.; Zang, C.; Ripke, S.; Bulik-Sullivan, B.; Stahl, E.; et al. Partitioning heritability of regulatory and cell-type-specific variants across 11 common diseases. Am. J. Hum. Genet. 2014, 95, 535–552. [Google Scholar] [CrossRef]
- Smith, E.; Shilatifard, A. Enhancer biology and enhanceropathies. Nat. Struct. Mol. Biol. 2014, 21, 210–219. [Google Scholar] [CrossRef]
- Liu, Y.; Sarkar, A.; Kheradpour, P.; Ernst, J.; Kellis, M. Evidence of reduced recombination rate in human regulatory domains. Genome Biol. 2017, 18, 193. [Google Scholar] [CrossRef] [Green Version]
- Roadmap Epigenomics, C.; Kundaje, A.; Meuleman, W.; Ernst, J.; Bilenky, M.; Yen, A.; Heravi-Moussavi, A.; Kheradpour, P.; Zhang, Z.; Wang, J.; et al. Integrative analysis of 111 reference human epigenomes. Nature 2015, 518, 317–330. [Google Scholar]
- Consortium, G.T. Human genomics. The genotype-tissue expression (gtex) pilot analysis: Multitissue gene regulation in humans. Science 2015, 348, 648–660. [Google Scholar] [CrossRef] [Green Version]
- Forrest, M.P.; Hill, M.J.; Kavanagh, D.H.; Tansey, K.E.; Waite, A.J.; Blake, D.J. The psychiatric risk gene transcription factor 4 (tcf4) regulates neurodevelopmental pathways associated with schizophrenia, autism, and intellectual disability. Schizophr. Bull. 2018, 44, 1100–1110. [Google Scholar] [CrossRef] [Green Version]
- Hoffman, G.E.; Hartley, B.J.; Flaherty, E.; Ladran, I.; Gochman, P.; Ruderfer, D.M.; Stahl, E.A.; Rapoport, J.; Sklar, P.; Brennand, K.J. Transcriptional signatures of schizophrenia in hipsc-derived npcs and neurons are concordant with post-mortem adult brains. Nat. Commun. 2017, 8, 2225. [Google Scholar] [CrossRef] [PubMed] [Green Version]
- Ori, A.P.S.; Bot, M.H.M.; Molenhuis, R.T.; Olde Loohuis, L.M.; Ophoff, R.A. A longitudinal model of human neuronal differentiation for functional investigation of schizophrenia polygenic risk. Biol. Psychiatry 2019, 85, 544–553. [Google Scholar] [CrossRef] [PubMed]
- Amiri, A.; Coppola, G.; Scuderi, S.; Wu, F.; Roychowdhury, T.; Liu, F.; Pochareddy, S.; Shin, Y.; Safi, A.; Song, L.; et al. Transcriptome and epigenome landscape of human cortical development modeled in organoids. Science 2018, 362, eaat6720. [Google Scholar] [CrossRef] [Green Version]
- Borgmann-Winter, K.; Willard, S.L.; Sinclair, D.; Mirza, N.; Turetsky, B.; Berretta, S.; Hahn, C.G. Translational potential of olfactory mucosa for the study of neuropsychiatric illness. Transl. Psychiatry 2015, 5, e527. [Google Scholar] [CrossRef] [Green Version]
- Saunders, A.; Macosko, E.Z.; Wysoker, A.; Goldman, M.; Krienen, F.M.; de Rivera, H.; Bien, E.; Baum, M.; Bortolin, L.; Wang, S.; et al. Molecular diversity and specializations among the cells of the adult mouse brain. Cell 2018, 174, 1015–1030.E16. [Google Scholar] [CrossRef] [Green Version]
- Velmeshev, D.; Schirmer, L.; Jung, D.; Haeussler, M.; Perez, Y.; Mayer, S.; Bhaduri, A.; Goyal, N.; Rowitch, D.H.; Kriegstein, A.R. Single-cell genomics identifies cell type-specific molecular changes in autism. Science 2019, 364, 685–689. [Google Scholar] [CrossRef] [PubMed]
- Lake, B.B.; Chen, S.; Sos, B.C.; Fan, J.; Kaeser, G.E.; Yung, Y.C.; Duong, T.E.; Gao, D.; Chun, J.; Kharchenko, P.V.; et al. Integrative single-cell analysis of transcriptional and epigenetic states in the human adult brain. Nat. Biotechnol. 2018, 36, 70–80. [Google Scholar] [CrossRef] [PubMed]
- Shao, Z.; Noh, H.; Bin Kim, W.; Ni, P.; Nguyen, C.; Cote, S.E.; Noyes, E.; Zhao, J.; Parsons, T.; Park, J.M.; et al. Dysregulated protocadherin-pathway activity as an intrinsic defect in induced pluripotent stem cell-derived cortical interneurons from subjects with schizophrenia. Nat. Neurosci. 2019, 22, 229–242. [Google Scholar] [CrossRef]
- Mertens, J.; Marchetto, M.C.; Bardy, C.; Gage, F.H. Evaluating cell reprogramming, differentiation and conversion technologies in neuroscience. Nat. Rev. Neurosci. 2016, 17, 424–437. [Google Scholar] [CrossRef] [PubMed]
- ENCODE Consortium. An integrated encyclopedia of DNA elements in the human genome. Nature 2012, 489, 57–74. [Google Scholar] [CrossRef]
- GTEx Consortium. Genetic effects on gene expression across human tissues. Nature 2017, 550, 204–213. [Google Scholar] [CrossRef] [PubMed]
- Albert, F.W.; Kruglyak, L. The role of regulatory variation in complex traits and disease. Nat. Rev. Genet. 2015, 16, 197–212. [Google Scholar] [CrossRef] [PubMed]
- Rockman, M.V.; Kruglyak, L. Genetics of global gene expression. Nat. Rev. Genet. 2006, 7, 862–872. [Google Scholar] [CrossRef]
- Gibson, G.; Powell, J.E.; Marigorta, U.M. Expression quantitative trait locus analysis for translational medicine. Genome Med. 2015, 7, 60. [Google Scholar] [CrossRef] [PubMed] [Green Version]
- Zhu, Z.; Zhang, F.; Hu, H.; Bakshi, A.; Robinson, M.R.; Powell, J.E.; Montgomery, G.W.; Goddard, M.E.; Wray, N.R.; Visscher, P.M.; et al. Integration of summary data from gwas and eqtl studies predicts complex trait gene targets. Nat. Genet. 2016, 48, 481–487. [Google Scholar] [CrossRef] [PubMed]
- Giambartolomei, C.; Vukcevic, D.; Schadt, E.E.; Franke, L.; Hingorani, A.D.; Wallace, C.; Plagnol, V. Bayesian test for colocalisation between pairs of genetic association studies using summary statistics. PLoS Genet. 2014, 10, e1004383. [Google Scholar] [CrossRef] [Green Version]
- Teslovich, T.M.; Musunuru, K.; Smith, A.V.; Edmondson, A.C.; Stylianou, I.M.; Koseki, M.; Pirruccello, J.P.; Ripatti, S.; Chasman, D.I.; Willer, C.J.; et al. Biological, clinical and population relevance of 95 loci for blood lipids. Nature 2010, 466, 707–713. [Google Scholar] [CrossRef]
- Willer, C.J.; Schmidt, E.M.; Sengupta, S.; Peloso, G.M.; Gustafsson, S.; Kanoni, S.; Ganna, A.; Chen, J.; Buchkovich, M.L.; Mora, S.; et al. Discovery and refinement of loci associated with lipid levels. Nat. Genet. 2013, 45, 1274–1283. [Google Scholar]
- Pickar-Oliver, A.; Gersbach, C.A. The next generation of crispr-cas technologies and applications. Nat. Rev. Mol. Cell Biol. 2019, 20, 490–570. [Google Scholar] [CrossRef]
- Shlyueva, D.; Stampfel, G.; Stark, A. Transcriptional enhancers: From properties to genome-wide predictions. Nat. Rev. Genet. 2014, 15, 272–286. [Google Scholar] [CrossRef]
- Maston, G.A.; Landt, S.G.; Snyder, M.; Green, M.R. Characterization of enhancer function from genome-wide analyses. Annu. Rev. Genom. Hum. Genet. 2012, 13, 29–57. [Google Scholar] [CrossRef] [PubMed]
- Barakat, T.S.; Halbritter, F.; Zhang, M.; Rendeiro, A.F.; Perenthaler, E.; Bock, C.; Chambers, I. Functional dissection of the enhancer repertoire in human embryonic stem cells. Cell Stem Cell 2018, 23, 276–288.E8. [Google Scholar] [CrossRef] [PubMed] [Green Version]
- Inoue, F.; Kircher, M.; Martin, B.; Cooper, G.M.; Witten, D.M.; McManus, M.T.; Ahituv, N.; Shendure, J. A systematic comparison reveals substantial differences in chromosomal versus episomal encoding of enhancer activity. Genome Res. 2017, 27, 38–52. [Google Scholar] [CrossRef] [PubMed] [Green Version]
- Sander, J.D.; Joung, J.K. Crispr-cas systems for editing, regulating and targeting genomes. Nat. Biotechnol. 2014, 32, 347–355. [Google Scholar] [CrossRef] [PubMed]
- Pulecio, J.; Verma, N.; Mejia-Ramirez, E.; Huangfu, D.; Raya, A. Crispr/cas9-based engineering of the epigenome. Cell Stem Cell 2017, 21, 431–447. [Google Scholar] [CrossRef] [PubMed] [Green Version]
- Gasperini, M.; Hill, A.J.; McFaline-Figueroa, J.L.; Martin, B.; Kim, S.; Zhang, M.D.; Jackson, D.; Leith, A.; Schreiber, J.; Noble, W.S.; et al. A genome-wide framework for mapping gene regulation via cellular genetic screens. Cell 2019, 176, 377–390.E19. [Google Scholar] [CrossRef] [Green Version]
- Arnold, C.D.; Gerlach, D.; Stelzer, C.; Boryn, L.M.; Rath, M.; Stark, A. Genome-wide quantitative enhancer activity maps identified by starr-seq. Science 2013, 339, 1074–1077. [Google Scholar] [CrossRef]
- Liu, Y.; Yu, S.; Dhiman, V.K.; Brunetti, T.; Eckart, H.; White, K.P. Functional assessment of human enhancer activities using whole-genome starr-sequencing. Genome Biol. 2017, 18, 219. [Google Scholar] [CrossRef] [Green Version]
- Wang, X.; He, L.; Goggin, S.M.; Saadat, A.; Wang, L.; Sinnott-Armstrong, N.; Claussnitzer, M.; Kellis, M. High-resolution genome-wide functional dissection of transcriptional regulatory regions and nucleotides in human. Nat. Commun. 2018, 9, 5380. [Google Scholar] [CrossRef] [Green Version]
- Dekker, J.; Rippe, K.; Dekker, M.; Kleckner, N. Capturing chromosome conformation. Science 2002, 295, 1306–1311. [Google Scholar] [CrossRef] [Green Version]
- Ghavi-Helm, Y.; Klein, F.A.; Pakozdi, T.; Ciglar, L.; Noordermeer, D.; Huber, W.; Furlong, E.E. Enhancer loops appear stable during development and are associated with paused polymerase. Nature 2014, 512, 96–100. [Google Scholar] [CrossRef] [PubMed]
- Jin, F.; Li, Y.; Dixon, J.R.; Selvaraj, S.; Ye, Z.; Lee, A.Y.; Yen, C.A.; Schmitt, A.D.; Espinoza, C.A.; Ren, B. A high-resolution map of the three-dimensional chromatin interactome in human cells. Nature 2013, 503, 290–294. [Google Scholar] [CrossRef] [PubMed] [Green Version]
- Lieberman-Aiden, E.; van Berkum, N.L.; Williams, L.; Imakaev, M.; Ragoczy, T.; Telling, A.; Amit, I.; Lajoie, B.R.; Sabo, P.J.; Dorschner, M.O.; et al. Comprehensive mapping of long-range interactions reveals folding principles of the human genome. Science 2009, 326, 289–293. [Google Scholar] [CrossRef] [PubMed] [Green Version]
- Rao, S.S.; Huntley, M.H.; Durand, N.C.; Stamenova, E.K.; Bochkov, I.D.; Robinson, J.T.; Sanborn, A.L.; Machol, I.; Omer, A.D.; Lander, E.S.; et al. A 3d map of the human genome at kilobase resolution reveals principles of chromatin looping. Cell 2014, 159, 1665–1680. [Google Scholar] [CrossRef] [PubMed] [Green Version]
- Javierre, B.M.; Burren, O.S.; Wilder, S.P.; Kreuzhuber, R.; Hill, S.M.; Sewitz, S.; Cairns, J.; Wingett, S.W.; Varnai, C.; Thiecke, M.J.; et al. Lineage-specific genome architecture links enhancers and non-coding disease variants to target gene promoters. Cell 2016, 167, 1369–1384.E19. [Google Scholar] [CrossRef] [PubMed]
- Miguel-Escalada, I.; Bonas-Guarch, S.; Cebola, I.; Ponsa-Cobas, J.; Mendieta-Esteban, J.; Atla, G.; Javierre, B.M.; Rolando, D.M.Y.; Farabella, I.; Morgan, C.C.; et al. Human pancreatic islet three-dimensional chromatin architecture provides insights into the genetics of type 2 diabetes. Nat. Genet. 2019, 51, 1137–1148. [Google Scholar] [CrossRef]
- Davies, J.O.; Telenius, J.M.; McGowan, S.J.; Roberts, N.A.; Taylor, S.; Higgs, D.R.; Hughes, J.R. Multiplexed analysis of chromosome conformation at vastly improved sensitivity. Nat. Methods 2016, 13, 74–80. [Google Scholar] [CrossRef]
- Sahlen, P.; Abdullayev, I.; Ramskold, D.; Matskova, L.; Rilakovic, N.; Lotstedt, B.; Albert, T.J.; Lundeberg, J.; Sandberg, R. Genome-wide mapping of promoter-anchored interactions with close to single-enhancer resolution. Genome Biol. 2015, 16, 156. [Google Scholar] [CrossRef] [Green Version]
- Ernst, J.; Kheradpour, P.; Mikkelsen, T.S.; Shoresh, N.; Ward, L.D.; Epstein, C.B.; Zhang, X.; Wang, L.; Issner, R.; Coyne, M.; et al. Mapping and analysis of chromatin state dynamics in nine human cell types. Nature 2011, 473, 43–49. [Google Scholar] [CrossRef]
- Thurman, R.E.; Rynes, E.; Humbert, R.; Vierstra, J.; Maurano, M.T.; Haugen, E.; Sheffield, N.C.; Stergachis, A.B.; Wang, H.; Vernot, B.; et al. The accessible chromatin landscape of the human genome. Nature 2012, 489, 75–82. [Google Scholar] [CrossRef] [Green Version]
- Andersson, R.; Gebhard, C.; Miguel-Escalada, I.; Hoof, I.; Bornholdt, J.; Boyd, M.; Chen, Y.; Zhao, X.; Schmidl, C.; Suzuki, T.; et al. An atlas of active enhancers across human cell types and tissues. Nature 2014, 507, 455–461. [Google Scholar] [CrossRef] [PubMed]
- He, B.; Chen, C.; Teng, L.; Tan, K. Global view of enhancer-promoter interactome in human cells. Proc. Natl. Acad. Sci. USA 2014, 111, E2191–E2199. [Google Scholar] [CrossRef] [PubMed] [Green Version]
- Wainberg, M.; Sinnott-Armstrong, N.; Mancuso, N.; Barbeira, A.N.; Knowles, D.A.; Golan, D.; Ermel, R.; Ruusalepp, A.; Quertermous, T.; Hao, K.; et al. Opportunities and challenges for transcriptome-wide association studies. Nat. Genet. 2019, 51, 592–599. [Google Scholar] [CrossRef] [PubMed]
- Barabasi, A.L.; Gulbahce, N.; Loscalzo, J. Network medicine: A network-based approach to human disease. Nat. Rev. Genet. 2011, 12, 56–68. [Google Scholar] [CrossRef] [PubMed] [Green Version]
- Geschwind, D.H.; Konopka, G. Neuroscience in the era of functional genomics and systems biology. Nature 2009, 461, 908–915. [Google Scholar] [CrossRef] [PubMed]
- Geschwind, D.H.; Flint, J. Genetics and genomics of psychiatric disease. Science 2015, 349, 1489–1494. [Google Scholar] [CrossRef] [Green Version]
- Parikshak, N.N.; Gandal, M.J.; Geschwind, D.H. Systems biology and gene networks in neurodevelopmental and neurodegenerative disorders. Nat. Rev. Genet. 2015, 16, 441–458. [Google Scholar] [CrossRef]
- de Leeuw, C.A.; Neale, B.M.; Heskes, T.; Posthuma, D. The statistical properties of gene-set analysis. Nat. Rev. Genet. 2016, 17, 353–364. [Google Scholar] [CrossRef]
- Finucane, H.K.; Bulik-Sullivan, B.; Gusev, A.; Trynka, G.; Reshef, Y.; Loh, P.R.; Anttila, V.; Xu, H.; Zang, C.; Farh, K.; et al. Partitioning heritability by functional annotation using genome-wide association summary statistics. Nat. Genet. 2015, 47, 1228–1235. [Google Scholar] [CrossRef] [Green Version]
- Ashburner, M.; Ball, C.A.; Blake, J.A.; Botstein, D.; Butler, H.; Cherry, J.M.; Davis, A.P.; Dolinski, K.; Dwight, S.S.; Eppig, J.T.; et al. Gene ontology: Tool for the unification of biology. The gene ontology consortium. Nat. Genet. 2000, 25, 25–29. [Google Scholar] [CrossRef] [Green Version]
- Ogata, H.; Goto, S.; Sato, K.; Fujibuchi, W.; Bono, H.; Kanehisa, M. Kegg: Kyoto encyclopedia of genes and genomes. Nucleic Acids Res. 1999, 27, 29–34. [Google Scholar] [CrossRef] [PubMed] [Green Version]
- Blake, J.A.; Bult, C.J.; Eppig, J.T.; Kadin, J.A.; Richardson, J.E.; Mouse Genome Database Group. The mouse genome database: Integration of and access to knowledge about the laboratory mouse. Nucleic Acids Res. 2014, 42, D810–D817. [Google Scholar] [CrossRef] [PubMed] [Green Version]
- Zhang, B.; Horvath, S. A general framework for weighted gene co-expression network analysis. Stat. Appl. Genet. Mol. Biol. 2005, 4, 17. [Google Scholar] [CrossRef] [PubMed]
- Darnell, J.C.; Van Driesche, S.J.; Zhang, C.; Hung, K.Y.; Mele, A.; Fraser, C.E.; Stone, E.F.; Chen, C.; Fak, J.J.; Chi, S.W.; et al. FMRP stalls ribosomal translocation on mrnas linked to synaptic function and autism. Cell 2011, 146, 247–261. [Google Scholar] [CrossRef] [PubMed] [Green Version]
- Becamel, C.; Alonso, G.; Galeotti, N.; Demey, E.; Jouin, P.; Ullmer, C.; Dumuis, A.; Bockaert, J.; Marin, P. Synaptic multiprotein complexes associated with 5-ht(2c) receptors: A proteomic approach. EMBO J. 2002, 21, 2332–2342. [Google Scholar] [CrossRef] [Green Version]
- Muller, C.S.; Haupt, A.; Bildl, W.; Schindler, J.; Knaus, H.G.; Meissner, M.; Rammner, B.; Striessnig, J.; Flockerzi, V.; Fakler, B.; et al. Quantitative proteomics of the cav2 channel nano-environments in the mammalian brain. Proc. Natl. Acad. Sci. USA 2010, 107, 14950–14957. [Google Scholar] [CrossRef] [Green Version]
- Lee, J.A.; Damianov, A.; Lin, C.H.; Fontes, M.; Parikshak, N.N.; Anderson, E.S.; Geschwind, D.H.; Black, D.L.; Martin, K.C. Cytoplasmic rbfox1 regulates the expression of synaptic and autism-related genes. Neuron 2016, 89, 113–128. [Google Scholar] [CrossRef] [Green Version]
- Chang, X.; Lima, L.A.; Liu, Y.; Li, J.; Li, Q.; Sleiman, P.M.A.; Hakonarson, H. Common and rare genetic risk factors converge in protein interaction networks underlying schizophrenia. Front. Genet. 2018, 9, 434. [Google Scholar] [CrossRef]
- Razick, S.; Magklaras, G.; Donaldson, I.M. Irefindex: A consolidated protein interaction database with provenance. BMC Bioinform. 2008, 9, 405. [Google Scholar] [CrossRef] [Green Version]
- Jia, P.; Zheng, S.; Long, J.; Zheng, W.; Zhao, Z. Dmgwas: Dense module searching for genome-wide association studies in protein-protein interaction networks. Bioinformatics 2011, 27, 95–102. [Google Scholar] [CrossRef] [Green Version]
- Pocklington, A.J.; Rees, E.; Walters, J.T.; Han, J.; Kavanagh, D.H.; Chambert, K.D.; Holmans, P.; Moran, J.L.; McCarroll, S.A.; Kirov, G.; et al. Novel findings from cnvs implicate inhibitory and excitatory signaling complexes in schizophrenia. Neuron 2015, 86, 1203–1214. [Google Scholar] [CrossRef] [PubMed] [Green Version]
- Fromer, M.; Pocklington, A.J.; Kavanagh, D.H.; Williams, H.J.; Dwyer, S.; Gormley, P.; Georgieva, L.; Rees, E.; Palta, P.; Ruderfer, D.M.; et al. De novo mutations in schizophrenia implicate synaptic networks. Nature 2014, 506, 179–184. [Google Scholar] [CrossRef] [PubMed] [Green Version]
- Finucane, H.K.; Reshef, Y.A.; Anttila, V.; Slowikowski, K.; Gusev, A.; Byrnes, A.; Gazal, S.; Loh, P.R.; Lareau, C.; Shoresh, N.; et al. Heritability enrichment of specifically expressed genes identifies disease-relevant tissues and cell types. Nat. Genet. 2018, 50, 621–629. [Google Scholar] [CrossRef] [PubMed]
- Davis, J.K.; Broadie, K. Multifarious functions of the fragile x mental retardation protein. Trends Genet. 2017, 33, 703–714. [Google Scholar] [CrossRef]
- Sakamoto, K.; Crowley, J.J. A comprehensive review of the genetic and biological evidence supports a role for microrna-137 in the etiology of schizophrenia. Am. J. Med Genet. Part B Neuropsychiatr. Genet. 2018, 177, 242–256. [Google Scholar] [CrossRef] [Green Version]
- Schizophrenia Psychiatric Genome-Wide Association Study Consortium. Genome-wide association study identifies five new schizophrenia loci. Nat. Genet. 2011, 43, 969–976. [Google Scholar] [CrossRef]
- Kwon, E.; Wang, W.; Tsai, L.H. Validation of schizophrenia-associated genes csmd1, c10orf26, cacna1c and tcf4 as mir-137 targets. Mol. Psychiatry 2013, 18, 11–12. [Google Scholar] [CrossRef]
- Wright, C.; Turner, J.A.; Calhoun, V.D.; Perrone-Bizzozero, N. Potential impact of mir-137 and its targets in schizophrenia. Front. Genet. 2013, 4, 58. [Google Scholar] [CrossRef] [Green Version]
- Wright, C.; Calhoun, V.D.; Ehrlich, S.; Wang, L.; Turner, J.A.; Bizzozero, N.I. Meta gene set enrichment analyses link mir-137-regulated pathways with schizophrenia risk. Front. Genet. 2015, 6, 147. [Google Scholar] [CrossRef] [Green Version]
- Gehman, L.T.; Stoilov, P.; Maguire, J.; Damianov, A.; Lin, C.H.; Shiue, L.; Ares, M., Jr.; Mody, I.; Black, D.L. The splicing regulator rbfox1 (a2bp1) controls neuronal excitation in the mammalian brain. Nat. Genet. 2011, 43, 706–711. [Google Scholar] [CrossRef]
- Doostparast Torshizi, A.; Armoskus, C.; Zhang, H.; Forrest, M.P.; Zhang, S.; Souaiaia, T.; Evgrafov, O.V.; Knowles, J.A.; Duan, J.; Wang, K. Deconvolution of transcriptional networks identifies tcf4 as a master regulator in schizophrenia. Sci. Adv. 2019, 5, eaau4139. [Google Scholar] [CrossRef] [PubMed] [Green Version]
- Forrest, M.P.; Waite, A.J.; Martin-Rendon, E.; Blake, D.J. Knockdown of human tcf4 affects multiple signaling pathways involved in cell survival, epithelial to mesenchymal transition and neuronal differentiation. PLoS ONE 2013, 8, e73169. [Google Scholar] [CrossRef] [PubMed]
- Hill, M.J.; Killick, R.; Navarrete, K.; Maruszak, A.; McLaughlin, G.M.; Williams, B.P.; Bray, N.J. Knockdown of the schizophrenia susceptibility gene tcf4 alters gene expression and proliferation of progenitor cells from the developing human neocortex. J. Psychiatry Neurosci. 2017, 42, 181–188. [Google Scholar] [CrossRef] [Green Version]
- Xia, H.; Jahr, F.M.; Kim, N.K.; Xie, L.; Shabalin, A.A.; Bryois, J.; Sweet, D.H.; Kronfol, M.M.; Palasuberniam, P.; McRae, M.; et al. Building a schizophrenia genetic network: Transcription factor 4 regulates genes involved in neuronal development and schizophrenia risk. Hum. Mol. Genet. 2018, 27, 3246–3256. [Google Scholar] [CrossRef]
- Duclot, F.; Kabbaj, M. The role of early growth response 1 (egr1) in brain plasticity and neuropsychiatric disorders. Front. Behav. Neurosci. 2017, 11, 35. [Google Scholar] [CrossRef] [Green Version]
- Wang, Q.; Chen, R.; Cheng, F.; Wei, Q.; Ji, Y.; Yang, H.; Zhong, X.; Tao, R.; Wen, Z.; Sutcliffe, J.S.; et al. A bayesian framework that integrates multi-omics data and gene networks predicts risk genes from schizophrenia GWAS data. Nat. Neurosci. 2019, 22, 691–699. [Google Scholar] [CrossRef]
- Cross-Disorder Group of the Psychiatric Genomics Consortium. Genomic relationships, novel loci, and pleiotropic mechanisms across eight psychiatric disorders. Cell 2019, 179, 1469–1482.E11. [Google Scholar] [CrossRef] [Green Version]
- Schizophrenia Working Group of the Psychiatric Genomics Consortium. Genomic dissection of bipolar disorder and schizophrenia, including 28 subphenotypes. Cell 2018, 173, 1705–1715.E16. [Google Scholar] [CrossRef] [Green Version]
- Udler, M.S.; Kim, J.; von Grotthuss, M.; Bonas-Guarch, S.; Cole, J.B.; Chiou, J.; Christopher, D.A. on behalf of METASTROKE and ISGC.; Boehnke, M.; Laakso, M.; et al. Type 2 diabetes genetic loci informed by multi-trait associations point to disease mechanisms and subtypes: A soft clustering analysis. PLoS Med. 2018, 15, e1002654. [Google Scholar] [CrossRef] [Green Version]
- Mahajan, A.; Taliun, D.; Thurner, M.; Robertson, N.R.; Torres, J.M.; Rayner, N.W.; Payne, A.J.; Steinthorsdottir, V.; Scott, R.A.; Grarup, N.; et al. Fine-mapping type 2 diabetes loci to single-variant resolution using high-density imputation and islet-specific epigenome maps. Nat. Genet. 2018, 50, 1505–1513. [Google Scholar] [CrossRef] [Green Version]
- Speliotes, E.K.; Yerges-Armstrong, L.M.; Wu, J.; Hernaez, R.; Kim, L.J.; Palmer, C.D.; Gudnason, V.; Eiriksdottir, G.; Garcia, M.E.; Launer, L.J.; et al. Genome-wide association analysis identifies variants associated with nonalcoholic fatty liver disease that have distinct effects on metabolic traits. PLoS Genet. 2011, 7, e1001324. [Google Scholar] [CrossRef] [PubMed]
- Prats, C.; Arias, B.; Moya-Higueras, J.; Pomarol-Clotet, E.; Parellada, M.; Gonzalez-Pinto, A.; Peralta, V.; Ibanez, M.I.; Martin, M.; Fananas, L.; et al. Evidence of an epistatic effect between dysbindin-1 and neuritin-1 genes on the risk for schizophrenia spectrum disorders. Eur. Psychiatry 2017, 40, 60–64. [Google Scholar] [CrossRef] [PubMed] [Green Version]
- Tecelao, D.; Mendes, A.; Martins, D.; Fu, C.; Chaddock, C.A.; Picchioni, M.M.; McDonald, C.; Kalidindi, S.; Murray, R.; Prata, D.P. The effect of psychosis associated cacna1c, and its epistasis with znf804a, on brain function. Genes Brain Behav. 2019, 18, e12510. [Google Scholar] [CrossRef] [PubMed]
- Arnedo, J.; Svrakic, D.M.; Del Val, C.; Romero-Zaliz, R.; Hernandez-Cuervo, H.; Molecular Genetics of Schizophrenia Consortium; Fanous, A.H.; Pato, M.T.; Pato, C.N.; de Erausquin, G.A.; et al. Uncovering the hidden risk architecture of the schizophrenias: Confirmation in three independent genome-wide association studies. Am. J. Psychiatry 2015, 172, 139–153. [Google Scholar] [CrossRef]
- Genomes Unzipped. Eight Types of Schizophrenia? Not So Fast…. Available online: http://genomesunzipped.org/2014/09/eight-types-of-schizophrenia-not-so-fast.php (accessed on 17 January 2020).
- Elert, E. Aetiology: Searching for schizophrenia’s roots. Nature 2014, 508, S2–S3. [Google Scholar] [CrossRef] [Green Version]
- Langenberg, C.; Lotta, L.A. Genomic insights into the causes of type 2 diabetes. Lancet 2018, 391, 2463–2474. [Google Scholar] [CrossRef]
- Nguyen, H.T.; Lapaquette, P.; Bringer, M.A.; Darfeuille-Michaud, A. Autophagy and crohn’s disease. J. Innate Immunity 2013, 5, 434–443. [Google Scholar] [CrossRef]
- Anzalone, A.V.; Randolph, P.B.; Davis, J.R.; Sousa, A.A.; Koblan, L.W.; Levy, J.M.; Chen, P.J.; Wilson, C.; Newby, G.A.; Raguram, A.; et al. Search-and-replace genome editing without double-strand breaks or donor DNA. Nature 2019, 576, 149–157. [Google Scholar] [CrossRef]
- Foley, C.; Corvin, A.; Nakagome, S. Genetics of schizophrenia: Ready to translate? Curr. Psychiatry Rep. 2017, 19, 61. [Google Scholar] [CrossRef]
- Gandal, M.J.; Leppa, V.; Won, H.; Parikshak, N.N.; Geschwind, D.H. The road to precision psychiatry: Translating genetics into disease mechanisms. Nat. Neurosci. 2016, 19, 1397–1407. [Google Scholar] [CrossRef] [Green Version]


| Molecular Biology Techniques | |||
|---|---|---|---|
| Method | Description | Application in Post-GWAS Studies | Selected Publications |
| RNA-seq | High-throughput sequencing of reverse-transcribed RNA allows quantitative assessment of transcriptional activity for each gene in a given sample. This technology made the most basic molecular phenotype easily measurable. | Direct case-control comparison of brain RNA-seq datasets is used for the search of genes with altered expression (see differential expression analysis). Being joined with genome-wide genotyping data for a human cohort, brain RNA-seq datasets can be used in e/isoQTL analysis. Alternatively, populational RNA-seq data is necessary for construction of brain-specific WGCNA networks, which are then used in gene set enrichment analysis or heritability enrichment analysis. | [21,22] |
| ChIP-seq | This method is essentially chromatin immunoprecipitation (IP) coupled with high-throughput sequencing. It is employed for genome-wide search for DNA sites occupied by proteins of interest. Antibodies against chromatin-interacting proteins of interest are incubated with sheared chromatin, and DNA bound by antibodies is precipitated, purified, and subjected to sequencing. | The approach is used for genome-wide annotation of sequences potentially acting as enhancers. IP with antibodies against enhancer-specific histone modifications (e.g., H3K27ac and H3K4me1) are especially useful. As causal polymorphisms are expected to localize within enhancers, ChIP-seq-predicted neuronal enhancers harbouring schizophrenia-associated SNPs are primary targets for subsequent functional interrogation with luciferase test and genome/epigenome editing. Alternatively, given a high level of overall enhancer tissue specificity, enhancers annotated in the cell type can be used in heritability enrichment analysis to test the relevance of this cell type for disease development. | [23,24] |
| Chromatin accessibility assays (DNase-seq and ATAC-seq) | The techniques are based on enrichment of sequencing libraries with histone-depleted genomic regions. This is achieved by means of enzymes specifically targeting such sites in chromatin (DNase I and Tn5 transposase) with subsequent preferential amplification of short DNA fragments excised by these enzymes. Accessible chromatin-enriched libraries are subjected to next-generation sequencing. | It is widely assumed that TSS-distal open chromatin regions are colocalized with active enhancers, thus these methods along with ChIP-seq are used for enhancer inference. As causal polymorphisms are expected to localize within enhancers, DNase-seq / ATAC-seq-predicted neuronal enhancers harbouring schizophrenia-associated SNPs are primary targets for subsequent functional interrogation with luciferase test and genome/epigenome editing. Alternatively, given a high level of overall enhancer tissue specificity, enhancers annotated in the cell type can be used in heritability enrichment analysis to test the relevance of this cell type for disease development. | [20,25] |
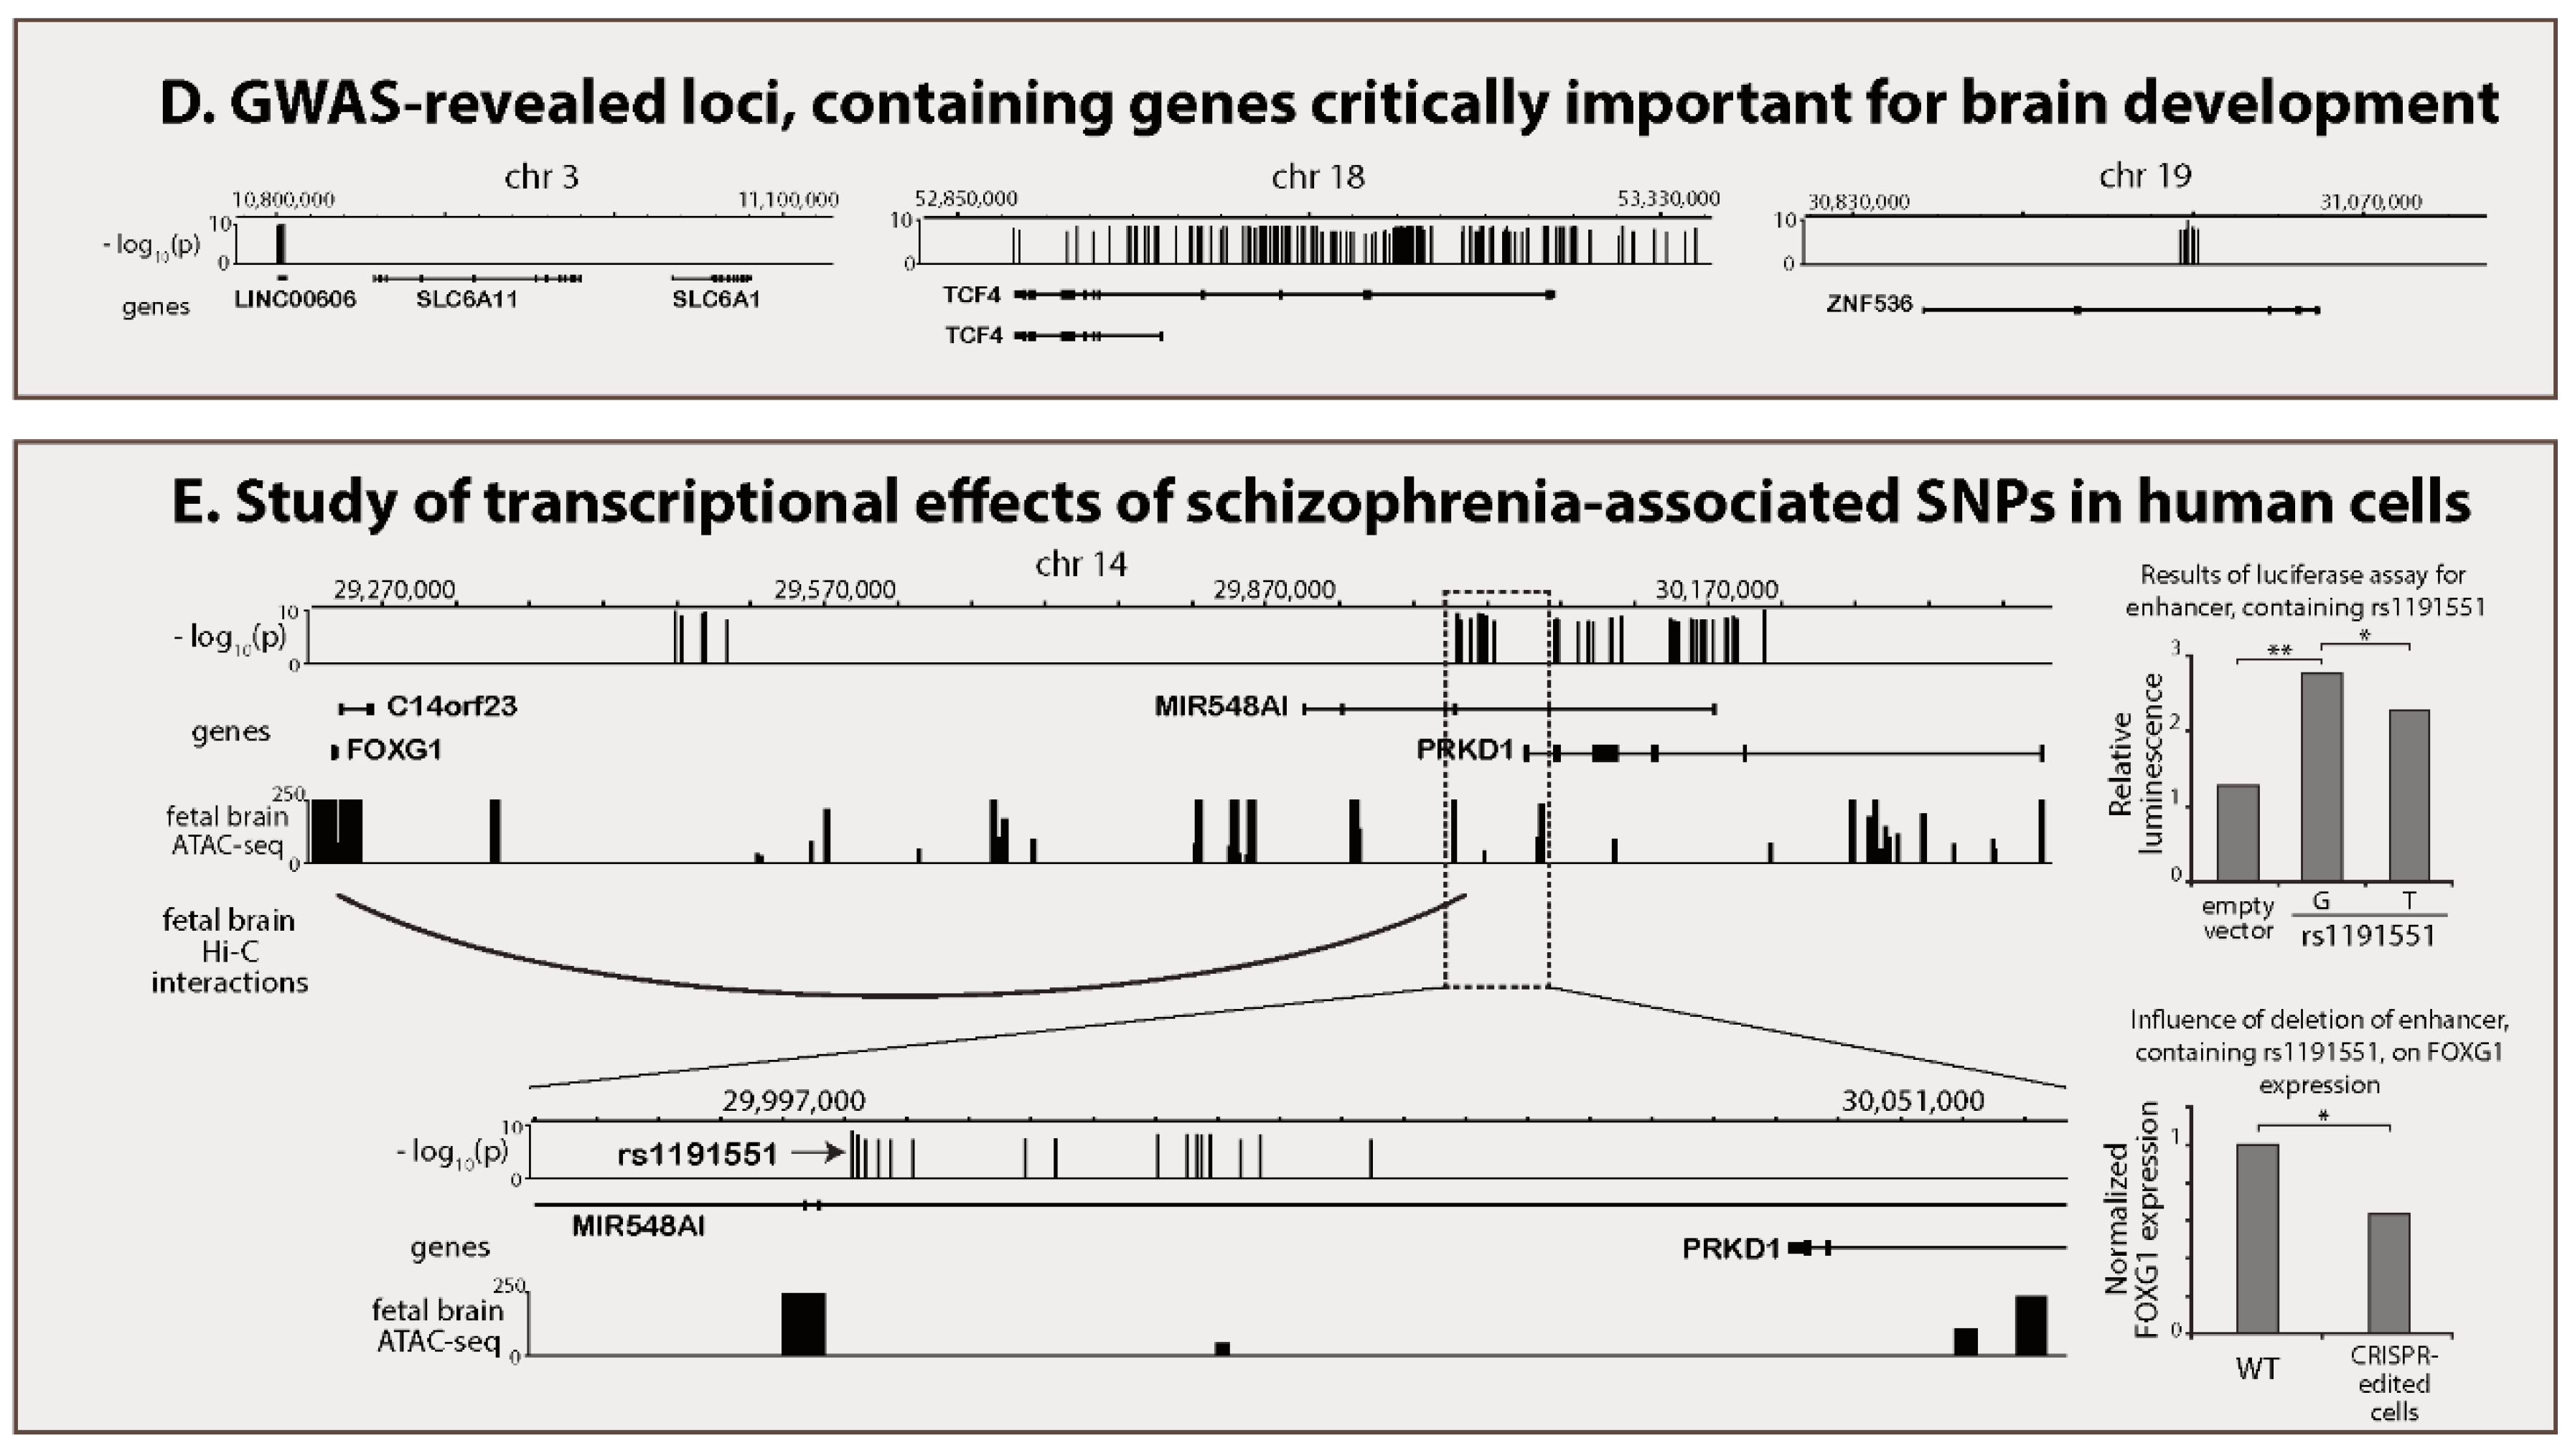
| High-throughput proximity ligation assays (Hi-C and Promoter Capture Hi-C) | In high-throughput proximity ligation methods, distances between pairs of genomic sites are assessed by means of proximity ligation followed by next-generation sequencing. Hi-C allows measurement of proximity between any pair of genomic sites. Promoter Capture Hi-C offers the opportunity to assess distances between promoters and any other genomic site with reduced sequencing burden compared to Hi-C. | It is believed that promoters spatially interact with their cognate enhancers. Thus, proximity-ligation methods are utilized to infer functional enhancer-promoter links. If an enhancer, involved in the enhancer-gene loop in neuronal cells, at the same time harbour schizophrenia-associated SNPs, this physical proximity can be utilized as evidence for genes having a causal role in the disease. Functional links between this gene and the enhancer, containing a schizophrenia-associated genetic variant, can be accurately confirmed with genome/epigenome editing. | [19,26] |
| Episome-based functional reporter assays (luciferase assay and STARR-seq) | A potential enhancer sequence is inserted in specially-designed episome, harbouring reporter genes. Transfection of the construct into cells with subsequent measurement of reporter gene expression levels allows assessment of enhancer activity for a tested sequence in a given cell type. The luciferase test was designed for low-throughput testing of enhancer sequences (one at a time), whereas the STARR-seq allows testing of thousands of genomic sites in one experiment. | The luciferase assay is used to confirm regulatory activity of schizophrenia-associated genomic sites predicted to be enhancers in brain cells. Often, such predictions are based on the results of the aforementioned epigenomic methods: ChIP-seq, chromatin accessibility assays or high-throughput proximity ligation assays. Besides that, the influence of alternative alleles of schizophrenia-associated SNPs on activity of enhancers, in which given polymorphic sites reside, can be measured with the luciferase assay. STARR-seq can potentially be used to probe all genomic sites on their enhancer activity in a given brain cell type. Localisation of schizophrenia-associated variants inside STARR-seq confirmed brain enhancers can be considered strong evidence of causality. | [19,27] |
| Genome editing (CRISPR-Cas) | In situ targeted manipulation of genomic sequence exploiting bacterial Cas DNA nuclease (e.g., Cas9) guided by short RNA fragments (gRNA). The currently available CRISPR-Cas tools allow in some cases single nucleotide-precision genome editing and therefore creating isogenic models for functional testing of SNPs. Other CRISPR-Cas systems are used to excise short fragments (several hundreds of bp) of DNA from the genome. | CRISPR-Cas approaches can be used in human neural cells for substitution of individual schizophrenia-associated nucleotides or excision of entire enhancers, harbouring such nucleotides. These enhancers are usually predicted with ChIP-seq or/and chromatin accessibility assays. Editing is followed by assessment of changes in expression of enhancer cognate genes. Alternatively, genome editing is used for creation of knock-out model animals to test the role of potential schizophrenia genes in brain development and function. | [18,19] |
| Epigenome editing (CRISPRi) | These tools were designed for targeted in situ epigenetic inactivation of regulatory sequences in the genome. This was made possible by abolishing nuclease activity of Cas9 and fusion of this protein with various eukaryotic transcription inhibitory domains (e.g., KRAB-domain, MECP2 inhibitory domain). | Epigenome editing is used as a simplified alternative of genome editing for functional confirmation of regulatory activity of enhancers containing schizophrenia-associated polymorphisms. Besides that, CRISPRi can be used in the search for genes regulated by such enhancers. | [26,28] |
| Computational Methods | |||
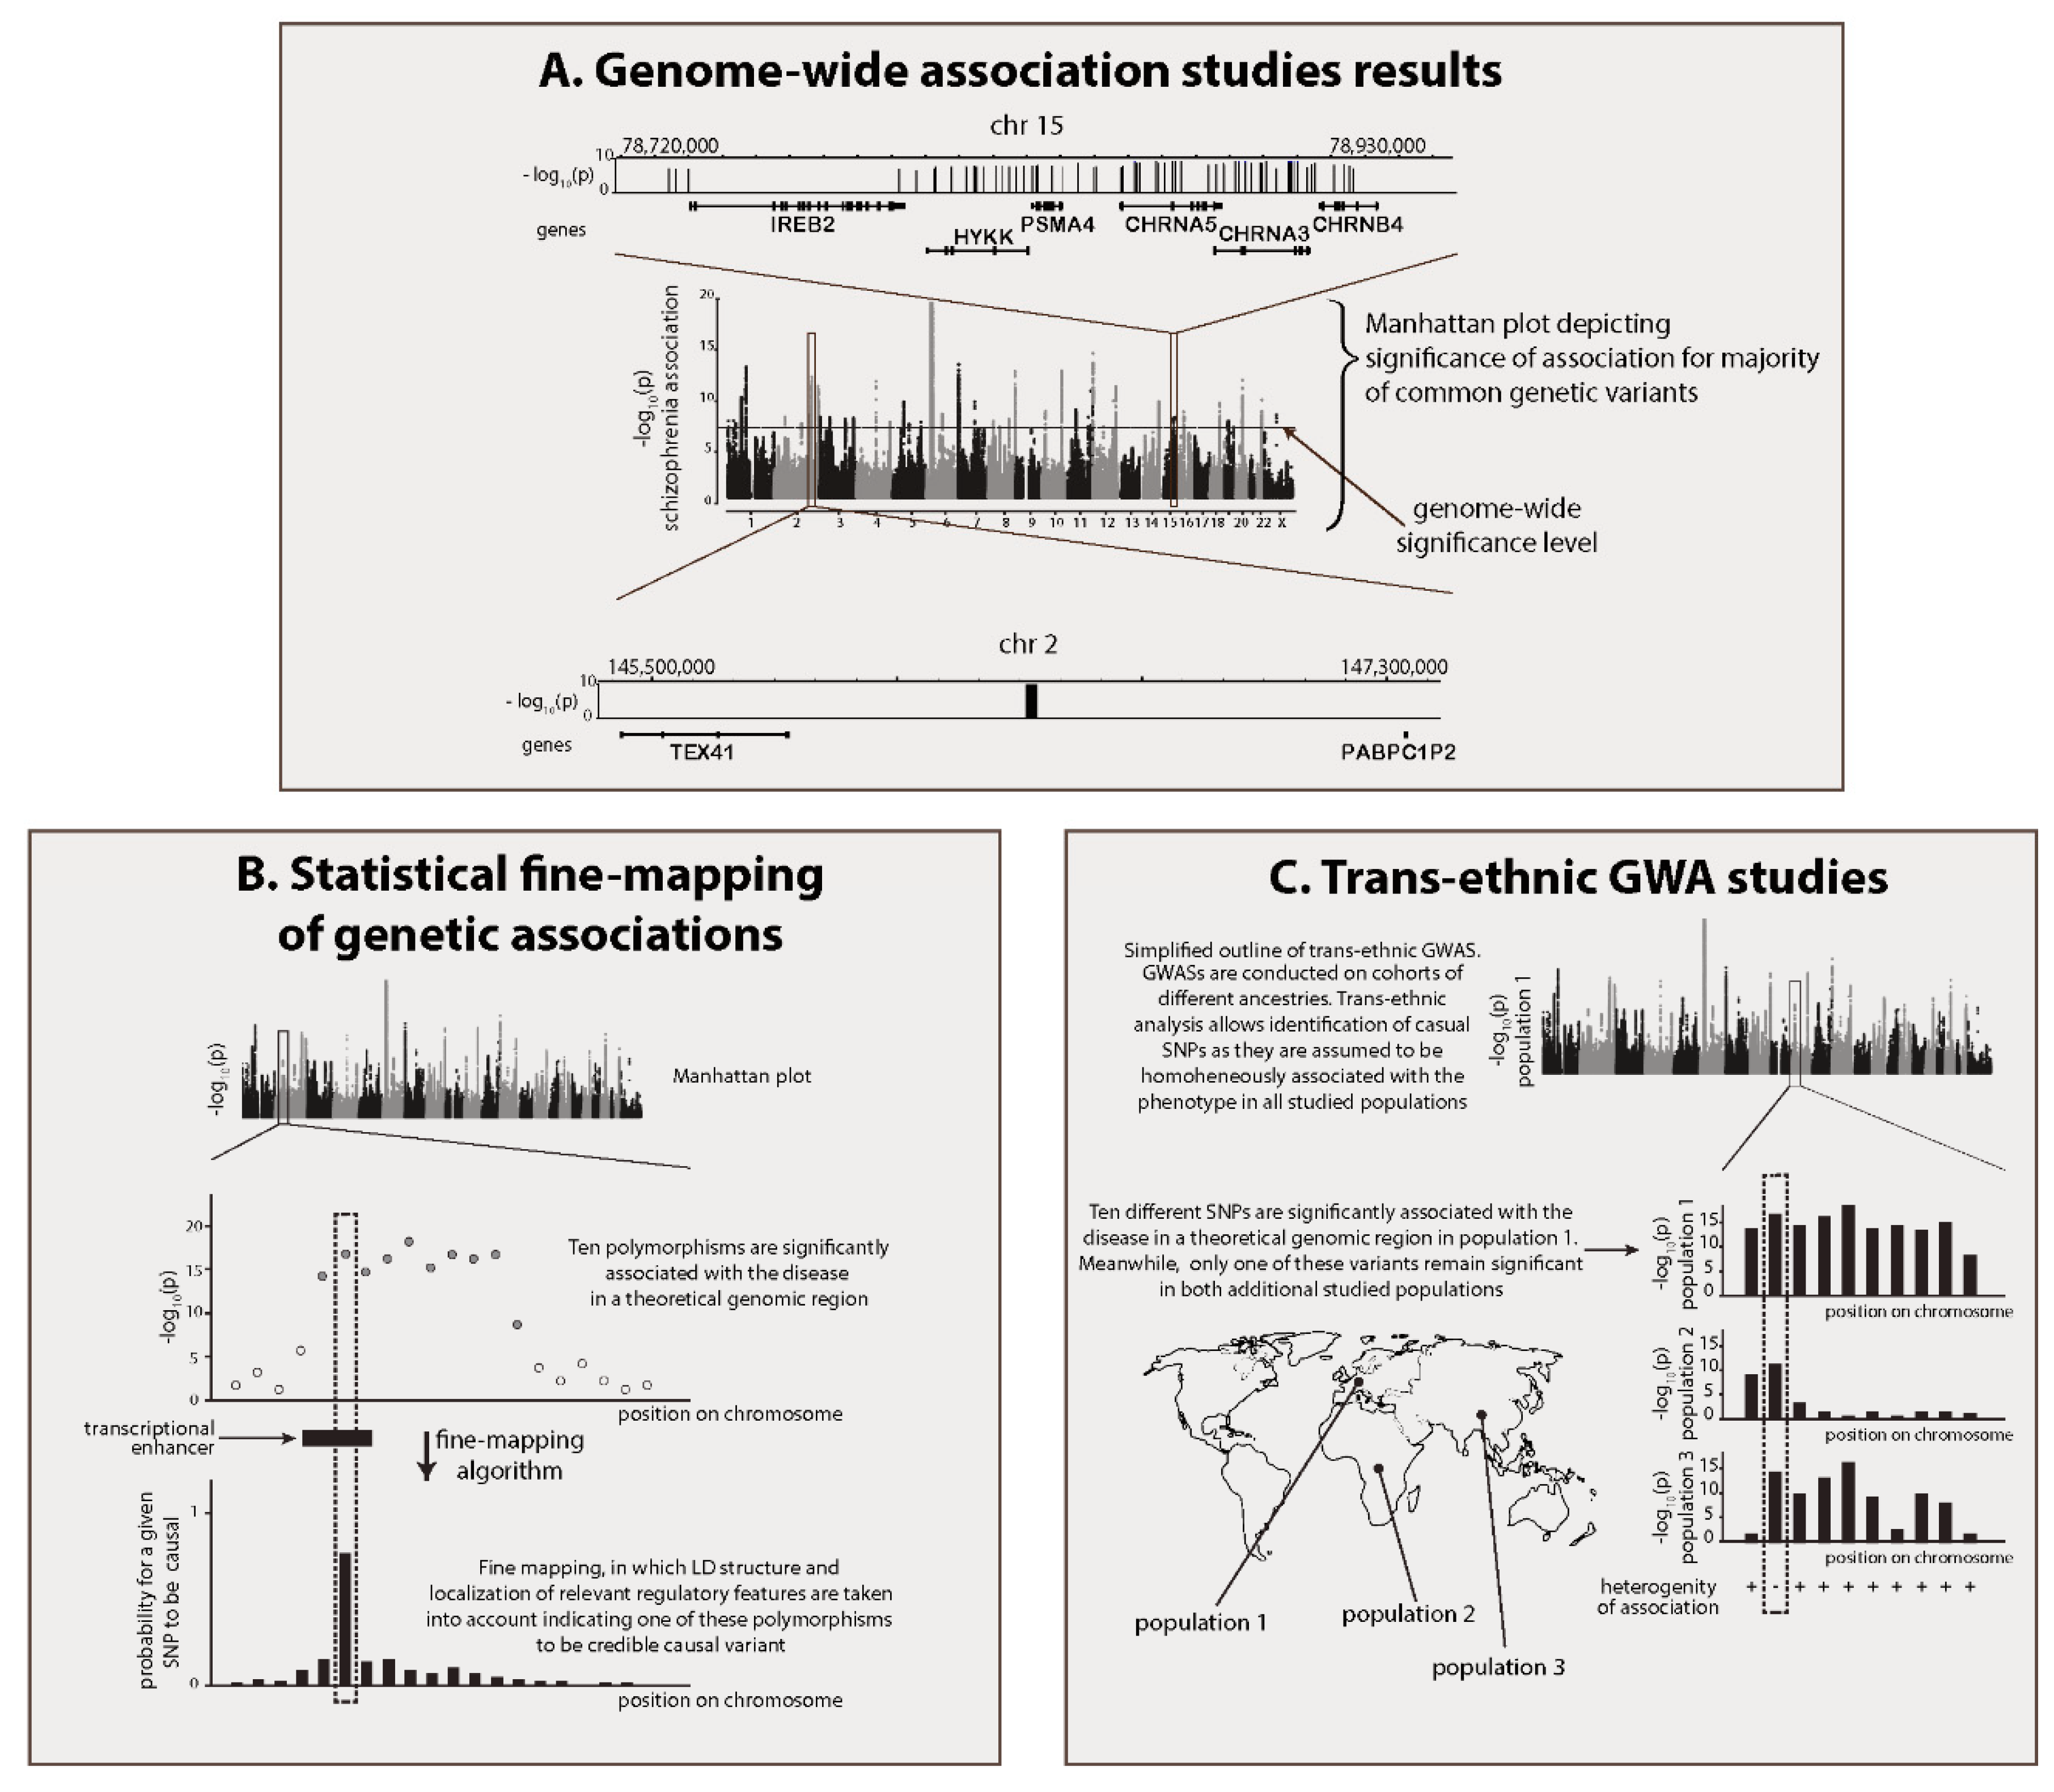
| Statistical fine-mapping of genetic associations (BIMBAM, CAVIAR, FINEMAP, etc.) | This approach is represented by a family of instruments that seeks to determine causal variants in each GWAS region. Basically, fine-mapping algorithms seek to predict which polymorphism in a disease-associated linkage disequilibrium (LD) block better explains association of the entire region with the phenotype. | In some cases, causal SNPs can be confidently identified within schizophrenia GWAS regions with statistical fine-mapping. If such variants are localized outside of the coding regions, their position relative to predicted and functionally confirmed brain enhancers can be assessed. Episome-based functional reporter assays and genome/epigenome editing can be subsequently applied to confirm enhancer activity and find genes controlled by this particular schizophrenia-associated enhancer. | [11,28] |
| Trans-ethnic GWAS meta-analysis | In trans-ethnic GWASs, results of several GWAS experiments, obtained for genetically distant populations, are compared side-by-side. This approach is based on the notion that true causal variants must be associated with the disease in any studied cohort, independent of background LD structure. Thus, trans-ethnic GWASs take advantage of differences in LD structure among various human populations to fine-map causal polymorphisms. | All strategies described for statistical fine-mapping of genetic associations are applicable to trans-ethnic GWASs. | [29,30] |
| Differential expression (DE) analysis | There are a number of computational tools for decent comparison of RNA-seq (or expression microarray) results between different tissues, different experimental conditions or individuals with different phenotypes. Collectively these tools can be referred to as DE analysis. The main output of DE analysis is a list of genes, of which expression significantly differs between compared datasets. | Genes differentially expressed in brains of cases and controls could be potentially involved in schizophrenia development. However, it is extremely hard to pinpoint truly causal genes among thousands of genes found to be differentially expressed in these two cohorts. In recent years, this strategy has been largely replaced by transcriptome-wide association studies and iso/eQTL analysis. | [21,22] |
| e/isoQTL analysis | Joined analysis of RNA-seq data and matched genome-wide genotyping results obtained from the cohort of individuals allows discovery of relationships between SNPs and levels of gene expression in the studied tissue. SNPs that significantly influence levels of expression or splicing pattern of any gene are called eQTLs and isoQTLs. | Originally, it was assumed that SNPs associated with schizophrenia, and at the same time being brain e/isoQTLs, are highly likely causal variants. Furthermore, genes regulated by such SNPs in the brain are credible schizophrenia genes. However, accumulation of data regarding e/isoQTL in the human brain (now thousands of such SNPs are detected) has led to the notion that e/isoQTL can co-localize with disease-associated variants by chance. Therefore, more rigorous approaches are now utilised to reliably confirm colocalization of GWAS and e/isoQTL signal (see “Colocalization tests”). | [21,22] |
| Transcriptome-wide association study (TWAS) | Joined analysis of GWAS summary statistics and e/isoQTL analysis summary statistics makes possible inference of genetically-determined differences in expression levels of all genes between cases and controls of GWAS study in a given tissue (which is the tissue used in e/isoQTL analysis). The output of TWAS is a list of genes, of which expression significantly differs between cases and controls. | TWASs, based on schizophrenia GWASs and e/isoQTL analysis of human neuronal tissues, predict genes regulated by schizophrenia-associated polymorphisms. Essentially, there is definition of schizophrenia causal genes. However, owing to the phenomenon of LD, some TWAS-detected genes can be controlled by polymorphisms linked to causal ones. To account for these artefacts, additional tests, confirming colocalization of GWAS and e/isoQTL signals, are usually conducted (see “Colocalization tests”). | [22,31,32] |
| Colocalization tests (SMR/HEIDI, Sherlock, coloc, etc.) | Colocalization tests are statistical tools used to verify whether association of a given polymorphism with two different phenotypes (e.g., disease and level of RNA of a specific gene in eQTL analysis) are based on the LD between two different causal SNPs or actual pleiotropy of one genetic variant. | Colocalization tests are often employed to confirm colocalization of a schizophrenia GWAS signal and signal from neuronal e/isoQTL analysis. This same approach is used both in simple e/isoQTL analysis and in TWASs. Given the rapid growth of both GWAS and e/isoQTL datasets, the peril of random colocalization of signals increase, which can subsequently lead to false-positive schizophrenia genes. Therefore, relevance of colocalization tests in these approaches has been realized in recent years. | [22,31,32] |
| Weighted gene co-expression network analysis (WGCNA) | WGCNA is a data-driven method used for extraction of information, regarding gene sets, from expression data. In WGCNA, a number of RNA-seq (or expression microarray) datasets from the same tissue of different individuals is analysed. Alternatively, in some cases, information from various tissues can be used. Correlations in expression of all possible gene pairs are calculated, then correlation-based clustering of genes is performed. Clusters (modules) of tightly correlated (co-expressed) genes are assumed to represent biologically meaningful gene sets. | Modules detected with WGCNA analysis in human brains are useful gene sets, which are widely used in gene set enrichment analysis and partitioned heritability analysis. These methods allow detection of WGCNA modules relevant to schizophrenia development. | [22,33] |
| Gene set enrichment analysis (MAGMA, FORGE, ALLIGATOR, MAGENTA, INRICH) | Gene set enrichment analysis (GSEA) is a toolbox of algorithms (e.g., MAGMA, FORGE, ALLIGATOR, MAGENTA, INRICH) used for inference of causal disease gene sets from GWAS summary statistics. Basically, gene-level p-values of disease association are calculated with these algorithms. Then, a list of studied gene sets and genes falling in each of these gene sets are submitted to the algorithm. Association of each gene set is assessed, based on gene-level p-values. Gene sets which survive multiple comparison adjustments are considered to be disease-relevant. Gene sets used in GSEA can be derived from various sources: curated databases (see Table 2), WGCNA analysis, experimentally defined gene sets (e.g., genes regulated by certain transcription factors, miRNA, or RNA-binding molecules) or markers of different cell types. | Various GSEA algorithms are used in schizophrenia post-GWAS studies to detect disease-relevant molecular networks and cell types. Among the most commonly used gene sets in this kind of analysis are: brain-derived WGCNA modules, genes specifically expressed in various cell populations, gene sets associated with neurological and behavioural changes in mice (from MGD database, see Table 2), and experimentally compiled gene sets with some pre-existing evidence, indicating their association with the disease (e.g., FMRP targets, RBFOX1 targets, genes of proteins of NMDA receptor complex, etc.). | [11,34] |
| Partitioned heritability analysis | Partitioned heritability analysis is an alternative means to GSEA to detect phenotype-relevant gene sets or any other subset of genomic regions (ChIP-seq or ATAC-seq peaks, introns, exons, etc.). Heritability explained by certain types of genomic regions is compared in this algorithm with heritability explained by randomly sampled genomic regions. Regions significantly enriched in GWAS-derived disease heritability are assumed to be disease-relevant. All remarks about gene sets used in GSEA are applicable to partitioned heritability analysis. | All strategies described for gene set enrichment analysis are applicable to partitioned heritability analysis. Additionally, enhancer markers (derived from ChIP-seq or/and chromatin accessibility assays) for various tissues can be used to infer schizophrenia-relevant cell types. | [20,22,34] |
| Resource | Type of Information | Description | Link |
|---|---|---|---|
| Psychiatric genomics consortium (PGC) | GWAS results | Data on PGC-conducted GWASs for schizophrenia and various other common psychiatric diseases. Summary statistics are publicly available. | [35] |
| MRC centre for neuropsychiatric genetics and genomics | GWAS results | Publicly available summary statistics of the largest published meta-analysis of schizophrenia GWASs. | [10] |
| ENCODE (Encyclopedia of DNA elements) | Epigenomic and transcriptomic datasets, regulatory annotations | Raw and processed data on gene expression and chromatin structure in various human and mouse cell types. Integrative annotation of regulatory elements in dozens of cell types is also available. All datasets are publicly accessible. | [36] |
| Roadmap Epigenomics project | Epigenomic and transcriptomic datasets | Raw and processed data on gene expression and chromatin structure in human stem cells and primary ex vivo tissues. All datasets are publicly available. | [37] |
| FANTOM5 (Functional annotation of the mammalian genome) | Transcriptomic datasets, regulatory annotations | Сomprehensive data on RNA expression in different mammalian cell types. Annotations of promoters, enhancers and promoter-enhancer links are compiled. All datasets are publicly available. | [38] |
| GTEx (the genotype-tissue expression project) | Transcriptomic datasets | Genome-wide expression profiles for 54 non-diseased tissues of a human body. | [39] |
| CommonMind consortium knowledge portal | Genotype data, epigenomic and transcriptomic datasets | Expression data with matched genotype and ATAC-seq data from hundreds of postmortem brain samples from donors with schizophrenia, bipolar disease, and individuals with no neuropsychiatric disorders. Access to raw data is controlled. Results of differential expression and eQTL analysis are publicly available. | [40] |
| PsychENCODE consortium knowledge portal | Genotype data, epigenomic and transcriptomic datasets, system-level integrative models | Epigenomic and transcriptomic datasets from hundreds of brain samples from donors with psychiatric conditions and individuals with no neuropsychiatric diagnosis on different ontogenetic stages. Raw data is access-controlled. Outputs of various types of follow-up analysis (eQTL, TWAS, WGCNA, cell type-specific regulatory networks, etc.) are publicly available. | [41] |
| KEGG (Kyoto encyclopedia of genes and genomes) pathways database | Collection of annotated gene sets | Publicly available curated functional gene sets. | [42] |
| GO (gene ontology) database | Collection of annotated gene sets | Publicly available lists of genes annotated by GO consortium as sharing “molecular function”, residing in the same “cellular component” or participating in the same “biological process”. | [43] |
| MGD (mouse genome informatics database) | Collection of annotated gene sets | Gene sets compiled by MGD, based on the comprehensive catalogue of mouse mutations and phenotypes caused by these mutations. | [44] |
© 2020 by the authors. Licensee MDPI, Basel, Switzerland. This article is an open access article distributed under the terms and conditions of the Creative Commons Attribution (CC BY) license (http://creativecommons.org/licenses/by/4.0/).
Share and Cite
Golov, A.K.; Kondratyev, N.V.; Kostyuk, G.P.; Golimbet, a.V.E. Novel Approaches for Identifying the Molecular Background of Schizophrenia. Cells 2020, 9, 246. https://doi.org/10.3390/cells9010246
Golov AK, Kondratyev NV, Kostyuk GP, Golimbet aVE. Novel Approaches for Identifying the Molecular Background of Schizophrenia. Cells. 2020; 9(1):246. https://doi.org/10.3390/cells9010246
Chicago/Turabian StyleGolov, Arkadiy K., Nikolay V. Kondratyev, George P. Kostyuk, and and Vera E. Golimbet. 2020. "Novel Approaches for Identifying the Molecular Background of Schizophrenia" Cells 9, no. 1: 246. https://doi.org/10.3390/cells9010246