The Role of the Primary Cilium in Sensing Extracellular pH

Abstract
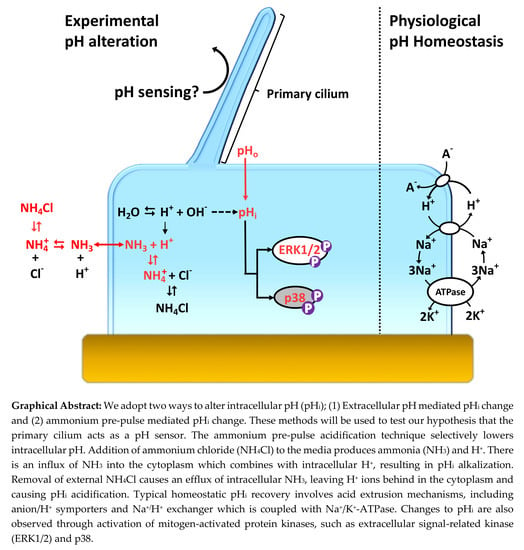
:
1. Introduction
2. Materials and Methods
2.1. Cell Culture
2.2. Decreased Extracellular pH (pHo)
2.3. Decreased Intracellular pH (pHi)
2.4. Intracellular pH Measurement
2.5. Immunoblot
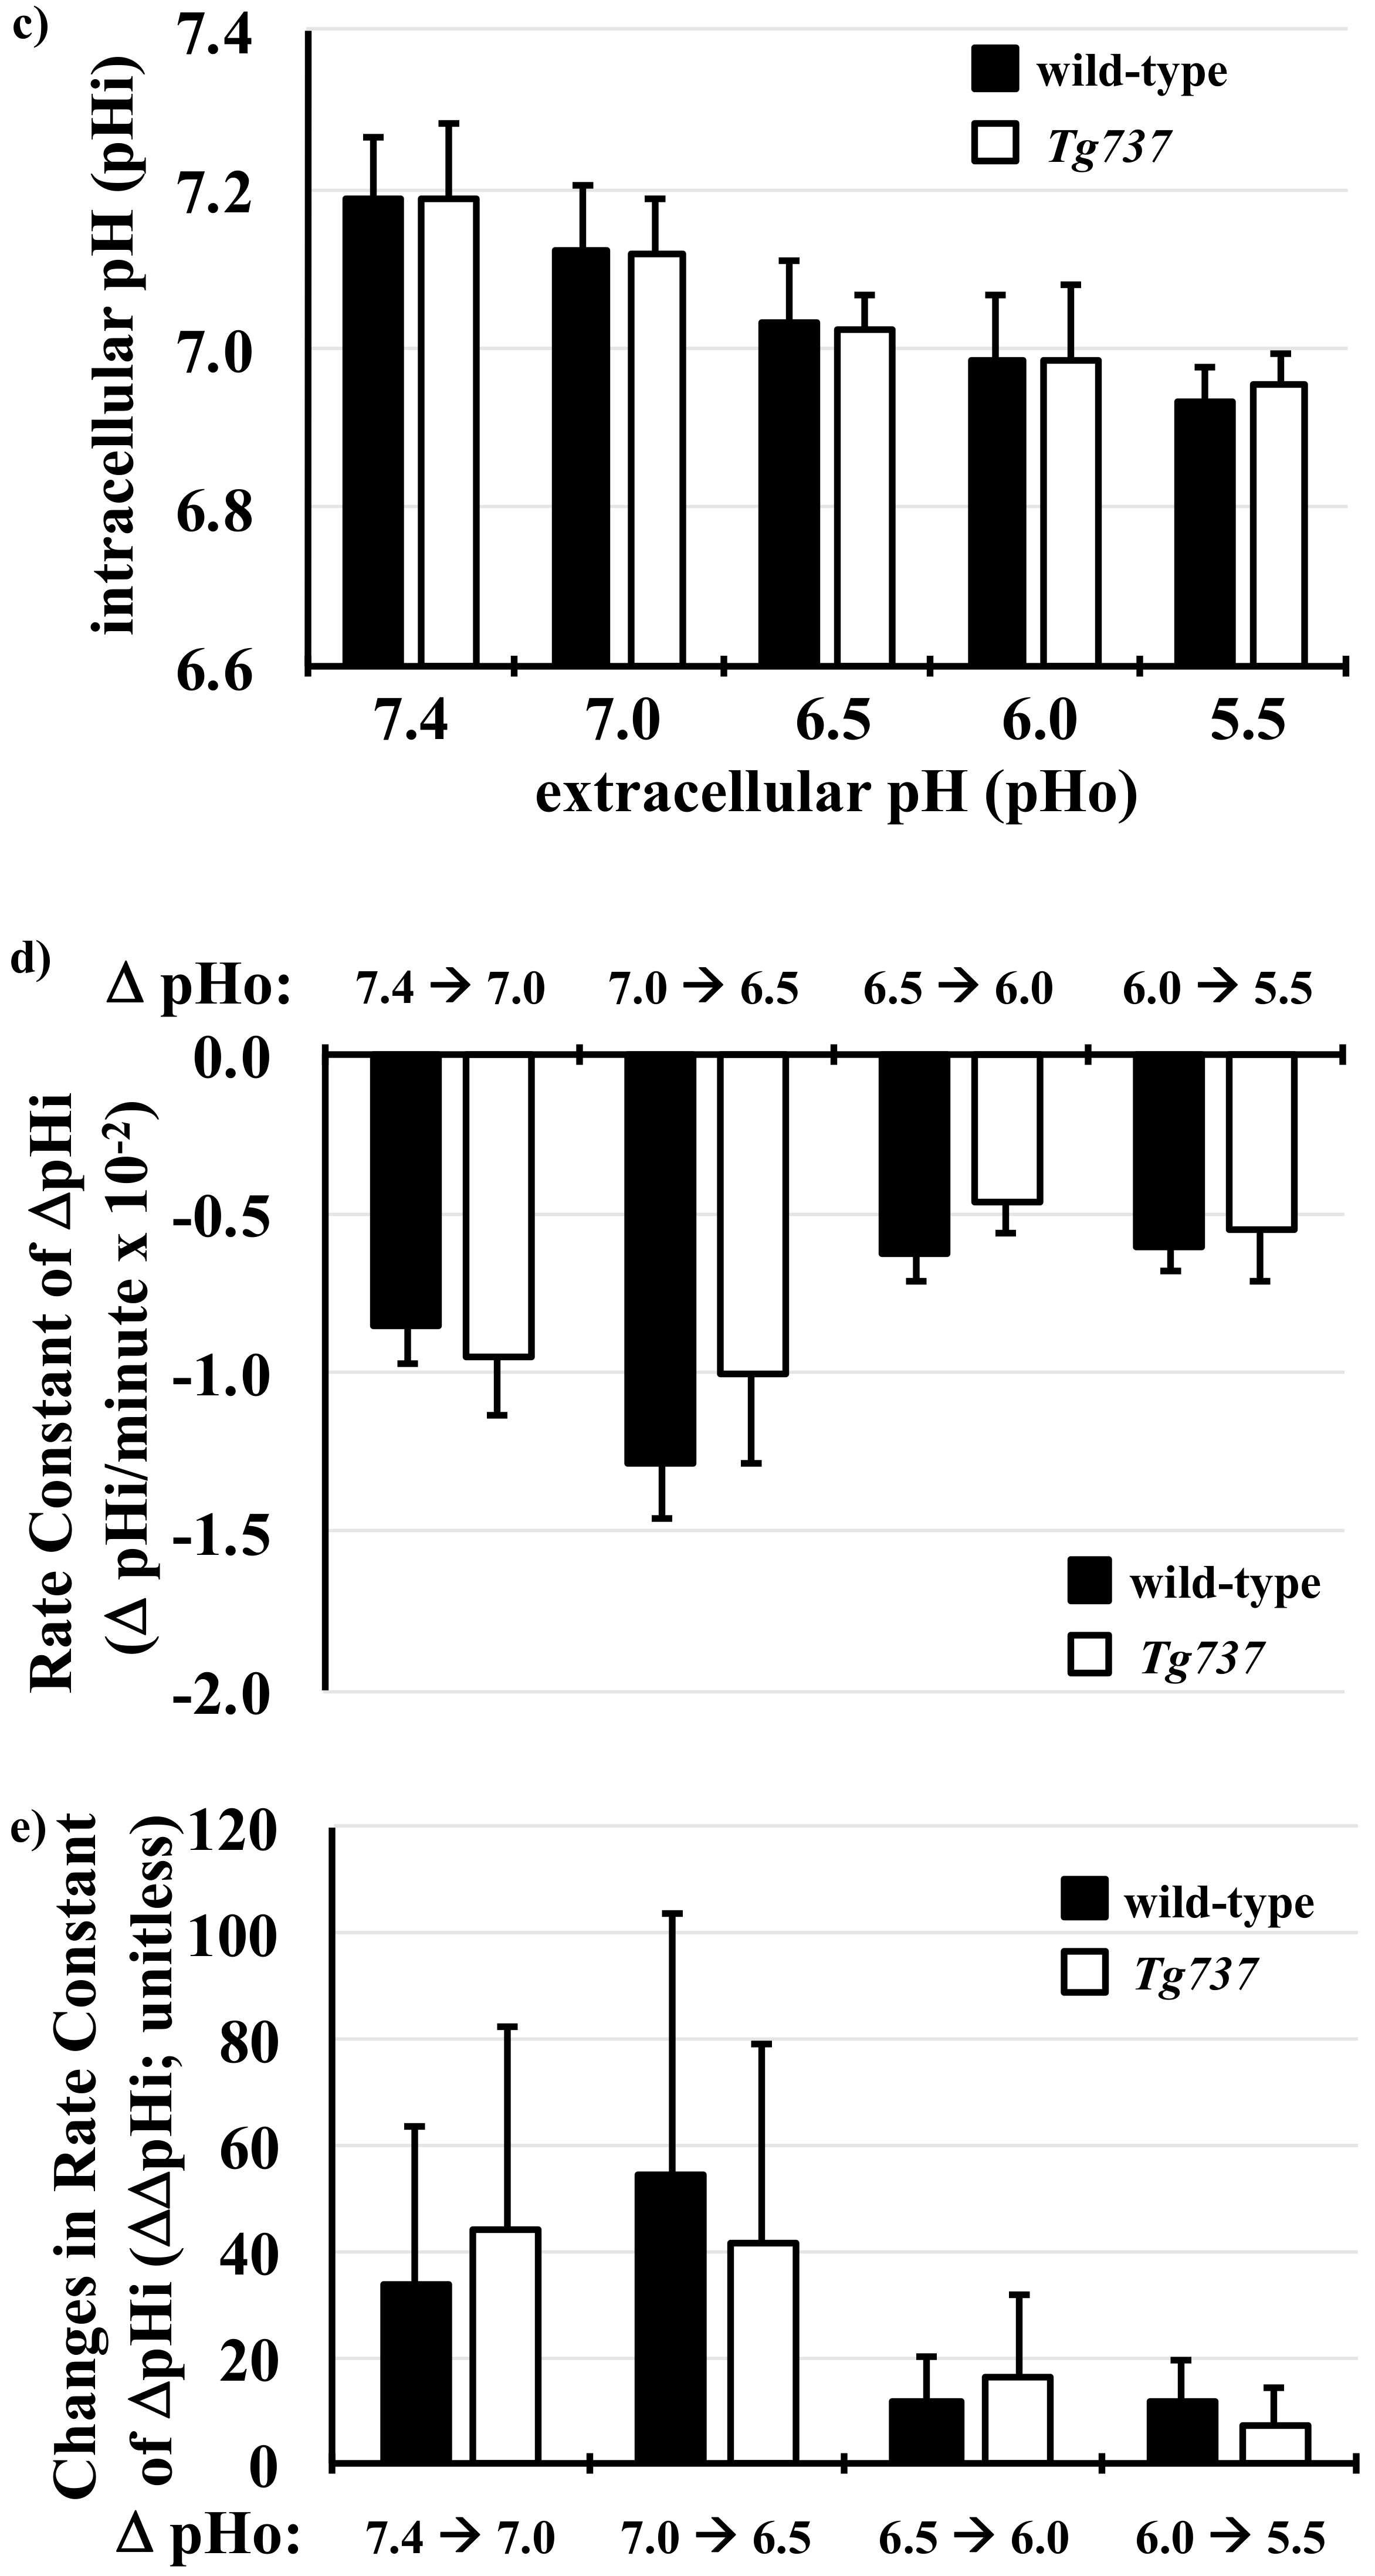
2.6. Primary Cilia Immunostaining
2.7. Scanning Electron Microscopy
2.8. Data Analysis
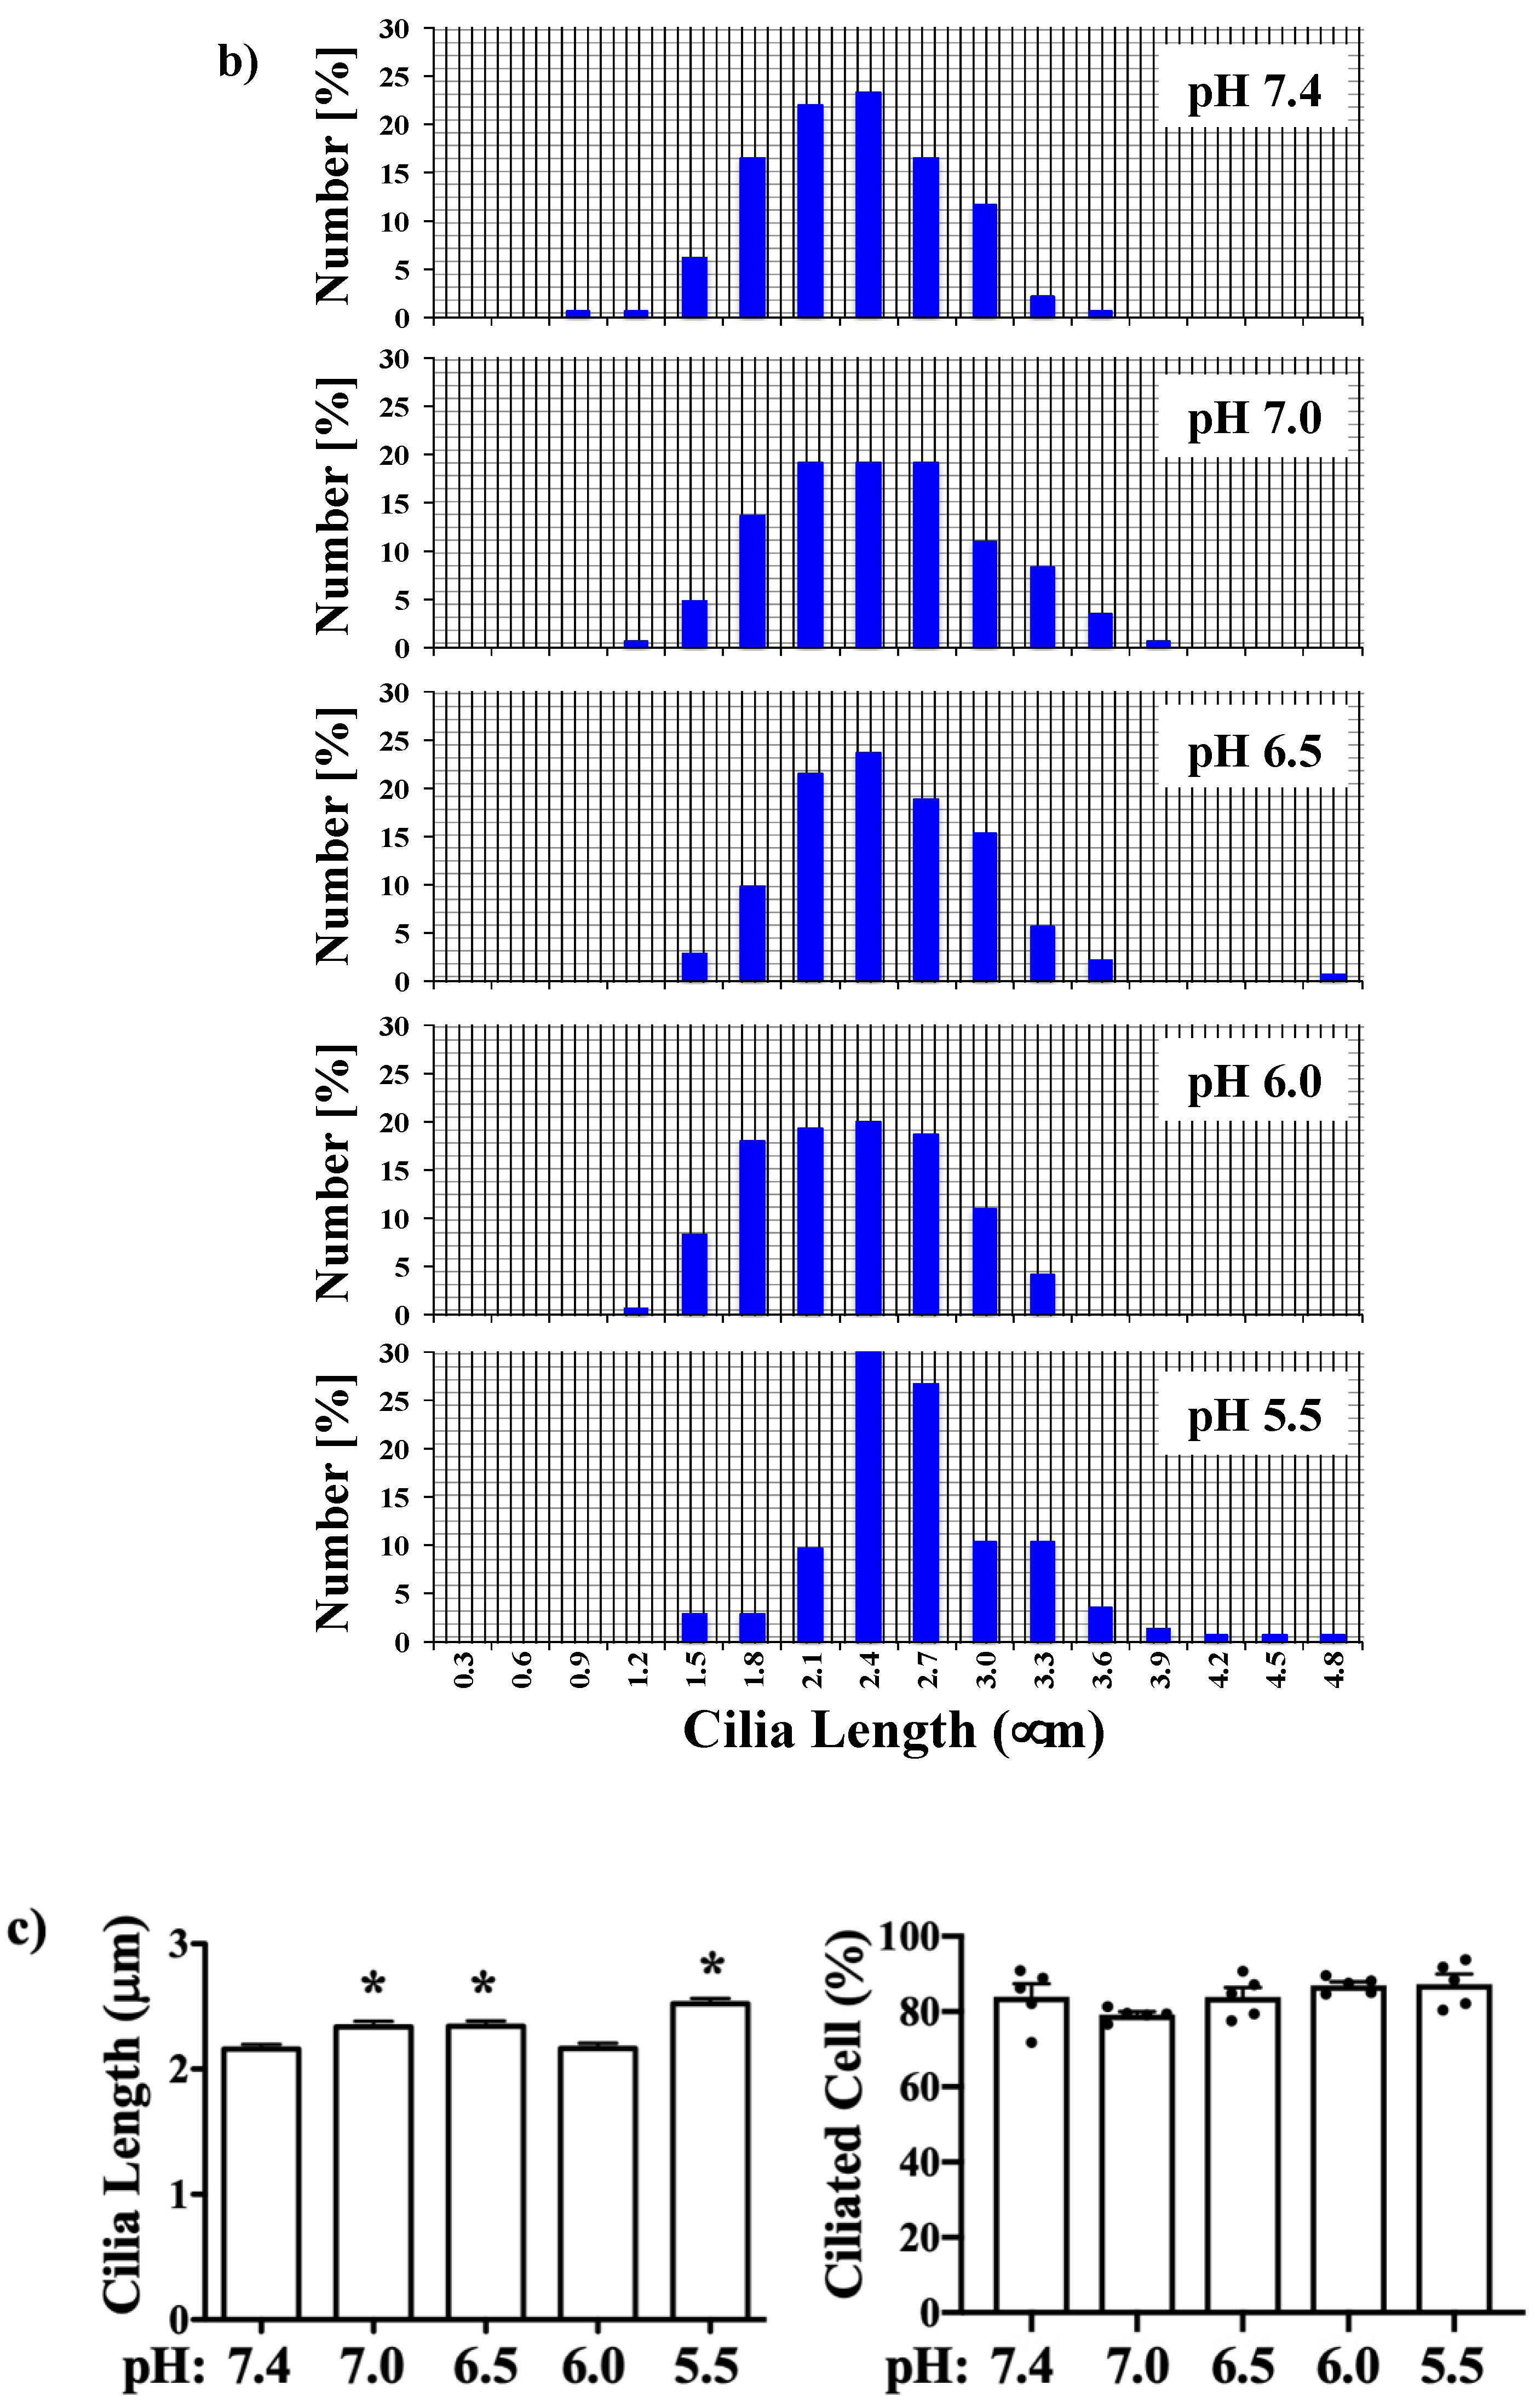
3. Results
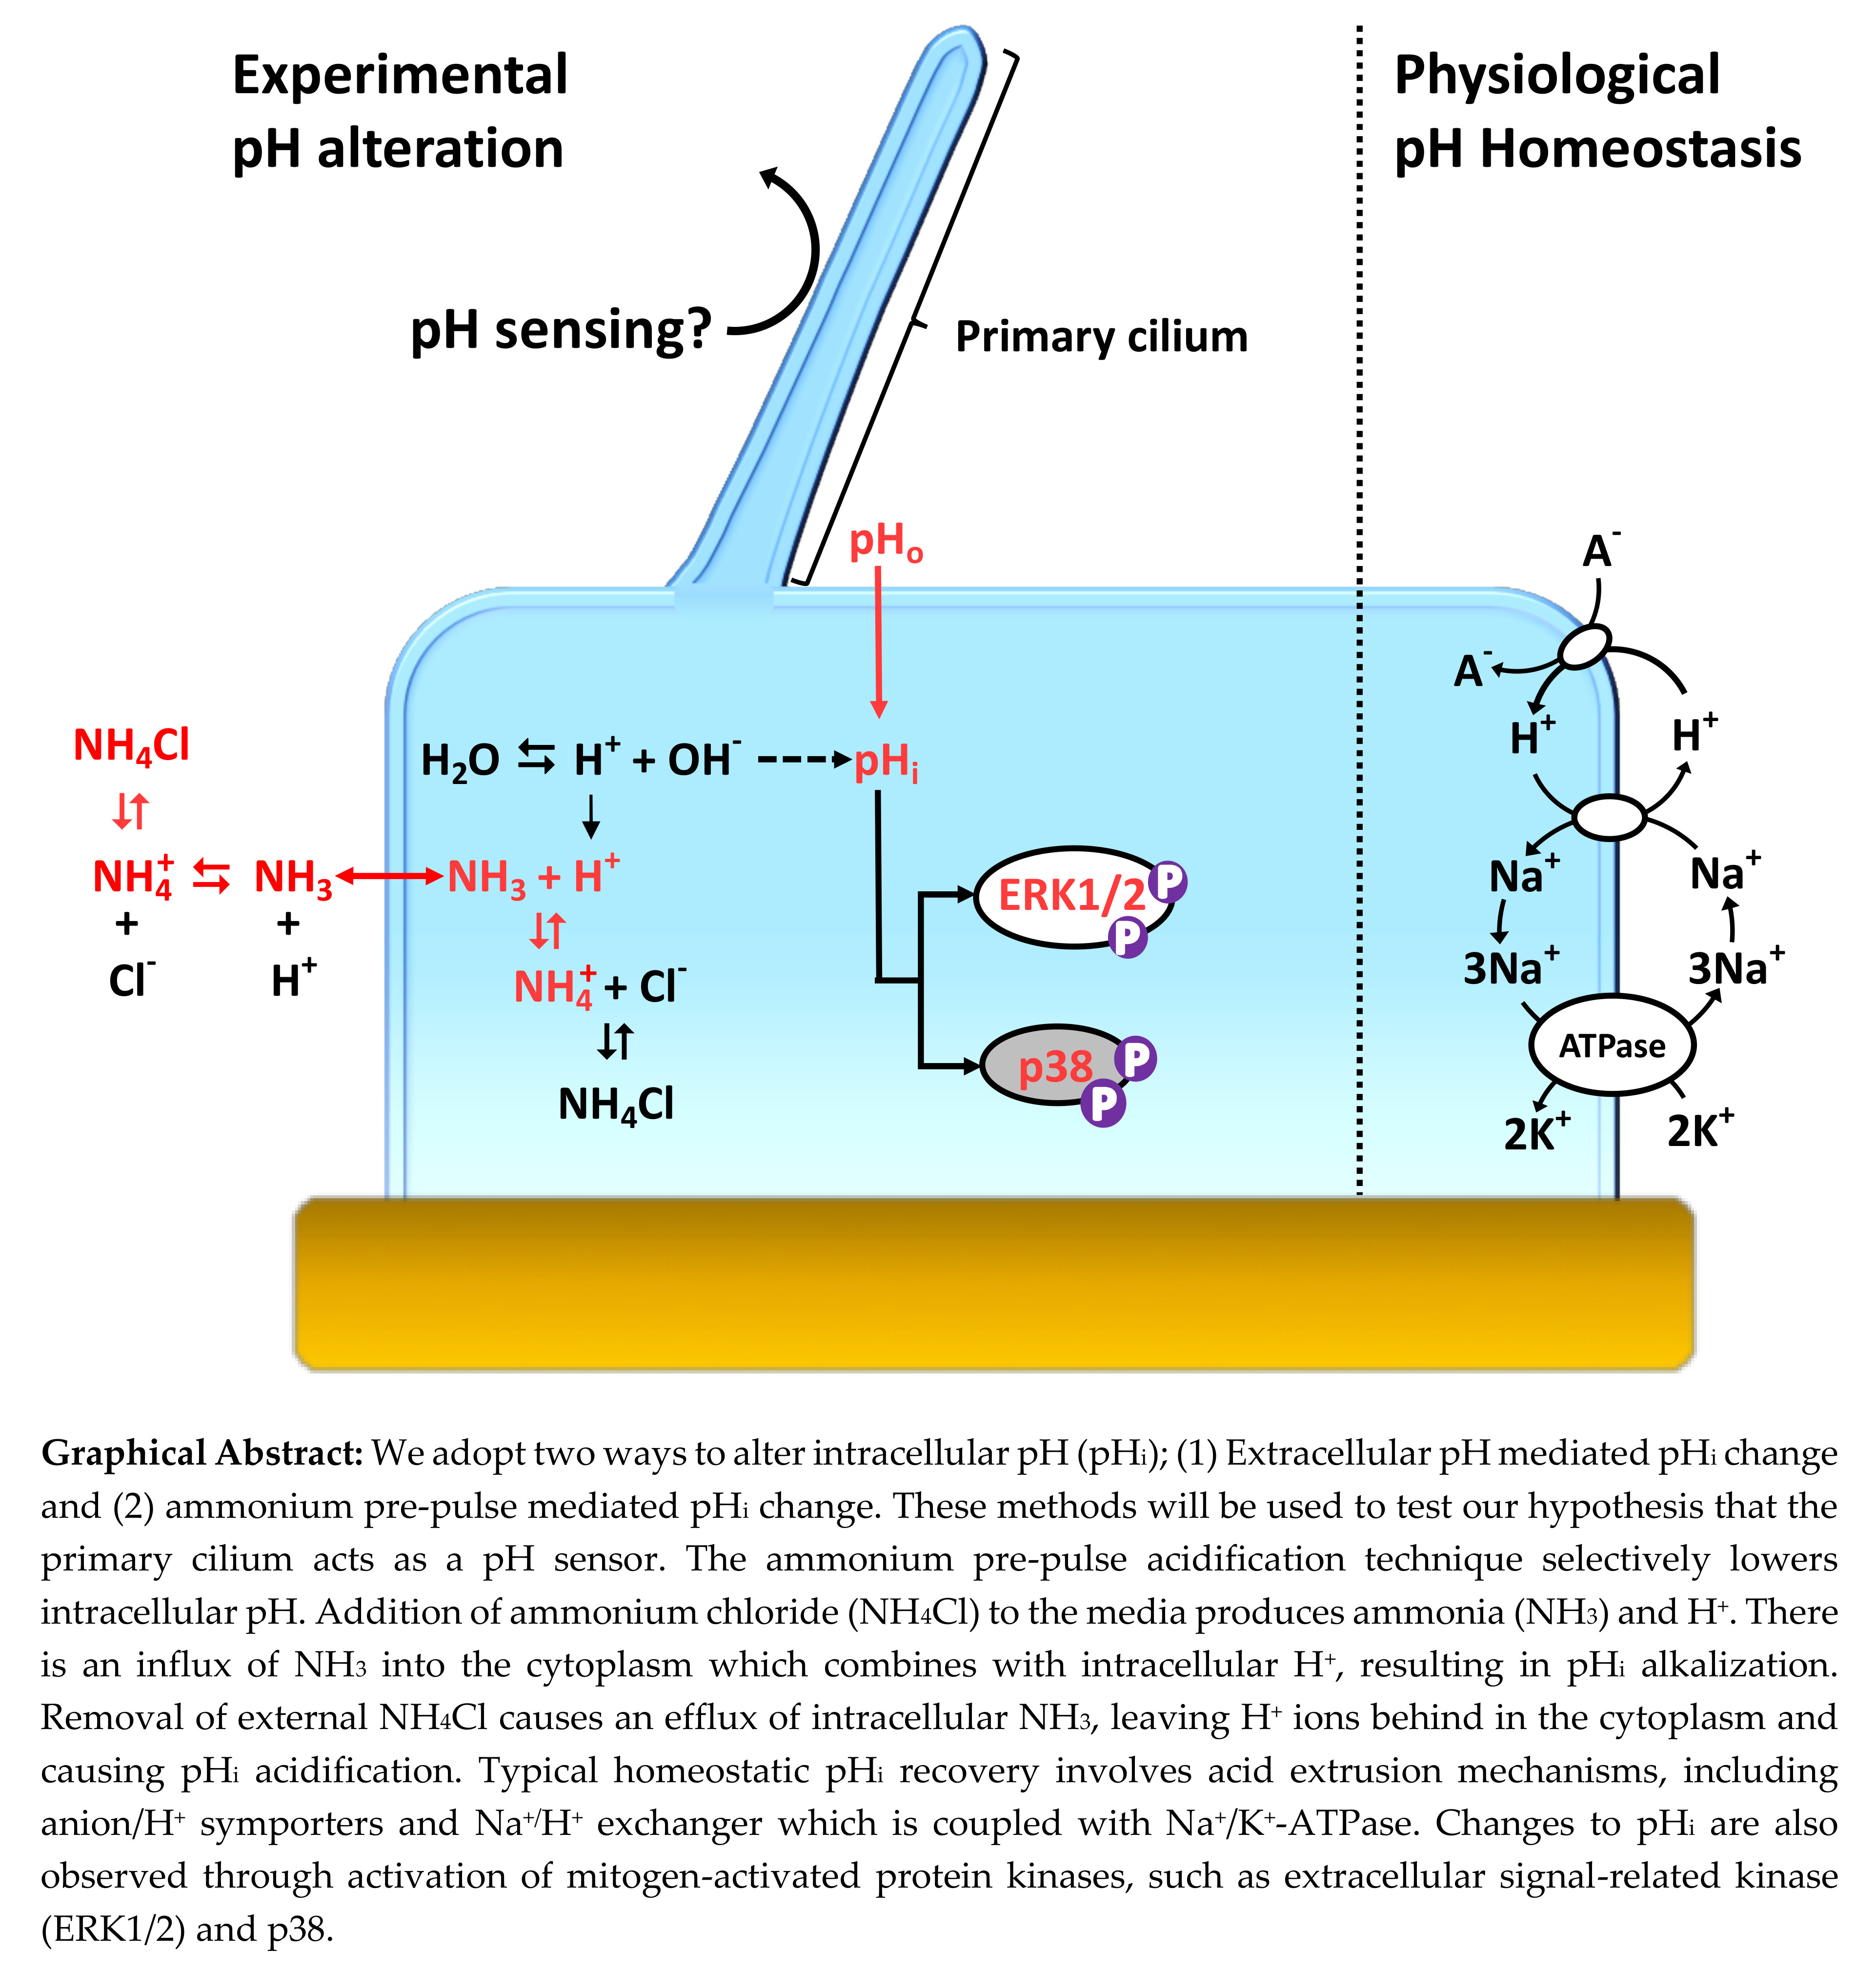
3.1. Intracellular Acidosis in Response to Decreasing pHo in Wild-Type and Tg737 Cells
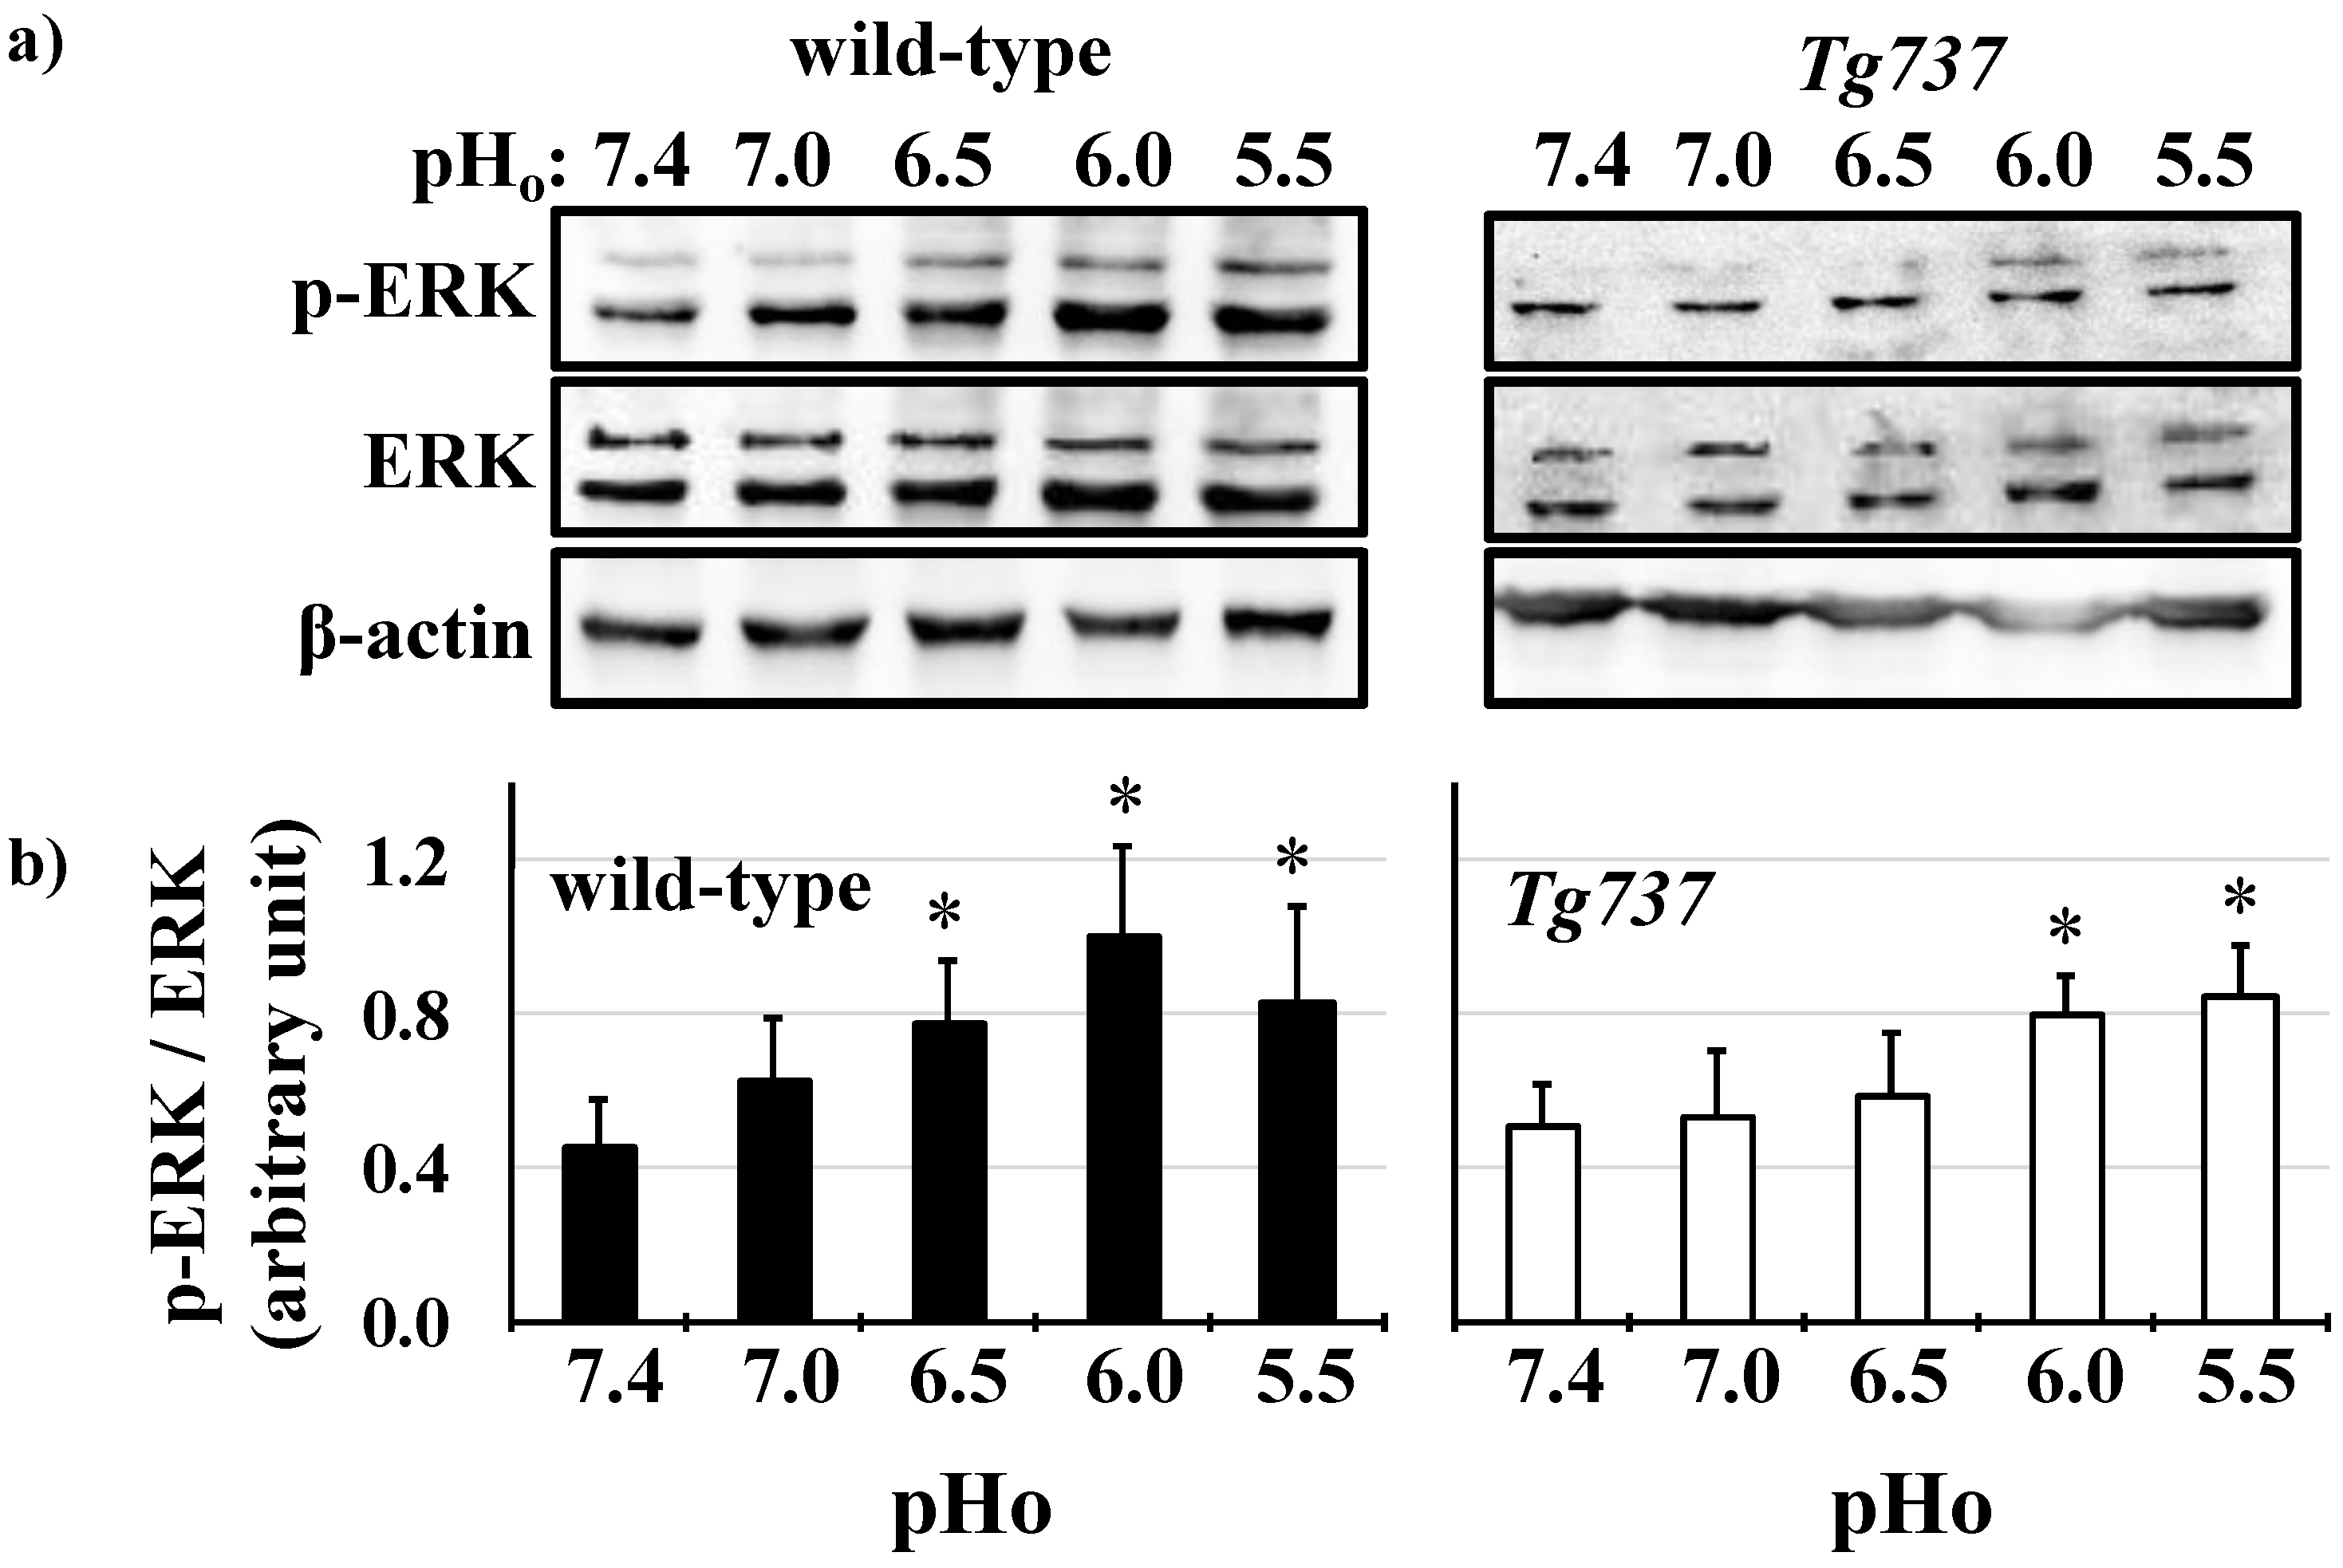
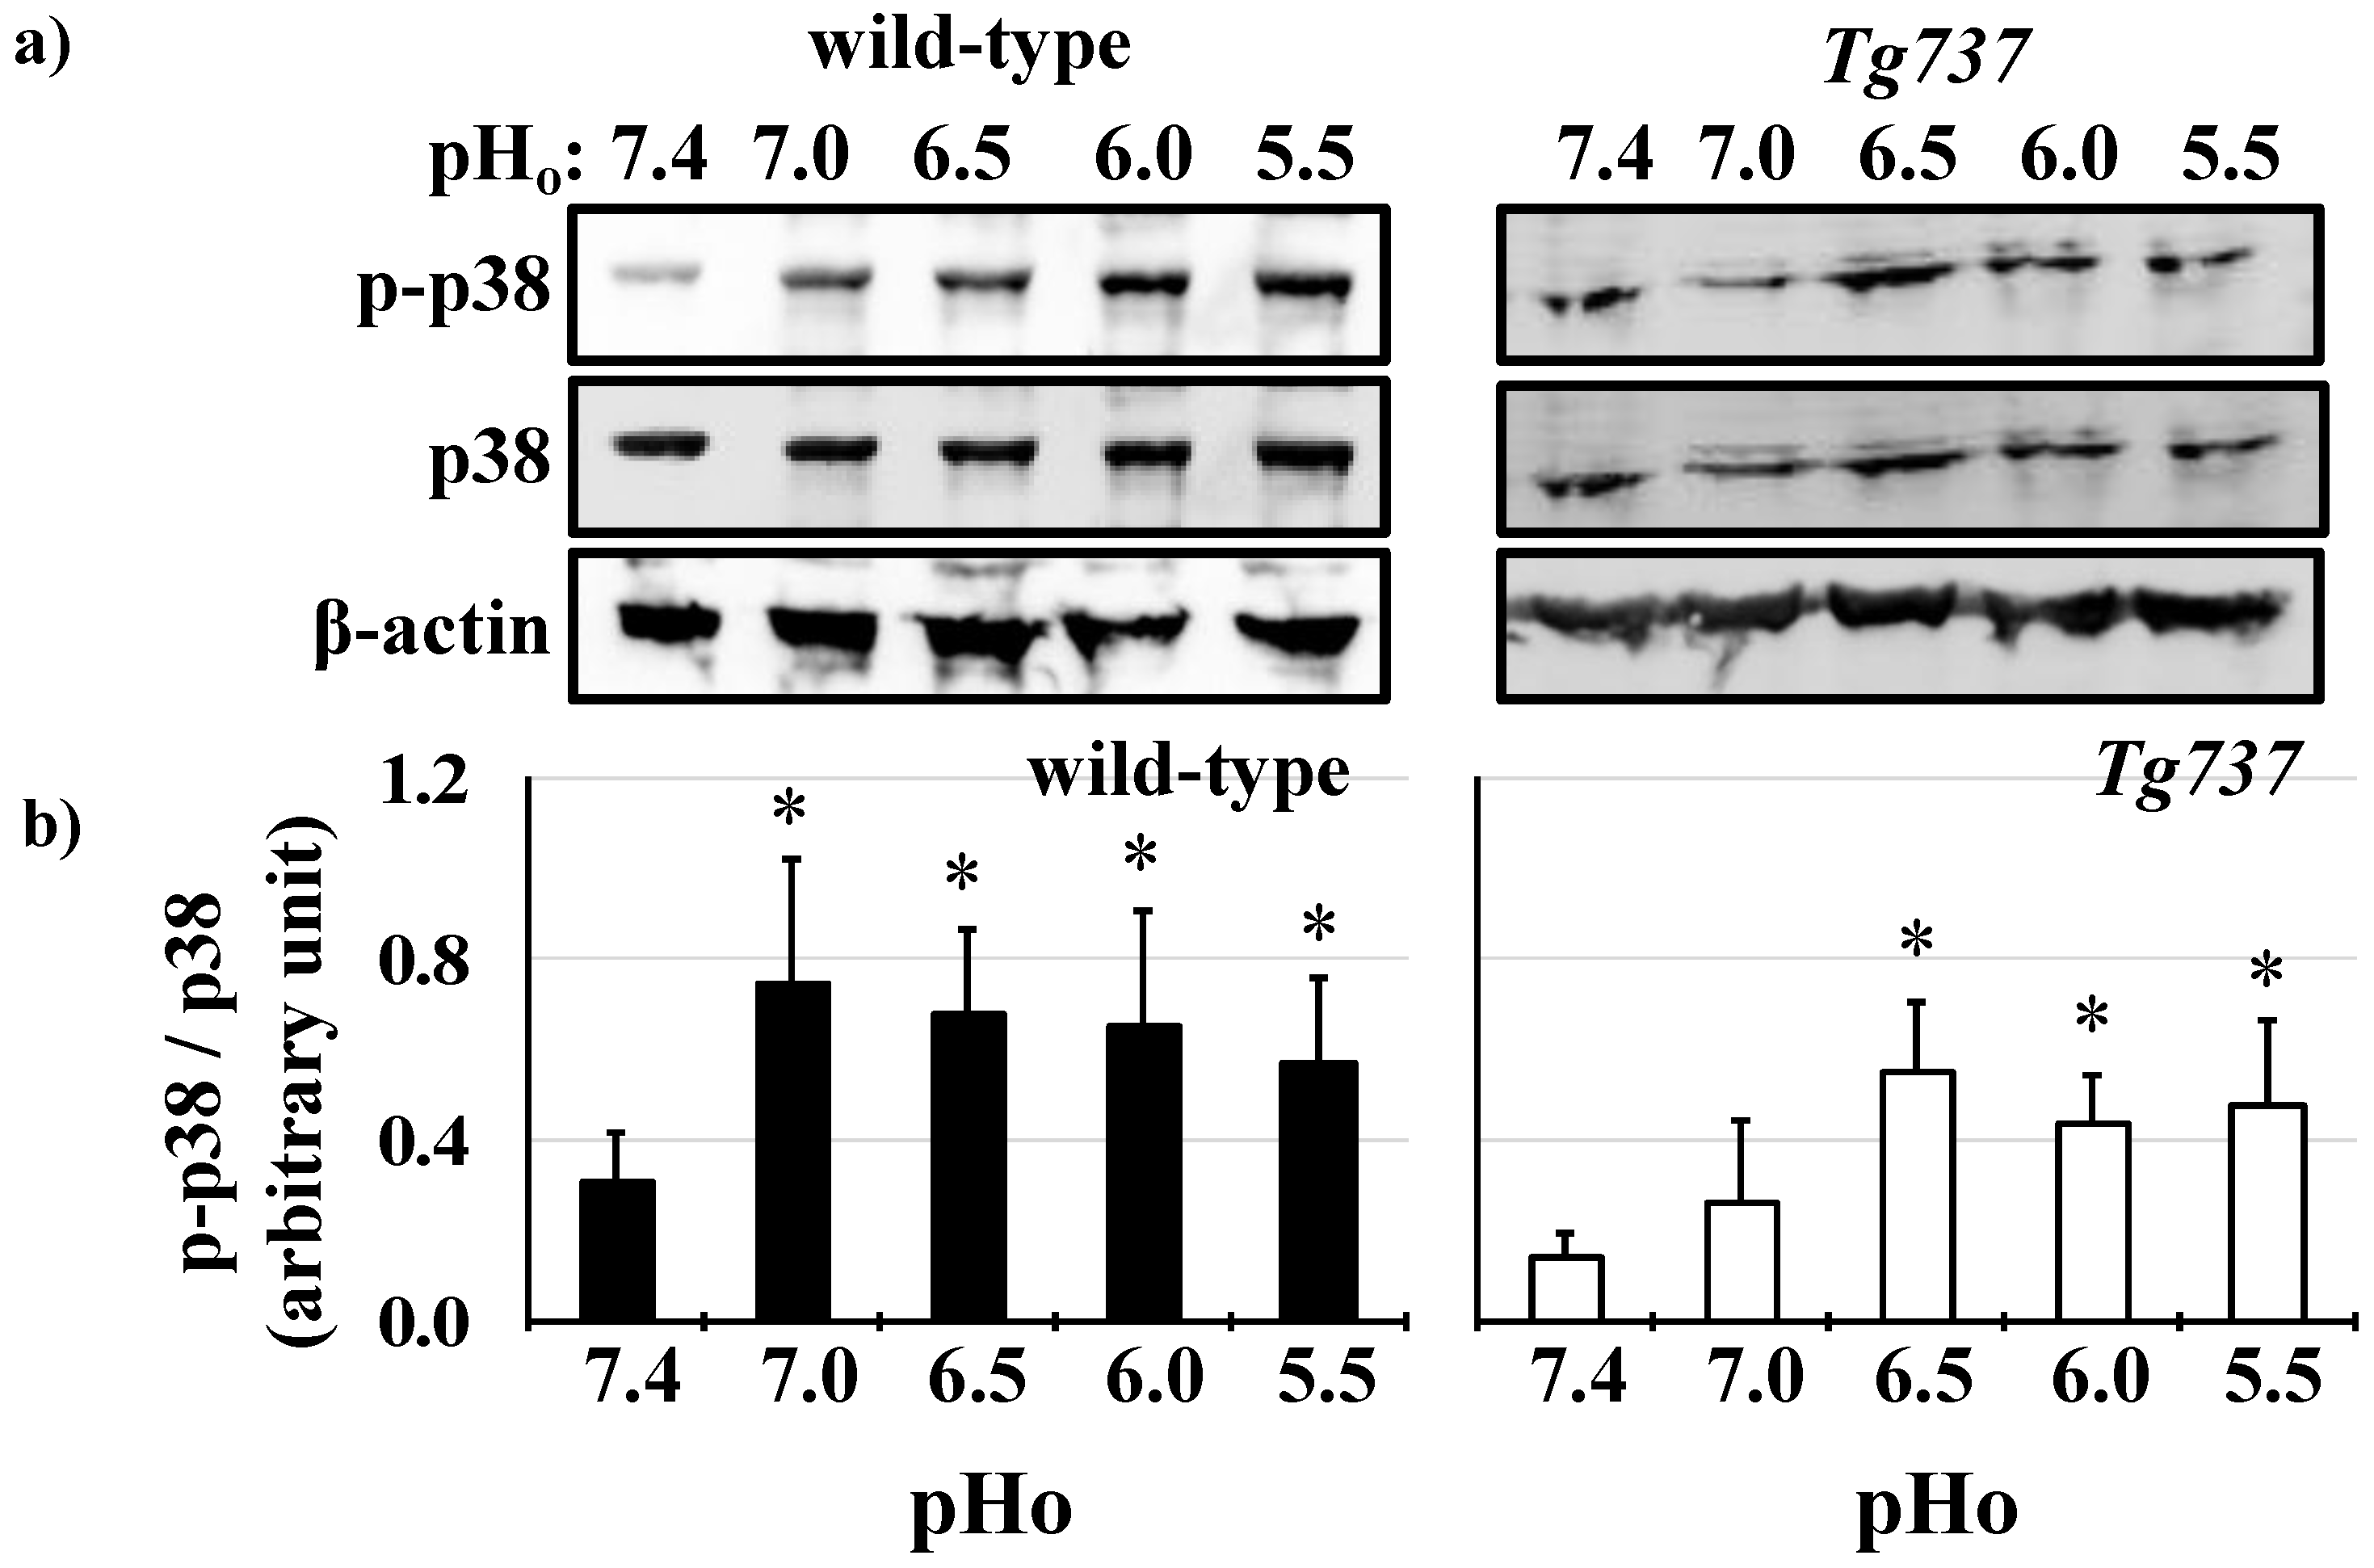
3.2. MAPK Activation in Response to Decreasing pHo in Wild-Type and Tg737 Cells
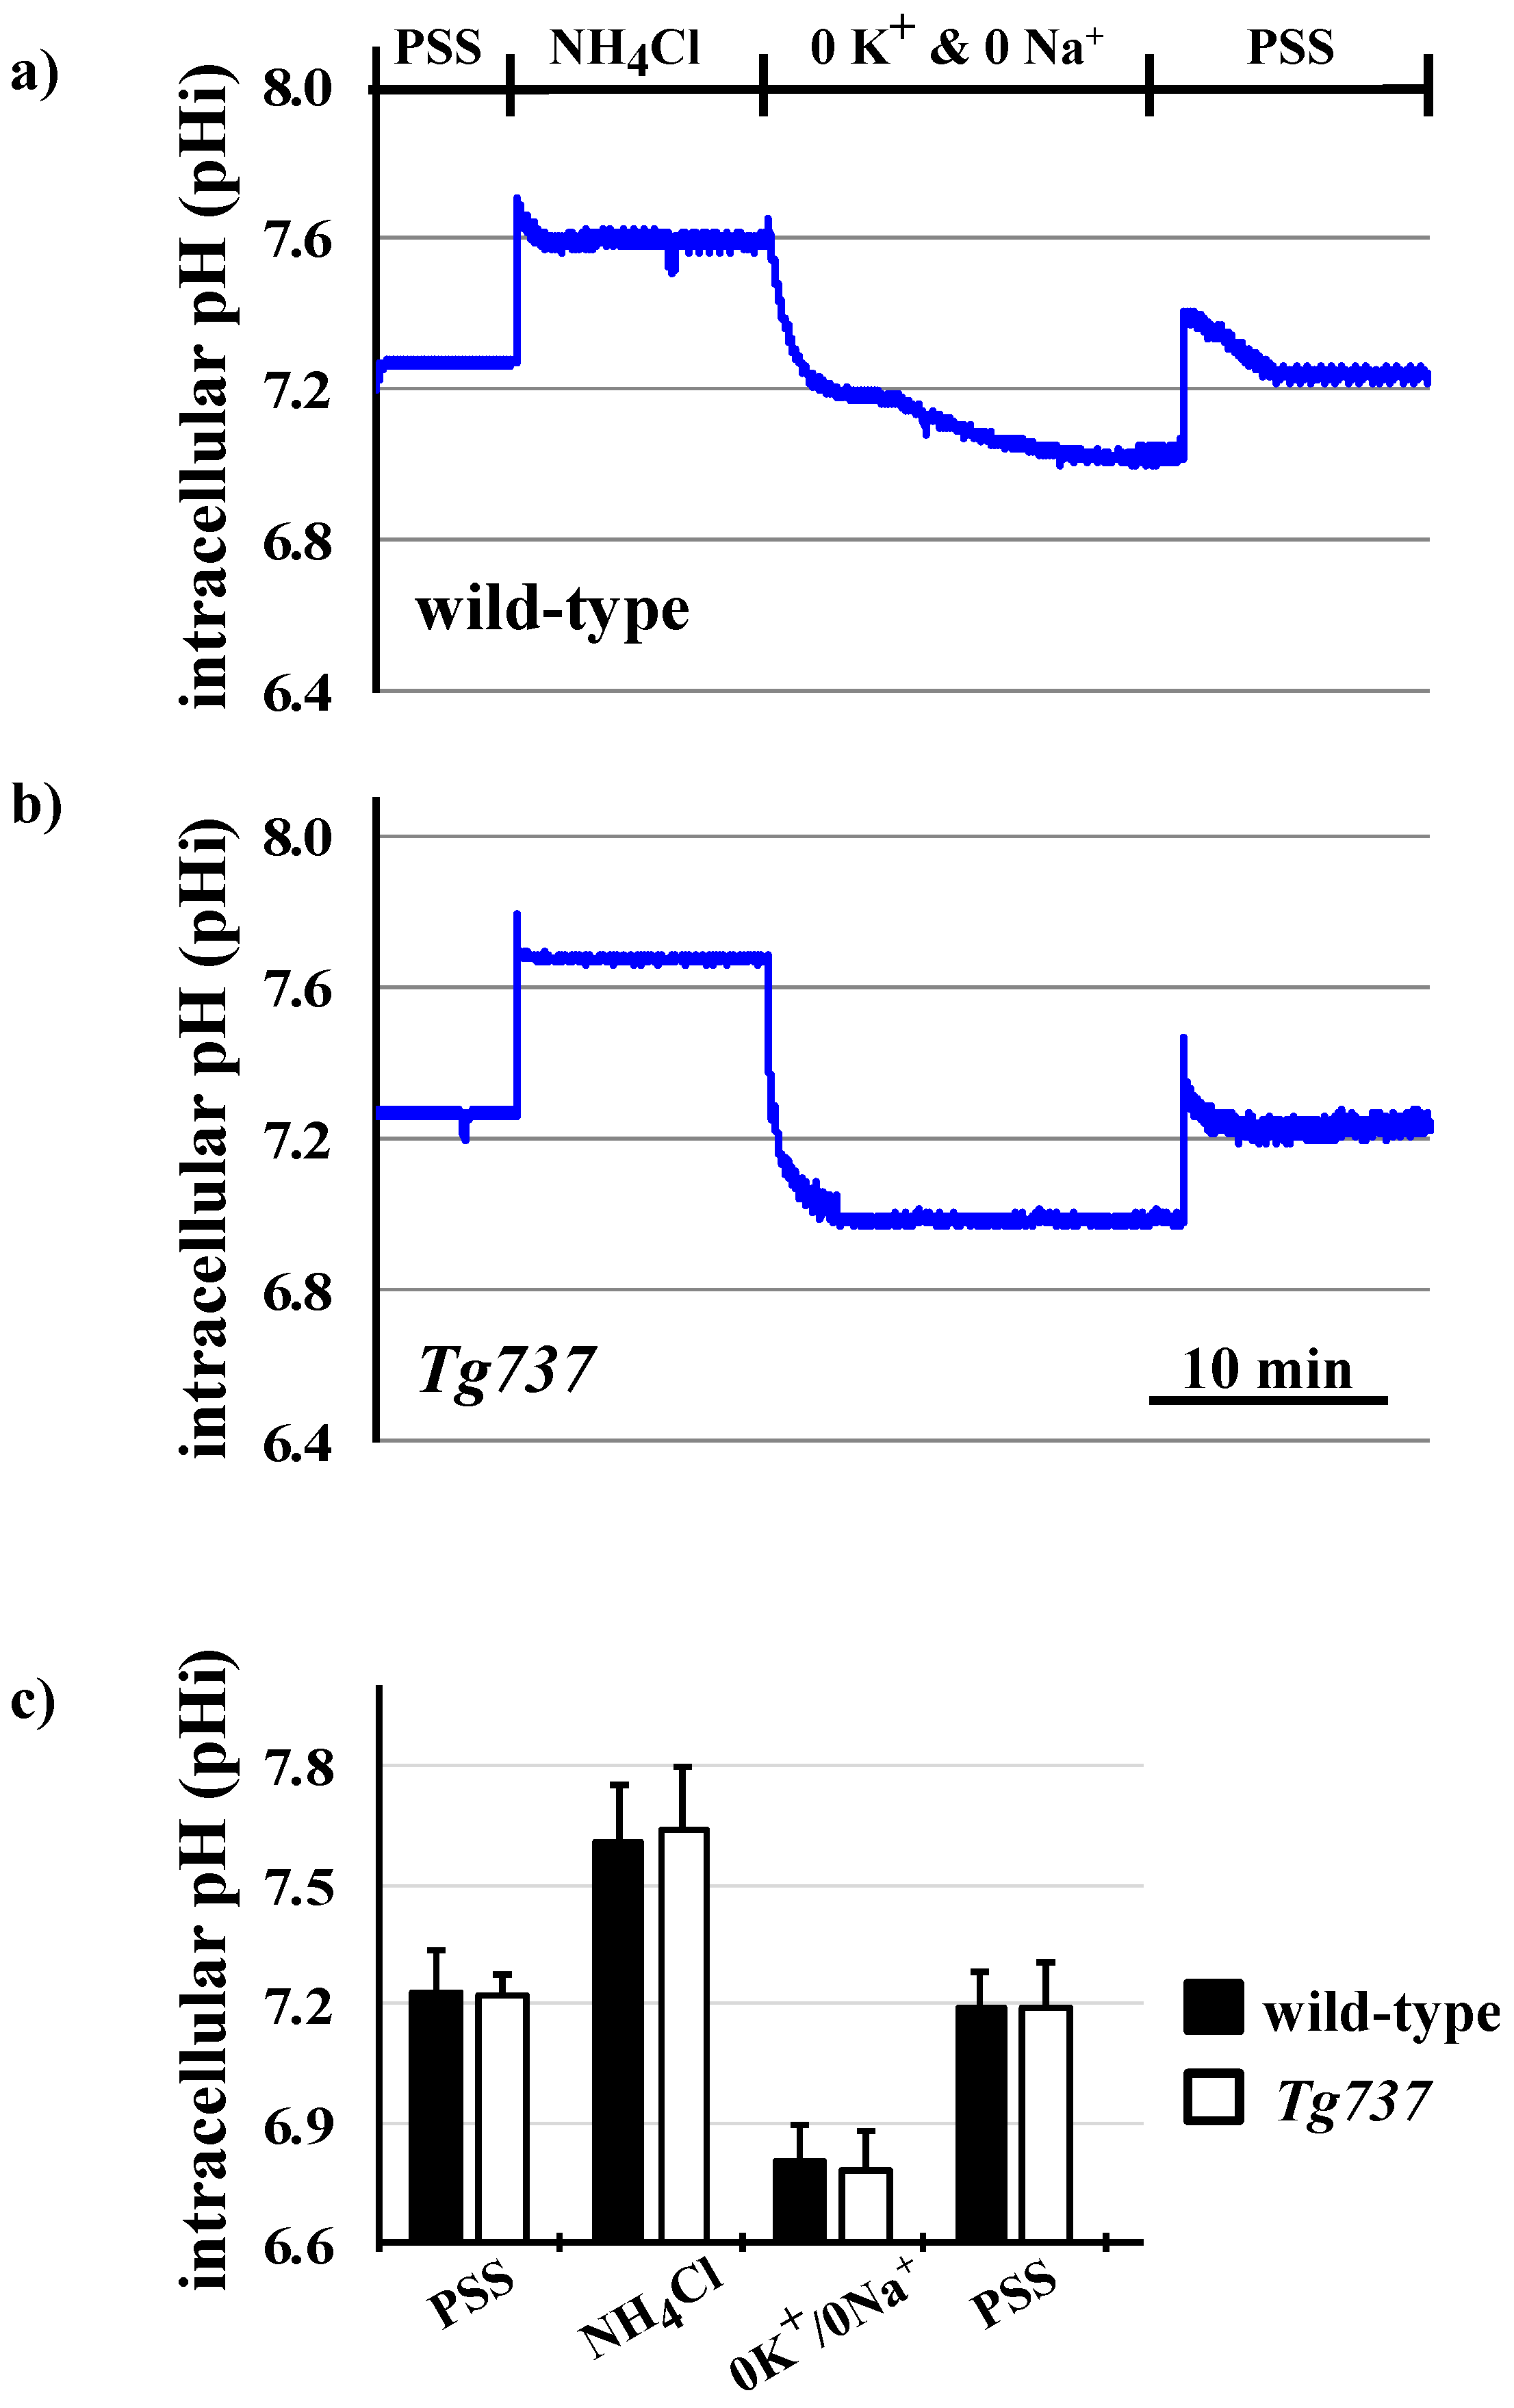
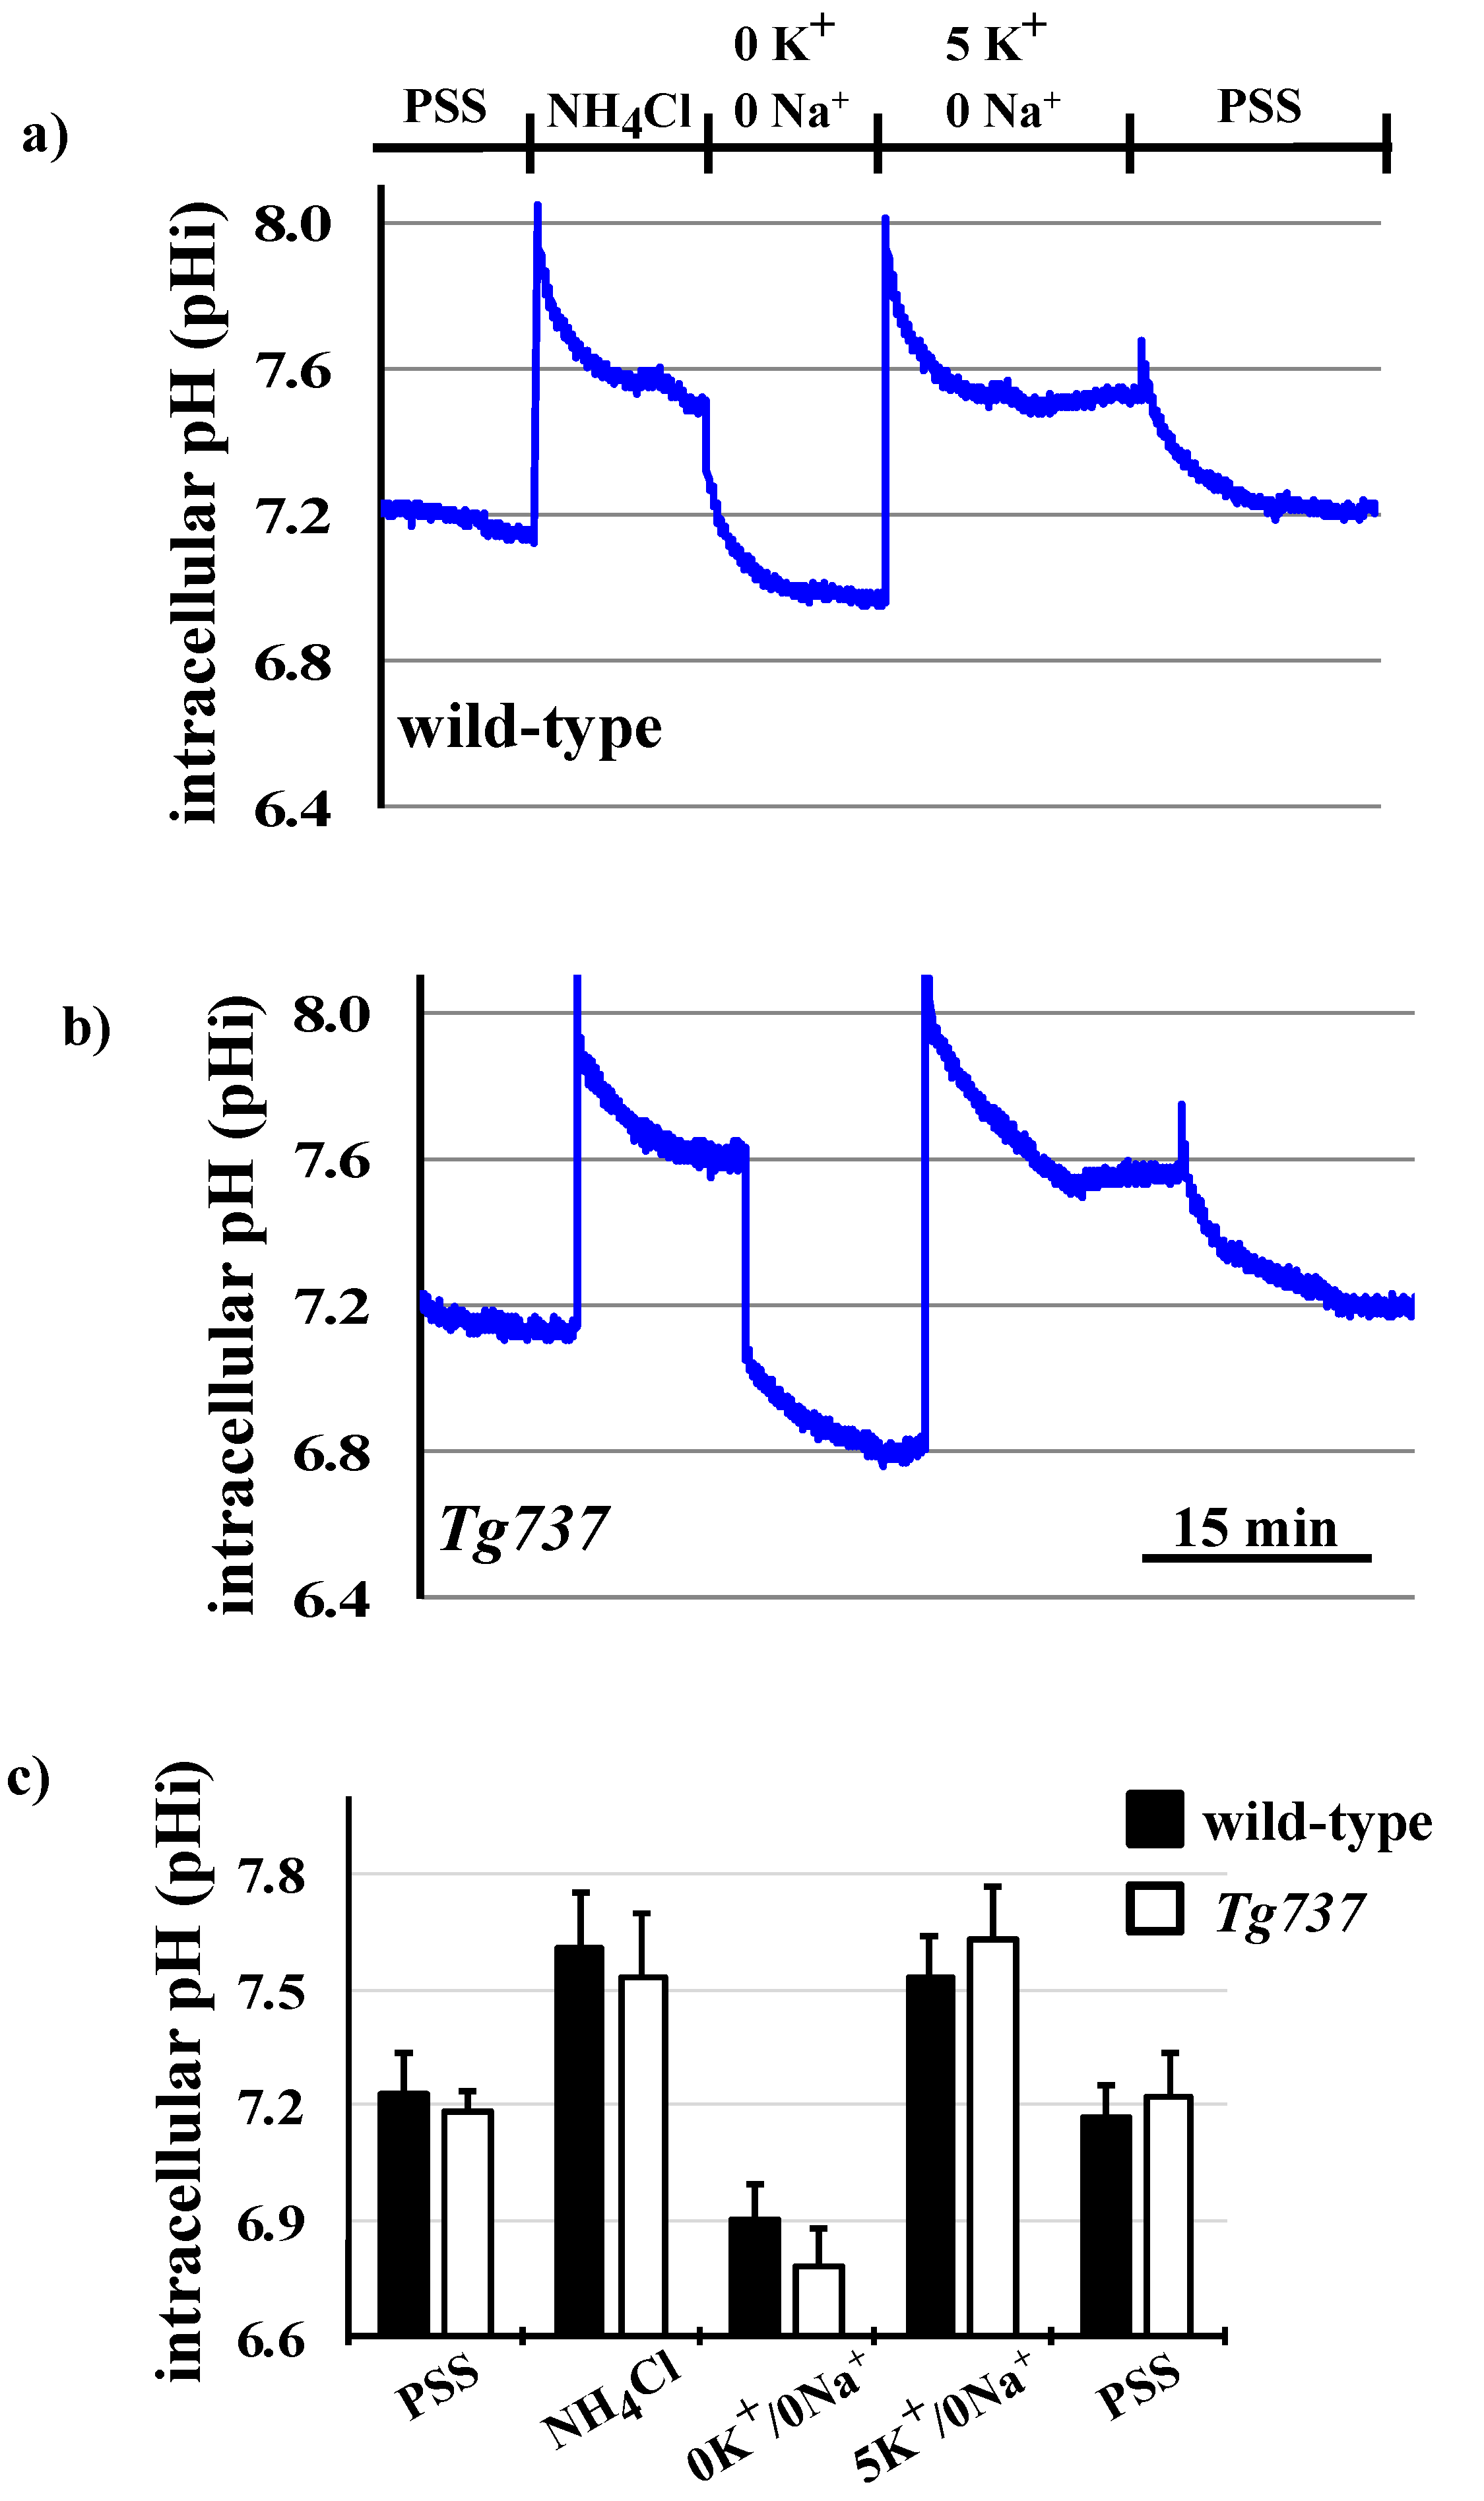
3.3. NH4Cl Pre-Pulse Induces Intracellular Acidosis in Wild-Type and Tg737 Cells
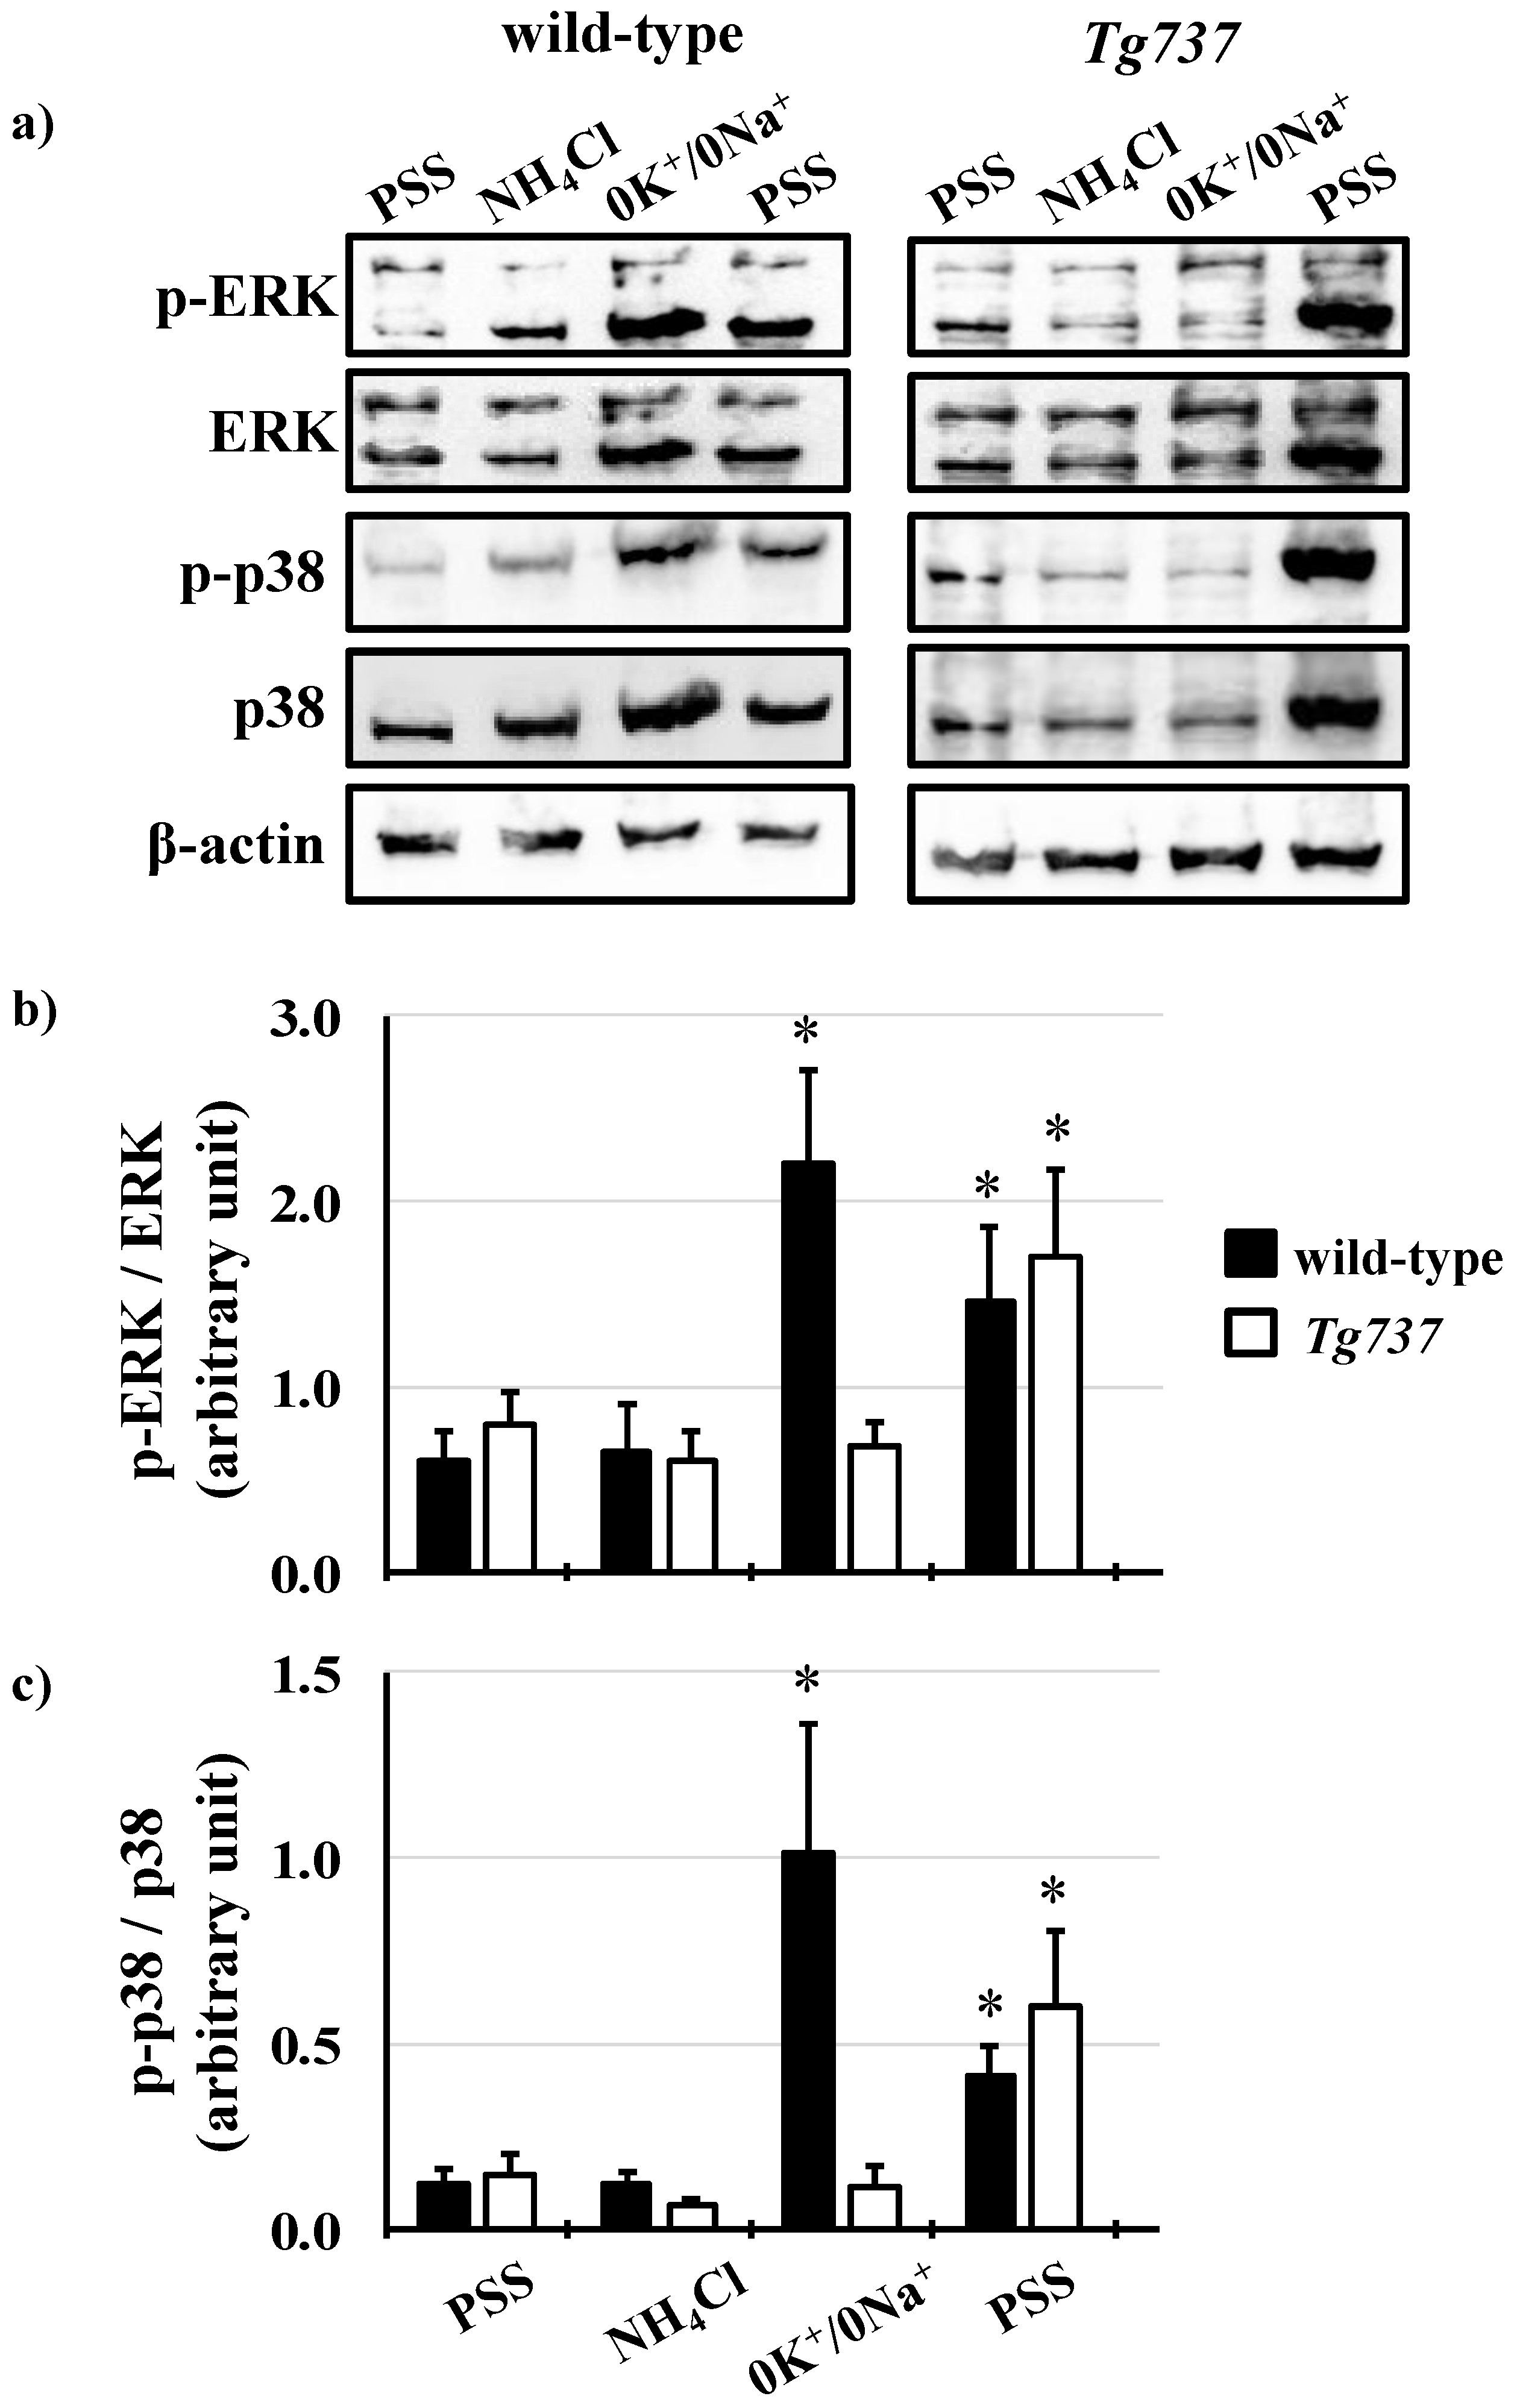
3.4. Intracellular Acidosis Activates MAPK Signaling Pathways
3.5. Effects of K+ on pHi Recovery and on MAPK Phosphorylation during the NH4Cl Pre-Pulse in Wild-Type and Tg737 Cells
4. Discussion
Supplementary Materials
Author Contributions
Funding
Acknowledgments
Conflicts of Interest
References
- Fisher, K.D.; Codina, J.; Petrovic, S.; DuBose, T.D., Jr. Pyk2 regulates H+-ATPase-mediated proton secretion in the outer medullary collecting duct via an ERK1/2 signaling pathway. Am. J. Physiol. Ren. Physiol. 2012, 303, F1353–F1362. [Google Scholar] [CrossRef] [PubMed]
- Li, S.; Sato, S.; Yang, X.; Preisig, P.A.; Alpern, R.J. Pyk2 activation is integral to acid stimulation of sodium/hydrogen exchanger 3. J. Clin. Investig. 2004, 114, 1782–1789. [Google Scholar] [CrossRef] [PubMed] [Green Version]
- Johnson, G.L.; Lapadat, R. Mitogen-activated protein kinase pathways mediated by ERK, JNK, and p38 protein kinases. Science 2002, 298, 1911–1912. [Google Scholar] [CrossRef] [PubMed]
- Coaxum, S.D.; Blanton, M.G.; Joyner, A.; Akter, T.; Bell, P.D.; Luttrell, L.M.; Raymond, J.R.; Lee, M.H.; Blichmann, P.A.; Garnovskaya, M.N.; et al. Epidermal growth factor-induced proliferation of collecting duct cells from oak ridge polycystic kidney mice involves activation of Na+/H+ exchanger. Am. J. Physiol. Cell Physiol. 2014, 307, C554–C560. [Google Scholar] [CrossRef] [PubMed]
- Skelton, L.A.; Boron, W.F. Effect of acute acid-base disturbances on the phosphorylation of phospholipase c-gamma1 and ERK1/2 in the renal proximal tubule. Physiol. Rep. 2015, 3, e12280. [Google Scholar] [CrossRef]
- Preisig, P.A. The acid-activated signaling pathway: Starting with pyk2 and ending with increased NHE3 activity. Kidney Int. 2007, 72, 1324–1329. [Google Scholar] [CrossRef] [PubMed]
- Zarubin, T.; Han, J. Activation and signaling of the p38 map kinase pathway. Cell Res. 2005, 15, 11–18. [Google Scholar] [CrossRef]
- Xue, L.; Lucocq, J.M. Low extracellular pH induces activation of ERK 2, JNK, and p38 in a431 and swiss 3t3 cells. Biochem. Biophys. Res. Commun. 1997, 241, 236–242. [Google Scholar] [CrossRef]
- Jin, X.; Mohieldin, A.M.; Muntean, B.S.; Green, J.A.; Shah, J.V.; Mykytyn, K.; Nauli, S.M. Cilioplasm is a cellular compartment for calcium signaling in response to mechanical and chemical stimuli. Cell. Mol. Life Sci. CMLS 2014, 71, 2165–2178. [Google Scholar] [CrossRef]
- Kwon, R.Y.; Temiyasathit, S.; Tummala, P.; Quah, C.C.; Jacobs, C.R. Primary cilium-dependent mechanosensing is mediated by adenylyl cyclase 6 and cyclic amp in bone cells. FASEB J. Off. Publ. Fed. Am. Soc. Exp. Biol. 2010, 24, 2859–2868. [Google Scholar] [CrossRef]
- Lee, K.L.; Guevarra, M.D.; Nguyen, A.M.; Chua, M.C.; Wang, Y.; Jacobs, C.R. The primary cilium functions as a mechanical and calcium signaling nexus. Cilia 2015, 4, 7. [Google Scholar] [CrossRef] [PubMed]
- Masyuk, A.I.; Masyuk, T.V.; Splinter, P.L.; Huang, B.Q.; Stroope, A.J.; LaRusso, N.F. Cholangiocyte cilia detect changes in luminal fluid flow and transmit them into intracellular Ca2+ and camp signaling. Gastroenterology 2006, 131, 911–920. [Google Scholar] [CrossRef] [PubMed]
- Yamamoto, K.; Ando, J. New molecular mechanisms for cardiovascular disease:Blood flow sensing mechanism in vascular endothelial cells. J. Pharm. Sci. 2011, 116, 323–331. [Google Scholar] [CrossRef]
- Rohatgi, R.; Battini, L.; Kim, P.; Israeli, S.; Wilson, P.D.; Gusella, G.L.; Satlin, L.M. Mechanoregulation of intracellular Ca2+ in human autosomal recessive polycystic kidney disease cyst-lining renal epithelial cells. Am. J. Physiol. Ren. Physiol. 2008, 294, F890–F899. [Google Scholar] [CrossRef] [PubMed]
- Nauli, S.M.; Alenghat, F.J.; Luo, Y.; Williams, E.; Vassilev, P.; Li, X.; Elia, A.E.; Lu, W.; Brown, E.M.; Quinn, S.J.; et al. Polycystins 1 and 2 mediate mechanosensation in the primary cilium of kidney cells. Nat. Genet. 2003, 33, 129–137. [Google Scholar] [CrossRef] [PubMed]
- Praetorius, H.A.; Spring, K.R. Bending the mdck cell primary cilium increases intracellular calcium. J. Membr. Biol. 2001, 184, 71–79. [Google Scholar] [CrossRef] [PubMed]
- Vina, E.; Parisi, V.; Abbate, F.; Cabo, R.; Guerrera, M.C.; Laura, R.; Quiros, L.M.; Perez-Varela, J.C.; Cobo, T.; Germana, A.; et al. Acid-sensing ion channel 2 (asic2) is selectively localized in the cilia of the non-sensory olfactory epithelium of adult zebrafish. Histochem. Cell Biol. 2015, 143, 59–68. [Google Scholar] [CrossRef]
- Waldmann, R.; Champigny, G.; Bassilana, F.; Heurteaux, C.; Lazdunski, M. A proton-gated cation channel involved in acid-sensing. Nature 1997, 386, 173–177. [Google Scholar] [CrossRef]
- Collier, D.M.; Snyder, P.M. Extracellular protons regulate human enac by modulating Na+ self-inhibition. J. Biol. Chem. 2009, 284, 792–798. [Google Scholar] [CrossRef]
- Raychowdhury, M.K.; McLaughlin, M.; Ramos, A.J.; Montalbetti, N.; Bouley, R.; Ausiello, D.A.; Cantiello, H.F. Characterization of single channel currents from primary cilia of renal epithelial cells. J. Biol. Chem. USA 2005, 280, 34718–34722. [Google Scholar] [CrossRef]
- Satlin, L.M.; Sheng, S.; Woda, C.B.; Kleyman, T.R. Epithelial Na+ channels are regulated by flow. Am. J. Physiol. Ren. Physiol. 2001, 280, F1010–F1018. [Google Scholar] [CrossRef] [PubMed]
- Banizs, B.; Komlosi, P.; Bevensee, M.O.; Schwiebert, E.M.; Bell, P.D.; Yoder, B.K. Altered pH(i) regulation and Na+/HCO3− transporter activity in choroid plexus of cilia-defective tg737(ORPK) mutant mouse. Am. J. Physiol. Cell Physiol. 2007, 292, C1409–C1416. [Google Scholar] [CrossRef] [PubMed]
- Nauli, S.M.; Kawanabe, Y.; Kaminski, J.J.; Pearce, W.J.; Ingber, D.E.; Zhou, J. Endothelial cilia are fluid shear sensors that regulate calcium signaling and nitric oxide production through polycystin-1. Circulation 2008, 117, 1161–1171. [Google Scholar] [CrossRef] [PubMed]
- Abdul-Majeed, S.; Nauli, S.M. Dopamine receptor type 5 in the primary cilia has dual chemo- and mechano-sensory roles. Hypertension 2011, 58, 325–331. [Google Scholar] [CrossRef] [PubMed]
- AbouAlaiwi, W.A.; Takahashi, M.; Mell, B.R.; Jones, T.J.; Ratnam, S.; Kolb, R.J.; Nauli, S.M. Ciliary polycystin-2 is a mechanosensitive calcium channel involved in nitric oxide signaling cascades. Circ. Res. 2009, 104, 860–869. [Google Scholar] [CrossRef] [PubMed]
- Yoder, B.K.; Tousson, A.; Millican, L.; Wu, J.H.; Bugg, C.E., Jr.; Schafer, J.A.; Balkovetz, D.F. Polaris, a protein disrupted in ORPK mutant mice, is required for assembly of renal cilium. Am. J. Physiol Ren. Physiol 2002, 282, F541–F552. [Google Scholar] [CrossRef] [PubMed]
- Jones, T.J.; Adapala, R.K.; Geldenhuys, W.J.; Bursley, C.; AbouAlaiwi, W.A.; Nauli, S.M.; Thodeti, C.K. Primary cilia regulates the directional migration and barrier integrity of endothelial cells through the modulation of hsp27 dependent actin cytoskeletal organization. J. Cell Physiol. 2012, 227, 70–76. [Google Scholar] [CrossRef] [PubMed]
- Aboualaiwi, W.A.; Muntean, B.S.; Ratnam, S.; Joe, B.; Liu, L.; Booth, R.L.; Rodriguez, I.; Herbert, B.S.; Bacallao, R.L.; Fruttiger, M.; et al. Survivin-induced abnormal ploidy contributes to cystic kidney and aneurysm formation. Circulation 2014, 129, 660–672. [Google Scholar] [CrossRef]
- AbouAlaiwi, W.A.; Ratnam, S.; Booth, R.L.; Shah, J.V.; Nauli, S.M. Endothelial cells from humans and mice with polycystic kidney disease are characterized by polyploidy and chromosome segregation defects through survivin down-regulation. Hum. Mol. Genet. 2011, 20, 354–367. [Google Scholar] [CrossRef]
- Nauli, S.M.; Jin, X.; AbouAlaiwi, W.A.; El-Jouni, W.; Su, X.; Zhou, J. Non-motile primary cilia as fluid shear stress mechanosensors. Methods Enzymol. 2013, 525, 1–20. [Google Scholar]
- Dummer, A.; Poelma, C.; DeRuiter, M.C.; Goumans, M.-J.T.H.; Hierck, B.P. Measuring the primary cilium length: Improved method for unbiased high-throughput analysis. Cilia 2016, 5, 7. [Google Scholar] [CrossRef] [PubMed]
- Tukachinsky, H.; Lopez, L.V.; Salic, A. A mechanism for vertebrate hedgehog signaling: Recruitment to cilia and dissociation of sufu-gli protein complexes. J. Cell Biol. 2010, 191, 415–428. [Google Scholar] [CrossRef] [PubMed]
- Prodromou, N.V.; Thompson, C.L.; Osborn, D.P.; Cogger, K.F.; Ashworth, R.; Knight, M.M.; Beales, P.L.; Chapple, J.P. Heat shock induces rapid resorption of primary cilia. J. Cell Sci. 2012, 125, 4297–4305. [Google Scholar] [CrossRef] [PubMed] [Green Version]
- Verghese, E.; Zhuang, J.; Saiti, D.; Ricardo, S.D.; Deane, J.A. In vitro investigation of renal epithelial injury suggests that primary cilium length is regulated by hypoxia-inducible mechanisms. Cell Biol. Int. 2011, 35, 909–913. [Google Scholar] [CrossRef] [PubMed]
- Verghese, E.; Weidenfeld, R.; Bertram, J.F.; Ricardo, S.D.; Deane, J.A. Renal cilia display length alterations following tubular injury and are present early in epithelial repair. Nephrol. Dial. Transpl. 2008, 23, 834–841. [Google Scholar] [CrossRef] [PubMed]
- Brown, D.; Wagner, C.A. Molecular mechanisms of acid-base sensing by the kidney. J. Am. Soc. Nephrol. 2012, 23, 774–780. [Google Scholar] [CrossRef] [PubMed]
- Flacke, J.P.; Kumar, S.; Kostin, S.; Reusch, H.P.; Ladilov, Y. Acidic preconditioning protects endothelial cells against apoptosis through p38- and AKT-dependent bcl-xl overexpression. Apoptosis 2009, 14, 90–96. [Google Scholar] [CrossRef] [PubMed]
- Santa, N.; Kitazono, T.; Ago, T.; Ooboshi, H.; Kamouchi, M.; Wakisaka, M.; Ibayashi, S.; Iida, M. ATP-sensitive potassium channels mediate dilatation of basilar artery in response to intracellular acidification in vivo. Stroke 2003, 34, 1276–1280. [Google Scholar] [CrossRef] [PubMed]
- Abboud, F.M.; Benson, C.J. Asics and cardiovascular homeostasis. Neuropharmacology 2015, 94, 87–98. [Google Scholar] [CrossRef] [PubMed]
- Chen, A.; Dong, L.; Leffler, N.R.; Asch, A.S.; Witte, O.N.; Yang, L.V. Activation of gpr4 by acidosis increases endothelial cell adhesion through the CAMP/EPAC pathway. PLoS ONE 2011, 6, e27586. [Google Scholar] [CrossRef]
- Sun, X.; Yang, L.V.; Tiegs, B.C.; Arend, L.J.; McGraw, D.W.; Penn, R.B.; Petrovic, S. Deletion of the pH sensor gpr4 decreases renal acid excretion. J. Am. Soc. Nephrol. 2010, 21, 1745–1755. [Google Scholar] [CrossRef] [PubMed]
- Codina, J.; Opyd, T.S.; Powell, Z.B.; Furdui, C.M.; Petrovic, S.; Penn, R.B.; DuBose, T.D., Jr. pH-dependent regulation of the alpha-subunit of H+-K+-ATPase (HKalpha2). Am. J. Physiol. Ren. Physiol. 2011, 301, F536–F543. [Google Scholar] [CrossRef] [PubMed]
- Dong, L.; Li, Z.; Leffler, N.R.; Asch, A.S.; Chi, J.T.; Yang, L.V. Acidosis activation of the proton-sensing GPR4 receptor stimulates vascular endothelial cell inflammatory responses revealed by transcriptome analysis. PLoS ONE 2013, 8, e61991. [Google Scholar] [CrossRef] [PubMed]
- Liu, S.; Cheng, X.Y.; Wang, F.; Liu, C.F. Acid-sensing ion channels: Potential therapeutic targets for neurologic diseases. Transl. Neurodegener. 2015, 4, 10. [Google Scholar] [CrossRef] [PubMed]
- Chen, C.C.; Wong, C.W. Neurosensory mechanotransduction through acid-sensing ion channels. J. Cell Mol. Med. 2013, 17, 337–349. [Google Scholar] [CrossRef] [PubMed]
- Pedrozo, Z.; Criollo, A.; Battiprolu, P.K.; Morales, C.R.; Contreras-Ferrat, A.; Fernandez, C.; Jiang, N.; Luo, X.; Caplan, M.J.; Somlo, S.; et al. Polycystin-1 is a cardiomyocyte mechanosensor that governs l-type Ca2+ channel protein stability. Circulation 2015, 131, 2131–2142. [Google Scholar] [CrossRef]
- Sharif-Naeini, R.; Folgering, J.H.; Bichet, D.; Duprat, F.; Lauritzen, I.; Arhatte, M.; Jodar, M.; Dedman, A.; Chatelain, F.C.; Schulte, U.; et al. Polycystin-1 and -2 dosage regulates pressure sensing. Cell 2009, 139, 587–596. [Google Scholar] [CrossRef]
- Kathem, S.H.; Mohieldin, A.M.; Nauli, S.M. The roles of primary cilia in polycystic kidney disease. AIMS Mol. Sci. 2014, 1, 27–46. [Google Scholar] [CrossRef]
- Upadhyay, V.S.; Muntean, B.S.; Kathem, S.H.; Hwang, J.J.; Aboualaiwi, W.A.; Nauli, S.M. Roles of dopamine receptor on chemosensory and mechanosensory primary cilia in renal epithelial cells. Front. Physiol. 2014, 5, 72. [Google Scholar] [CrossRef] [Green Version]


| Solution | PSS | NH4Cl | 0K+/0Na+ | 5K+/0Na+ |
|---|---|---|---|---|
| CaCl2 | 1.8 | 1.8 | 1.8 | 1.8 |
| MgSO4 | 0.8 | 0.8 | 0.8 | 0.8 |
| Glucose | 5.5 | 5.5 | 5.5 | 5.5 |
| HEPES | 10 | 10 | 10 | 10 |
| NaCl | 135 | 0 | 0 | 0 |
| KCl | 5 | 0 | 0 | 5 |
| NH4Cl | 0 | 20 | 0 | 0 |
| NMDG | 0 | 120 | 140 | 135 |
© 2019 by the authors. Licensee MDPI, Basel, Switzerland. This article is an open access article distributed under the terms and conditions of the Creative Commons Attribution (CC BY) license (http://creativecommons.org/licenses/by/4.0/).
Share and Cite
Atkinson, K.F.; Sherpa, R.T.; Nauli, S.M. The Role of the Primary Cilium in Sensing Extracellular pH. Cells 2019, 8, 704. https://doi.org/10.3390/cells8070704
Atkinson KF, Sherpa RT, Nauli SM. The Role of the Primary Cilium in Sensing Extracellular pH. Cells. 2019; 8(7):704. https://doi.org/10.3390/cells8070704
Chicago/Turabian StyleAtkinson, Kimberly F., Rinzhin T. Sherpa, and Surya M. Nauli. 2019. "The Role of the Primary Cilium in Sensing Extracellular pH" Cells 8, no. 7: 704. https://doi.org/10.3390/cells8070704