Modeling of LMNA-Related Dilated Cardiomyopathy Using Human Induced Pluripotent Stem Cells

 , , , , , ,
  , and
, and 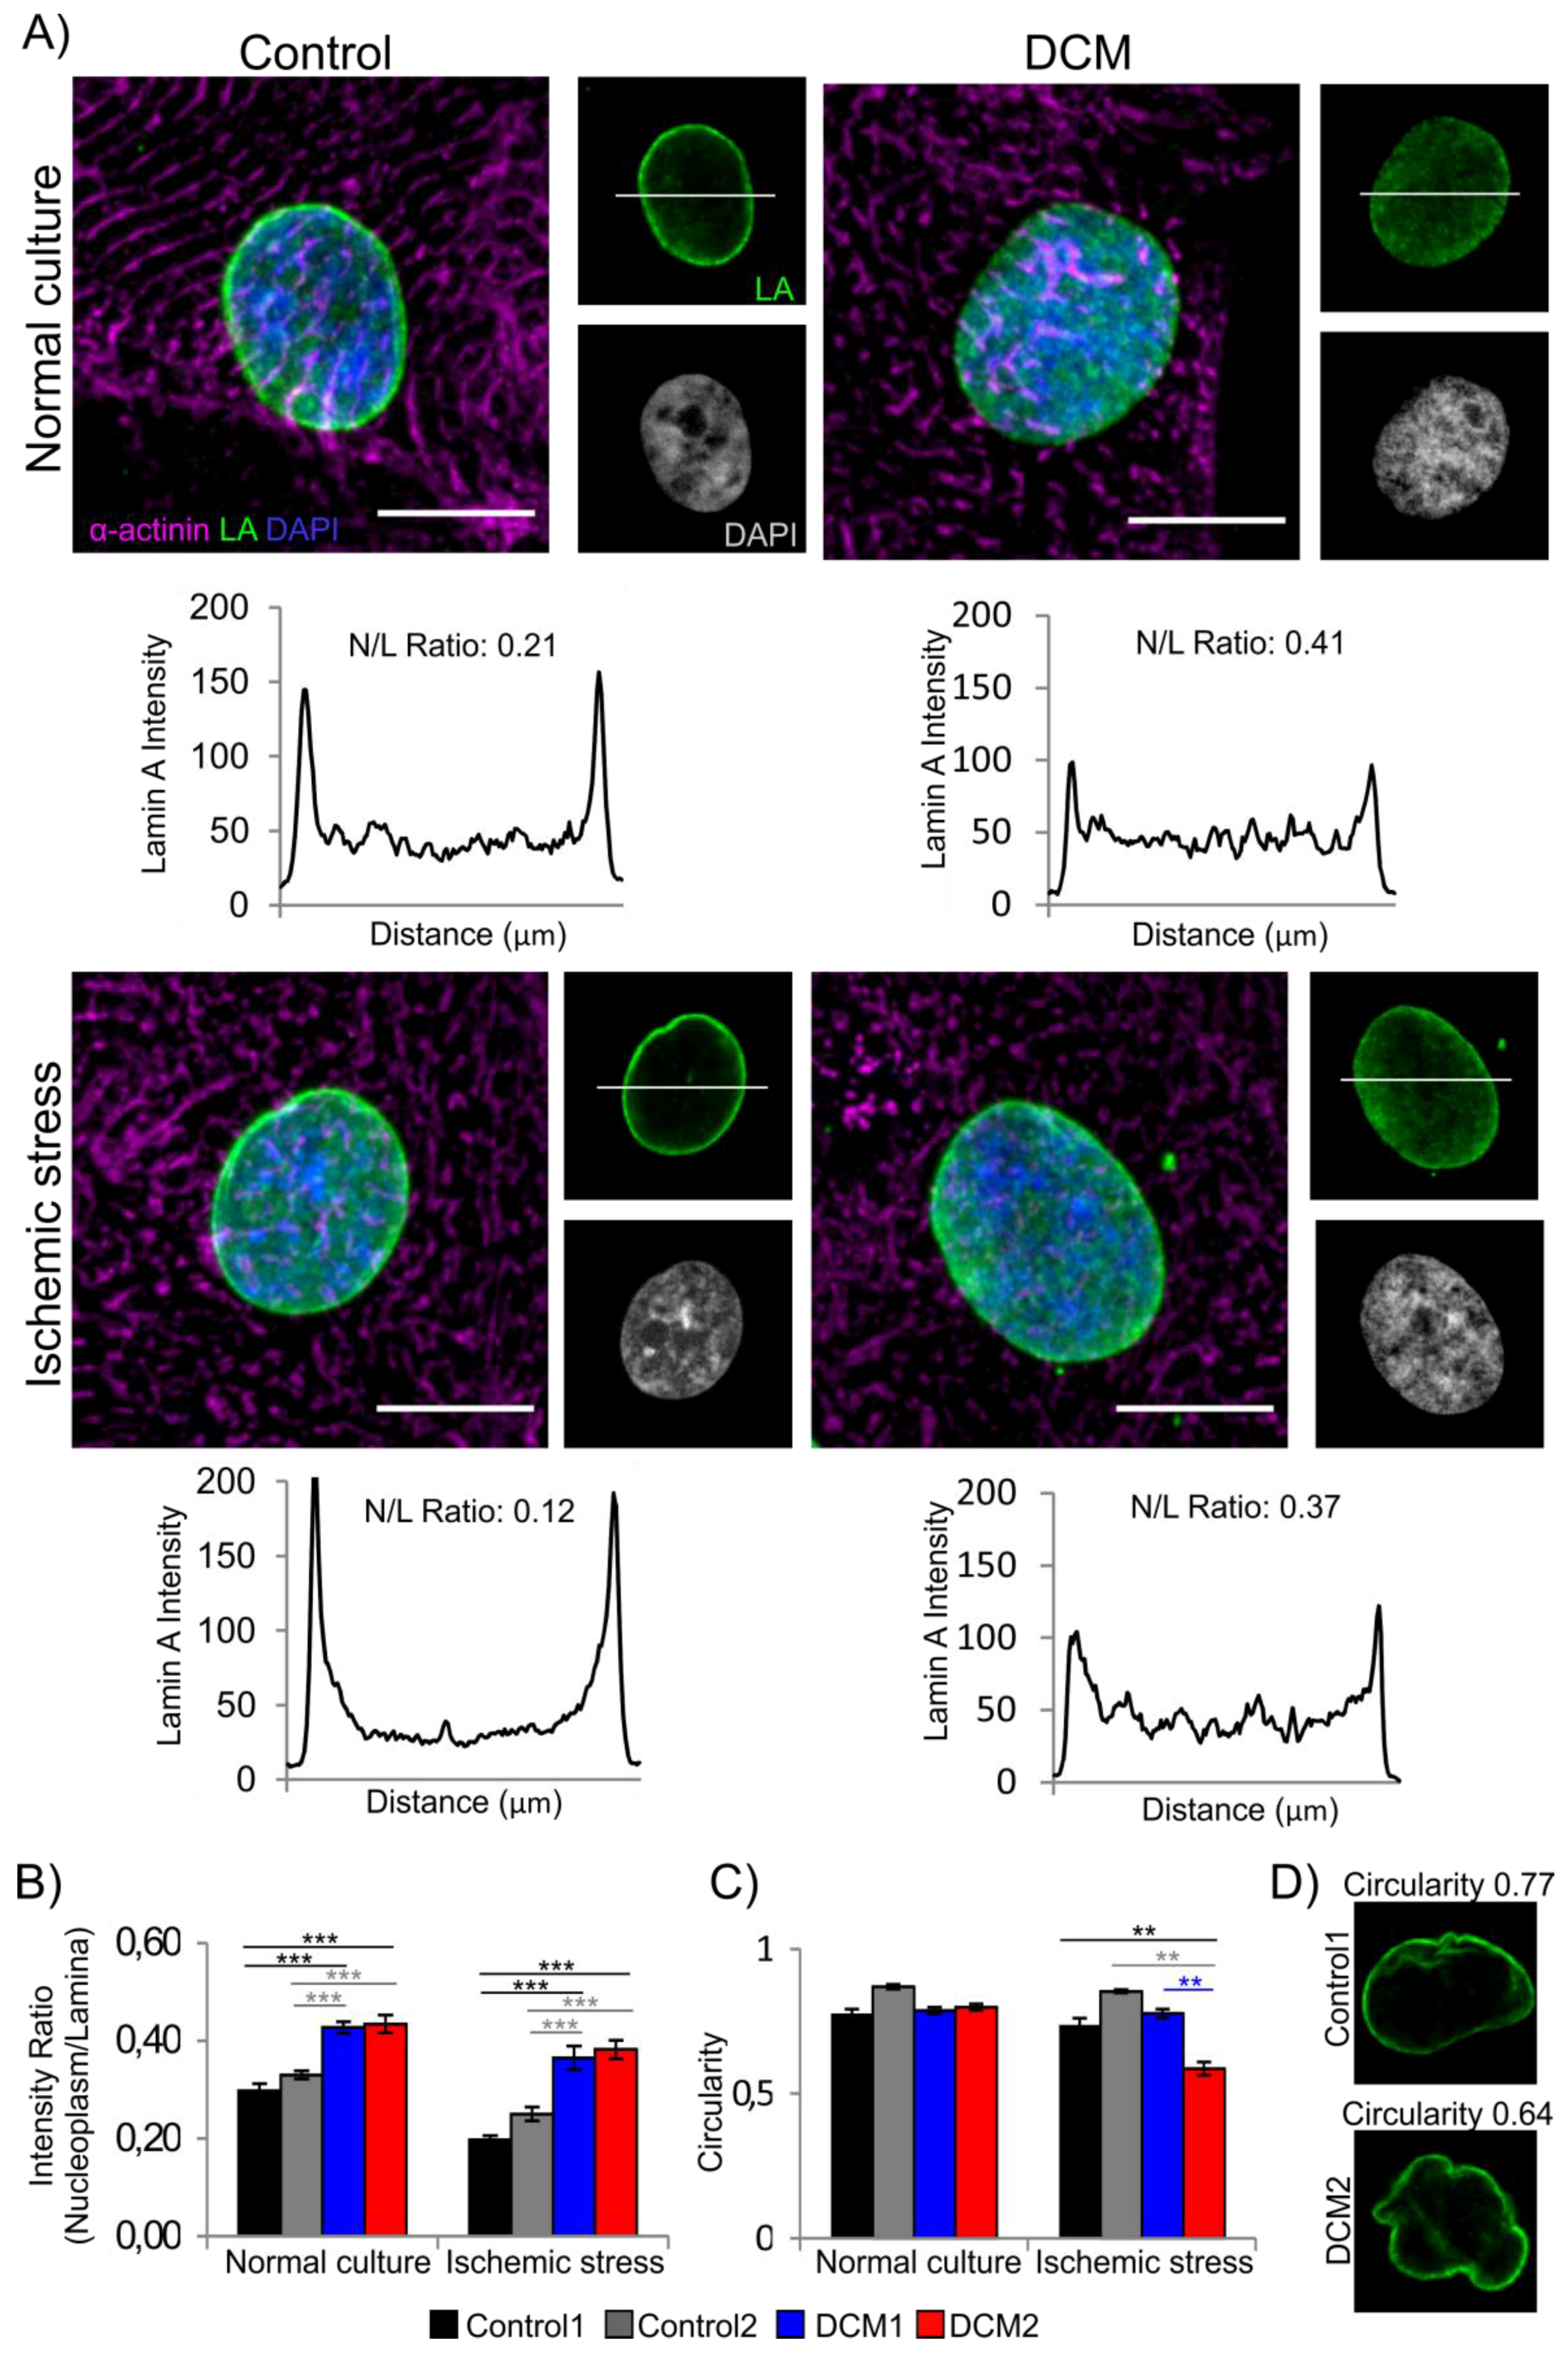
Abstract
:1. Introduction
2. Materials and Methods
2.1. Patient Characteristics
2.2. hiPSC Generation, Culture and Characterization
2.3. Cardiomyocyte Differentiation
2.4. Genotyping
2.5. Immunofluorescence and Confocal Microscopy
2.6. Transmission Electron Microscopy
2.7. Immunoblotting
2.8. Micro Electrode Array (MEA) Electrophysiology
2.9. Hypoxic Stress Induction on MEA
2.10. Calcium Imaging
2.11. Teratoma Assay
3. Results
3.1. Generation and Characterization of hiPSC Lines
3.2. Characterization of Cardiac Differentiation and Lamina Structure
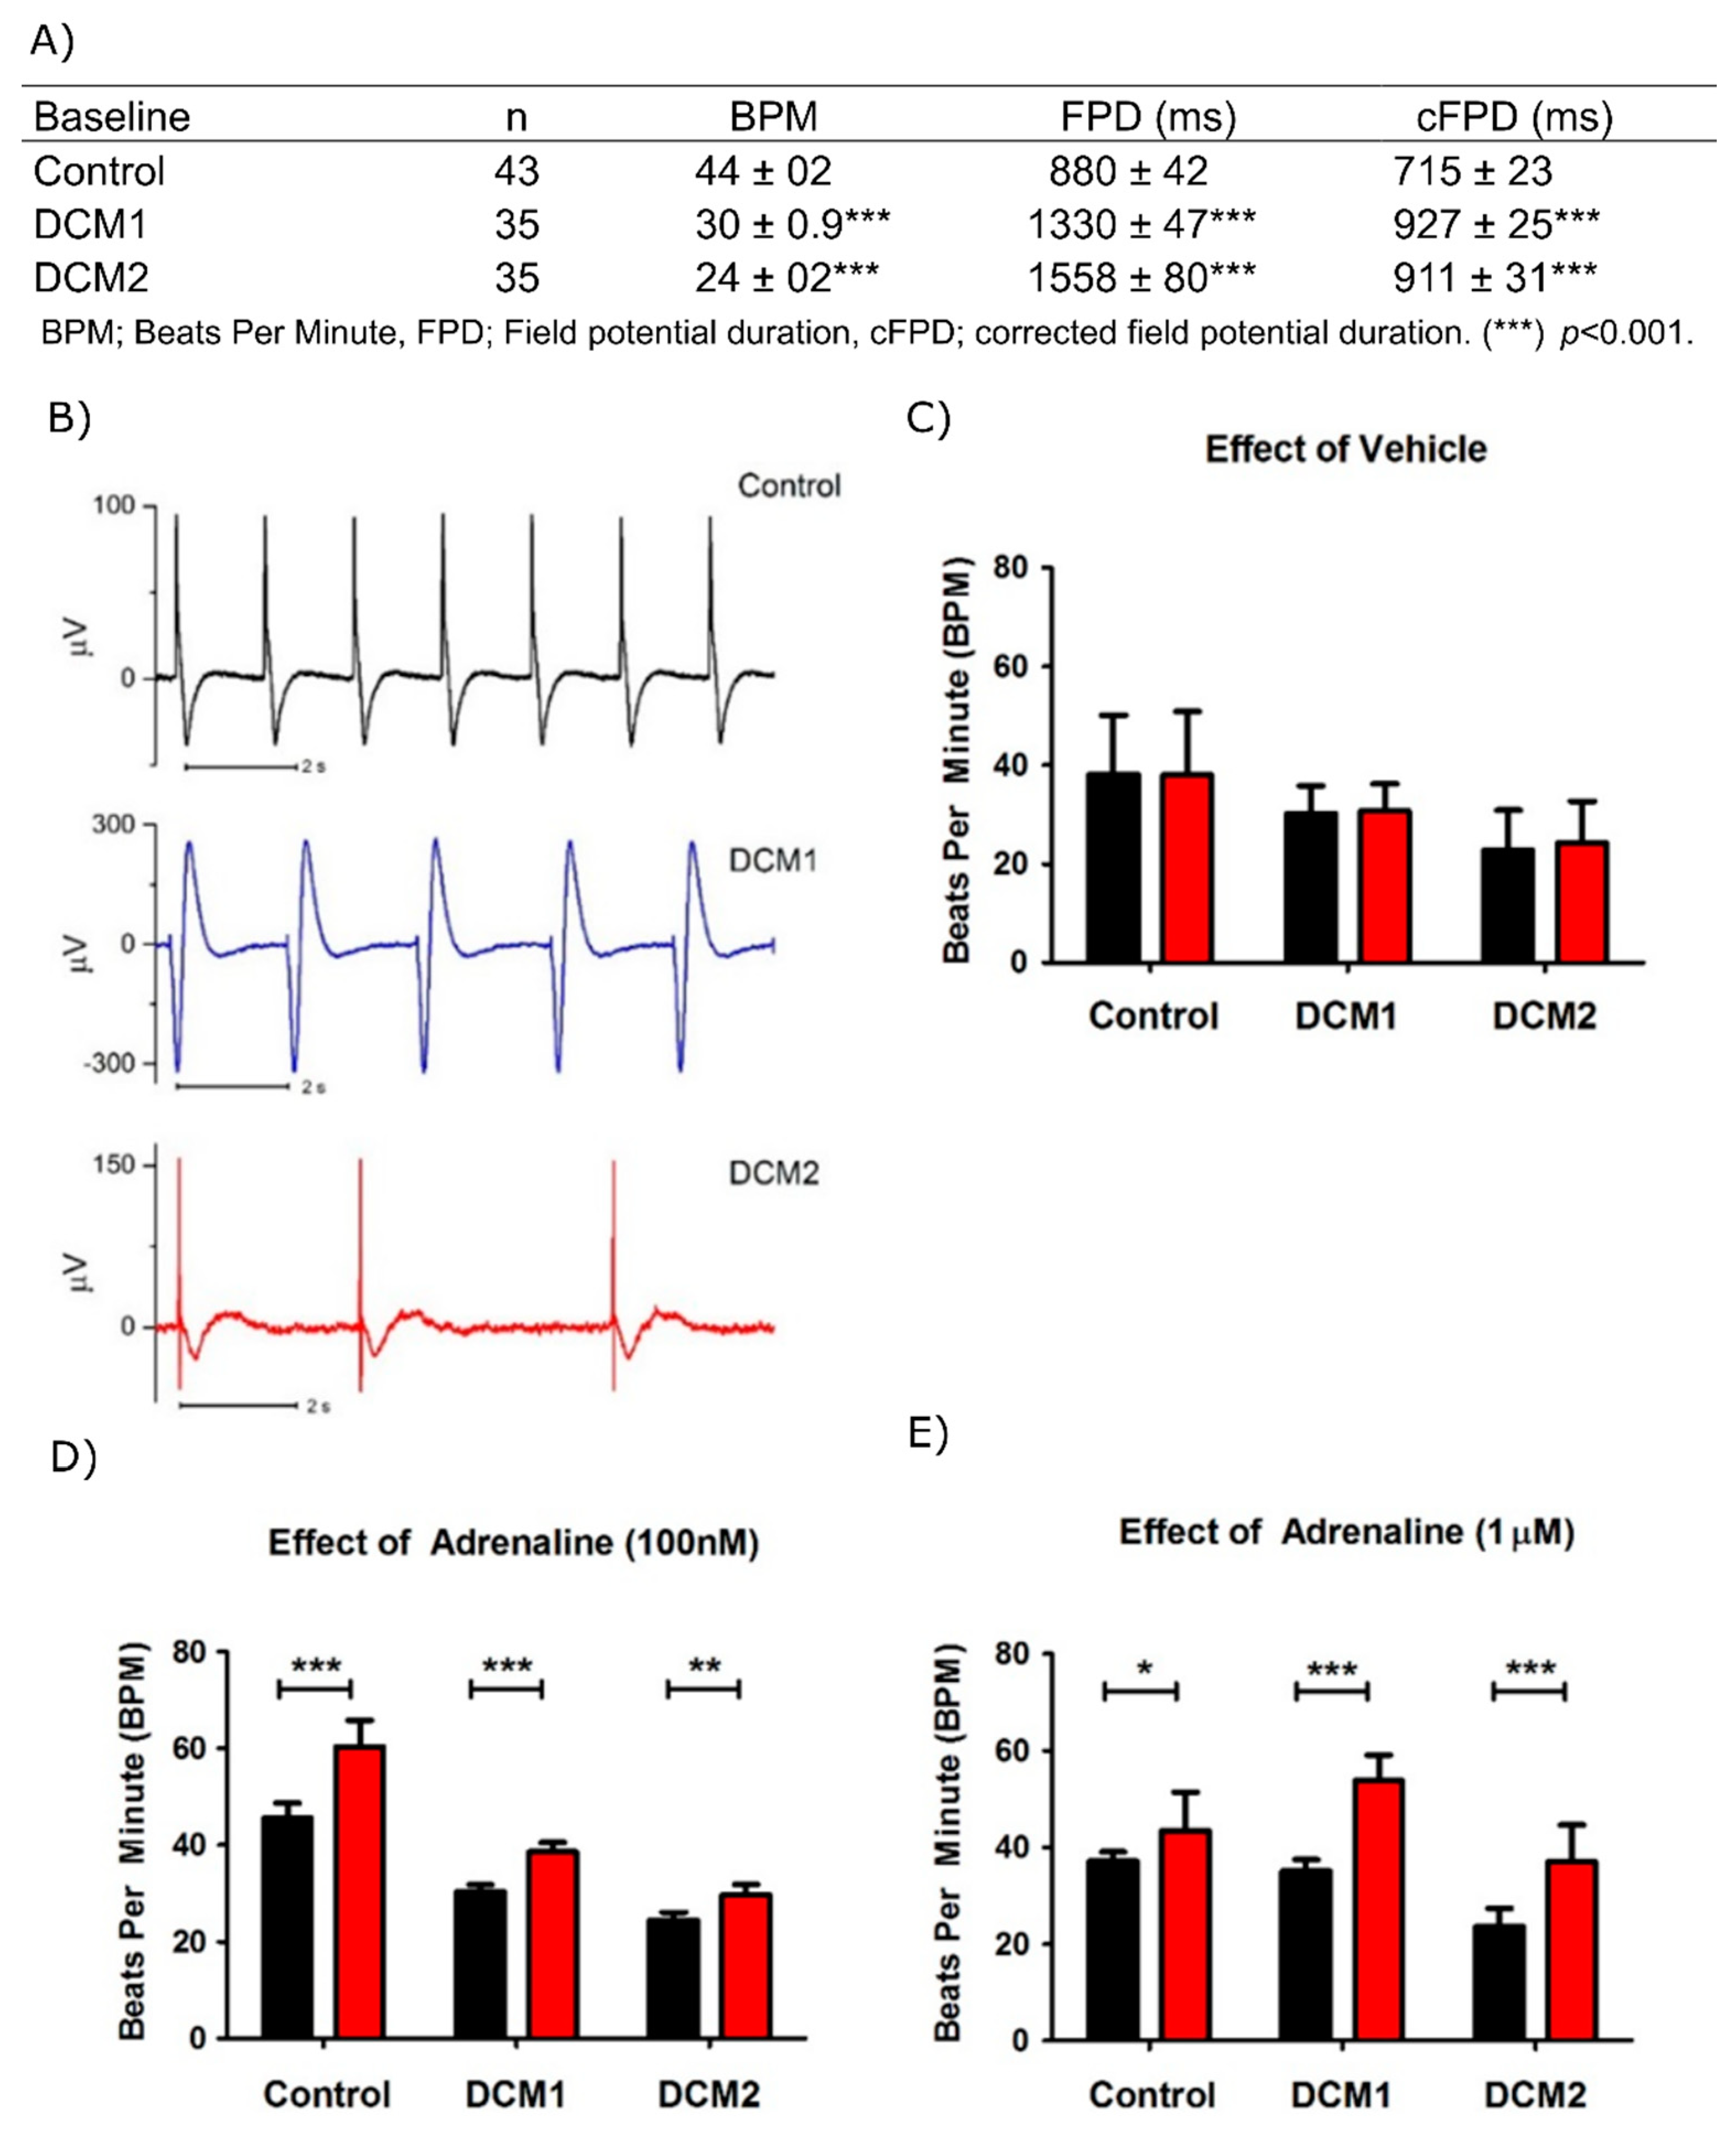
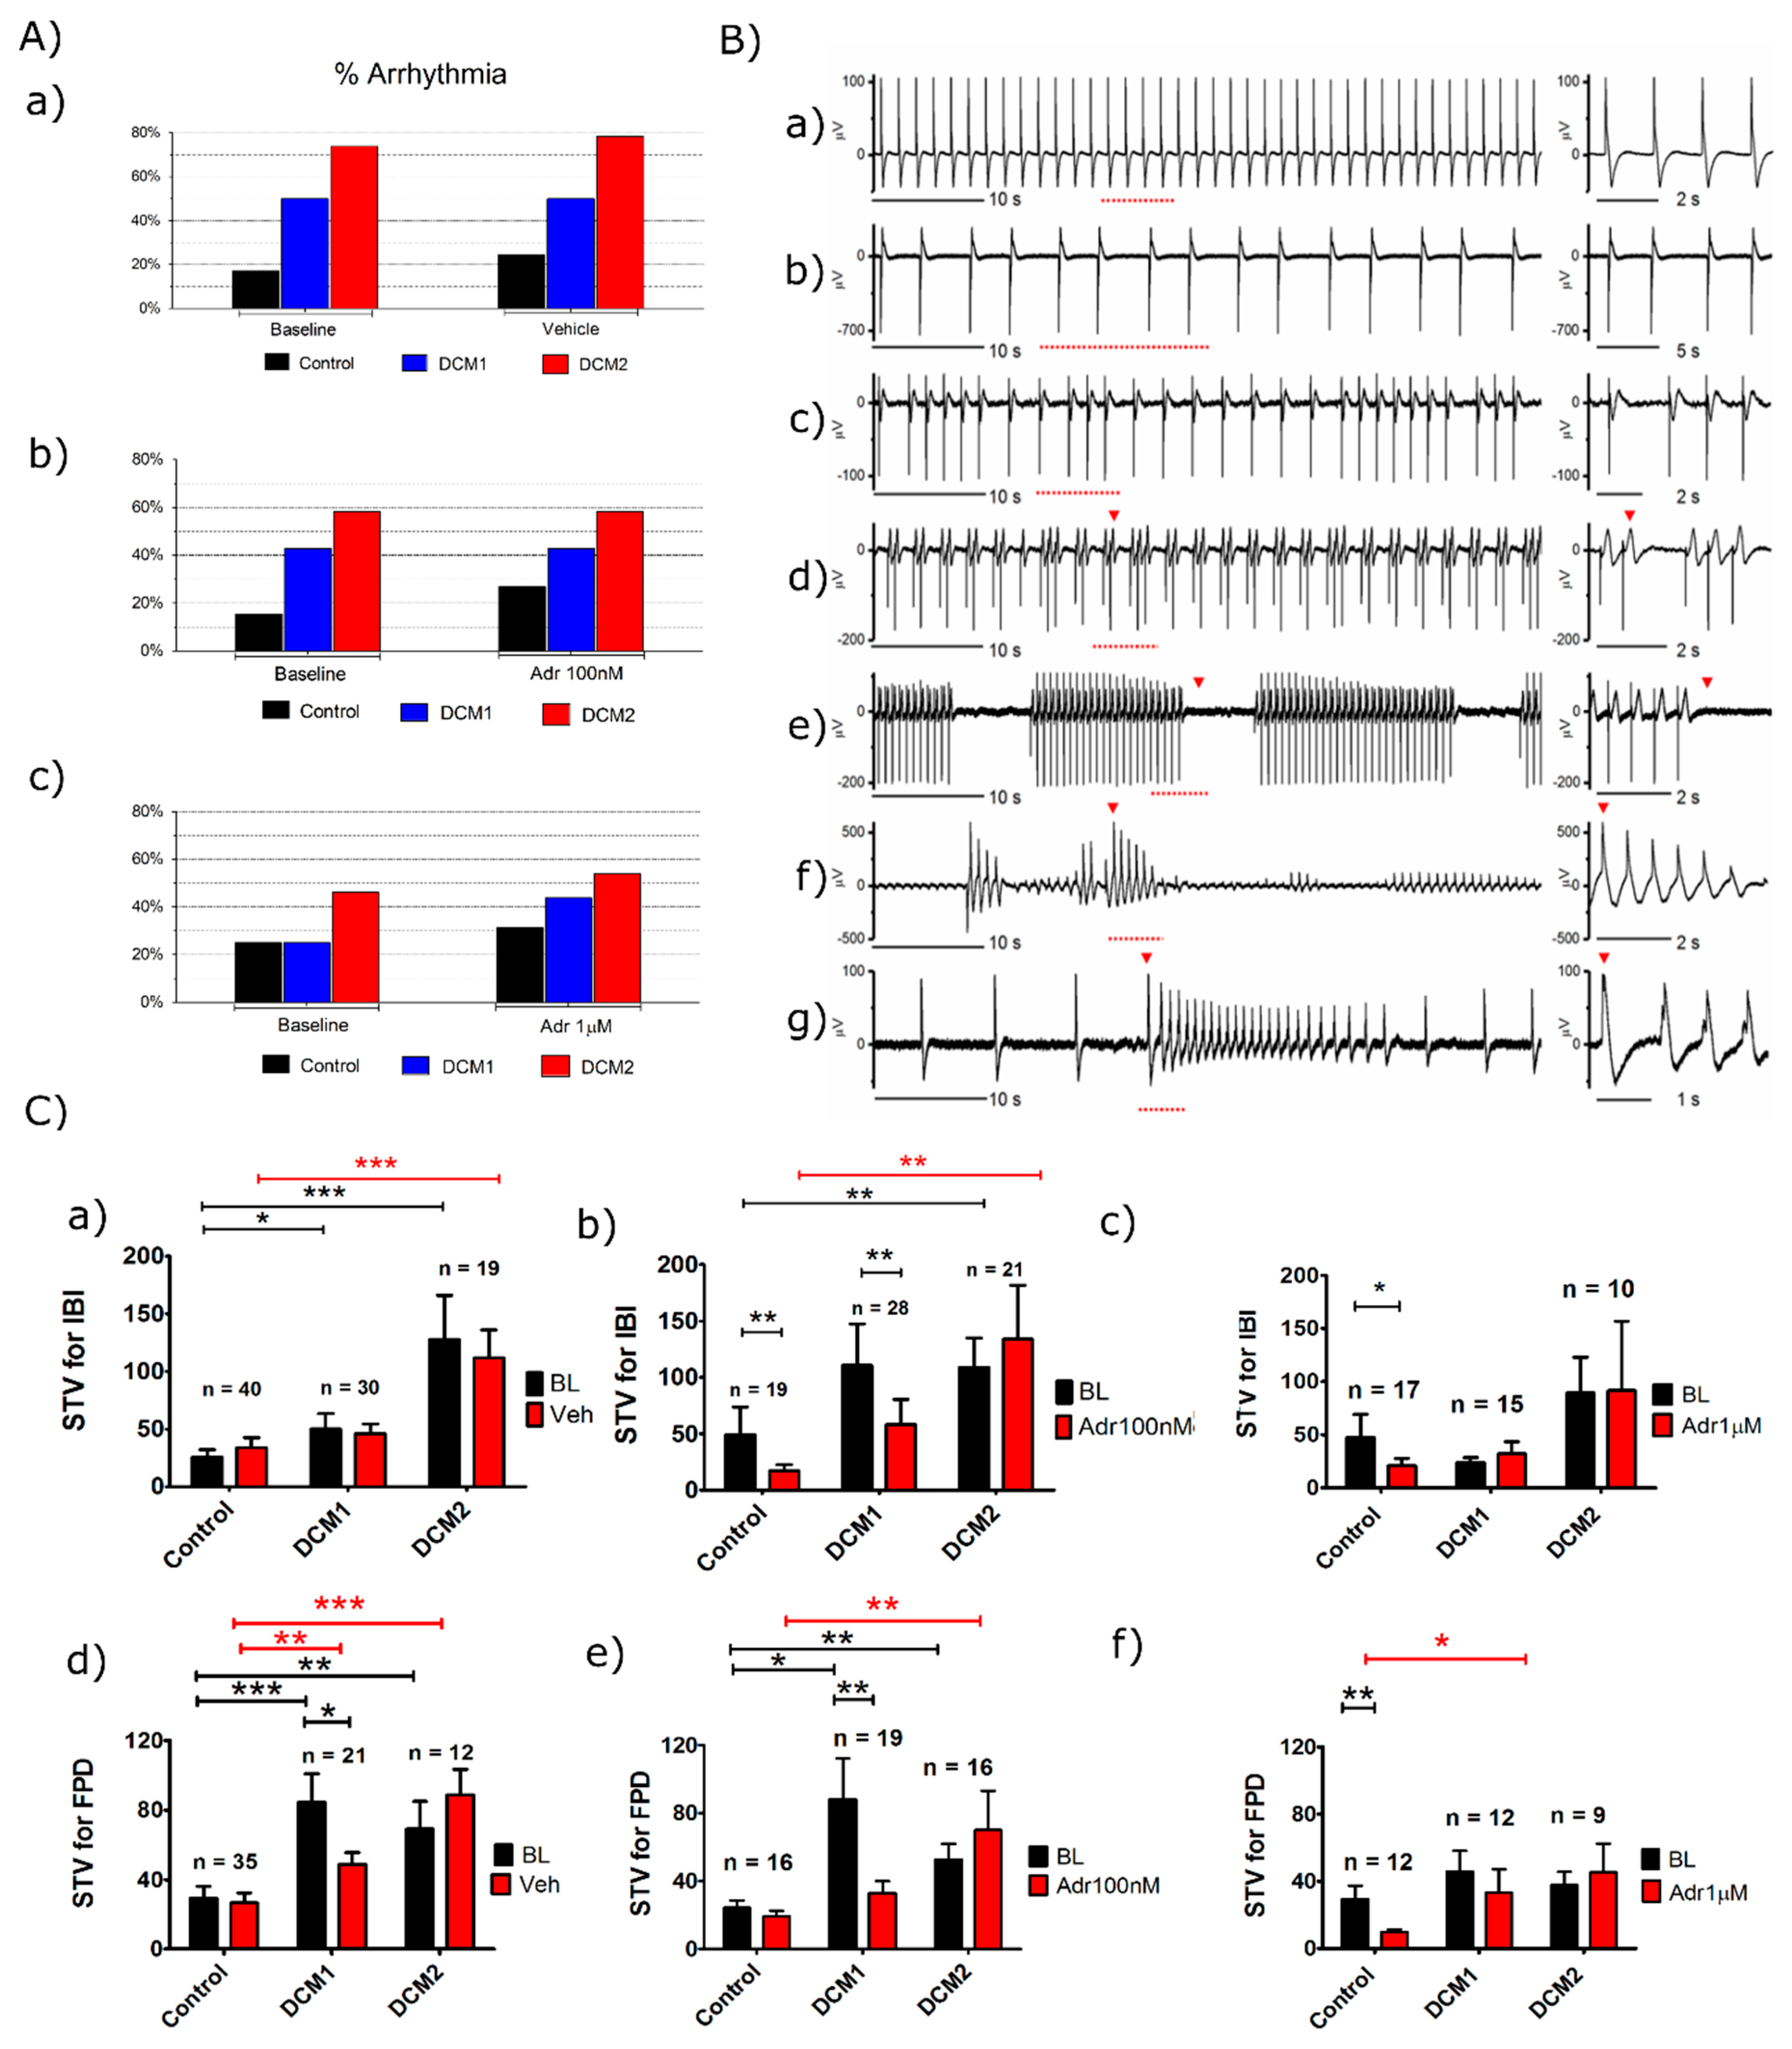
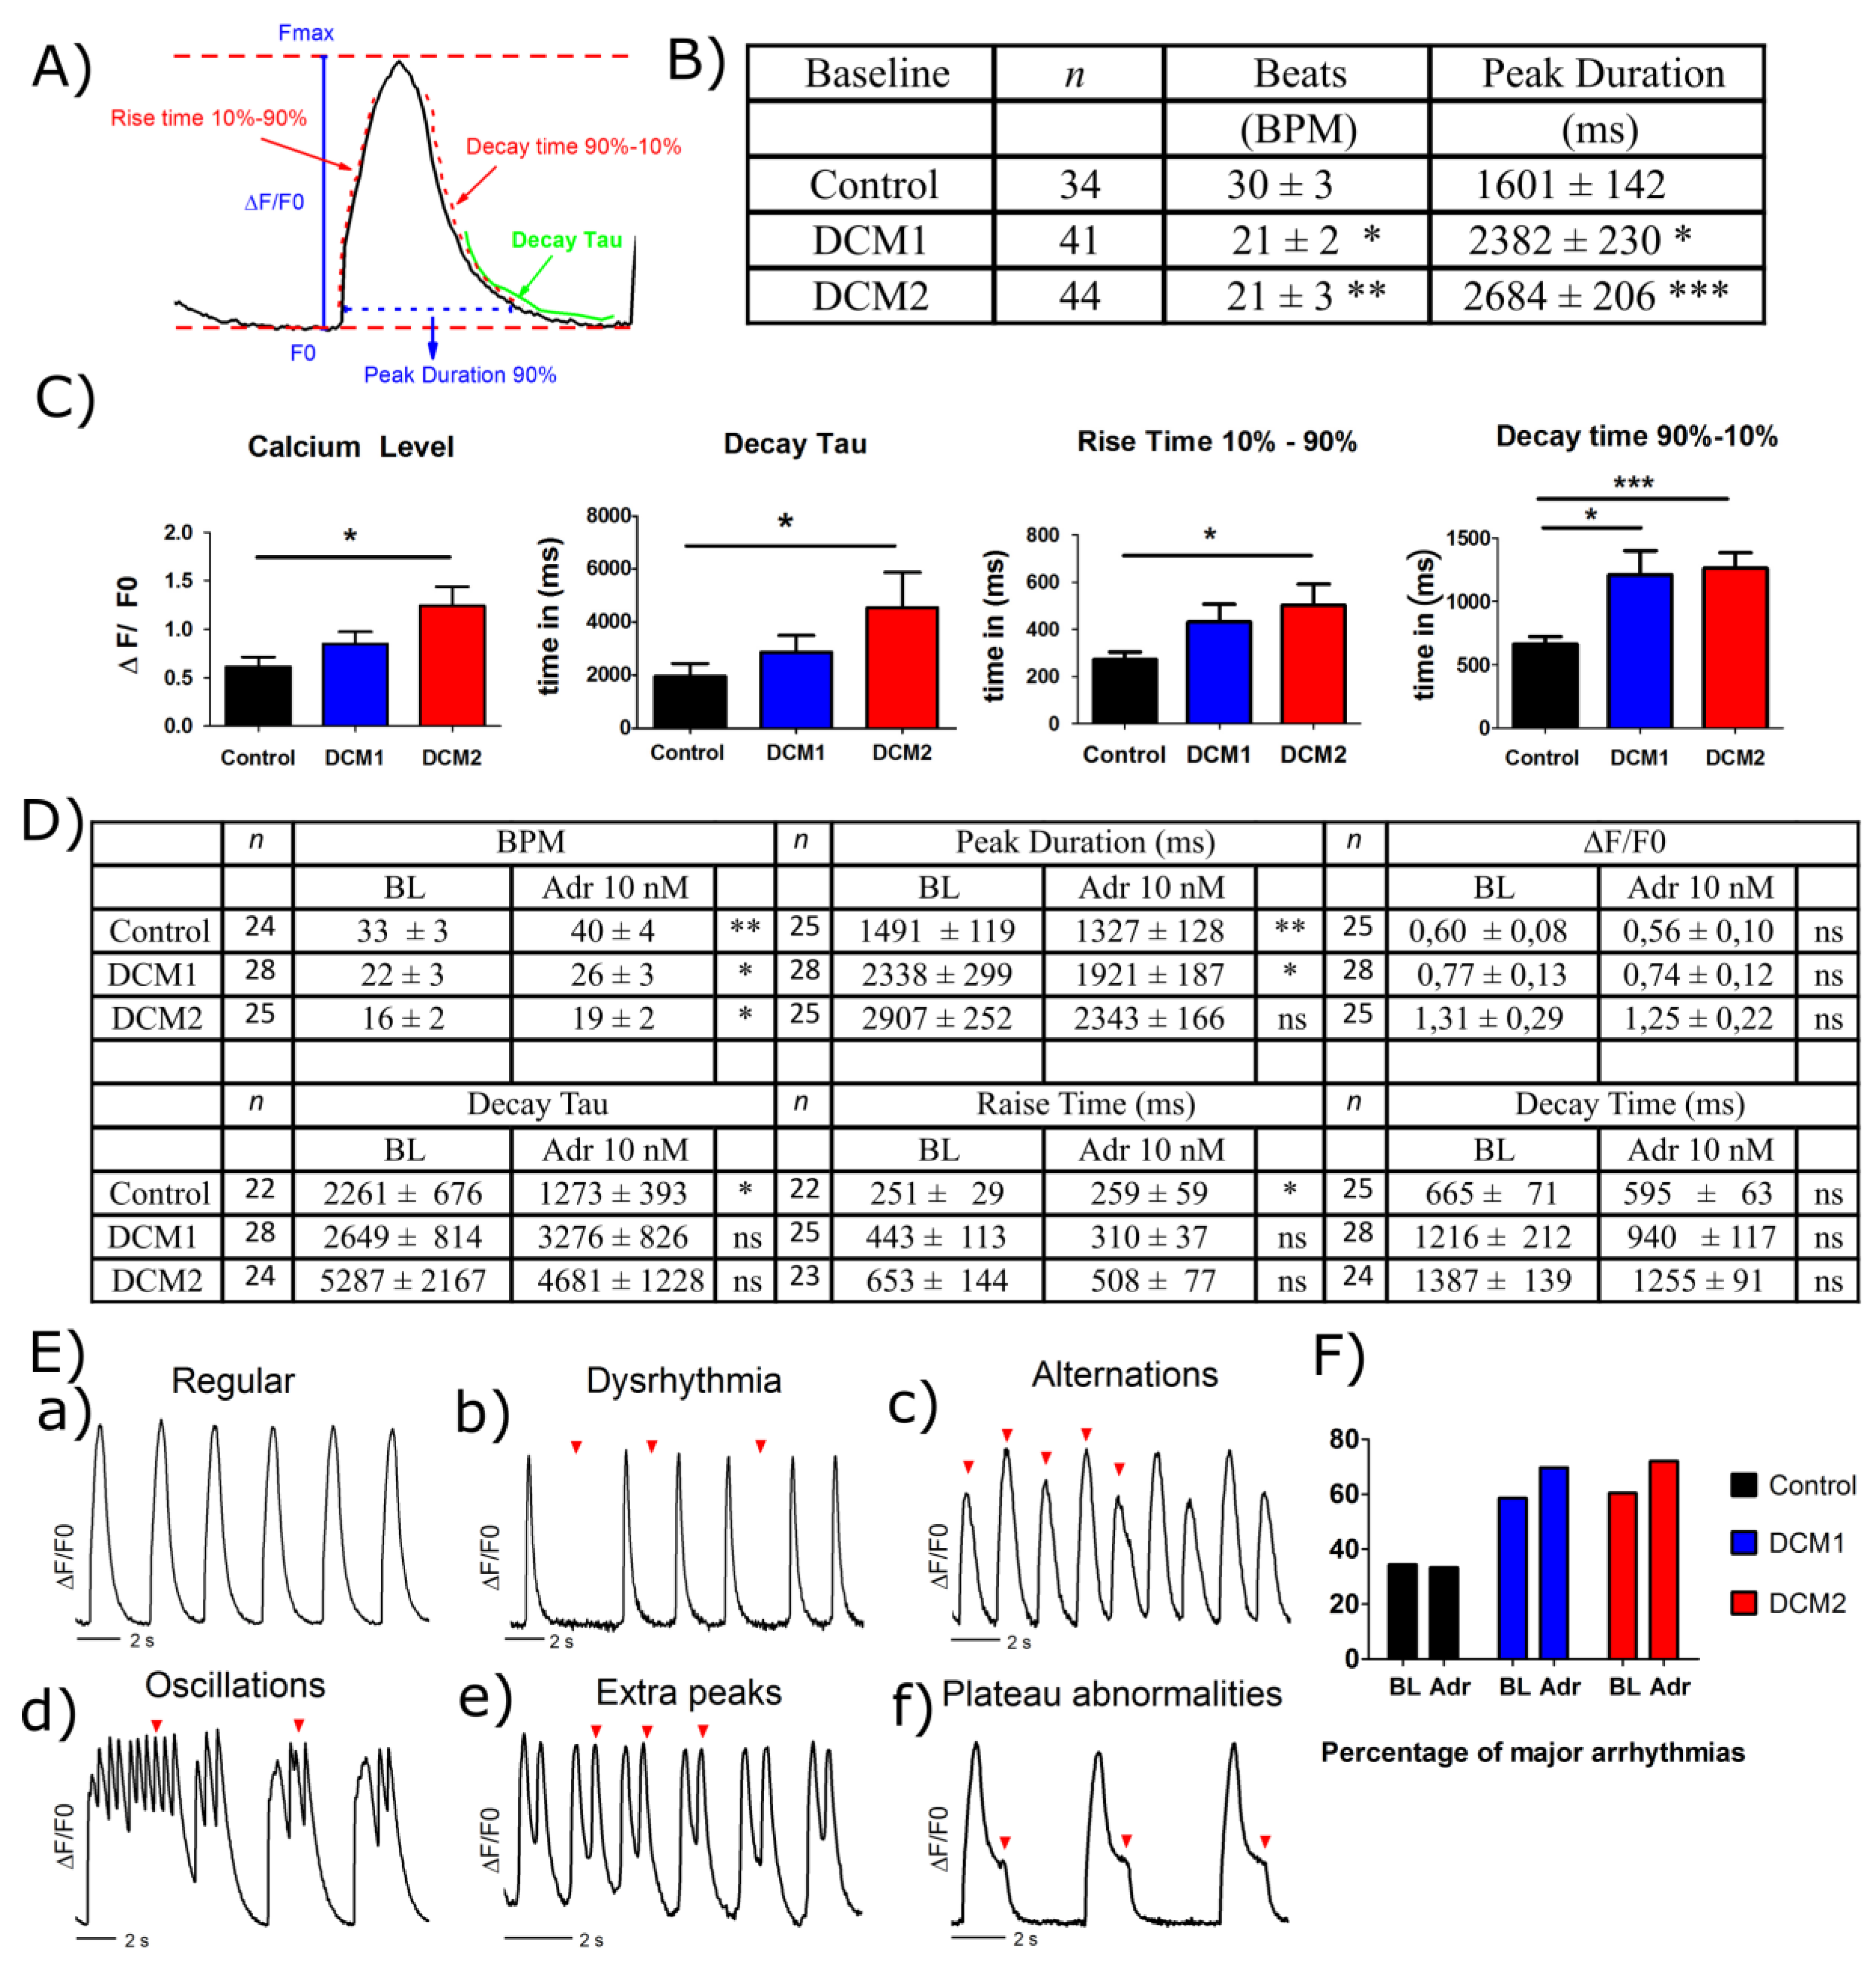
3.3. DCM-CMs Exhibit Increased Arrhythmias on MEA
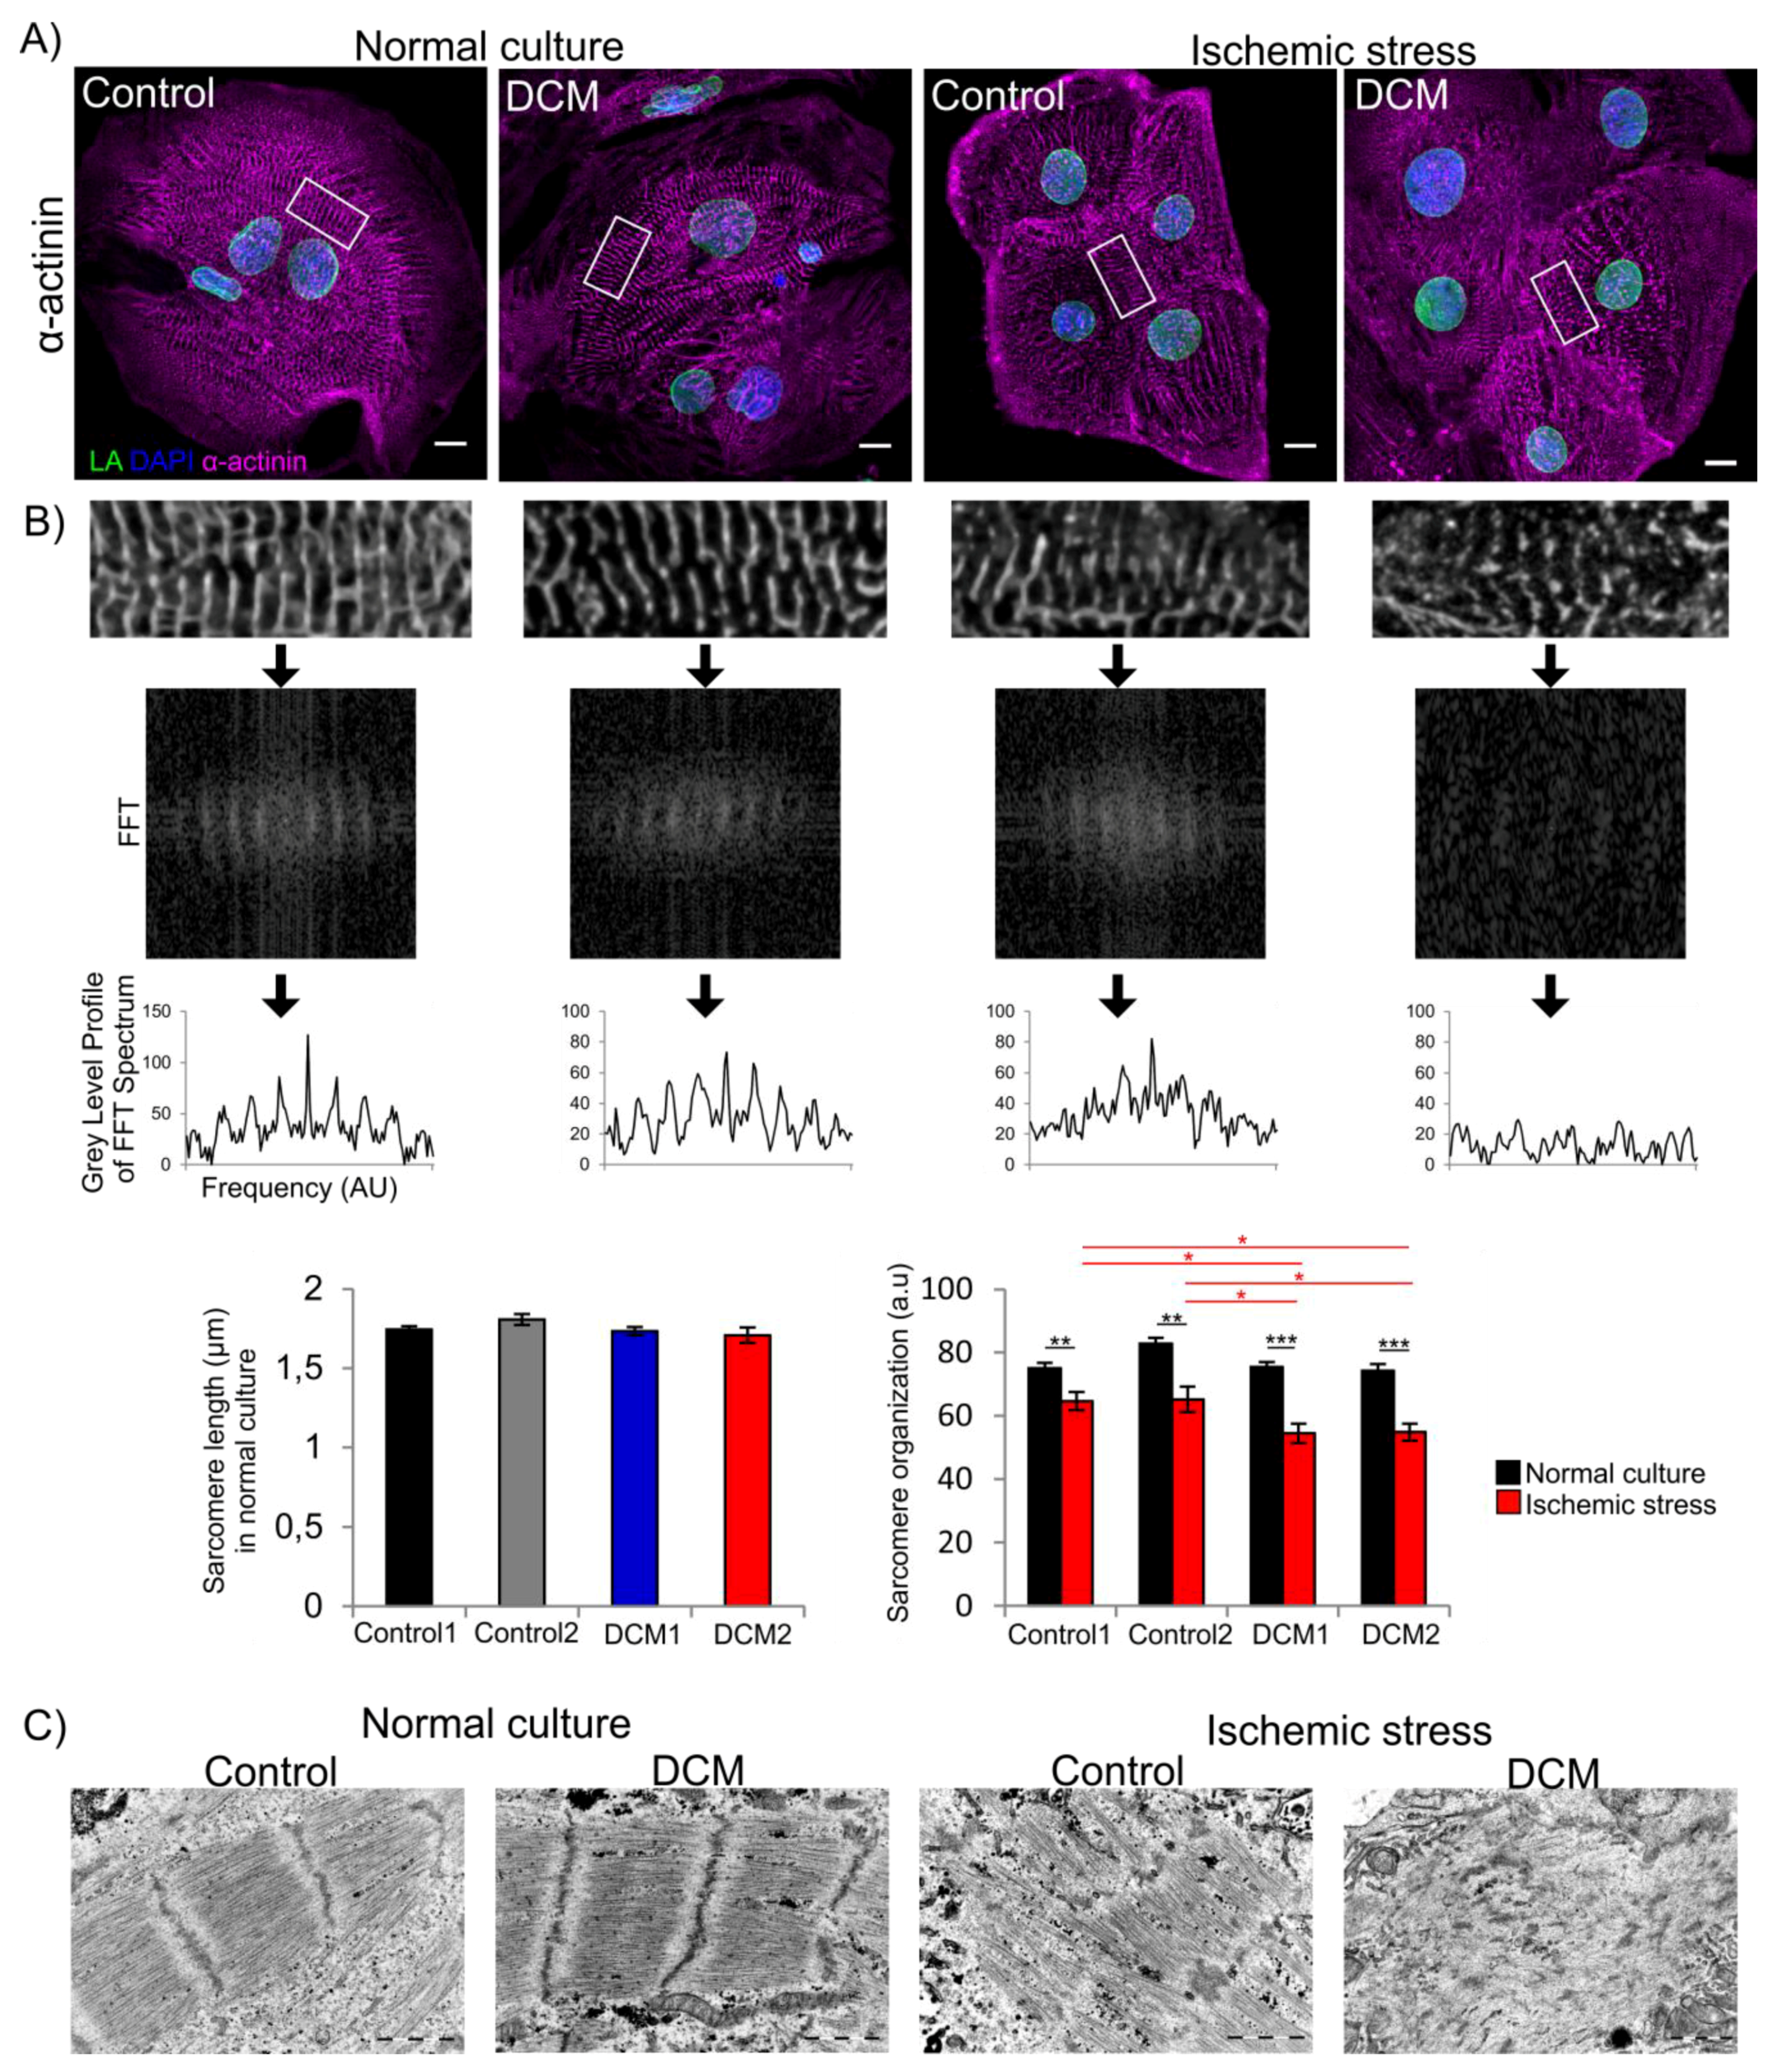
3.4. Increased Sarcomere Disorganization after Ischemic Stress in DCM-CMs
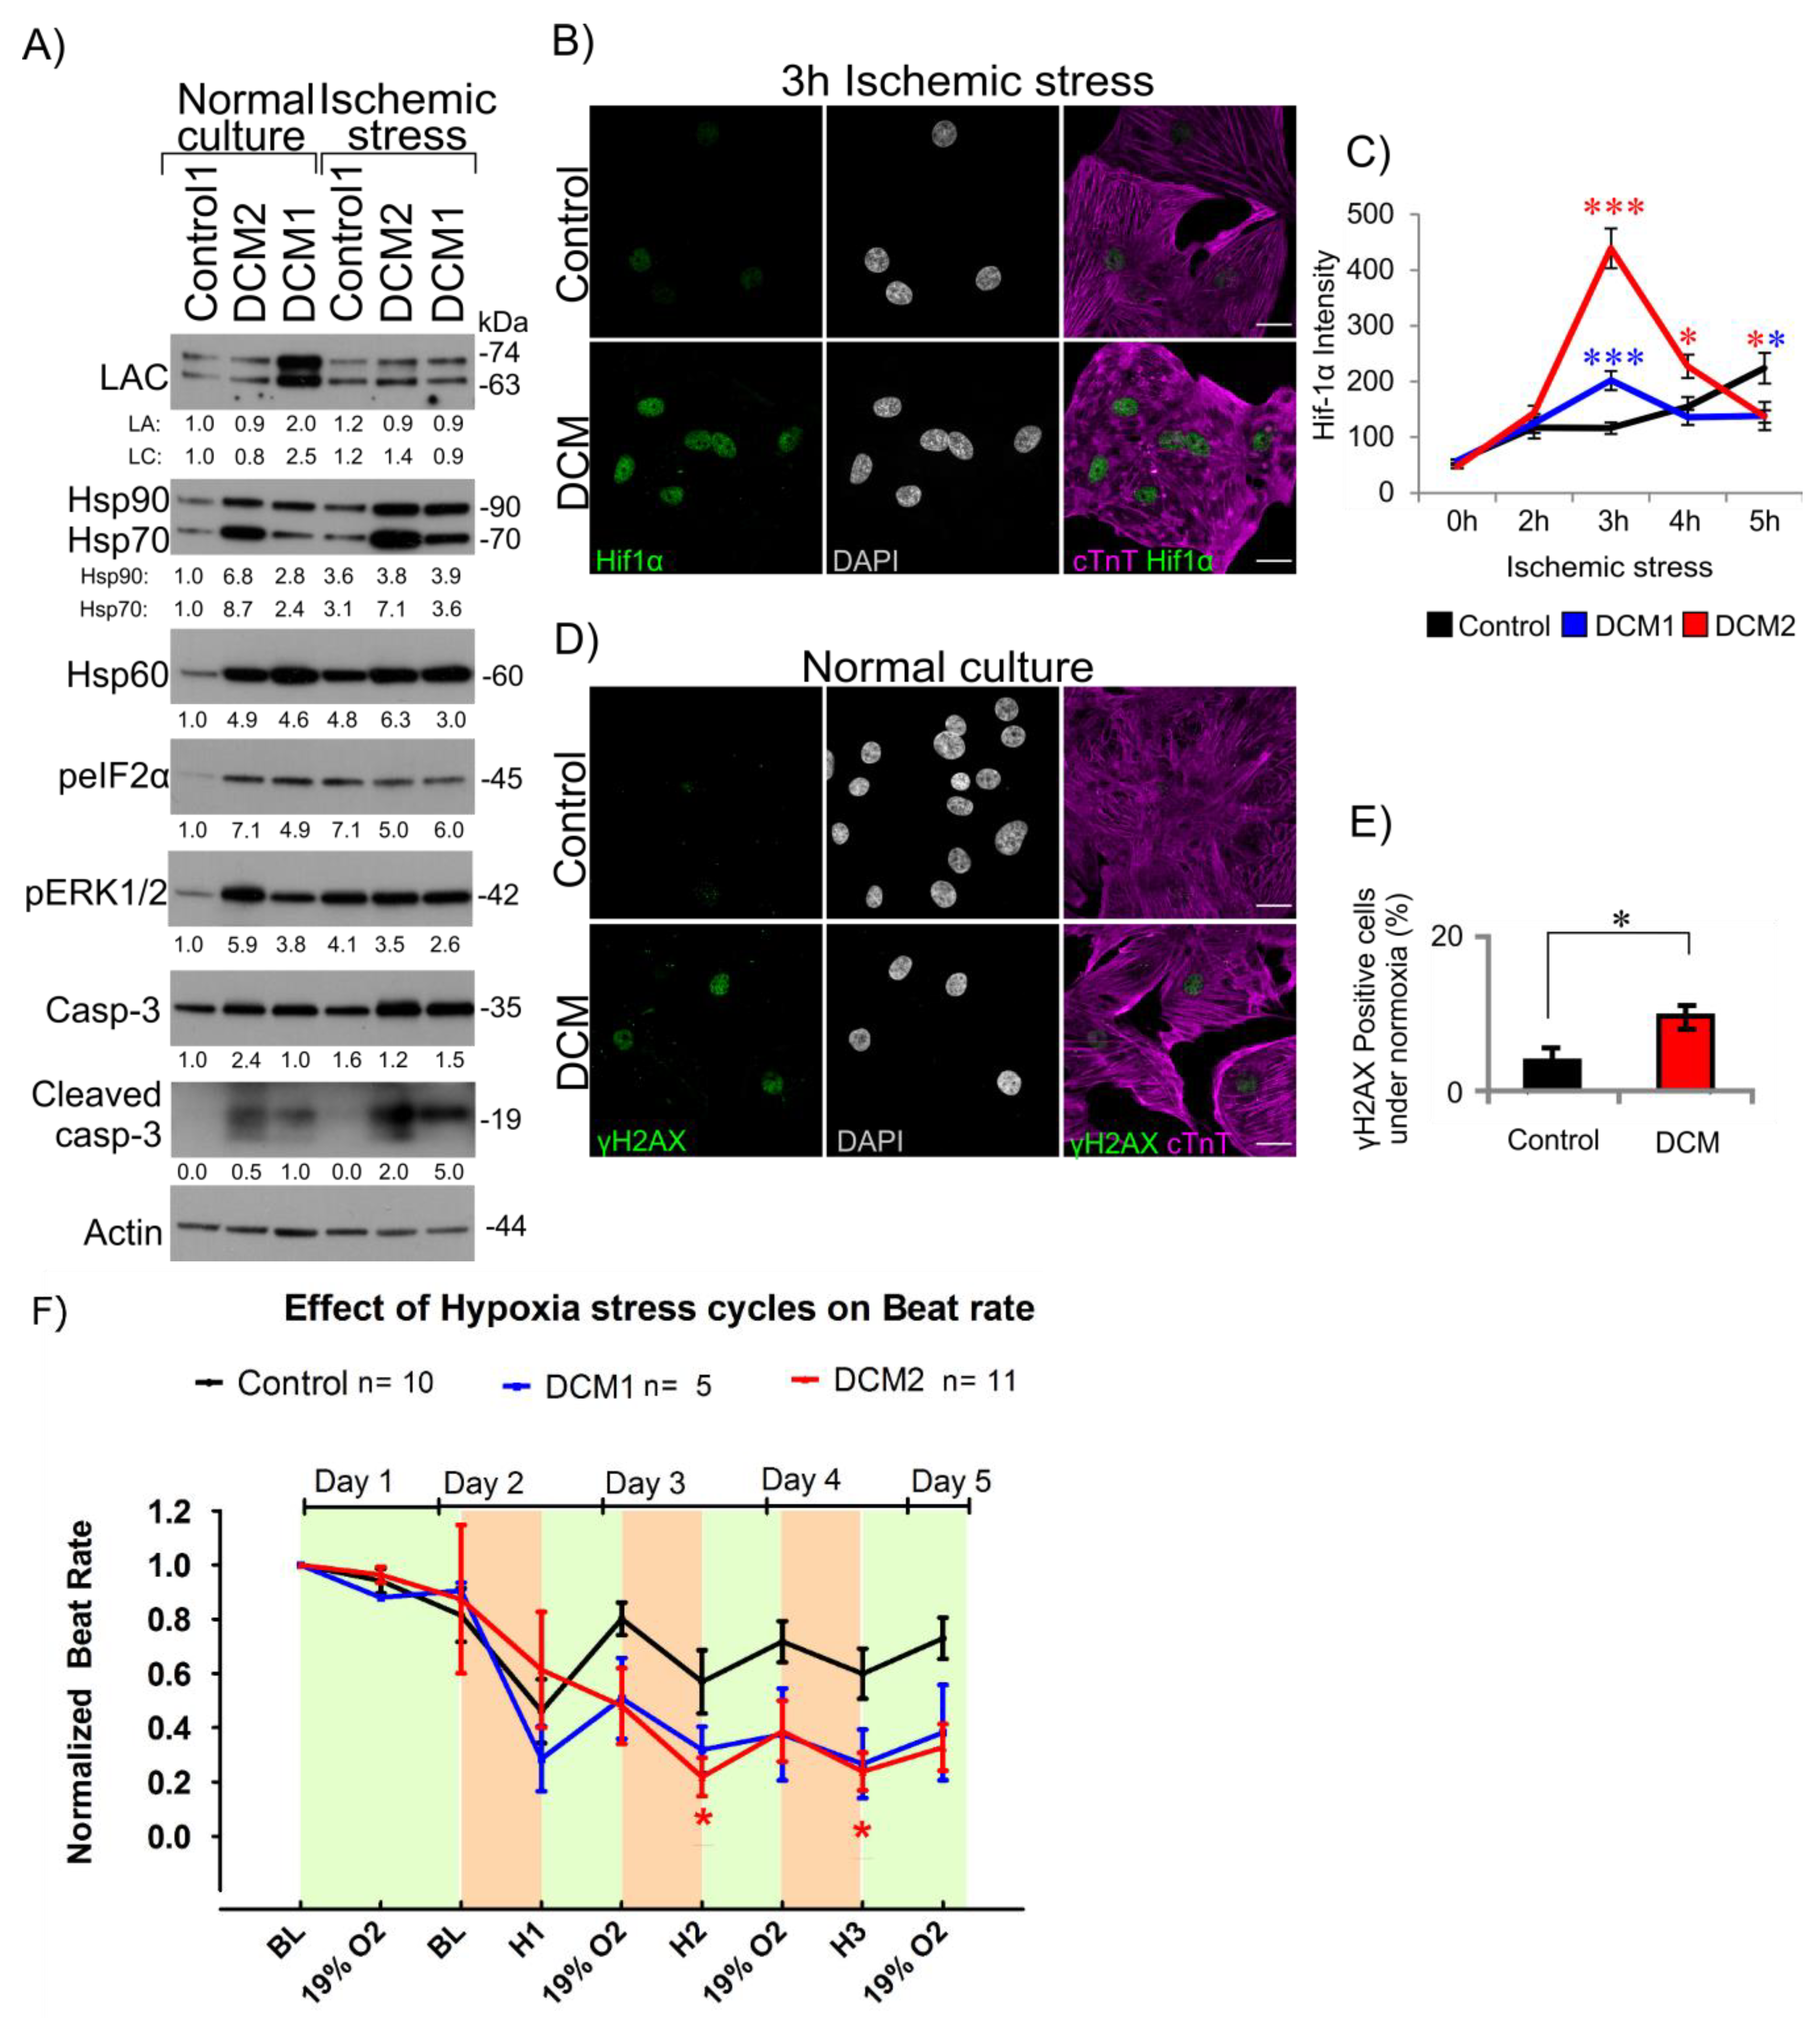
3.5. DCM-CMs Show Increased Cellular Stress
3.6. Hypoxia Reduces Beat Rate of Cardiac Aggregates
3.7. DCM-CMs Show Impaired Calcium Dynamics
4. Discussion
5. Conclusions
5.1. Clinical Significance
5.2. Study Limitations
Supplementary Materials
Author Contributions
Funding
Acknowledgments
Conflicts of Interest
References
- Luk, A.; Ahn, E.; Soor, G.S.; Butany, J. Dilated cardiomyopathy: A review. J. Clin. Pathol. 2009, 62, 219–225. [Google Scholar] [CrossRef] [PubMed]
- Mestroni, L.; Brun, F.; Spezzacatene, A.; Sinagra, G.; Taylor, M.R.G. Genetic causes of dilated cardiomyopathy. Prog. Pediatr. Cardiol. 2014, 37, 13–18. [Google Scholar] [CrossRef] [PubMed] [Green Version]
- Hershberger, R.E.; Hedges, D.J.; Morales, A. Dilated cardiomyopathy: The complexity of a diverse genetic architecture. Nat. Rev. Cardiol. 2013, 10, 531–547. [Google Scholar] [CrossRef] [PubMed]
- Parks, S.B.; Kushner, J.D.; Nauman, D.; Burgess, D.; Ludwigsen, S.; Peterson, A.; Li, D.; Jakobs, P.; Litt, M.; Porter, C.B.; et al. Lamin A/C mutation analysis in a cohort of 324 unrelated patients with idiopathic or familial dilated cardiomyopathy. Am. Heart J. 2009, 156, 161–169. [Google Scholar] [CrossRef] [PubMed]
- Tobita, T.; Nomura, S.; Fujita, T.; Morita, H.; Asano, Y.; Onoue, K.; Ito, M.; Imai, Y.; Suzuki, A.; Ko, T.; et al. Genetic basis of cardiomyopathy and the genotypes involved in prognosis and left ventricular reverse remodeling. Sci. Rep. 2018, 8, 1998. [Google Scholar] [CrossRef] [PubMed]
- Dechat, T.; Adam, S.A.; Taimen, P.; Shimi, T.; Goldman, R.D. Nuclear Lamins. Cold Spring Harb. Perspect. Biol. 2010, 2, a000547. [Google Scholar] [CrossRef]
- Worman, H.J. Nuclear lamins and laminopathies. J. Pathol. 2012, 226, 316–325. [Google Scholar] [CrossRef]
- Malhotra, R.; Mason, P.K. Lamin A/C deficiency as a cause of familial dilated cardiomyopathy. Curr. Opin. Cardiol. 2009, 24, 203–208. [Google Scholar] [CrossRef]
- Ollila, L.; Nikus, K.; Holmström, M.; Jalanko, M.; Jurkko, R.; Kaartinen, M.; Koskenvuo, J.; Kuusisto, J.; Kärkkäinen, S.; Palojoki, E.; et al. Clinical disease presentation and ECG characteristics of LMNA mutation carriers. Open Heart 2017, 4, e000474. [Google Scholar] [CrossRef]
- Becane, H.; Bonne, G.; Varnous, S.; Muchir, A.; Ortega, V.; Hammouda, E.H.; Urtizberea, J.; Lavergne, T.; Fardeau, M.; Eymard, B.; et al. High Incidence of Sudden Death with Conduction System and Myocardial Disease Due to Lamins A and C Gene Mutation. Pacing Clin. Electrophysiol. 2000, 23, 1661–1666. [Google Scholar] [CrossRef]
- Van Berlo, J.H.; De Voogt, W.G.; Van, D.K.; Van Tintelen, J.P.; Bonne, G.; Yaou, R.B.; Duboc, D.; Rossenbacker, T.; Heidbuchel, H.; De Visser, M.; et al. Meta-analysis of clinical characteristics of 299 carriers of LMNA gene mutations: Do lamin A/C mutations portend a high risk of sudden death? J. Mol. Med. 2005, 83, 79–83. [Google Scholar] [CrossRef] [PubMed]
- Sweet, M.; Taylor, M.R.G.; Mestroni, L. Diagnosis, prevalence, and screening of familial dilated cardiomyopathy. Expert Opin. Orphan Drugs 2015, 3, 869–876. [Google Scholar] [CrossRef] [PubMed] [Green Version]
- Chandar, S.; Yeo, L.S.; Leimena, C.; Tan, J.; Xiao, X.; Nikolova-Krstevski, V.; Yasuoka, Y.; Gardiner-Garden, M.; Wu, J.; Kesteven, S.; et al. Effects of Mechanical Stress and Carvedilol in Lamin A/C-deficient Dilated Cardiomyopathy. Circ. Res. 2010, 106, 573–582. [Google Scholar] [CrossRef] [PubMed]
- Brayson, D.; Shanahan, C.M. Current insights into LMNA cardiomyopathies: Existing models and missing LINCs. Nucleus 2017, 8, 17–33. [Google Scholar] [CrossRef] [PubMed]
- Arimura, T.; Helbling-Leclerc, A.; Massart, C.; Varnous, S.; Niel, F.; Lacene, E.; Fromes, Y.; Toussaint, M.; Mura, A.; Keller, D.I.; et al. Mouse model carrying H222P-Lmna mutation develops muscular dystrophy and dilated cardiomyopathy similar to human striated muscle laminopathies. Hum. Mol. Genet. 2005, 14, 155–169. [Google Scholar] [CrossRef] [PubMed]
- Muchir, A.; Pavlidis, P.; Decostre, V.; Herron, A.J.; Arimura, T.; Bonne, G.; Worman, H.J. Activation of MAPK pathways links LMNA mutations to cardiomyopathy in Emery-Dreifuss muscular dystrophy. J. Clin. Investig. 2007, 117, 1282–1293. [Google Scholar] [CrossRef] [PubMed]
- Nikolova, V.; Leimena, C.; McMahon, A.C.; Tan, J.C.; Chandar, S.; Jogia, D.; Kesteven, S.H.; Michalicek, J.; Otway, R.; Verheyen, F.; et al. Defects in nuclear structure and function promote dilated cardiomyopathy in lamin A/C-deficient mice. J. Clin. Investig. 2003, 113, 357–369. [Google Scholar] [CrossRef]
- Siu, C.; Lee, Y.; Ho, J.C.; Lai, W.; Chan, Y.; Ng, K.; Wong, L.; Au, K.; Lau, Y.; Zhang, J.; et al. Modeling of lamin A/C mutation premature cardiac aging using patient-specific induced pluripotent stem cells. Aging (Albany NY) 2012, 4, 803–822. [Google Scholar] [CrossRef] [Green Version]
- Lee, Y.; Lau, Y.; Cai, Z.; Lai, W.; Wong, L.; Tse, H.; Ng, K.; Siu, C. Modeling Treatment Response for Lamin A/C Related Dilated Cardiomyopathy in Human Induced Pluripotent Stem Cells. J. Am. Heart Assoc. 2017, 6, 1–16. [Google Scholar] [CrossRef]
- Ojala, M.; Prajapati, C.; Polonen, R.; Rajala, K.; Pekkanen-Mattila, M.; Rasku, J.; Larsson, K.; Aalto-Setala, K. Mutation-Specific Phenotypes in hiPSC-Derived Cardiomyocytes Carrying Either Myosin-Binding Protein C Or α-Tropomyosin Mutation for Hypertrophic Cardiomyopathy. Stem Cells Int. 2015, 2016, 1684792. [Google Scholar] [CrossRef]
- Caspi, O.; Huber, I.; Gepstein, A.; Arbel, G.; Maizels, L.; Boulos, M.; Gepstein, L. Modeling of Arrhythmogenic Right Ventricular Cardiomyopathy With Human Induced Pluripotent Stem Cells. Circ. Cardiovasc. Genet. 2013, 6, 557–568. [Google Scholar] [CrossRef] [PubMed] [Green Version]
- Lahti, A.L.; Kujala, V.J.; Chapman, H.; Koivisto, A.; Pekkanen-Mattila, M.; Kerkela, E.; Hyttinen, J.; Kontula, K.; Swan, H.; Conklin, B.R.; et al. Model for long QT syndrome type 2 using human iPS cells demonstrates arrhythmogenic characteristics in cell culture. Dis. Models Mech. 2011, 5, 220–230. [Google Scholar] [CrossRef] [PubMed]
- Di Baldassarre, A.; Cimetta, E.; Bollini, S.; Gaggi, G.; Ghinassi, B. Human-Induced Pluripotent Stem Cell Technology and Cardiomyocyte Generation: Progress and Clinical Applications. Cells 2018, 7, 48. [Google Scholar] [CrossRef] [PubMed]
- Kärkkäinen, S.; Heliö, T.; Miettinen, R.; Tuomainen, P.; Peltola, P.; Rummukainen, J.; Ylitalo, K.; Kaartinen, M.; Kuusisto, J.; Toivonen, L.; et al. A novel mutation, Ser143Pro, in the lamin A/C gene is common in finnish patients with familial dilated cardiomyopathy. Eur. Heart J. 2004, 25, 885–893. [Google Scholar] [CrossRef] [PubMed]
- West, G.; Gullmets, J.; Virtanen, L.; Li, S.P.; Keinanen, A.; Shimi, T.; Mauermann, M.; Helio, T.; Kaartinen, M.; Ollila, L.; et al. Deleterious assembly of mutant p.S143P lamin A/C causes ER stress in familial dilated cardiomyopathy. J. Cell. Sci. 2016, 129, 2732–2743. [Google Scholar] [CrossRef] [PubMed] [Green Version]
- Ahola, A.; Kiviaho, A.L.; Larsson, K.; Honkanen, M.; Aalto-Setala, K.; Hyttinen, J. Video image-based analysis of single human induced pluripotent stem cell derived cardiomyocyte beating dynamics using digital image correlation. Biomed. Eng. Online 2014, 13, 39. [Google Scholar] [CrossRef]
- Lian, X.; Zhang, J.; Azarin, S.M.; Zhu, K.; Hazeltine, L.B.; Bao, X.; Hsiao, C.; Kamp, T.J.; Palecek, S.P. Directed cardiomyocyte differentiation from human pluripotent stem cells by modulating Wnt/β-catenin signaling under fully defined conditions. Nat. Protoc. 2013, 8, 162–175. [Google Scholar] [CrossRef]
- Kankaanpaa, P.; Paavolainen, L.; Tiitta, S.; Karjalainen, M.; Paivarinne, J.; Nieminen, J.; Marjomaki, V.; Heino, J.; White, D.J. BioImageXD: An open, general-purpose and high-throughput image-processing platform. Nat. Methods 2012, 9, 683–689. [Google Scholar] [CrossRef]
- Schindelin, J.; Arganda-Carreras, I.; Frise, E.; Kaynig, V.; Longair, M.; Pietzsch, T.; Preibisch, S.; Rueden, C.; Saalfeld, S.; Schmid, B.; et al. Fiji: An open-source platform for biological-image analysis. Nat. Methods 2012, 9, 676. [Google Scholar] [CrossRef]
- Come, P.; Francois, G.; Mal, C.O.; Bredeloux, P. Veronique Maupoil Automatic quantitative analysis of t-tubule organization in cardiac myocytes using ImageJ. Am. J. Physiol.-Cell Physiol. 2015, 308, C237–C245. [Google Scholar] [CrossRef]
- Thomsen, M.B.; Volders, P.G.A.; Beekman, J.D.M.; Matz, J.; Vos, M.A. Beat-to-Beat Variability of Repolarization Determines Proarrhythmic Outcome in Dogs Susceptible to Drug-Induced Torsades de Pointes. J. Am. Coll. Cardiol. 2006, 48, 1268–1276. [Google Scholar] [CrossRef] [PubMed]
- Kreutzer, J.; Rantanen, K.; Valimaki, H.; Lekkala, J.; Jaakkola, P.; Kallio, P. Mini-incubator For Prolonged Cell Culture And Hypoxia Studies Outside An Incubator. In Proceedings of the 10th International Meeting on Substrate-Integrated Electrode Arrays, Reutlingen, Germany, 28 June–1 July 2016. [Google Scholar]
- Chatzifrangkeskou, M.; Yadin, D.; Marais, T.; Chardonnet, S.; Cohen-Tannoudji, M.; Mougenot, N.; Schmitt, A.; Crasto, S.; Di Pasquale, E.; Macquart, C.; et al. Cofilin-1 phosphorylation catalyzed by ERK1/2 alters cardiac actin dynamics in dilated cardiomyopathy caused by lamin A/C gene mutation. Hum. Mol. Genet. 2018, 27, 3060–3078. [Google Scholar] [CrossRef] [PubMed]
- Ranek, M.J.; Stachowski, M.J.; Kirk, J.A.; Willis, M.S. The role of heat shock proteins and co-chaperones in heart failure. Philos. Trans. R. Soc. B Biol. Sci. 2018, 373, 20160530. [Google Scholar] [CrossRef] [PubMed]
- Genth-Zotz, S.; Bolger, A.P.; Kalra, P.R.; Von Haehling, S.; Doehner, W.; Coats, A.J.S.; Volk, H.; Anker, S.D. Heat shock protein 70 in patients with chronic heart failure: Relation to disease severity and survival. Int. J. Cardiol. 2004, 96, 397–401. [Google Scholar] [CrossRef] [PubMed]
- Barrans, J.D.; Allen, P.D.; Stamatiou, D.; Dzau, V.J.; Liew, C. Global Gene Expression Profiling of End-Stage Dilated Cardiomyopathy Using a Human Cardiovascular-Based cDNA Microarray. Am. J. Pathol. 2002, 160, 2035–2043. [Google Scholar] [CrossRef] [Green Version]
- Jianhui, Z.; Quyyumi, A.A.; Hongsheng, W.; Gyorgy, C.; David, R.; Zalles-Ganley, A.; Jibike, O.; Julian, H.; Epstein, S.E. Increased Serum Levels of Heat Shock Protein 70 Are Associated With Low Risk of Coronary Artery Disease. Arterioscler. Thromb. Vasc. Biol. 2003, 23, 1055–1059. [Google Scholar]
- Knowlton, A.A.; Kapadia, S.; Torre-Amione, G.; Durand, J.; Bies, R.; Young, J.; Mann, D.L. Differential Expression of Heat Shock Proteins in Normal and Failing Human Hearts. J. Mol. Cell. Cardiol. 1998, 30, 811–818. [Google Scholar] [CrossRef]
- Willis, M.S.; Patterson, C. Hold me tight: Role of the heat shock protein family of chaperones in cardiac disease. Circulation 2010, 122, 1740–1751. [Google Scholar] [CrossRef] [PubMed]
- Wang, M.; Sun, G.; Du, Y.; Tian, Y.; Liao, P.; Liu, X.; Ye, J.; Sun, X. Myricitrin Protects Cardiomyocytes from Hypoxia/Reoxygenation Injury: Involvement of Heat Shock Protein 90. Front. Pharmacol. 2017, 8, 353. [Google Scholar] [CrossRef] [PubMed]
- Wang, M.; Tian, Y.; Du, Y.; Sun, G.; Xu, X.; Jiang, H.; Xu, H.; Meng, X.; Zhang, J.; Ding, S.; et al. Protective effects of Araloside C against myocardial ischaemia/reperfusion injury: Potential involvement of heat shock protein 90. J. Cell. Mol. Med. 2017, 21, 1870–1880. [Google Scholar] [CrossRef]
- Sidorik, L.; Kyyamova, R.; Bobyk, V.; Kapustian, L.; Rozhko, O.; Vigontina, O.; Ryabenko, D.; Danko, I.; Maksymchuk, O.; Kovalenko, V.N.; et al. Molecular chaperone, HSP60, and cytochrome P450 2E1 co-expression in dilated cardiomyopathy. Cell Biol. Int. 2005, 29, 51–55. [Google Scholar] [CrossRef] [PubMed]
- Tetsuo, M.; Issei, K.; Masafumi, K. Endoplasmic Reticulum Stress As a Therapeutic Target in Cardiovascular Disease. Circ. Res. 2010, 107, 1071–1082. [Google Scholar]
- Marcu, M.G.; Doyle, M.; Bertolotti, A.; Ron, D.; Hendershot, L.; Neckers, L. Heat shock protein 90 modulates the unfolded protein response by stabilizing IRE1alpha. Mol. Cell. Biol. 2002, 22, 8506–8513. [Google Scholar] [CrossRef] [PubMed]
- Storniolo, A.; Raciti, M.; Cucina, A.; Bizzarri, M.; Di Renzo, L. Quercetin Affects Hsp70/IRE1α Mediated Protection from Death Induced by Endoplasmic Reticulum Stress. Oxidative Med. Cell. Longev. 2015, 2015, 11. [Google Scholar] [CrossRef] [PubMed]
- Patterson, A.J.; Zhang, L. Hypoxia and Fetal Heart Development. Curr. Mol. Med. 2010, 10, 653–666. [Google Scholar] [CrossRef] [PubMed]
- Malhotra, R.; Brosius, F.C. Glucose Uptake and Glycolysis Reduce Hypoxia-induced Apoptosis in Cultured Neonatal Rat Cardiac Myocytes. J. Biol. Chem. 1999, 274, 12567–12575. [Google Scholar] [CrossRef] [PubMed] [Green Version]
- Doenst, T.; Nguyen, T.D.; Abel, E.D. Cardiac metabolism in heart failure: Implications beyond ATP production. Circ. Res. 2013, 113, 709–724. [Google Scholar] [CrossRef]
- Lou, Q.; Janardhan, A.; Efimov, I.R. Remodeling of Calcium Handling in Human Heart Failure. Adv. Exp. Med. Biol. 2012, 740, 1145–1174. [Google Scholar] [Green Version]
- Lanner, J.T.; Georgiou, D.K.; Joshi, A.D.; Hamilton, S.L. Ryanodine Receptors: Structure, Expression, Molecular Details, and Function in Calcium Release. Cold Spring Harb. Perspect. Biol. 2010, 2, a003996. [Google Scholar] [CrossRef]
- Lee, D.; Michalak, M. Membrane associated Ca2+ buffers in the heart. BMB Rep. 2010, 43, 151–157. [Google Scholar] [CrossRef]
- Wang, S.; Binder, P.; Fang, Q.; Wang, Z.; Xiao, W.; Liu, W.; Wang, X. Endoplasmic reticulum stress in the heart: Insights into mechanisms and drug targets. Br. J. Pharmacol. 2018, 175, 1293–1304. [Google Scholar] [CrossRef] [PubMed]
- Markandeya, Y.S.; Tsubouchi, T.; Hacker, T.A.; Wolff, M.R.; Belardinelli, L.; Balijepalli, R.C. Inhibition of late sodium current attenuates ionic arrhythmia mechanism in ventricular myocytes expressing LaminA-N195K mutation. Heart Rhythm 2016, 13, 2228–2236. [Google Scholar] [CrossRef] [PubMed] [Green Version]
- Johnson, D.M.; Heijman, J.; Bode, E.F.; Greensmith, D.J.; Van, D.L.; Abi-Gerges, N.; Eisner, D.; Trafford, A.W.; Volders, P.G.A. Diastolic Spontaneous Calcium Release from the Sarcoplasmic Reticulum Increases Beat-to-Beat Variability of Repolarization in Canine Ventricular Myocytes after β-Adrenergic Stimulation. Circ. Res. 2013, 112, 246–256. [Google Scholar] [CrossRef] [PubMed]
- Venetucci, L.A.; Trafford, A.W.; O’Neill, S.C.; Eisner, D.A. The sarcoplasmic reticulum and arrhythmogenic calcium release. Cardiovasc. Res. 2008, 77, 285–292. [Google Scholar] [CrossRef] [PubMed]
- Wyles, S.P.; Hrstka, S.C.; Reyes, S.; Terzic, A.; Olson, T.M.; Nelson, T.J. Pharmacological Modulation of Calcium Homeostasis in Familial Dilated Cardiomyopathy: An In Vitro Analysis From an RBM20 Patient-Derived iPSC Model. Clin. Transl. Sci. 2016, 9, 158–167. [Google Scholar] [CrossRef] [PubMed]
- Refaat, M.; Sedki, D.; Zahr, H.C.; Harakeh, D.D.E.; Lammerding, J.; Nemer, G.; Jaalouk, D.E. Deregulation of rbm20 in lamin A/C and emerin related cardiomyopathies. J. Am. Coll. Cardiol. 2018, 71, A738. [Google Scholar] [CrossRef]
- Kaneko, T.; Nomura, F.; Hamada, T.; Abe, Y.; Takamori, H.; Sakakura, T.; Takasuna, K.; Sanbuissho, A.; Hyllner, J.; Sartipy, P.; et al. On-chip in vitro cell-network pre-clinical cardiac toxicity using spatiotemporal human cardiomyocyte measurement on a chip. Sci. Rep. 2014, 4, 4670. [Google Scholar] [CrossRef] [Green Version]
- Myles, R.C.; Wang, L.; Kang, C.; Bers, D.M.; Ripplinger, C.M. Local Î2adrenergic stimulation overcomes source-sink mismatch to generate focal arrhythmia. Circ. Res. 2012, 110, 1454–1464. [Google Scholar] [CrossRef] [PubMed]
- DeSantiago, J.; Ai, X.; Islam, M.; Acuna, G.; Ziolo, M.T.; Bers, D.M.; Pogwizd, S.M. Arrhythmogenic effects of β2-adrenergic stimulation in the failing heart are due to enhanced SR Ca load. Circ. Res. 2008, 102, 1389–1397. [Google Scholar] [CrossRef]
- Hasselberg, N.E.; Haland, T.F.; Saberniak, J.; Brekke, P.; Berge, K.E.; Leren, T.P.; Edvardsen, T.; Haugaa, K.H. Lamin A/C cardiomyopathy: Young onset, high penetrance, and frequent need for heart transplantation. Eur. Heart J. 2018, 39, 853–860. [Google Scholar] [CrossRef]
- Pérez-Serra, A.; Toro, R.; Campuzano, O.; Sarquella-Brugada, G.; Berne, P.; Iglesias, A.; Mangas, A.; Brugada, J.; Brugada, R. A Novel Mutation in Lamin A/C Causing Familial Dilated Cardiomyopathy Associated with Sudden Cardiac Death. J. Card. Fail. 2015, 21, 217–225. [Google Scholar] [CrossRef] [PubMed]
- Piccini, I.; Fehrmann, E.; Frank, S.; Muller, F.U.; Greber, B.; Seebohm, G. Adrenergic Stress Protection of Human iPS Cell-Derived Cardiomyocytes by Fast K(v)7.1 Recycling. Front. Physiol. 2017, 8, 705. [Google Scholar] [CrossRef] [PubMed]
- Ben-Ari, M.; Schick, R.; Barad, L.; Novak, A.; Ben-Ari, E.; Lorber, A.; Itskovitz-Eldor, J.; Rosen, M.R.; Weissman, A.; Binah, O. From beat rate variability in induced pluripotent stem cell-derived pacemaker cells to heart rate variability in human subjects. Heart Rhythm Off. J. Heart Rhythm Soc. 2014, 11, 1808–1818. [Google Scholar] [CrossRef] [PubMed]


© 2019 by the authors. Licensee MDPI, Basel, Switzerland. This article is an open access article distributed under the terms and conditions of the Creative Commons Attribution (CC BY) license (http://creativecommons.org/licenses/by/4.0/).
Share and Cite
Shah, D.; Virtanen, L.; Prajapati, C.; Kiamehr, M.; Gullmets, J.; West, G.; Kreutzer, J.; Pekkanen-Mattila, M.; Heliö, T.; Kallio, P.; et al. Modeling of LMNA-Related Dilated Cardiomyopathy Using Human Induced Pluripotent Stem Cells. Cells 2019, 8, 594. https://doi.org/10.3390/cells8060594
Shah D, Virtanen L, Prajapati C, Kiamehr M, Gullmets J, West G, Kreutzer J, Pekkanen-Mattila M, Heliö T, Kallio P, et al. Modeling of LMNA-Related Dilated Cardiomyopathy Using Human Induced Pluripotent Stem Cells. Cells. 2019; 8(6):594. https://doi.org/10.3390/cells8060594
Chicago/Turabian StyleShah, Disheet, Laura Virtanen, Chandra Prajapati, Mostafa Kiamehr, Josef Gullmets, Gun West, Joose Kreutzer, Mari Pekkanen-Mattila, Tiina Heliö, Pasi Kallio, and et al. 2019. "Modeling of LMNA-Related Dilated Cardiomyopathy Using Human Induced Pluripotent Stem Cells" Cells 8, no. 6: 594. https://doi.org/10.3390/cells8060594