Gonadotropins in Keratoconus: The Unexpected Suspects

 ,
,
Abstract
:1. Introduction
2. Materials and Methods
2.1. Participants, Ethical Approval, Consent, and Inclusion/Exclusion Criteria
2.2. Plasma Sample Collection
2.3. Plasma ELISA
2.4. Corneal Tissue Processing and Cell Isolation
2.5. Cell Cultures and In Vitro Models
2.6. Protein Extraction and Western Blot Analysis
2.7. Statistical Analysis
3. Results
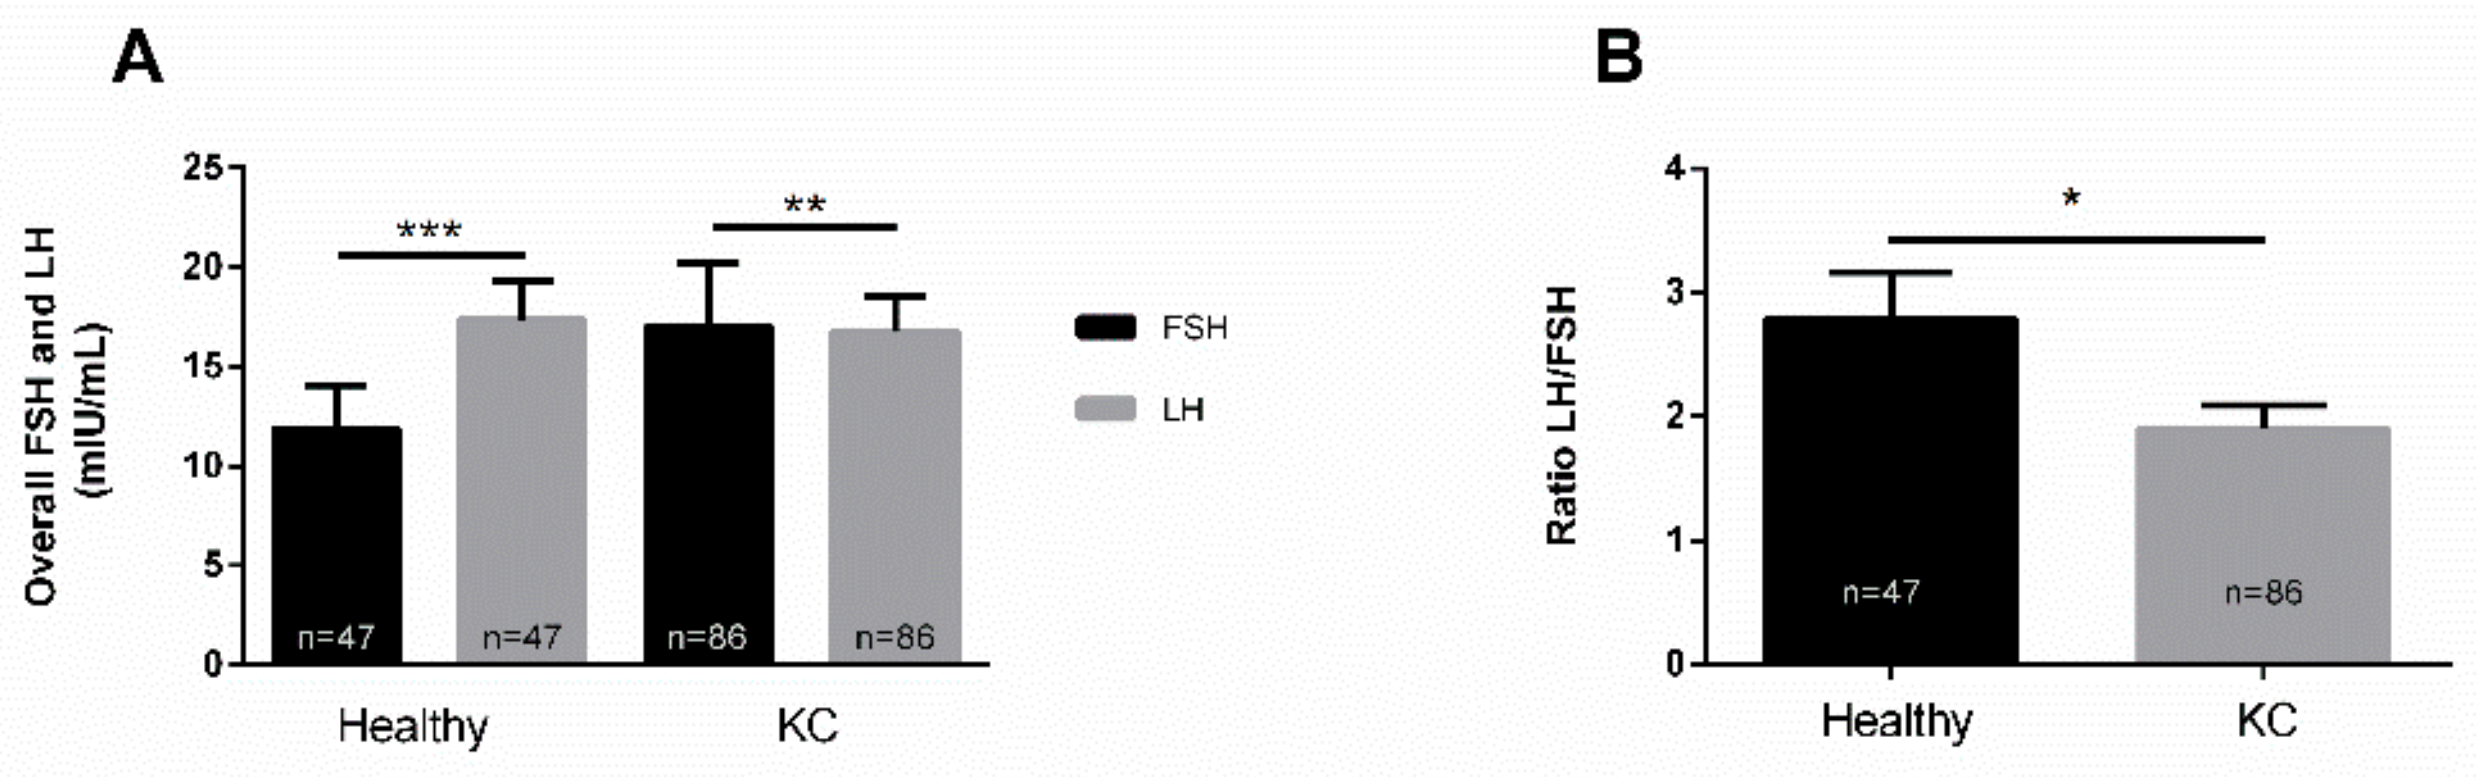
3.1. LH/FSH in Healthy Controls and KCs
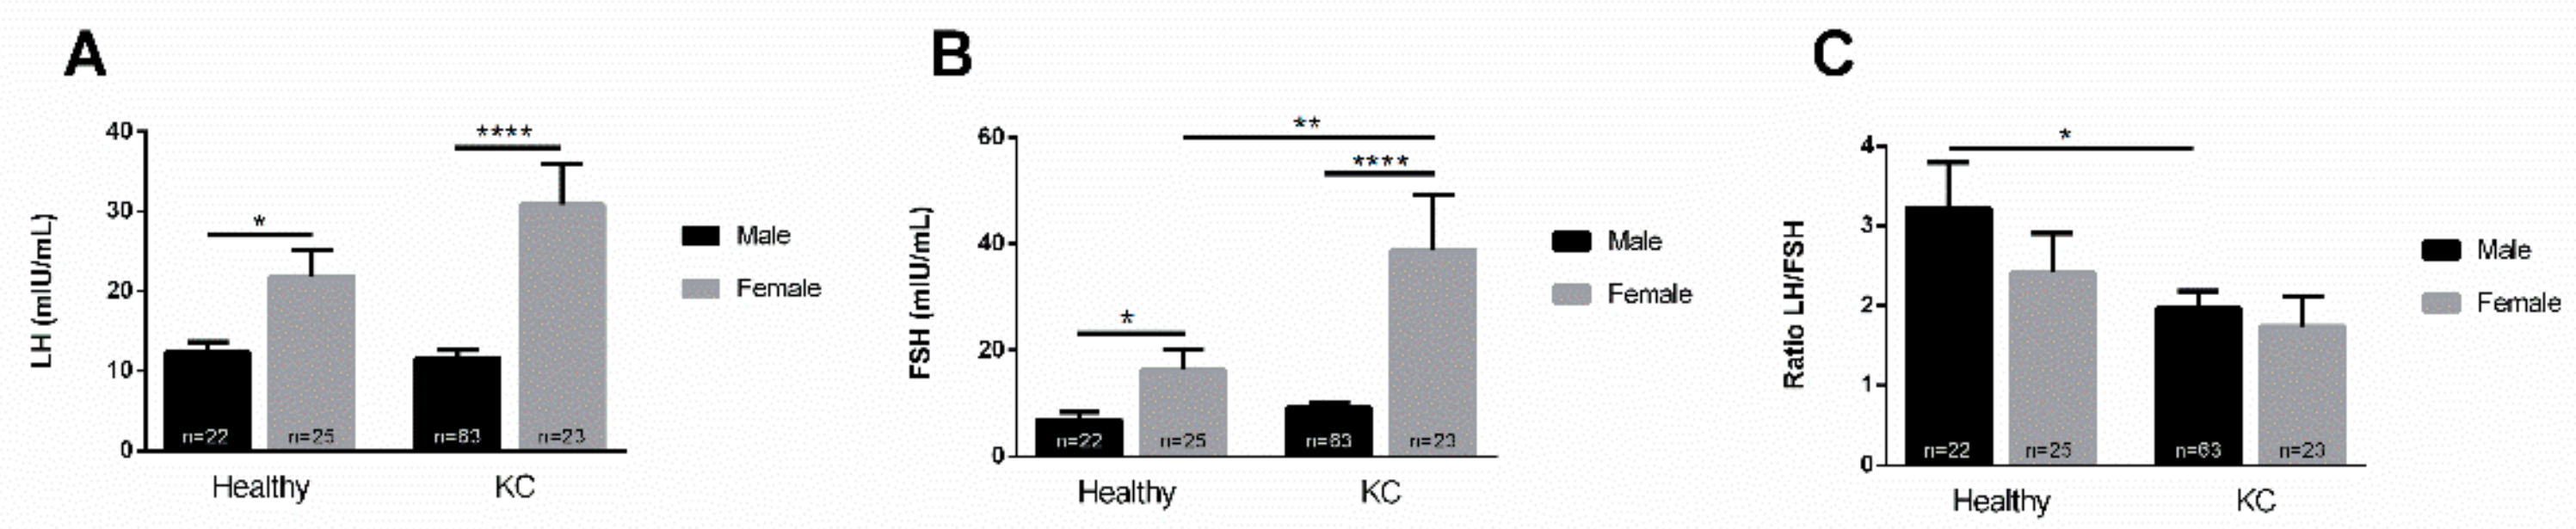
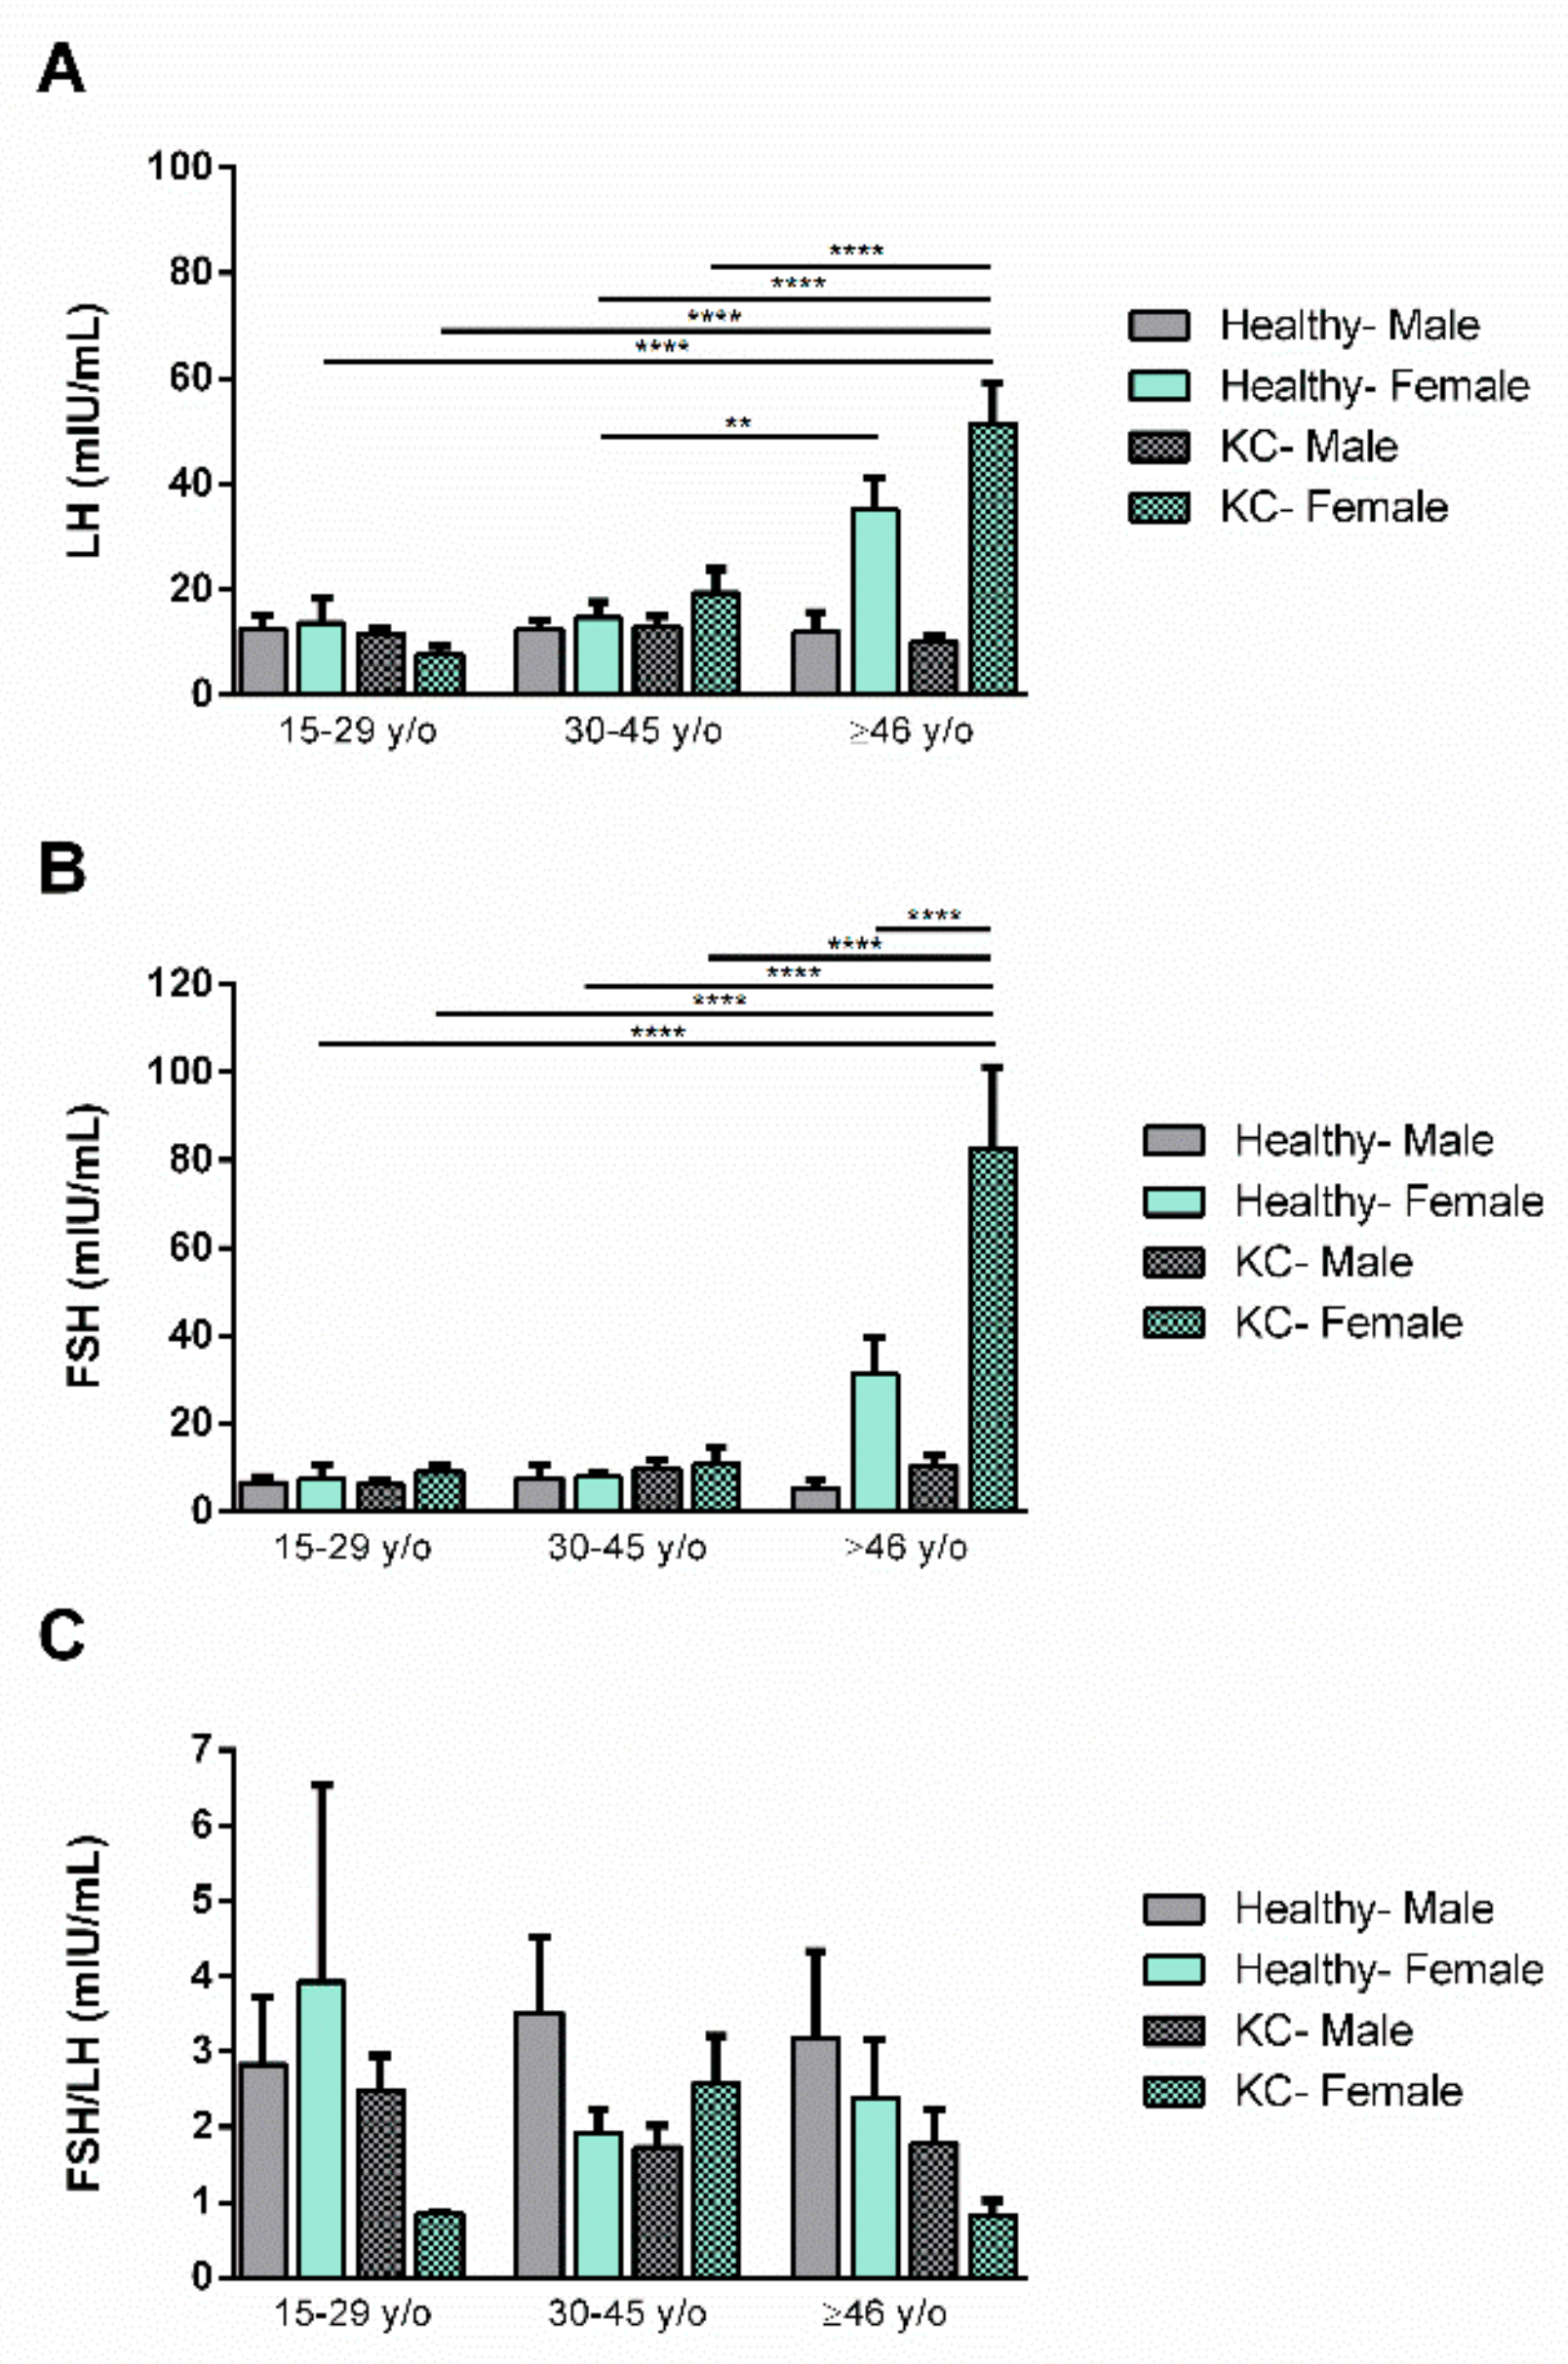
3.2. Gender Dependence
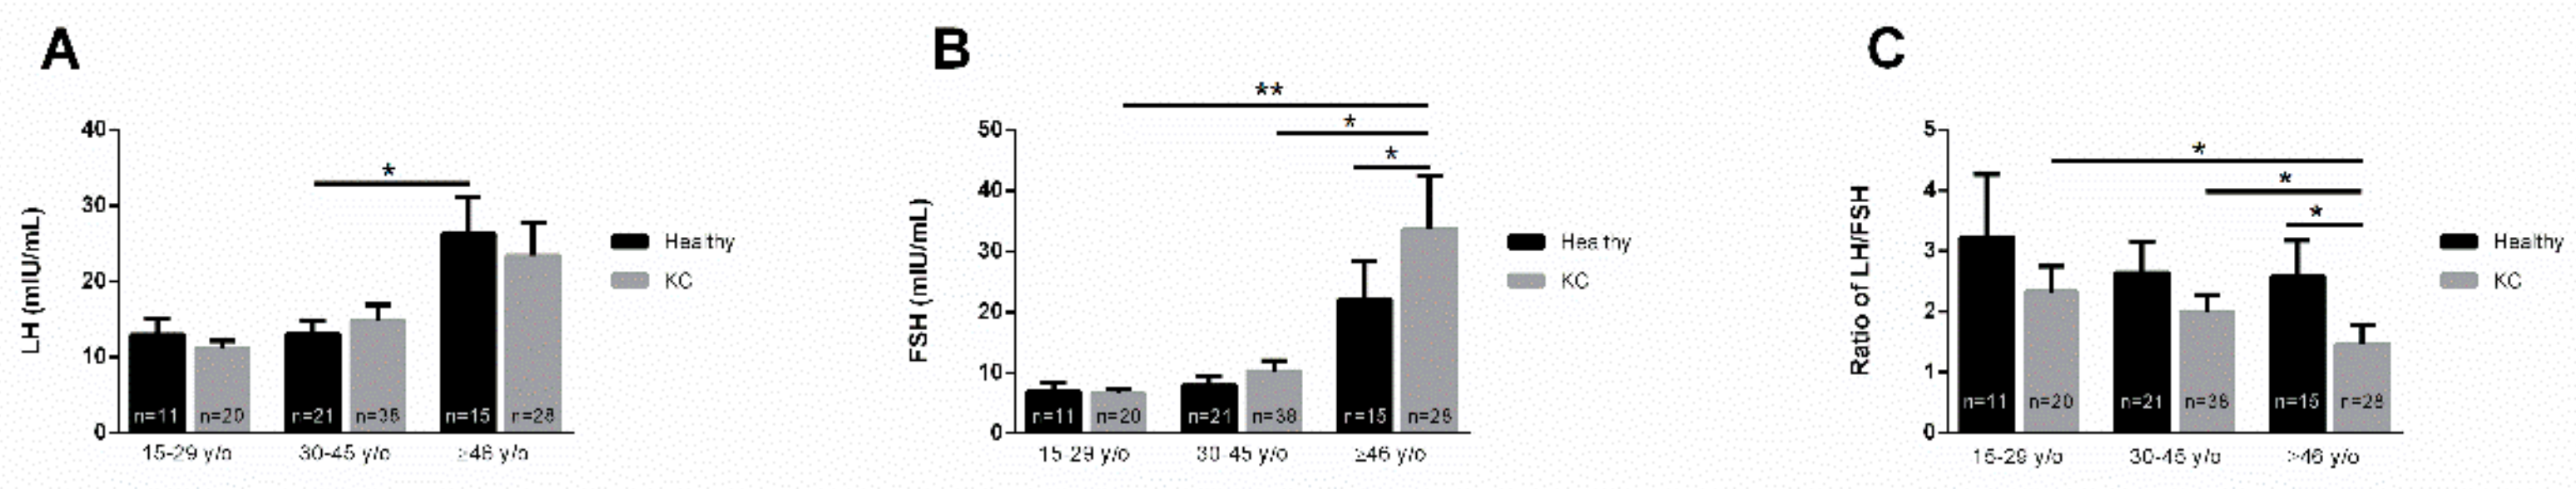
3.3. Age Dependence
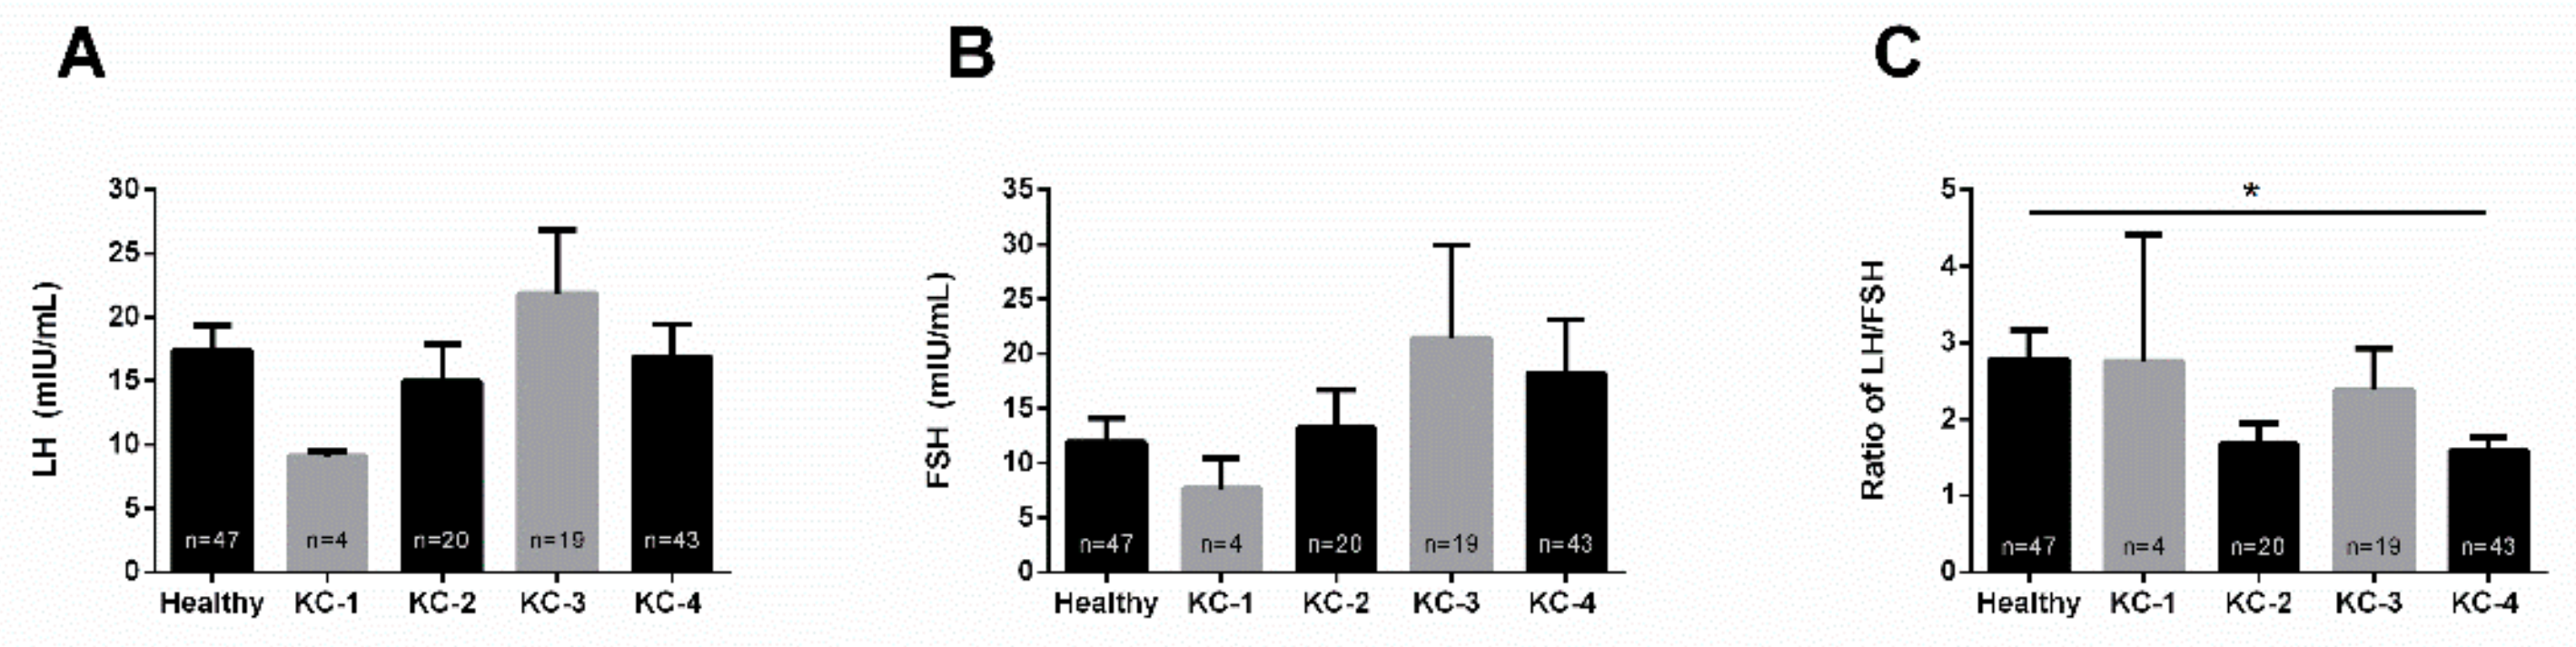
3.4. KC Severity
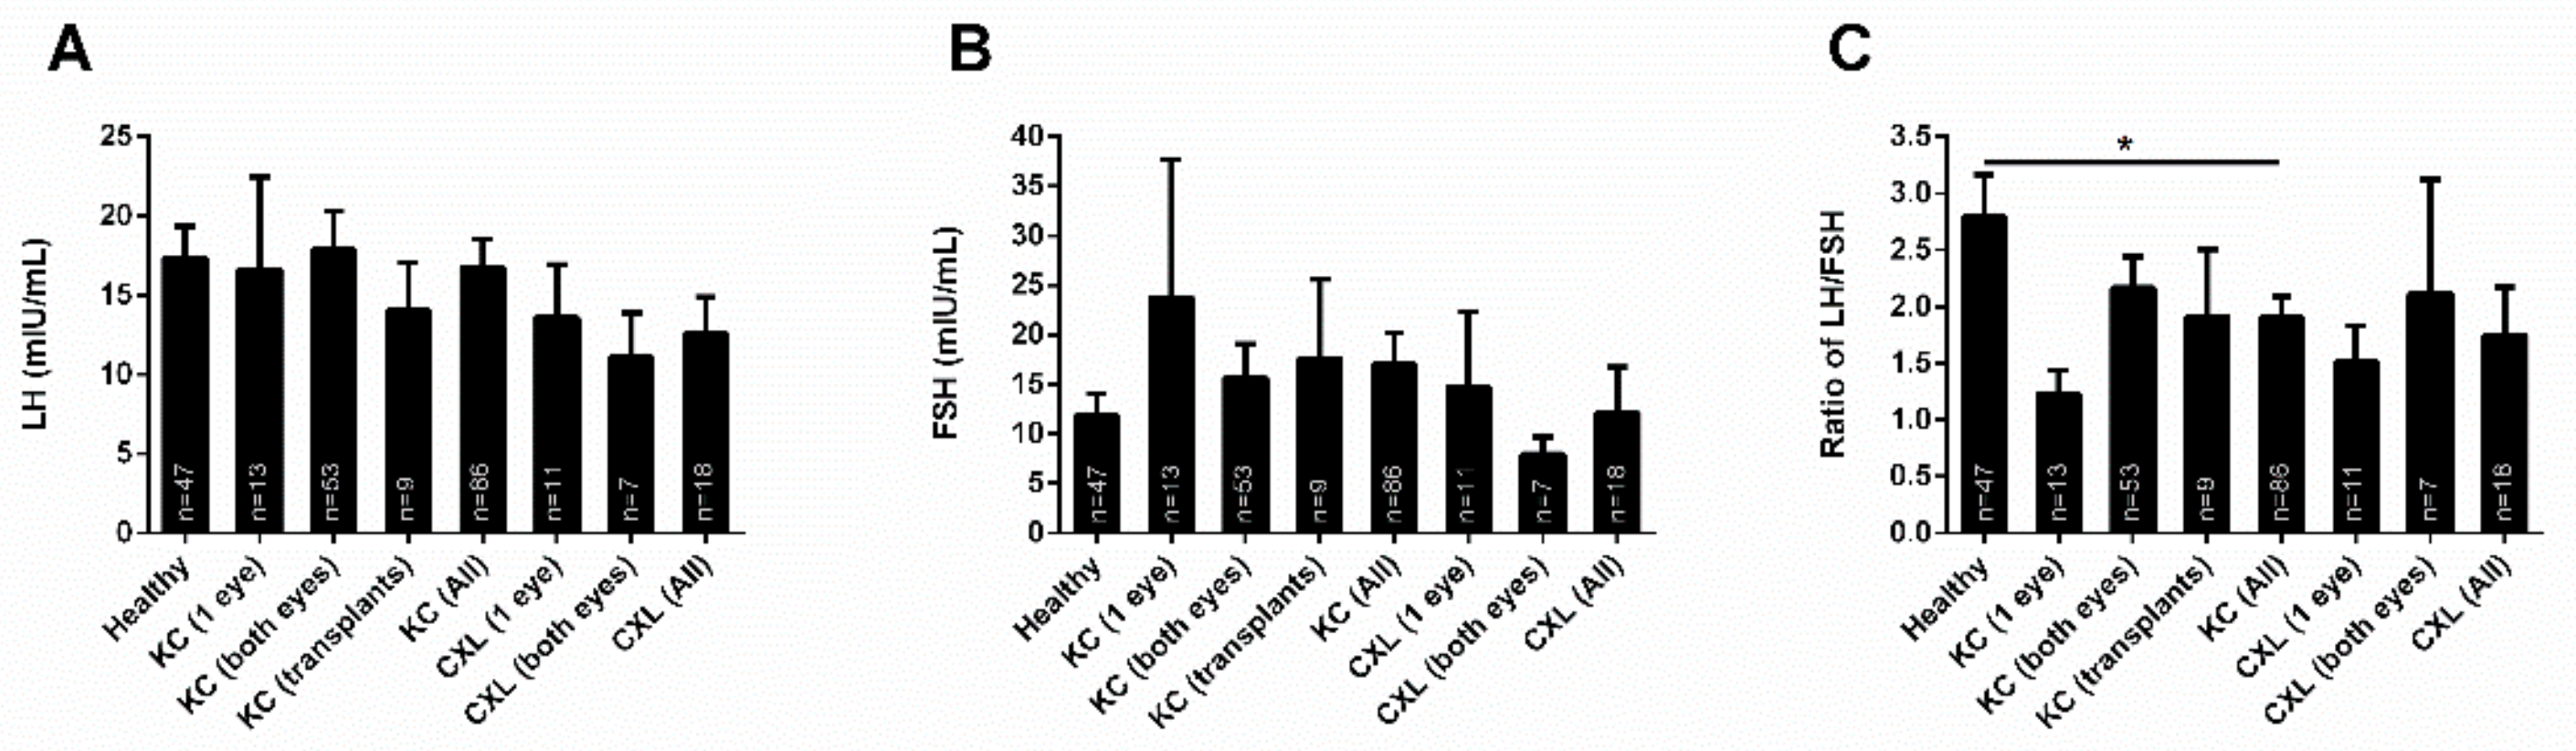
3.5. KC Treatment
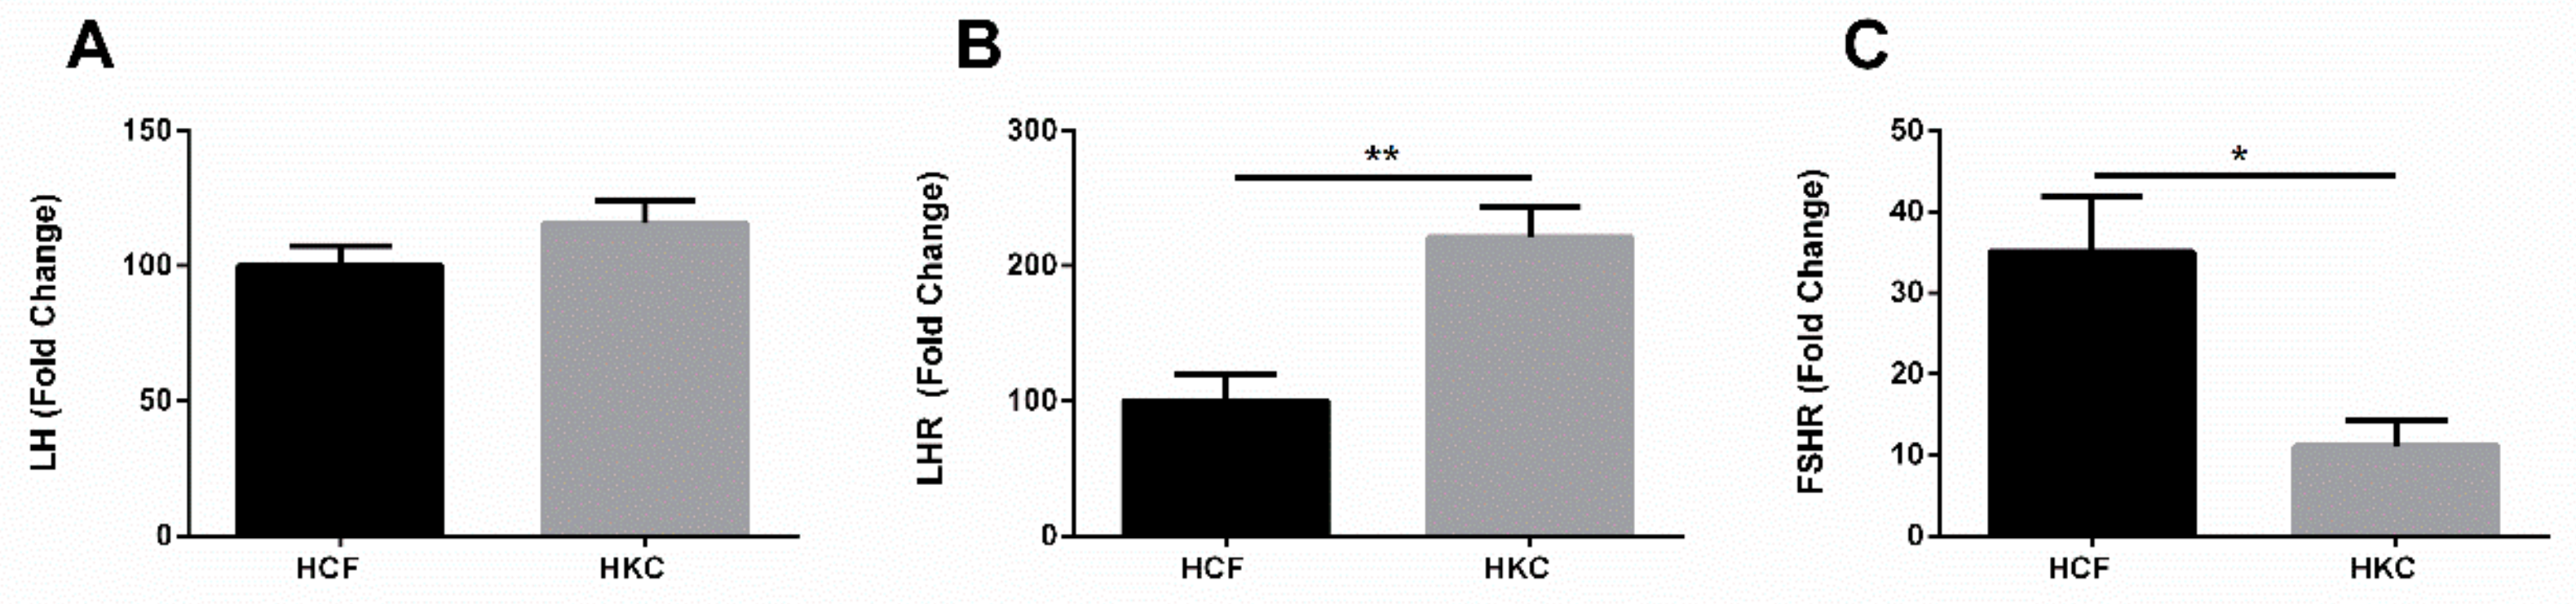
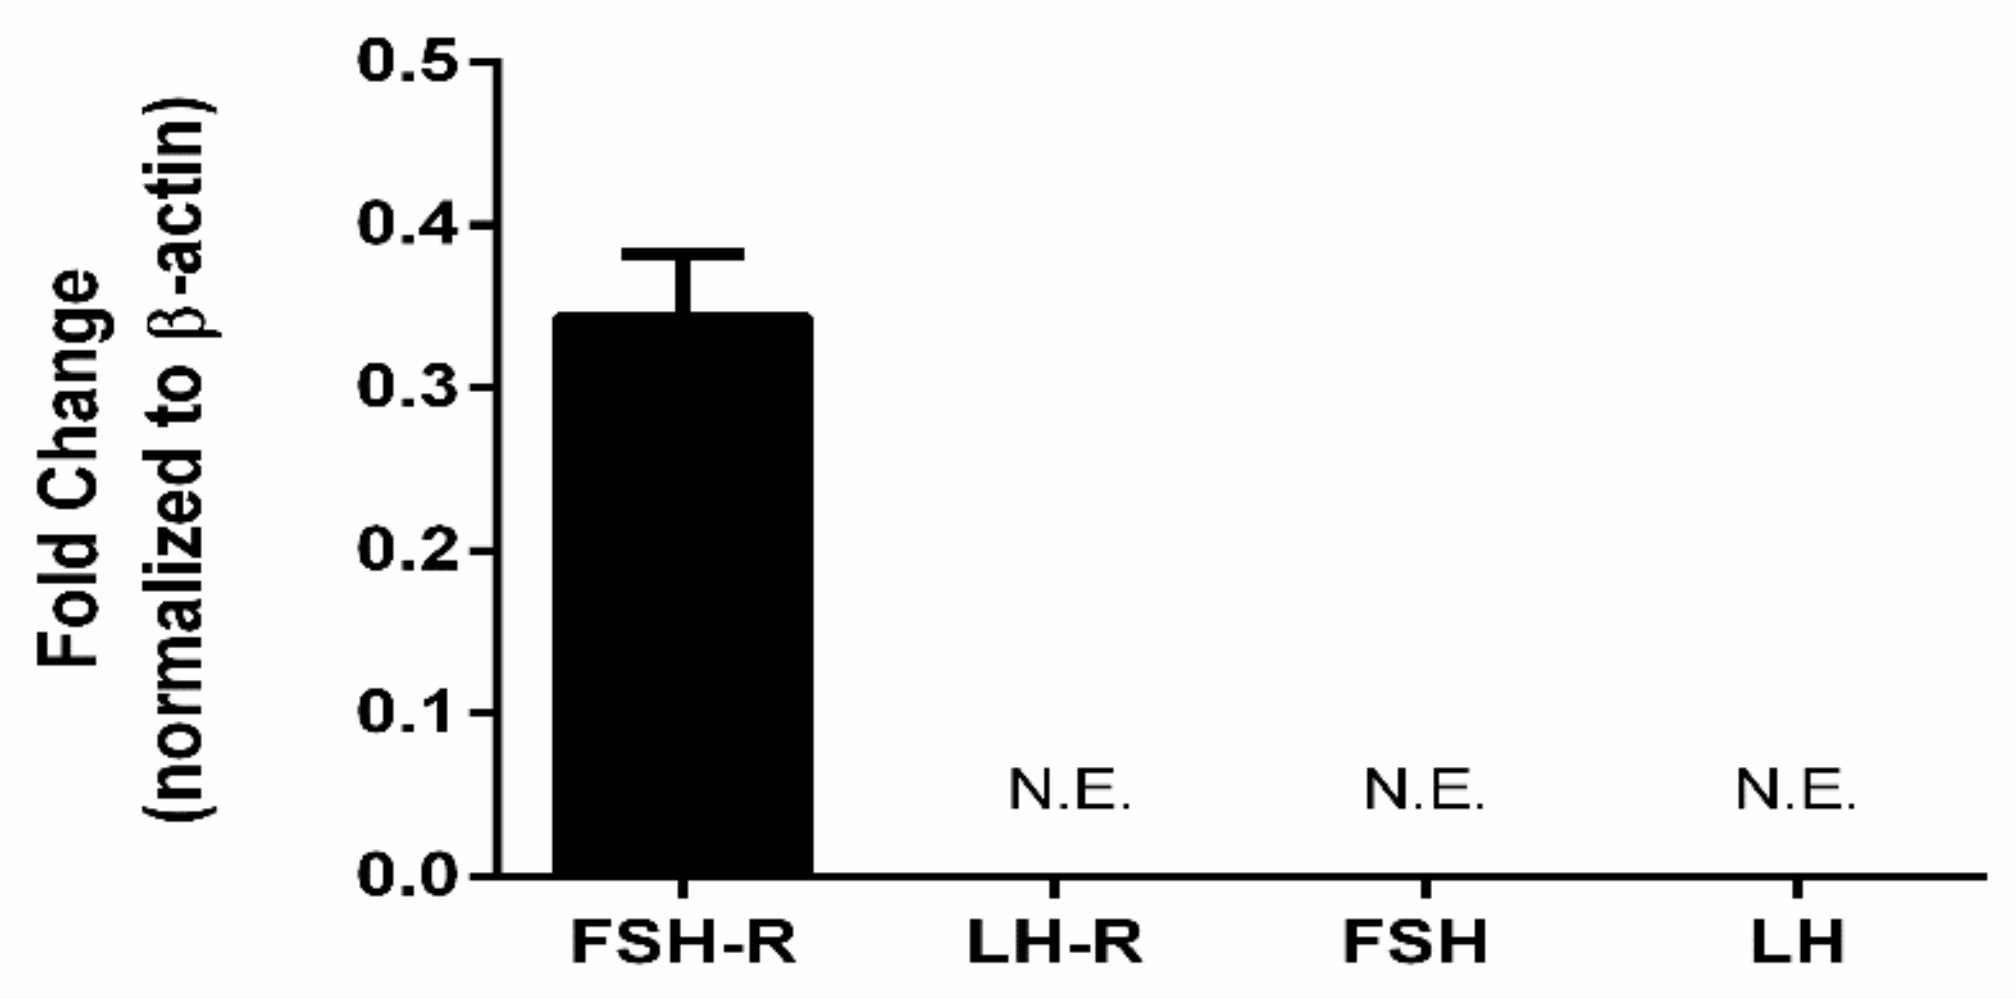
3.6. Gonadotropins and Extragonadal Tissue
4. Discussion
5. Conclusions
Supplementary Materials
Author Contributions
Funding
Conflicts of Interest
References
- Gordon-Shaag, A.; Millodot, M.; Shneor, E.; Liu, Y. The genetic and environmental factors for keratoconus. BioMed Res. Int. 2015, 2015, 795738. [Google Scholar] [CrossRef] [PubMed]
- Thanos, S.; Oellers, P.; Meyer Zu Horste, M.; Prokosch, V.; Schlatt, S.; Seitz, B.; Gatzioufas, Z. Role of Thyroxine in the Development of Keratoconus. Cornea 2016, 35, 1338–1346. [Google Scholar] [CrossRef] [PubMed]
- Rabinowitz, Y.S. Keratoconus. Surv. Ophthalmol. 1998, 42, 297–319. [Google Scholar] [CrossRef]
- Kennedy, R.H.; Bourne, W.M.; Dyer, J.A. A 48-year clinical and epidemiologic study of keratoconus. Am. J. Ophthalmol. 1986, 101, 267–273. [Google Scholar] [CrossRef]
- Varssano, D.; Kaiserman, I.; Hazarbassanov, R. Topographic patterns in refractive surgery candidates. Cornea 2004, 23, 602–607. [Google Scholar] [CrossRef] [PubMed]
- Bamashmus, M.A.; Saleh, M.F.; Awadalla, M.A. Reasons for not performing keratorefractive surgery in patients seeking refractive surgery in a hospital-based cohort in “yemen”. Middle East Afr. J. Ophthalmol. 2010, 17, 349–353. [Google Scholar] [CrossRef]
- Zadnik, K.; Mannis, M.J.; Johnson, C.A. An analysis of contrast sensitivity in identical twins with keratoconus. Cornea 1984, 3, 99–103. [Google Scholar] [CrossRef]
- Gokhale, N.S. Epidemiology of keratoconus. Indian J. Ophthalmol. 2013, 61, 382–383. [Google Scholar] [CrossRef]
- Krachmer, J.H. Eye rubbing can cause keratoconus. Cornea 2004, 23, 539–540. [Google Scholar] [CrossRef]
- McKay, T.B.; Hjortdal, J.; Sejersen, H.; Karamichos, D. Differential Effects of Hormones on Cellular Metabolism in Keratoconus In Vitro. Sci. Rep. 2017, 7, 42896. [Google Scholar] [CrossRef]
- McKay, T.B.; Hjortdal, J.; Sejersen, H.; Asara, J.M.; Wu, J.; Karamichos, D. Endocrine and Metabolic Pathways Linked to Keratoconus: Implications for the Role of Hormones in the Stromal Microenvironment. Sci. Rep. 2016, 6, 25534. [Google Scholar] [CrossRef] [PubMed]
- Sharif, R.; Bak-Nielsen, S.; Sejersen, H.; Ding, K.; Hjortdal, J.; Karamichos, D. Prolactin-Induced Protein is a novel biomarker for Keratoconus. Exp. Eye Res. 2019, 179, 55–63. [Google Scholar] [CrossRef] [PubMed]
- Suzuki, T.; Kinoshita, Y.; Tachibana, M.; Matsushima, Y.; Kobayashi, Y.; Adachi, W.; Sotozono, C.; Kinoshita, S. Expression of sex steroid hormone receptors in human cornea. Curr. Eye Res. 2001, 22, 28–33. [Google Scholar] [CrossRef] [PubMed]
- Atas, M.; Demircan, S.; Karatepe Hashas, A.S.; Gulhan, A.; Zararsiz, G. Comparison of corneal endothelial changes following phacoemulsification with transversal and torsional phacoemulsification machines. Int. J. Ophthalmol. 2014, 7, 822–827. [Google Scholar] [CrossRef]
- Bilgihan, K.; Hondur, A.; Sul, S.; Ozturk, S. Pregnancy-induced progression of keratoconus. Cornea 2011, 30, 991–994. [Google Scholar] [CrossRef]
- George, J.W.; Dille, E.A.; Heckert, L.L. Current concepts of follicle-stimulating hormone receptor gene regulation. Biol. Reprod. 2011, 84, 7–17. [Google Scholar] [CrossRef]
- Stamatiades, G.A.; Kaiser, U.B. Gonadotropin regulation by pulsatile GnRH: Signaling and gene expression. Mol. Cell. Endocrinol. 2018, 463, 131–141. [Google Scholar] [CrossRef]
- Ulloa-Aguirre, A.; Reiter, E.; Crepieux, P. FSH Receptor Signaling: Complexity of Interactions and Signal Diversity. Endocrinology 2018, 159, 3020–3035. [Google Scholar] [CrossRef]
- Choi, J.; Smitz, J. Luteinizing hormone and human chorionic gonadotropin: Distinguishing unique physiologic roles. Gynecol. Endocrinol. 2014, 30, 174–181. [Google Scholar] [CrossRef]
- Venencie, P.Y.; Meduri, G.; Pissard, S.; Jolivet, A.; Loosfelt, H.; Milgrom, E.; Misrahi, M. Luteinizing hormone/human chorionic gonadotrophin receptors in various epidermal structures. Br. J. Dermatol. 1999, 141, 438–446. [Google Scholar] [CrossRef]
- Chen, A.; Kaganovsky, E.; Rahimipour, S.; Ben-Aroya, N.; Okon, E.; Koch, Y. Two forms of gonadotropin-releasing hormone (GnRH) are expressed in human breast tissue and overexpressed in breast cancer: A putative mechanism for the antiproliferative effect of GnRH by down-regulation of acidic ribosomal phosphoproteins P1 and P2. Cancer Res. 2002, 62, 1036–1044. [Google Scholar] [PubMed]
- Shemesh, M. Actions of gonadotrophins on the uterus. Reproduction 2001, 121, 835–842. [Google Scholar] [CrossRef]
- Pabon, J.E.; Li, X.; Lei, Z.M.; Sanfilippo, J.S.; Yussman, M.A.; Rao, C.V. Novel presence of luteinizing hormone/chorionic gonadotropin receptors in human adrenal glands. J. Clin. Endocrinol. Metab. 1996, 81, 2397–2400. [Google Scholar] [CrossRef]
- Tuck, M.; Turgeon, D.K.; Brenner, D.E. Chapter 5-Serum and Plasma Collection: Preanalytical Variables and Standard Operating Procedures in Biomarker Research A2-Issaq, Haleem J. In Proteomic and Metabolomic Approaches to Biomarker Discovery; Veenstra, T.D., Ed.; Academic Press: Boston, MA, USA, 2013; pp. 77–85. [Google Scholar] [CrossRef]
- Karamichos, D.; Hutcheon, A.E.; Rich, C.B.; Trinkaus-Randall, V.; Asara, J.M.; Zieske, J.D. In vitro model suggests oxidative stress involved in keratoconus disease. Sci. Rep. 2014, 4, 4608. [Google Scholar] [CrossRef] [PubMed]
- Karamichos, D.; Zareian, R.; Guo, X.; Hutcheon, A.E.; Ruberti, J.W.; Zieske, J.D. Novel in Vitro Model for Keratoconus Disease. J. Funct. Biomater. 2012, 3, 760–775. [Google Scholar] [CrossRef]
- Gipson, I.K.; Spurr-Michaud, S.; Argueso, P.; Tisdale, A.; Ng, T.F.; Russo, C.L. Mucin gene expression in immortalized human corneal-limbal and conjunctival epithelial cell lines. Investig. Ophthalmol. Vis. Sci. 2003, 44, 496–506. [Google Scholar] [CrossRef]
- McCabe, K.L.; Kunzevitzky, N.J.; Chiswell, B.P.; Xia, X.; Goldberg, J.L.; Lanza, R. Efficient Generation of Human Embryonic Stem Cell-Derived Corneal Endothelial Cells by Directed Differentiation. PLoS ONE 2015, 10, 0145266. [Google Scholar] [CrossRef]
- Yu, Z.; Kastenmuller, G.; He, Y.; Belcredi, P.; Moller, G.; Prehn, C.; Mendes, J.; Wahl, S.; Roemisch-Margl, W.; Ceglarek, U.; et al. Differences between human plasma and serum metabolite profiles. PLoS ONE 2011, 6, e21230. [Google Scholar] [CrossRef]
- Wallace, A.M.; Sattar, N. The changing role of the clinical laboratory in the investigation of polycystic ovarian syndrome. Clin. Biochem. Rev. 2007, 28, 79–92. [Google Scholar]
- Burger, L.L.; Haisenleder, D.J.; Dalkin, A.C.; Marshall, J.C. Regulation of gonadotropin subunit gene transcription. J. Mol. Endocrinol. 2004, 33, 559–584. [Google Scholar] [CrossRef]
- Truong, S.; Cole, N.; Stapleton, F.; Golebiowski, B. Sex hormones and the dry eye. Clin. Exp. Opt. 2014, 97, 324–336. [Google Scholar] [CrossRef] [PubMed]
- Versura, P.; Giannaccare, G.; Campos, E.C. Sex-steroid imbalance in females and dry eye. Curr. Eye Res. 2015, 40, 162–175. [Google Scholar] [CrossRef] [PubMed]
- Murube, J. Henrik Sjogren, 1899–1986. Ocul. Surf. 2010, 8, 2–7. [Google Scholar] [CrossRef]
- Mukhtar, S.; Ambati, B.K. Pediatric keratoconus: A review of the literature. Int. Ophthalmol. 2018, 38, 2257–2266. [Google Scholar] [CrossRef] [PubMed]
- Natarajan, R.; Ravindran, R. Progression of keratoconus resulting from hormone replacement therapy. J. Cataract Refract. Surg. 2019, 45, 1055. [Google Scholar] [CrossRef] [PubMed]
- Kahan, I.L.; Varsanyi-Nagy, M.; Toth, M.; Nadrai, A. The possible role of tear fluid thyroxine in keratoconus development. Exp. Eye Res. 1990, 50, 339–343. [Google Scholar] [CrossRef]
- Lee, R.; El-Massry, A.; El-Massry, Y.; Randleman, J.B. Bilateral, Asymmetric Keratoconus Induced by Thyrotoxicosis With Long-term Stability After Corneal Cross-linking. J. Refract. Surg. 2018, 34, 354–356. [Google Scholar] [CrossRef]
- Aydemir, O.; Naziroglu, M.; Colakoglu, N.; Yilmaz, T.; Kukner, A.; Kukner, A.S. Leptin in corneas from keratoconus and infectious keratitis patients. J. Ocul. Pharmacol. Ther. 2005, 21, 382–387. [Google Scholar] [CrossRef]
- Hajagos-Toth, J.; Ducza, E.; Samavati, R.; Vari, S.G.; Gaspar, R. Obesity in pregnancy: A novel concept on the roles of adipokines in uterine contractility. Croat. Med. J. 2017, 58, 96–104. [Google Scholar] [CrossRef] [Green Version]
- Sharif, R.; Bak-Nielsen, S.; Hjortdal, J.; Karamichos, D. Pathogenesis of Keratoconus: The intriguing therapeutic potential of Prolactin-inducible protein. Prog. Retinal Eye Res. 2018, 67, 150–167. [Google Scholar] [CrossRef] [Green Version]


| Sub-Groups | Healthy Controls | Keratoconus |
|---|---|---|
| Gender | ||
| Male | 22 | 63 |
| Female | 25 | 23 |
| Age Groups | ||
| 1: 15-29y/o | 11 | 20 |
| 2: 30-45y/o | 21 | 38 |
| 3: >46y/o | 15 | 28 |
| Severity | ||
| 1: <48D | -- | 4 |
| 2: ≥48-53D | -- | 20 |
| 3: ≥53-58D | -- | 19 |
| 4: ≥58D | -- | 43 |
| Treatment | ||
| KC (One eye) | -- | 13 |
| KC (Both eyes) | -- | 53 |
| KC (All) | -- | 86 |
| CXL (One eye) | -- | 11 |
| CXL (Both eyes) | -- | 7 |
| CXL (All) | -- | 18 |
| Transplant | -- | 9 |
© 2019 by the authors. Licensee MDPI, Basel, Switzerland. This article is an open access article distributed under the terms and conditions of the Creative Commons Attribution (CC BY) license (http://creativecommons.org/licenses/by/4.0/).
Share and Cite
Karamichos, D.; Barrientez, B.; Nicholas, S.; Ma, S.; Van, L.; Bak-Nielsen, S.; Hjortdal, J. Gonadotropins in Keratoconus: The Unexpected Suspects. Cells 2019, 8, 1494. https://doi.org/10.3390/cells8121494
Karamichos D, Barrientez B, Nicholas S, Ma S, Van L, Bak-Nielsen S, Hjortdal J. Gonadotropins in Keratoconus: The Unexpected Suspects. Cells. 2019; 8(12):1494. https://doi.org/10.3390/cells8121494
Chicago/Turabian StyleKaramichos, Dimitrios, Brayden Barrientez, Sarah Nicholas, Symon Ma, Lyly Van, Sashia Bak-Nielsen, and Jesper Hjortdal. 2019. "Gonadotropins in Keratoconus: The Unexpected Suspects" Cells 8, no. 12: 1494. https://doi.org/10.3390/cells8121494