Mechanisms of Age-Dependent Loss of Dietary Restriction Protective Effects in Acute Kidney Injury

 , and
, and 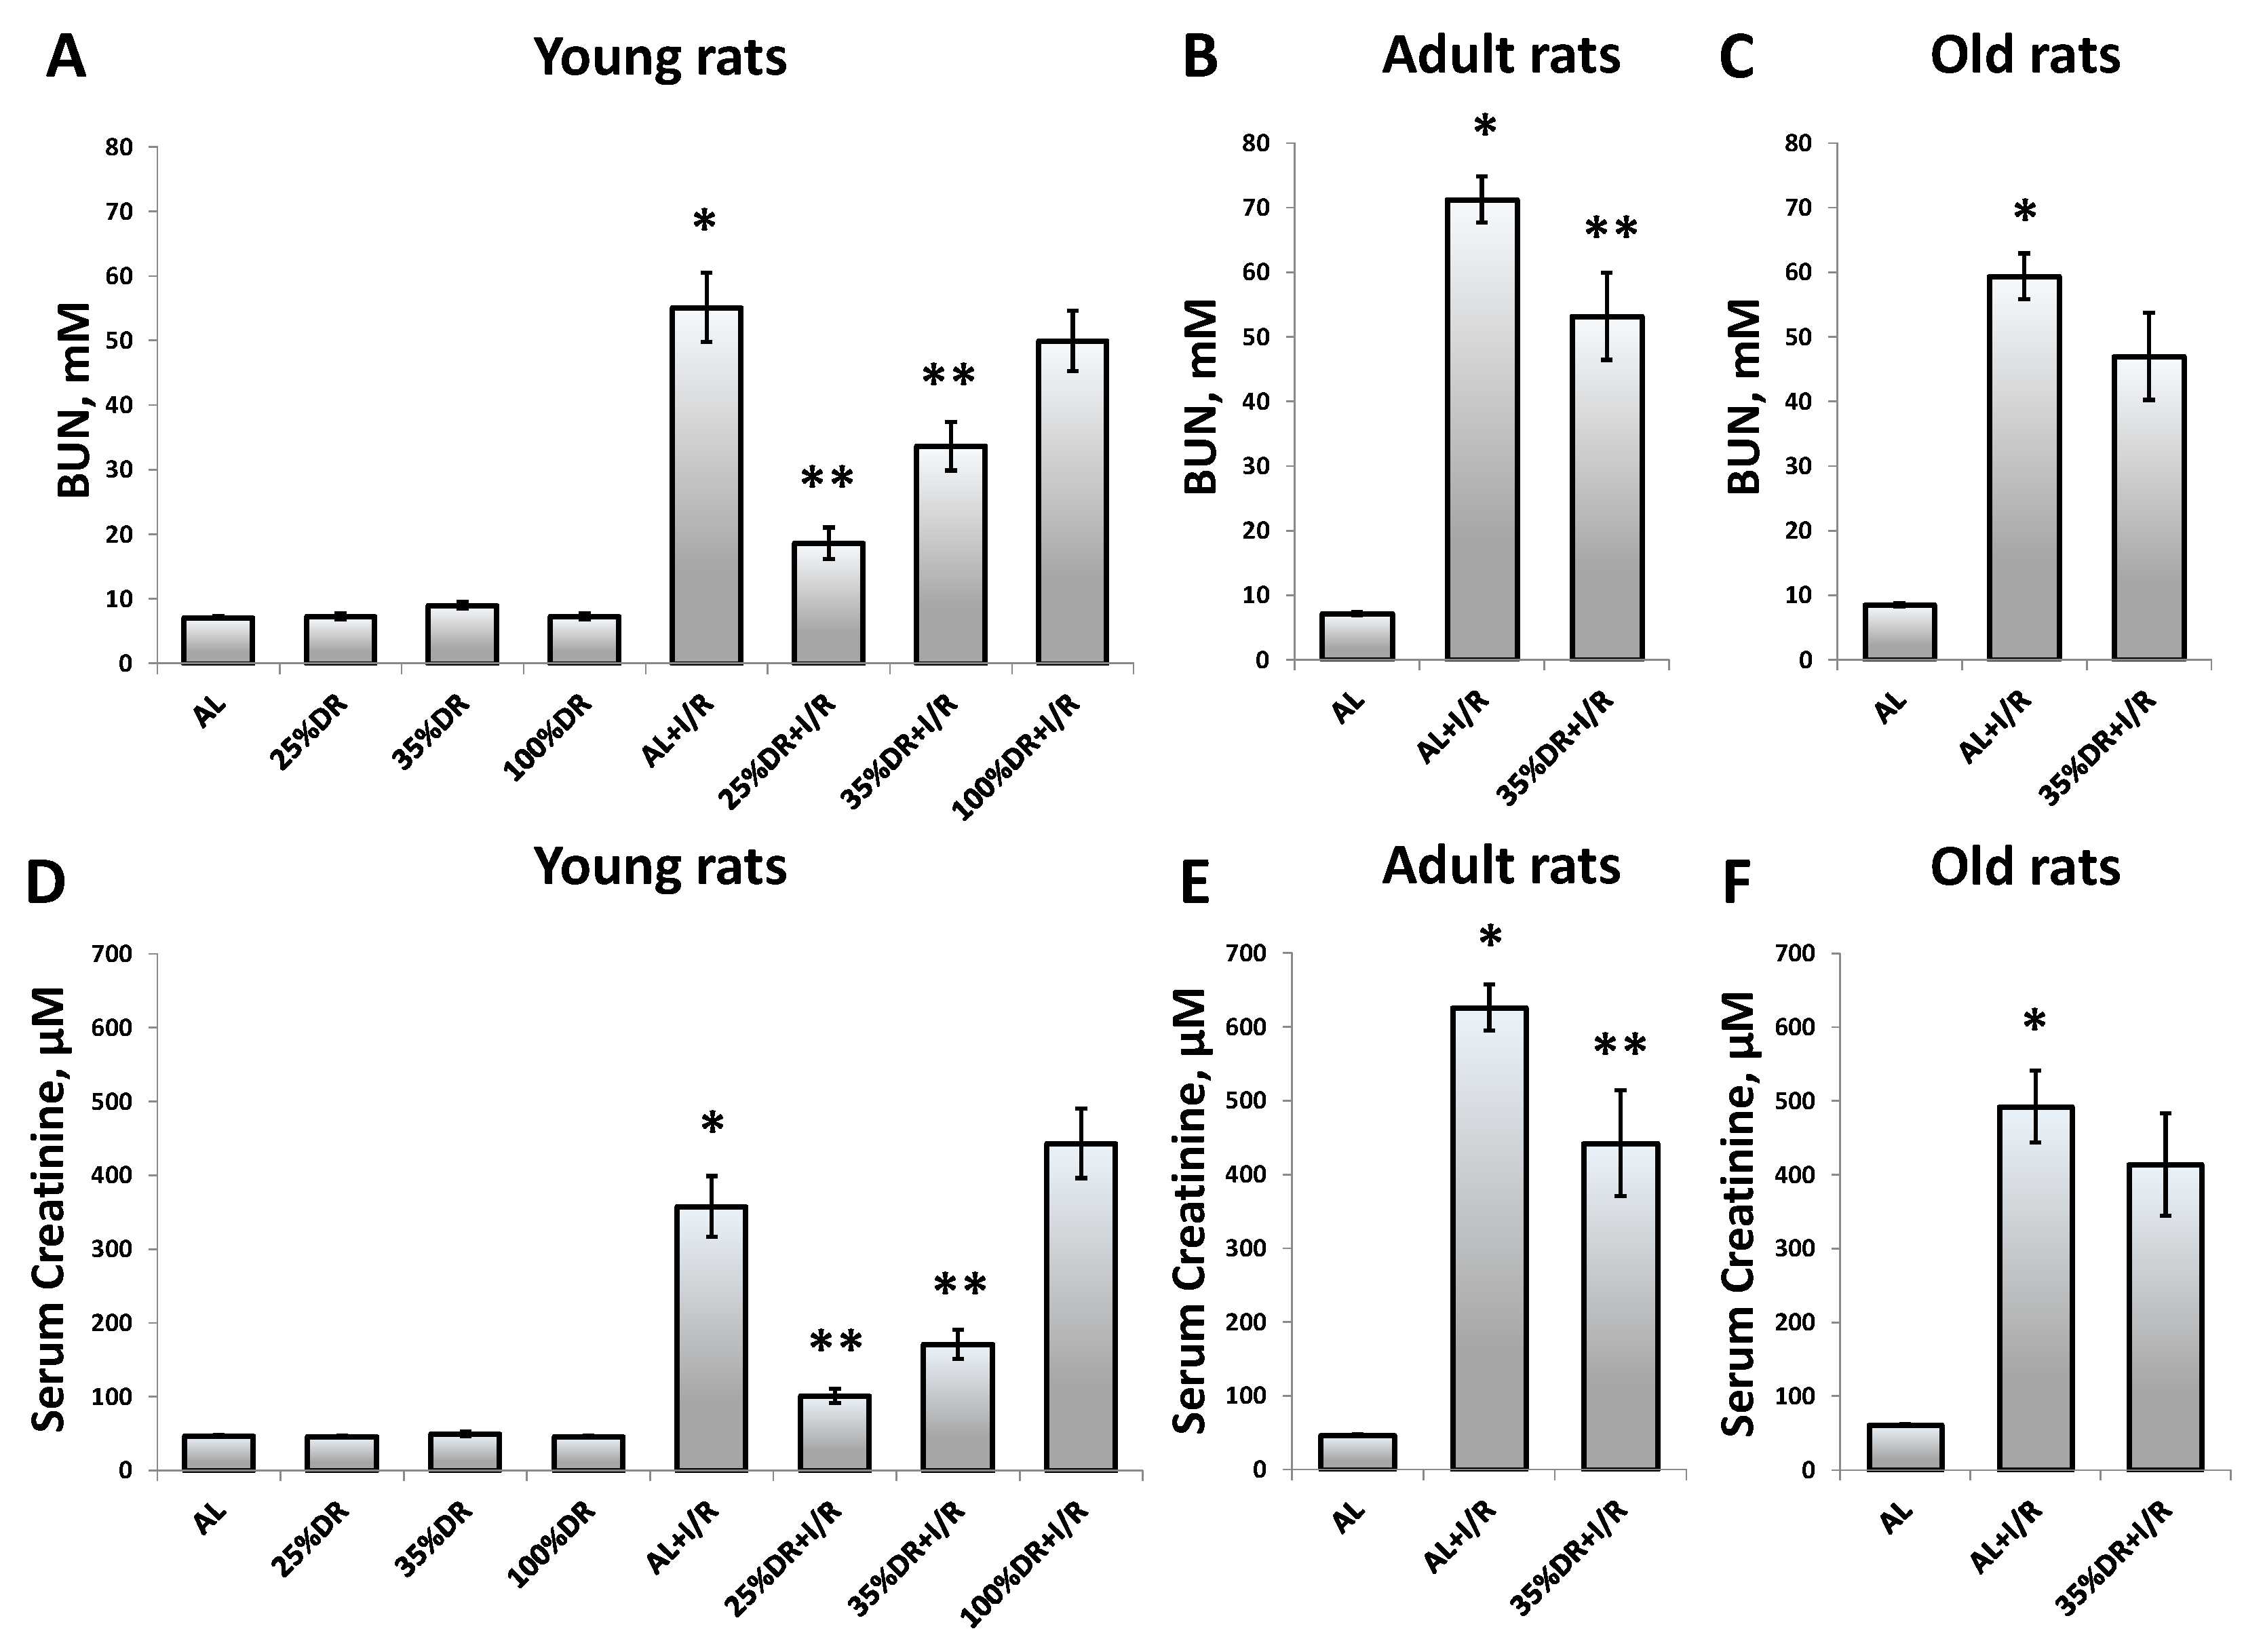
Abstract
:1. Introduction
2. Materials and Methods
2.1. Animals
2.2. Dietary Protocol
2.3. Kidney I/R Protocol
2.4. Western Blotting
2.5. Lysosomes Imaging
2.6. Primary Culture of Renal Tubular Cells (RTCs)
2.7. Non-Cultured Renal Tubular Cells (NC-RTCs) from the Kidneys of Young and Old Rats
2.8. Flow Cytometry
2.9. Real-Time Cell Proliferation Monitoring
2.10. Lipofuscin Detection
2.11. Statistics
3. Results
3.1. Effect of DR on the Severity of AKI in Young and Old Rats
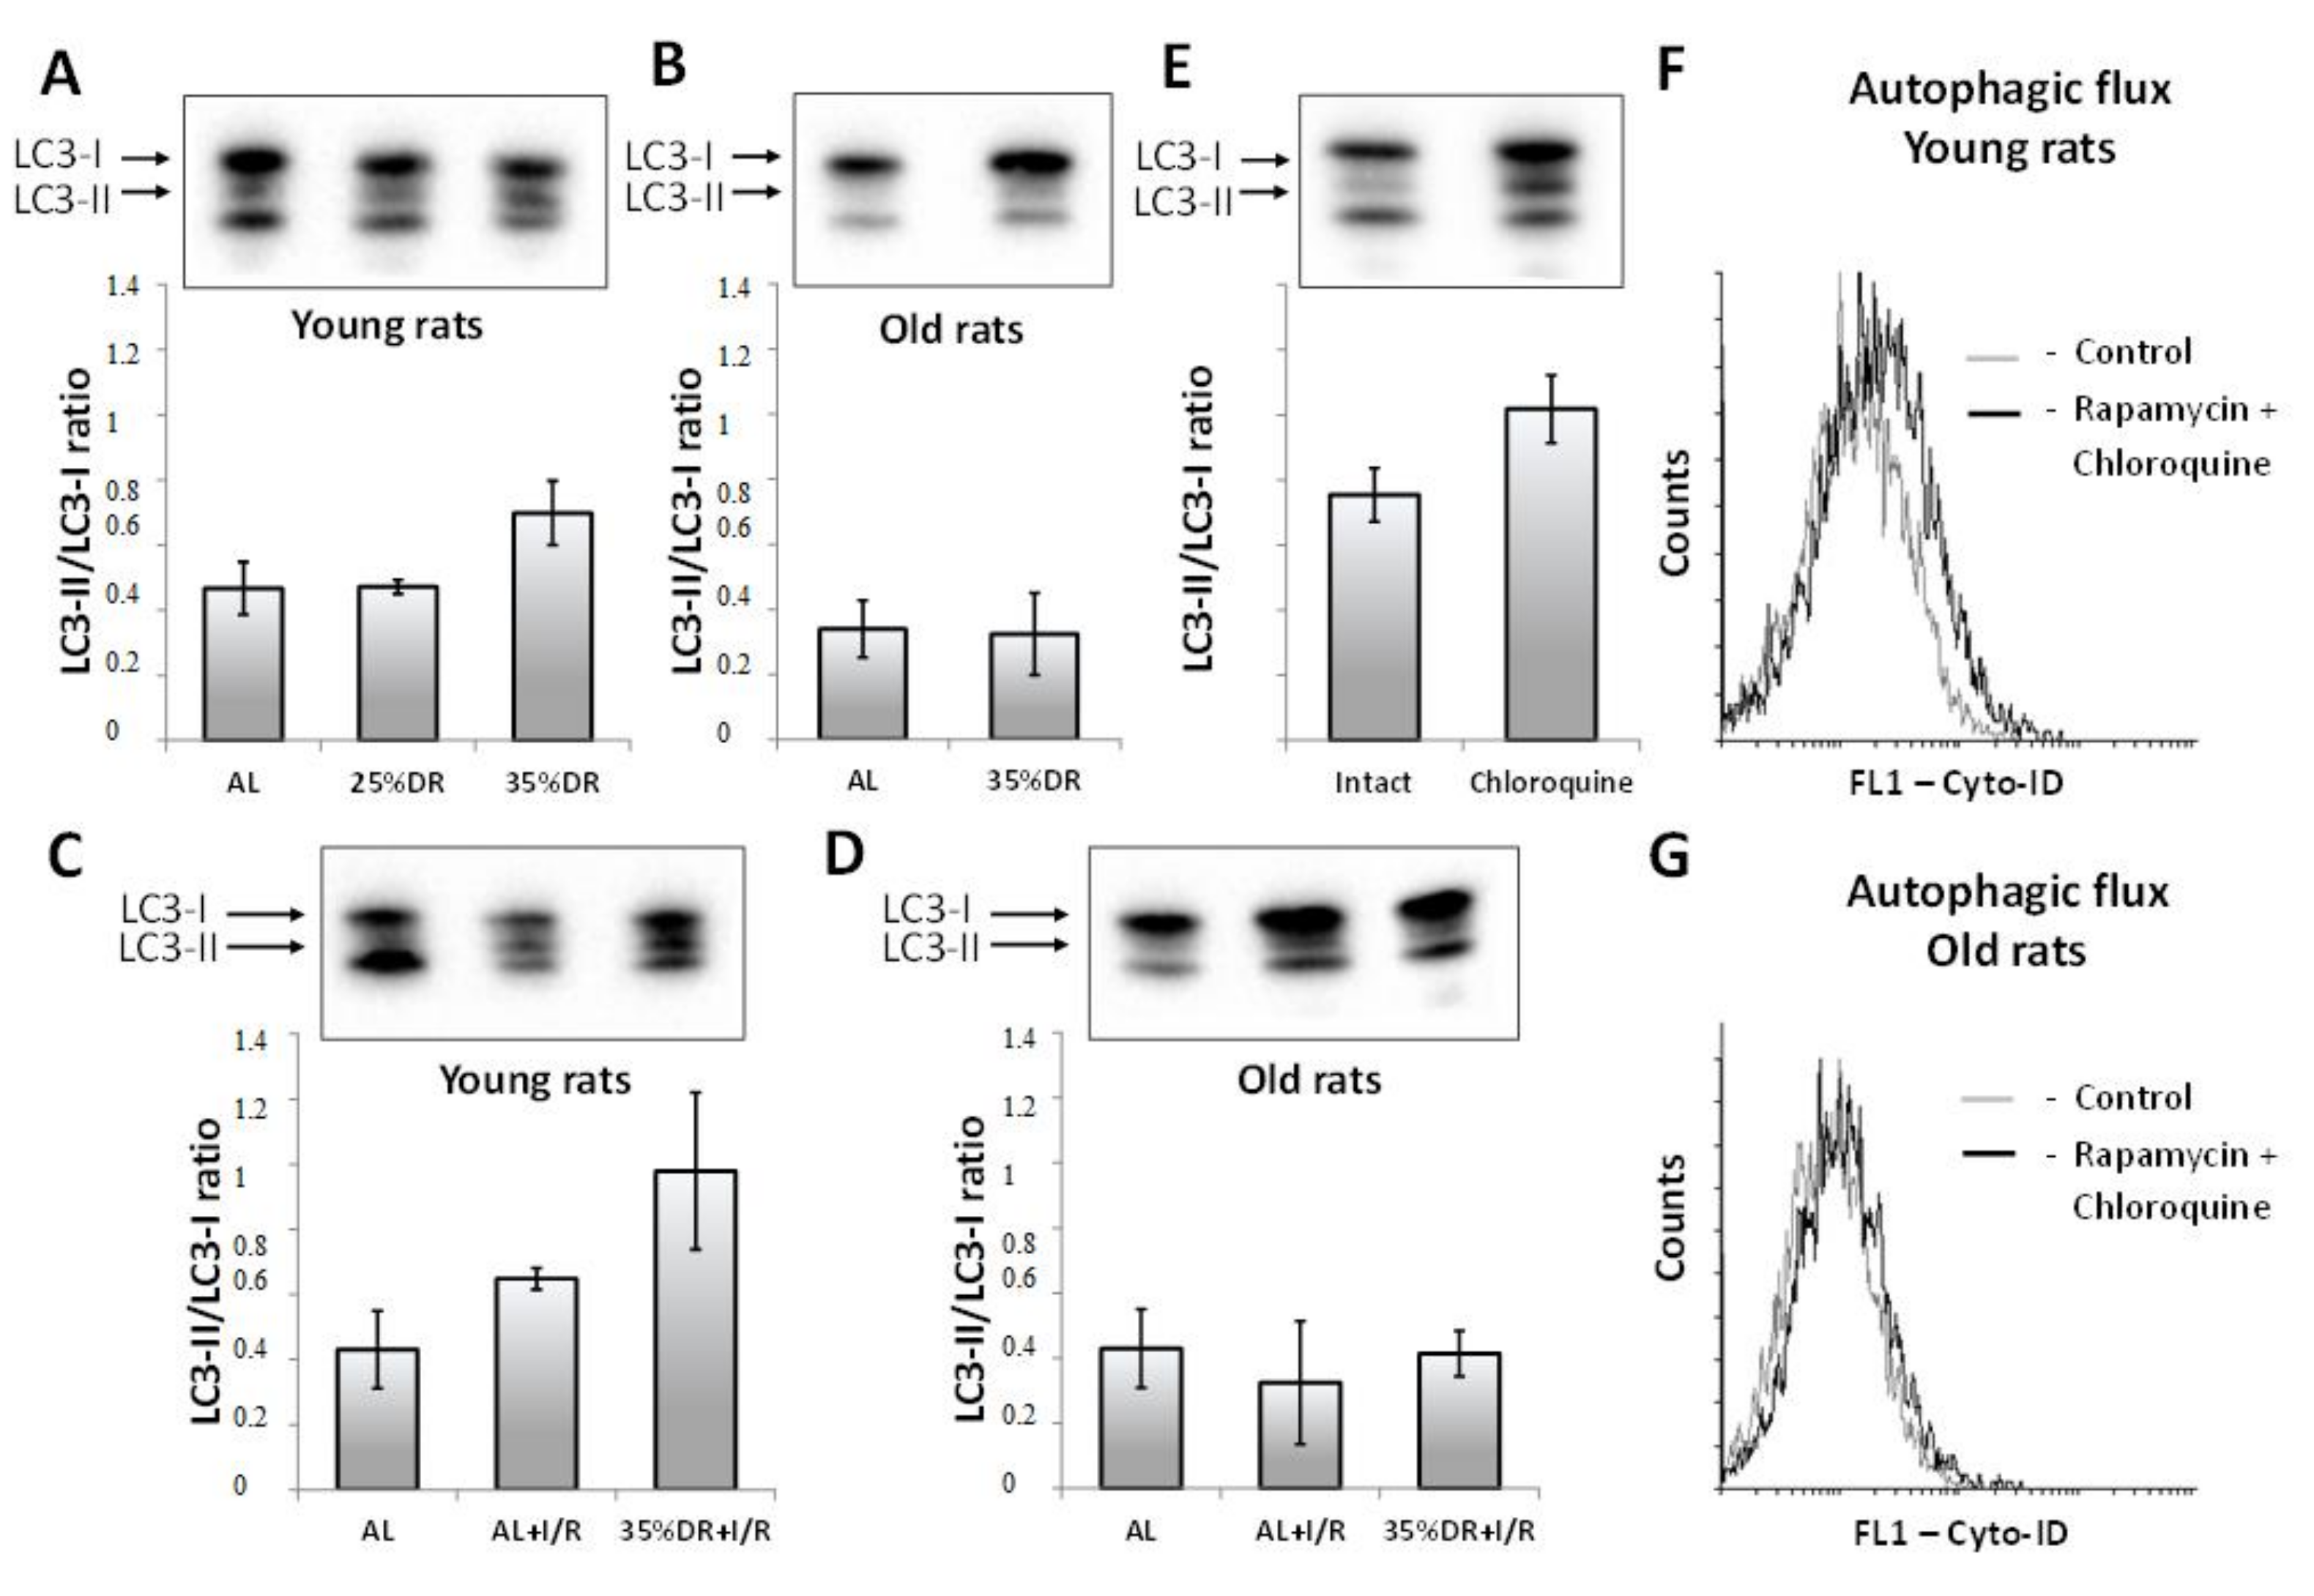
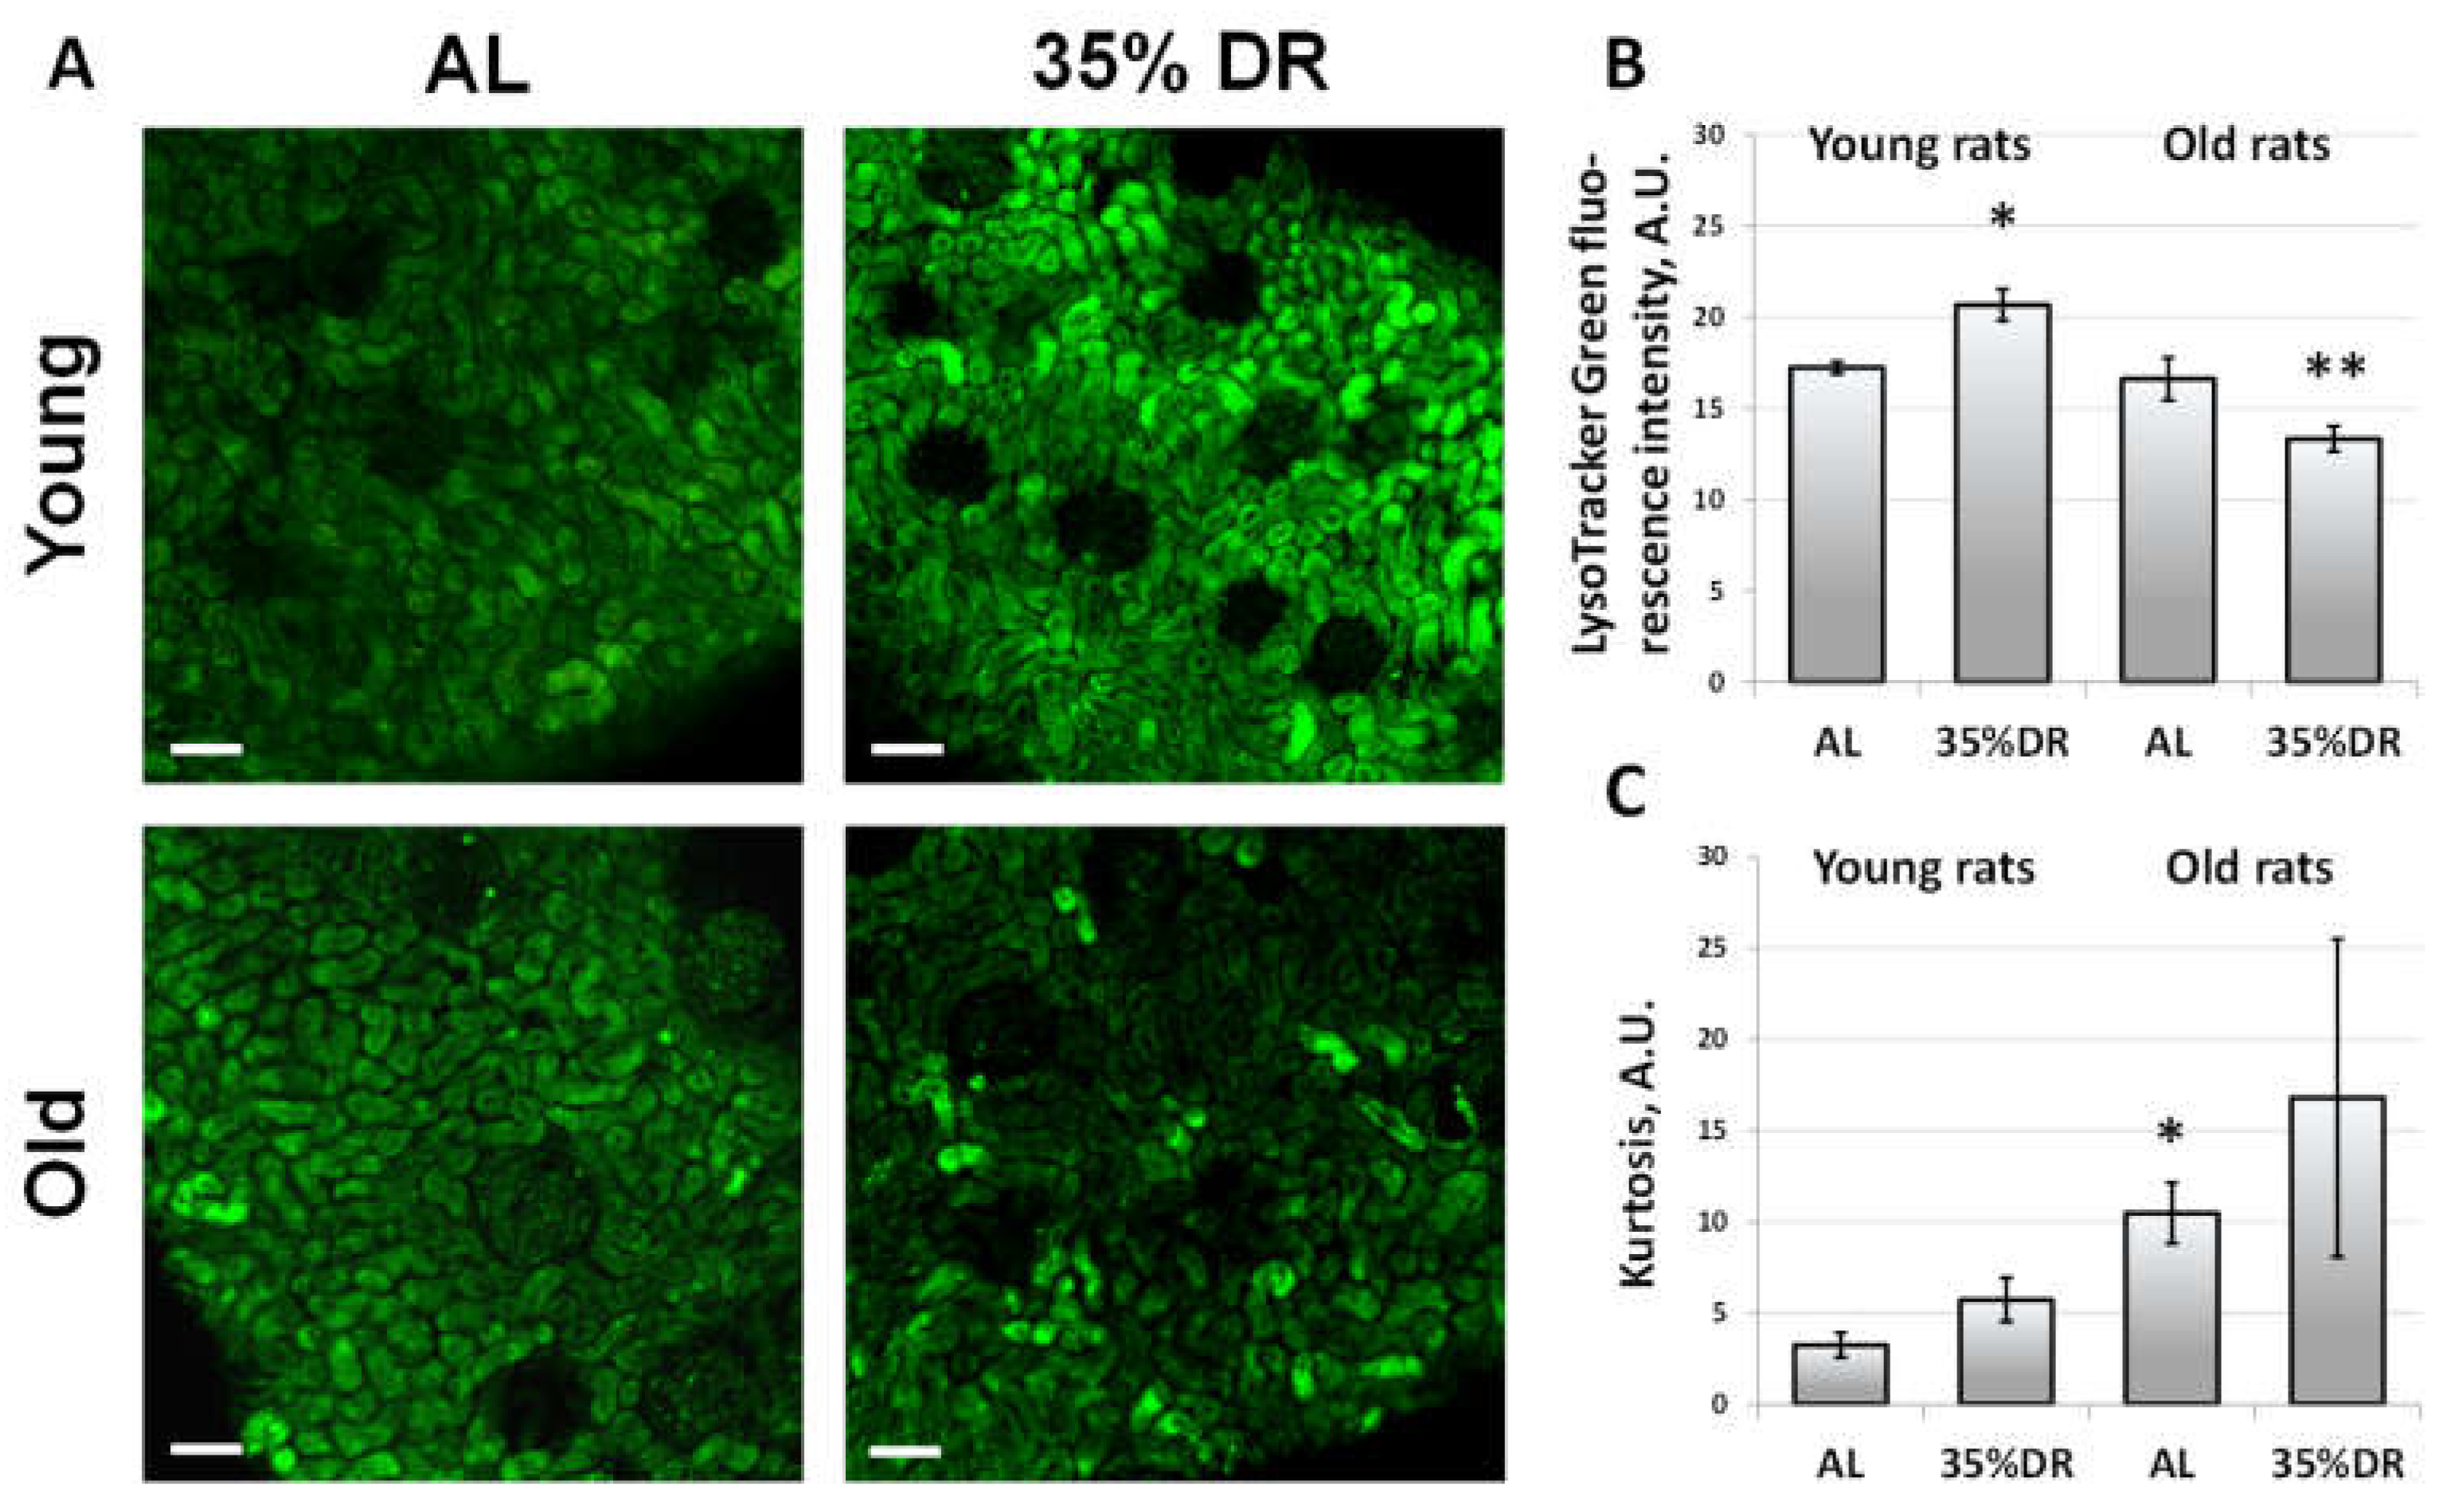
3.2. Autophagy in Renal Tissue of Young and Old Rats
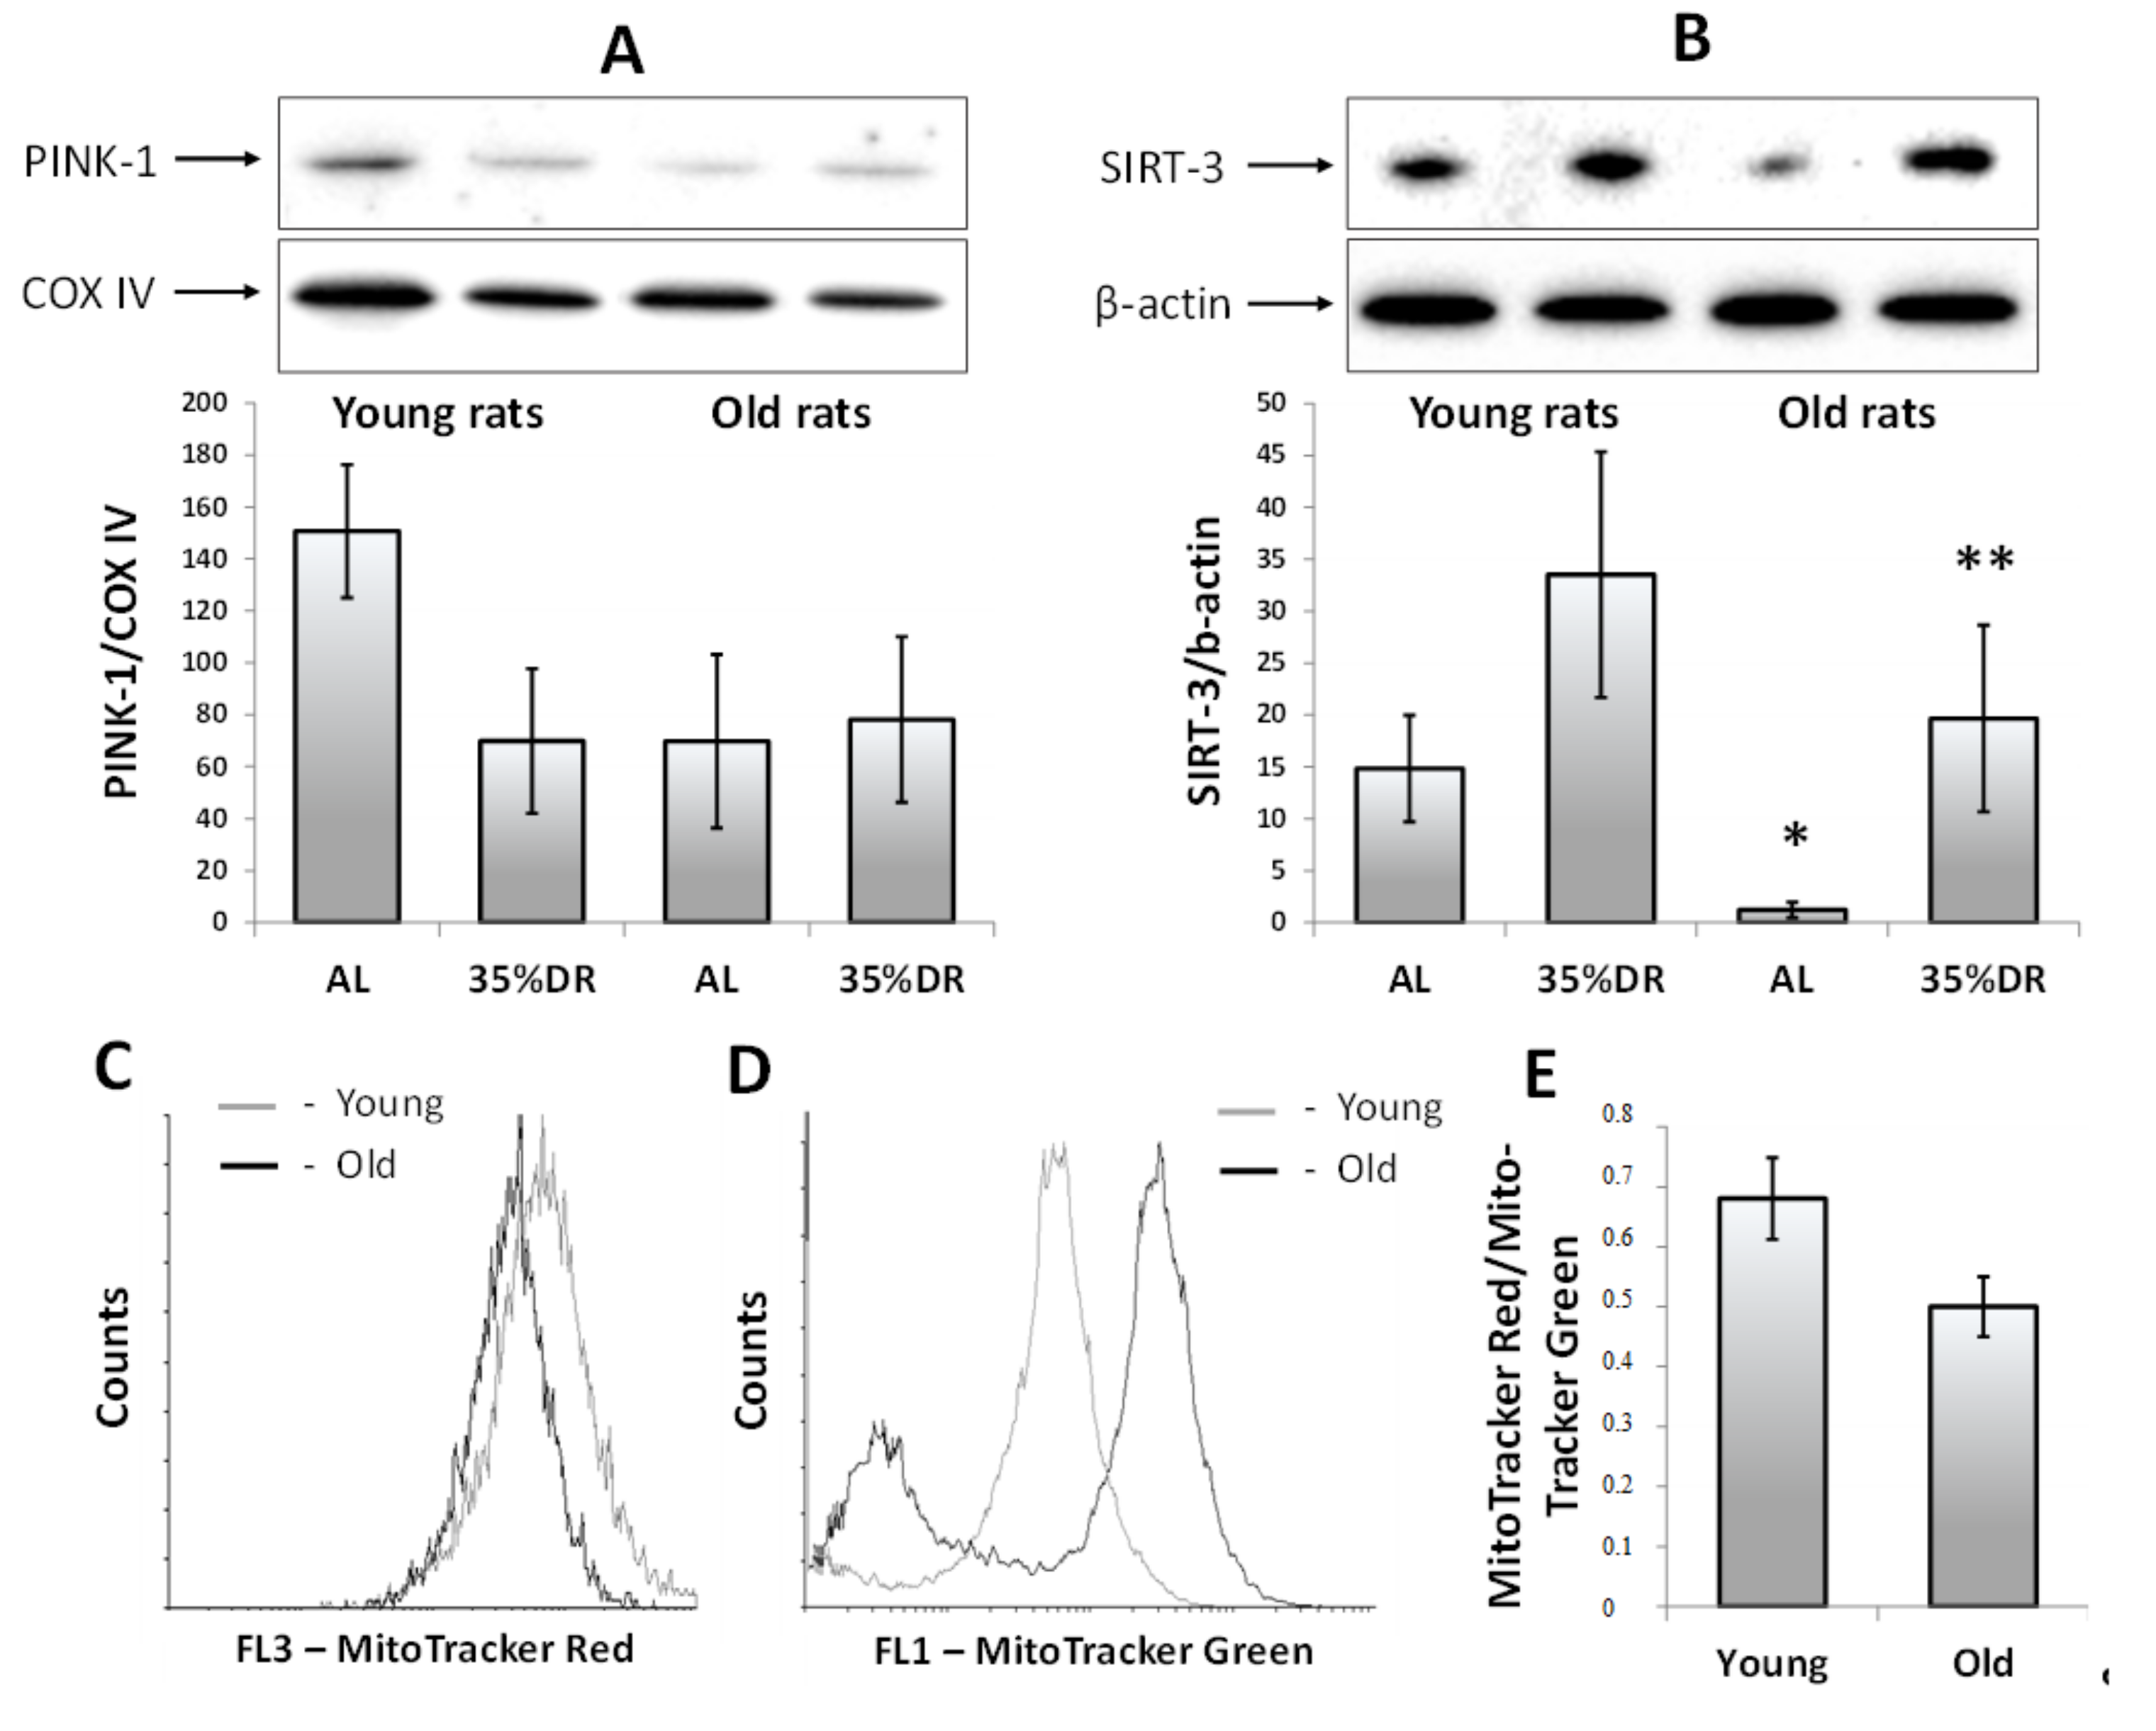
3.3. Deterioration of Mitophagy and Mitochondrial Functions in the Kidneys of Old Rats
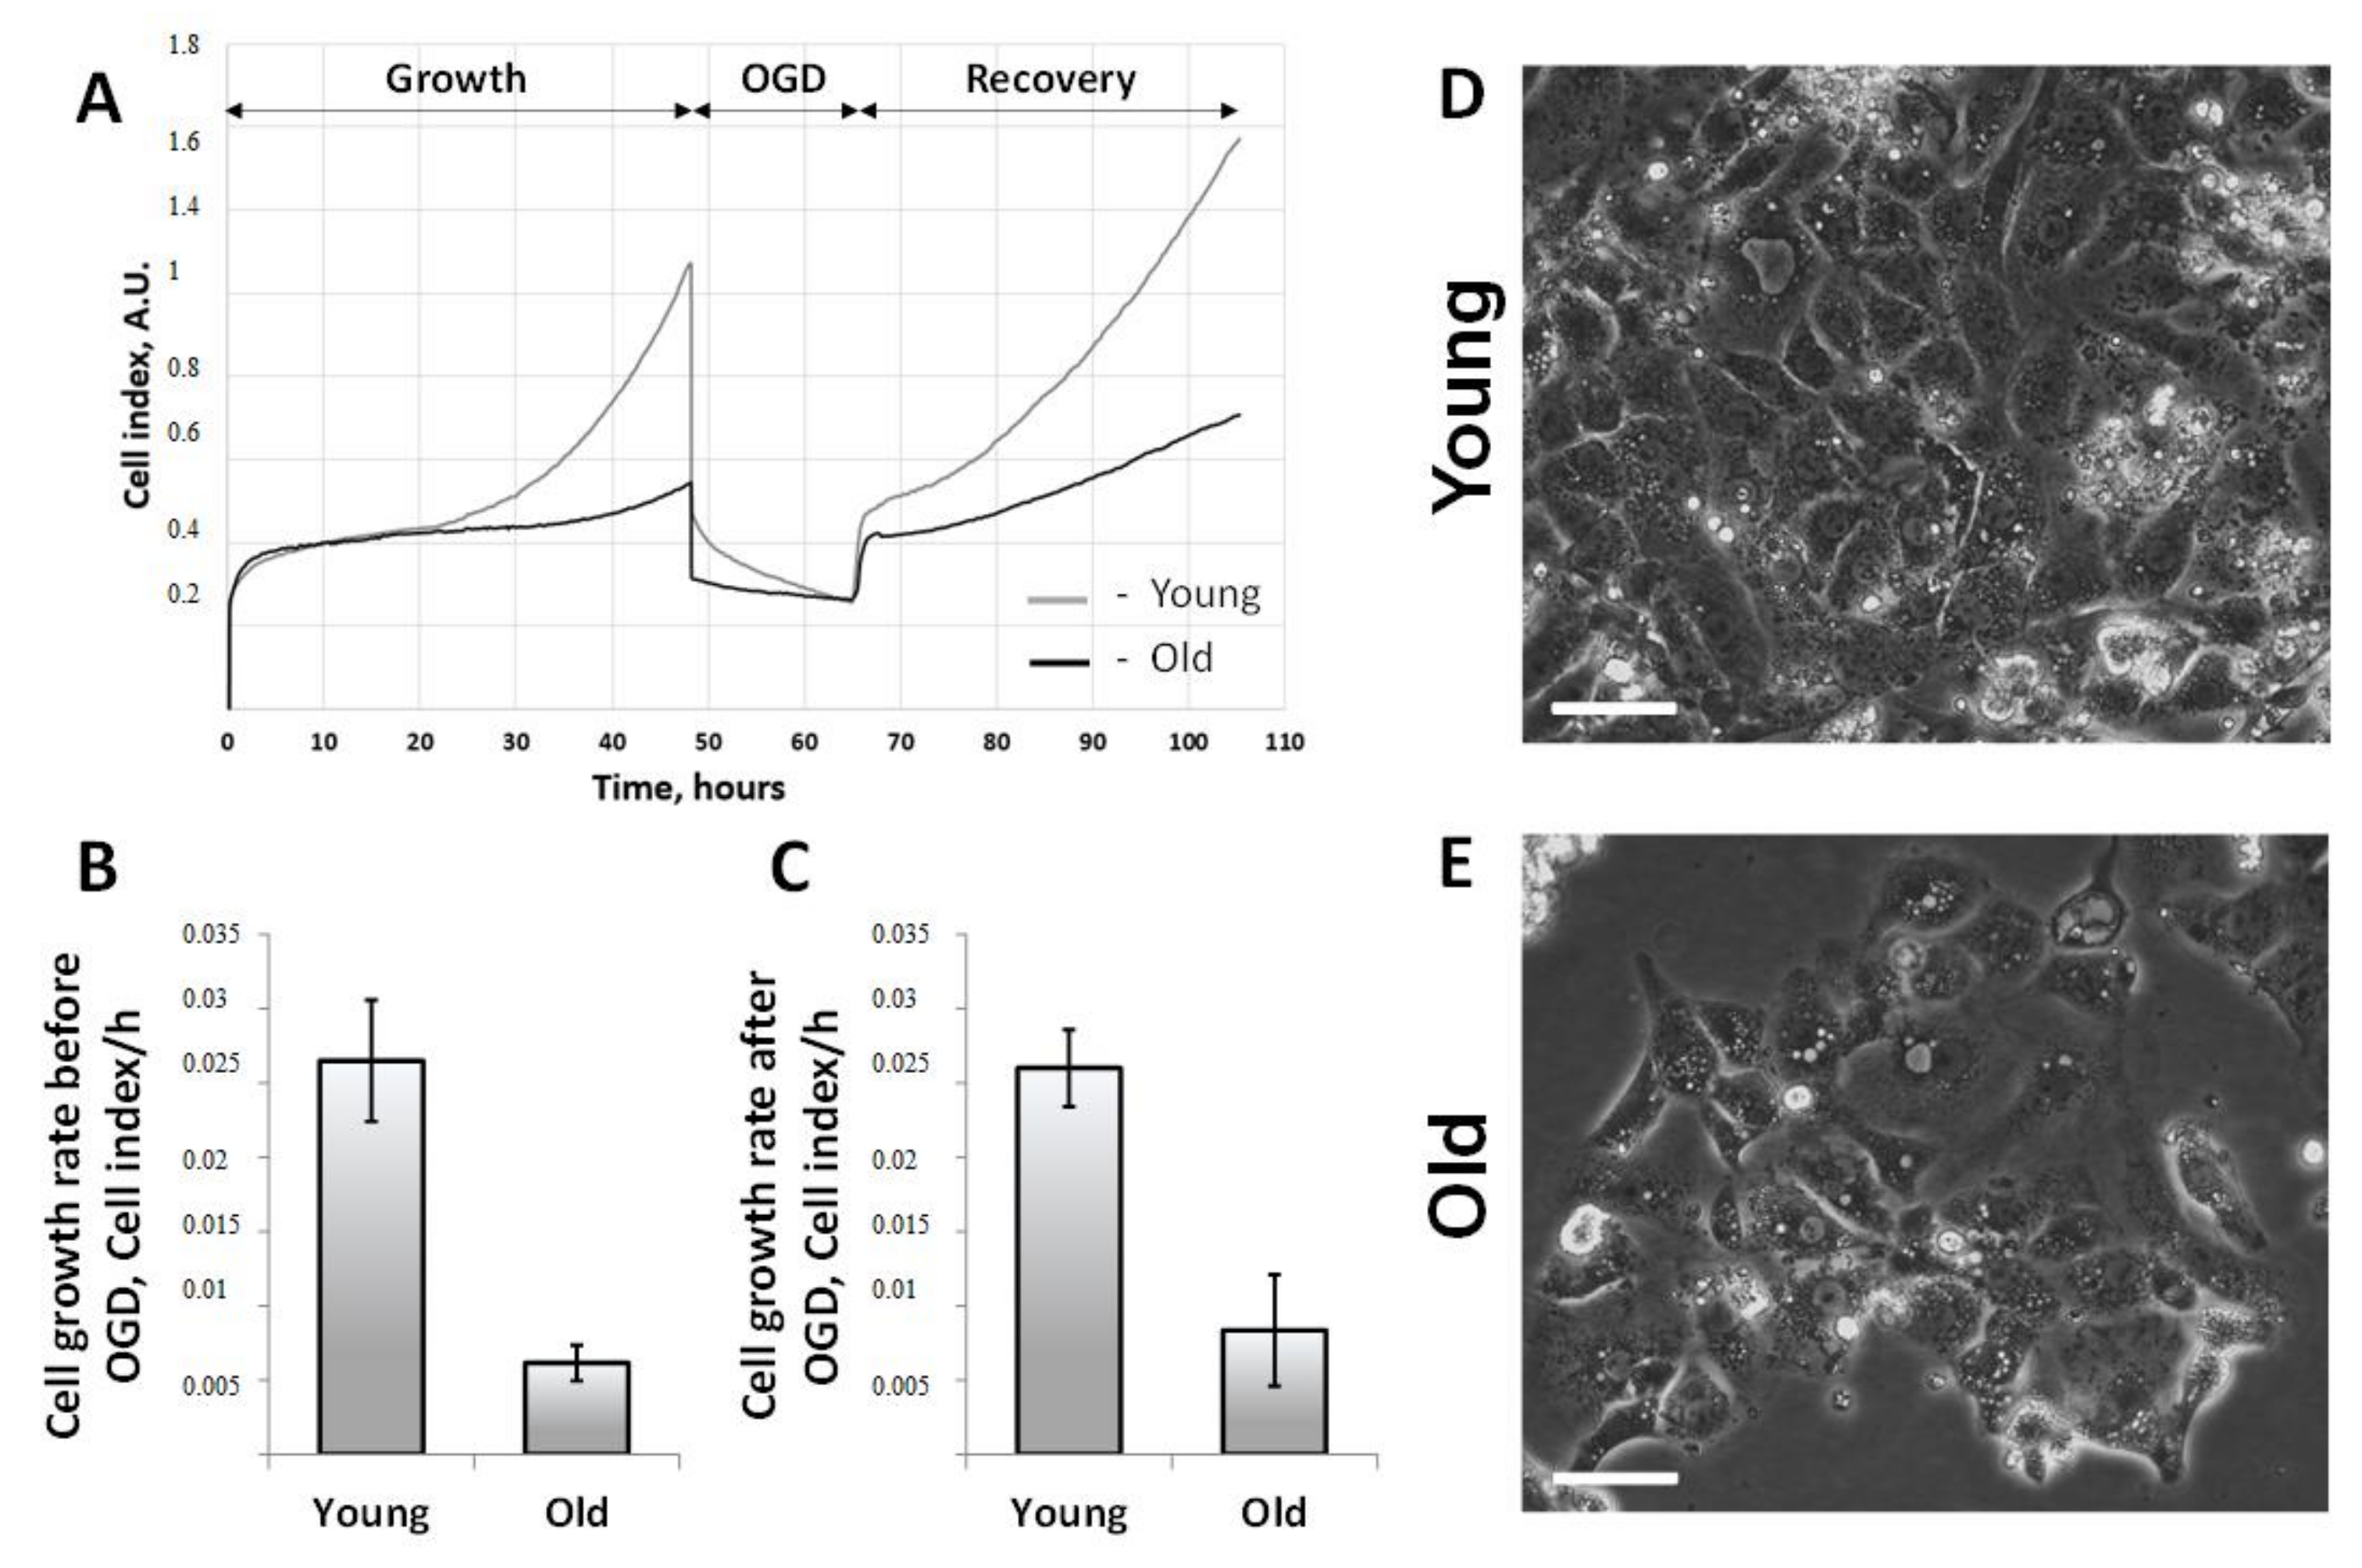
3.4. Proliferative Capacity of Primary Cultures of RTCs Obtained from Young and Old Rats
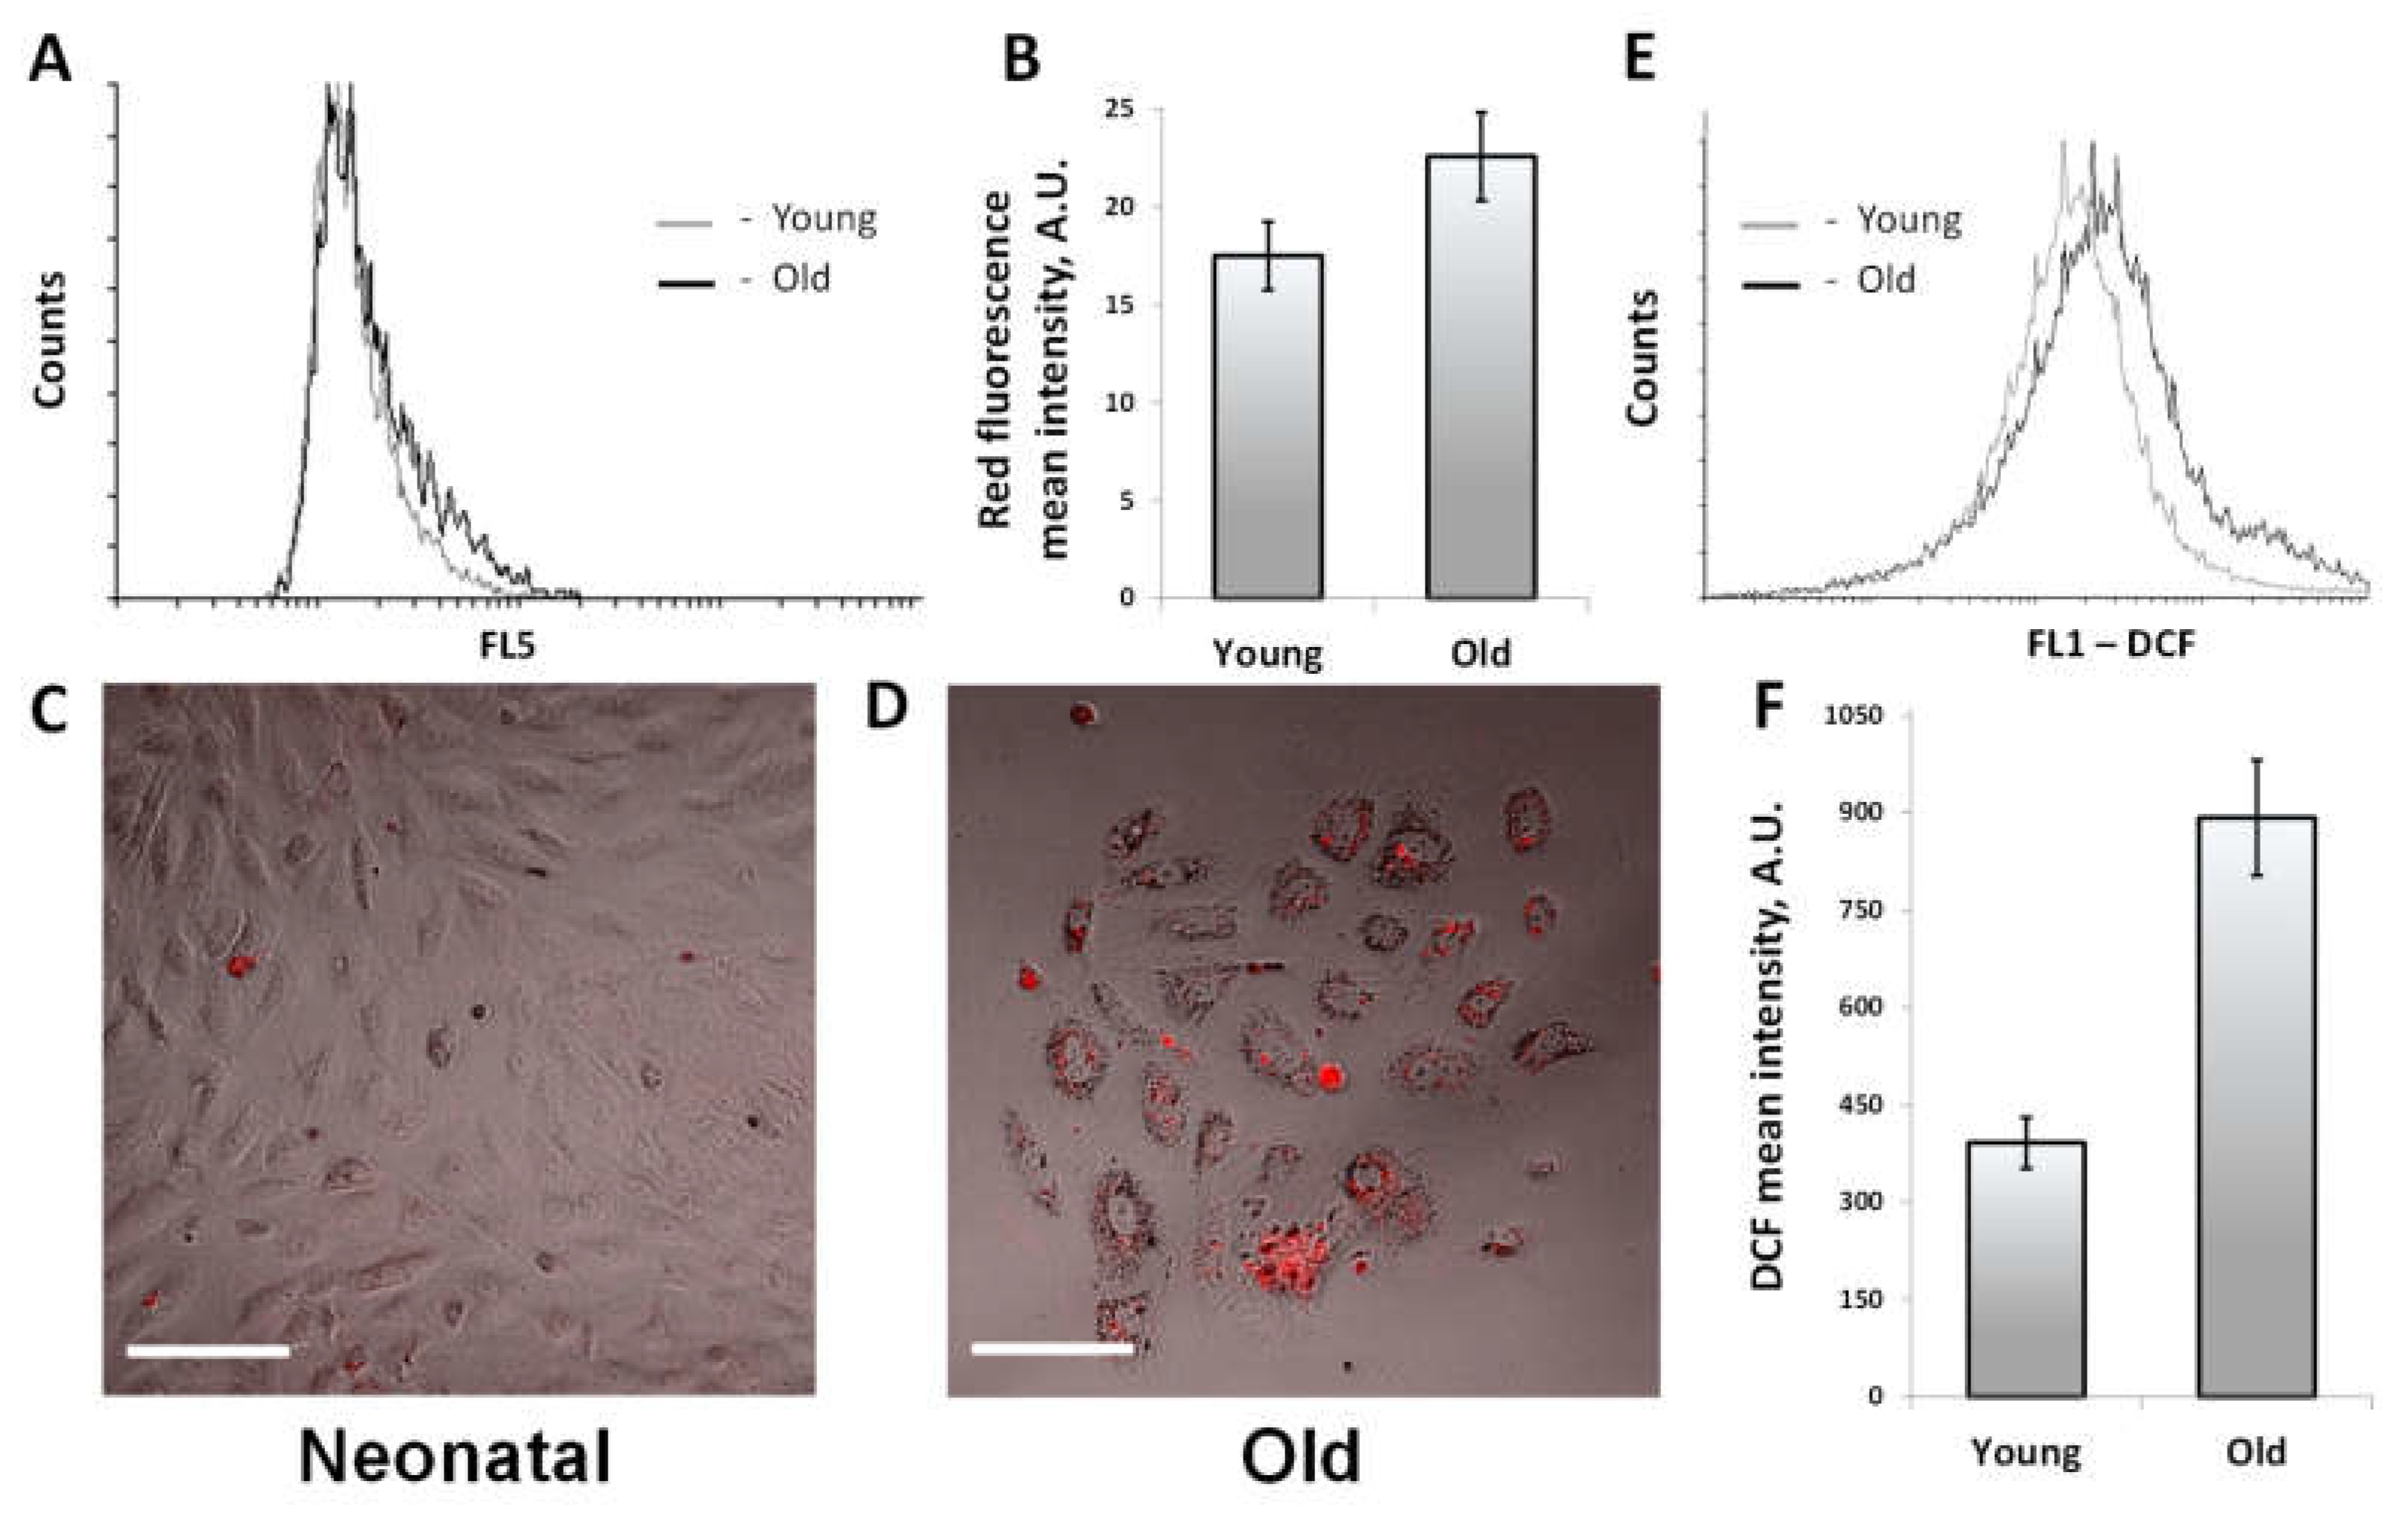
3.5. Oxidative Stress and the Accumulation of Lipofuscin
4. Discussion
5. Conclusions
Author Contributions
Funding
Conflicts of Interest
References
- Speakman, J.R.; Mitchell, S.E. Caloric restriction. Mol. Asp. Med. 2011, 32, 159–221. [Google Scholar] [CrossRef] [PubMed]
- Shinmura, K.; Tamaki, K.; Sano, M.; Murata, M.; Yamakawa, H.; Ishida, H.; Fukuda, K. Impact of long-term caloric restriction on cardiac senescence: Caloric restriction ameliorates cardiac diastolic dysfunction associated with aging. J. Mol. Cell. Cardiol. 2011, 50, 117–127. [Google Scholar] [CrossRef] [PubMed]
- Van Cauwenberghe, C.; Vandendriessche, C.; Libert, C.; Vandenbroucke, R.E. Caloric restriction: Beneficial effects on brain aging and Alzheimer’s disease. Mamm. Genome 2016, 27, 300–319. [Google Scholar] [CrossRef] [PubMed]
- Jové, M.; Naudí, A.; Ramírez-Núñez, O.; Portero-Otín, M.; Selman, C.; Withers, D.J.; Pamplona, R. Caloric restriction reveals a metabolomic and lipidomic signature in liver of male mice. Aging Cell 2014, 13, 828–837. [Google Scholar] [CrossRef] [PubMed] [Green Version]
- Wiggins, J.E.; Goyal, M.; Sanden, S.K.; Wharram, B.L.; Shedden, K.A.; Misek, D.E.; Kuick, R.D.; Wiggins, R.C. Podocyte hypertrophy, “adaptation,” and “decompensation” associated with glomerular enlargement and glomerulosclerosis in the aging rat: Prevention by calorie restriction. J. Am. Soc. Nephrol. 2005, 16, 2953–2966. [Google Scholar] [CrossRef] [PubMed]
- Rohrbach, S.; Aslam, M.; Niemann, B.; Schulz, R. Impact of caloric restriction on myocardial ischaemia/reperfusion injury and new therapeutic options to mimic its effects. Br. J. Pharmacol. 2014, 171, 2964–2992. [Google Scholar] [CrossRef] [PubMed] [Green Version]
- Fusco, S.; Pani, G. Brain response to calorie restriction. Cell. Mol. Life Sci. 2013, 70, 3157–3170. [Google Scholar] [CrossRef] [PubMed]
- Han, X.; Ren, J. Caloric restriction and heart function: Is there a sensible link? Acta Pharmacol. Sin. 2010, 31, 1111–1117. [Google Scholar] [CrossRef] [PubMed]
- Sathananthan, M.; Shah, M.; Edens, K.L.; Grothe, K.B.; Piccinini, F.; Farrugia, L.P.; Micheletto, F.; Man, C.D.; Cobelli, C.; Rizza, R.A.; et al. Six and 12 Weeks of Caloric Restriction Increases β Cell Function and Lowers Fasting and Postprandial Glucose Concentrations in People with Type 2 Diabetes. J. Nutr. 2015, 145, 2046–2051. [Google Scholar] [CrossRef] [PubMed] [Green Version]
- Ravussin, E.; Redman, L.M.; Rochon, J.; Das, S.K.; Fontana, L.; Kraus, W.E.; Romashkan, S.; Williamson, D.A.; Meydani, S.N.; Villareal, D.T.; et al. A 2-Year Randomized Controlled Trial of Human Caloric Restriction: Feasibility and Effects on Predictors of Health Span and Longevity. J. Gerontol. Ser. A Biol. Sci. Med. Sci. 2015, 70, 1097–1104. [Google Scholar] [CrossRef] [PubMed] [Green Version]
- Picca, A.; Pesce, V.; Lezza, A. Does eating less make you live longer and better? An update on calorie restriction. Clin. Interv. Aging 2017, 12, 1887–1902. [Google Scholar] [CrossRef] [PubMed]
- Lee, S.-H.; Min, K.-J. Caloric restriction and its mimetics. BMB Rep. 2013, 46, 181–187. [Google Scholar] [CrossRef] [PubMed] [Green Version]
- Cuervo, A.M. Autophagy and aging: Keeping that old broom working. Trends Genet. 2008, 24, 604–612. [Google Scholar] [CrossRef] [PubMed]
- Masoro, E.J. Overview of caloric restriction and ageing. Mech. Ageing Dev. 2005, 126, 913–922. [Google Scholar] [CrossRef] [PubMed]
- Ning, Y.-C.; Cai, G.-Y.; Zhuo, L.; Gao, J.-J.; Dong, D.; Cui, S.-Y.; Shi, S.-Z.; Feng, Z.; Zhang, L.; Sun, X.-F.; et al. Beneficial Effects of Short-Term Calorie Restriction against Cisplatin-Induced Acute Renal Injury in Aged Rats. Nephron Exp. Nephrol. 2014, 124, 19–27. [Google Scholar] [CrossRef] [PubMed]
- Estrela, G.R.; Wasinski, F.; Batista, R.O.; Hiyane, M.I.; Felizardo, R.J.F.; Cunha, F.; de Almeida, D.C.; Malheiros, D.M.A.C.; Câmara, N.O.S.; Barros, C.C.; et al. Caloric Restriction Is More Efficient than Physical Exercise to Protect from Cisplatin Nephrotoxicity via PPAR-Alpha Activation. Front. Physiol. 2017, 8, 116. [Google Scholar] [CrossRef] [PubMed]
- Shaikh, Z.A.; Jordan, S.A.; Tang, W. Protection against chronic cadmium toxicity by caloric restriction. Toxicology 1999, 133, 93–103. [Google Scholar] [CrossRef]
- Gumprecht, L.A.; Long, C.Y.R.; Soper, K.A.; Smith, P.F.; Haschek-Hock, W.M.; Keenan, K.P. The Early Effects of Dietary Restriction on the Pathogenesis of Chronic Renal Disease in Sprague-Dawley Rats at 12 Months. Toxicol. Pathol. 1993, 21, 528–537. [Google Scholar] [CrossRef] [PubMed] [Green Version]
- Kume, S.; Koya, D. Autophagy: A Novel Therapeutic Target for Diabetic Nephropathy. Diabetes Metab. J. 2015, 39, 451–460. [Google Scholar] [CrossRef] [PubMed]
- Susantitaphong, P.; Cruz, D.N.; Cerda, J.; Abulfaraj, M.; Alqahtani, F.; Koulouridis, I.; Jaber, B.L. Acute Kidney Injury Advisory Group of the American Society of Nephrology World Incidence of AKI: A Meta-Analysis. Clin. J. Am. Soc. Nephrol. 2013, 8, 1482–1493. [Google Scholar] [CrossRef] [PubMed]
- Xue, J.L.; Daniels, F.; Star, R.A.; Kimmel, P.L.; Eggers, P.W.; Molitoris, B.A.; Himmelfarb, J.; Collins, A.J. Incidence and mortality of acute renal failure in Medicare beneficiaries, 1992 to 2001. J. Am. Soc. Nephrol. 2006, 17, 1135–1142. [Google Scholar] [CrossRef] [PubMed]
- Rosner, M.H. Acute Kidney Injury in the Elderly. Clin. Geriatr. Med. 2013, 29, 565–578. [Google Scholar] [CrossRef] [PubMed]
- Lameire, N.H.; Bagga, A.; Cruz, D.; De Maeseneer, J.; Endre, Z.; Kellum, J.A.; Liu, K.D.; Mehta, R.L.; Pannu, N.; Van Biesen, W.; et al. Acute kidney injury: An increasing global concern. Lancet 2013, 382, 170–179. [Google Scholar] [CrossRef]
- Jankauskas, S.S.; Silachev, D.N.; Andrianova, N.V.; Pevzner, I.B.; Zorova, L.D.; Popkov, V.A.; Plotnikov, E.Y.; Zorov, D.B. Aged kidney: Can we protect it? Autophagy, mitochondria and mechanisms of ischemic preconditioning. Cell Cycle 2018, 17, 1291–1309. [Google Scholar] [CrossRef] [PubMed]
- Jankauskas, S.S.; Pevzner, I.B.; Andrianova, N.V.; Zorova, L.D.; Popkov, V.A.; Silachev, D.N.; Kolosova, N.G.; Plotnikov, E.Y.; Zorov, D.B. The age-associated loss of ischemic preconditioning in the kidney is accompanied by mitochondrial dysfunction, increased protein acetylation and decreased autophagy. Sci. Rep. 2017, 7, 44430. [Google Scholar] [CrossRef] [PubMed] [Green Version]
- Chen, H.; Xing, B.; Wang, L.; Weng, X.; Chen, Z.; Liu, X. Aged kidneys are refractory to ischemic postconditioning in a rat model. Ren. Fail. 2014, 36, 1575–1580. [Google Scholar] [CrossRef] [PubMed] [Green Version]
- Mitchell, J.R.; Verweij, M.; Brand, K.; van de Ven, M.; Goemaere, N.; van den Engel, S.; Chu, T.; Forrer, F.; Müller, C.; de Jong, M.; et al. Short-term dietary restriction and fasting precondition against ischemia reperfusion injury in mice. Aging Cell 2010, 9, 40–53. [Google Scholar] [CrossRef] [PubMed]
- Robertson, L.T.; Trevino-Villarreal, J.H.; Mejia, P.; Grondin, Y.; Harputlugil, E.; Hine, C.; Vargas, D.; Zheng, H.; Ozaki, C.K.; Kristal, B.S.; et al. Protein and Calorie Restriction Contribute Additively to Protection from Renal Ischemia Reperfusion Injury Partly via Leptin Reduction in Male Mice. J. Nutr. 2015, 145, 1717–1727. [Google Scholar] [CrossRef] [PubMed] [Green Version]
- Jongbloed, F.; Saat, T.C.; Verweij, M.; Payan-Gomez, C.; Hoeijmakers, J.H.J.; van den Engel, S.; van Oostrom, C.T.; Ambagtsheer, G.; Imholz, S.; Pennings, J.L.A.; et al. A signature of renal stress resistance induced by short-term dietary restriction, fasting, and protein restriction. Sci. Rep. 2017, 7, 40901. [Google Scholar] [CrossRef] [PubMed]
- Plotnikov, E.Y.; Kazachenko, A.V.; Vyssokikh, M.Y.; Vasileva, A.K.; Tcvirkun, D.V.; Isaev, N.K.; Kirpatovsky, V.I.; Zorov, D.B. The role of mitochondria in oxidative and nitrosative stress during ischemia/reperfusion in the rat kidney. Kidney Int. 2007, 72, 1493–1502. [Google Scholar] [CrossRef] [PubMed]
- Giaever, I.; Keese, C.R. Monitoring fibroblast behavior in tissue culture with an applied electric field. Proc. Natl. Acad. Sci. USA 1984, 81, 3761–3764. [Google Scholar] [CrossRef] [PubMed]
- Popkov, V.A.; Andrianova, N.V.; Manskikh, V.N.; Silachev, D.N.; Pevzner, I.B.; Zorova, L.D.; Sukhikh, G.T.; Plotnikov, E.Y.; Zorov, D.B. Pregnancy protects the kidney from acute ischemic injury. Sci. Rep. 2018, 8, 14534. [Google Scholar] [CrossRef] [PubMed]
- Robertson, L.T.; Mitchell, J.R. Benefits of short-term dietary restriction in mammals. Exp. Gerontol. 2013, 48, 1043–1048. [Google Scholar] [CrossRef] [PubMed] [Green Version]
- Kaushal, G.P.; Shah, S.V. Autophagy in acute kidney injury. Kidney Int. 2016, 89, 779–791. [Google Scholar] [CrossRef] [PubMed] [Green Version]
- Stankov, M.; Panayotova-Dimitrova, D.; Leverkus, M.; Klusmann, J.-H.; Behrens, G. Flow Cytometric Analysis of Autophagic Activity with Cyto-ID Staining in Primary Cells. Bio-Protocol 2014, 4. [Google Scholar] [CrossRef]
- Vives-Bauza, C.; Zhou, C.; Huang, Y.; Cui, M.; de Vries, R.L.A.; Kim, J.; May, J.; Tocilescu, M.A.; Liu, W.; Ko, H.S.; et al. PINK1-dependent recruitment of Parkin to mitochondria in mitophagy. Proc. Natl. Acad. Sci. USA 2010, 107, 378–383. [Google Scholar] [CrossRef] [PubMed]
- Melk, A.; Schmidt, B.M.W.; Takeuchi, O.; Sawitzki, B.; Rayner, D.C.; Halloran, P.F. Expression of p16INK4a and other cell cycle regulator and senescence associated genes in aging human kidney. Kidney Int. 2004, 65, 510–520. [Google Scholar] [CrossRef] [PubMed]
- Yamamoto, T.; Takabatake, Y.; Kimura, T.; Takahashi, A.; Namba, T.; Matsuda, J.; Minami, S.; Kaimori, J.; Matsui, I.; Kitamura, H.; et al. Time-dependent dysregulation of autophagy: Implications in aging and mitochondrial homeostasis in the kidney proximal tubule. Autophagy 2016, 12, 801–813. [Google Scholar] [CrossRef] [PubMed]
- Abete, P.; Testa, G.; Ferrara, N.; De Santis, D.; Capaccio, P.; Viati, L.; Calabrese, C.; Cacciatore, F.; Longobardi, G.; Condorelli, M.; et al. Cardioprotective effect of ischemic preconditioning is preserved in food-restricted senescent rats. Am. J. Physiol. Heart Circ. Physiol. 2002, 282, H1978–H1987. [Google Scholar] [CrossRef] [PubMed]
- Boengler, K.; Buechert, A.; Heinen, Y.; Roeskes, C.; Hilfiker-Kleiner, D.; Heusch, G.; Schulz, R. Cardioprotection by Ischemic Postconditioning Is Lost in Aged and STAT3-Deficient Mice. Circ. Res. 2008, 102, 131–135. [Google Scholar] [CrossRef] [PubMed] [Green Version]
- Rezzani, R.; Stacchiotti, A.; Rodella, L.F. Morphological and biochemical studies on aging and autophagy. Ageing Res. Rev. 2012, 11, 10–31. [Google Scholar] [CrossRef] [PubMed]
- Bolignano, D.; Mattace-Raso, F.; Sijbrands, E.J.G.; Zoccali, C. The aging kidney revisited: A systematic review. Ageing Res. Rev. 2014, 14, 65–80. [Google Scholar] [CrossRef] [PubMed]
- Chen, G.; Bridenbaugh, E.A.; Akintola, A.D.; Catania, J.M.; Vaidya, V.S.; Bonventre, J.V.; Dearman, A.C.; Sampson, H.W.; Zawieja, D.C.; Burghardt, R.C.; et al. Increased susceptibility of aging kidney to ischemic injury: Identification of candidate genes changed during aging, but corrected by caloric restriction. Am. J. Physiol. Ren. Physiol. 2007, 293, F1272–F1281. [Google Scholar] [CrossRef] [PubMed]
- Kume, S.; Uzu, T.; Horiike, K.; Chin-Kanasaki, M.; Isshiki, K.; Araki, S.-I.; Sugimoto, T.; Haneda, M.; Kashiwagi, A.; Koya, D. Calorie restriction enhances cell adaptation to hypoxia through Sirt1-dependent mitochondrial autophagy in mouse aged kidney. J. Clin. Investig. 2010, 120, 1043–1055. [Google Scholar] [CrossRef] [PubMed] [Green Version]
- Ning, Y.-C.; Cai, G.-Y.; Zhuo, L.; Gao, J.-J.; Dong, D.; Cui, S.; Feng, Z.; Shi, S.-Z.; Bai, X.-Y.; Sun, X.-F.; et al. Short-term calorie restriction protects against renal senescence of aged rats by increasing autophagic activity and reducing oxidative damage. Mech. Ageing Dev. 2013, 134, 570–579. [Google Scholar] [CrossRef] [PubMed]
- Hartleben, B.; Gödel, M.; Meyer-Schwesinger, C.; Liu, S.; Ulrich, T.; Köbler, S.; Wiech, T.; Grahammer, F.; Arnold, S.J.; Lindenmeyer, M.T.; et al. Autophagy influences glomerular disease susceptibility and maintains podocyte homeostasis in aging mice. J. Clin. Investig. 2010, 120, 1084–1096. [Google Scholar] [CrossRef] [PubMed] [Green Version]
- Baisantry, A.; Bhayana, S.; Rong, S.; Ermeling, E.; Wrede, C.; Hegermann, J.; Pennekamp, P.; So rensen-Zender, I.; Haller, H.; Melk, A.; et al. Autophagy Induces Prosenescent Changes in Proximal Tubular S3 Segments. J. Am. Soc. Nephrol. 2016, 27, 1609–1616. [Google Scholar] [CrossRef] [PubMed]
- Kimura, T.; Takabatake, Y.; Takahashi, A.; Kaimori, J.; Matsui, I.; Namba, T.; Kitamura, H.; Niimura, F.; Matsusaka, T.; Soga, T.; et al. Autophagy protects the proximal tubule from degeneration and acute ischemic injury. J. Am. Soc. Nephrol. 2011, 22, 902–913. [Google Scholar] [CrossRef] [PubMed]
- Weber, T.A.; Reichert, A.S. Impaired quality control of mitochondria: Aging from a new perspective. Exp. Gerontol. 2010, 45, 503–511. [Google Scholar] [CrossRef] [PubMed] [Green Version]
- Gomez-Cabrera, M.C.; Sanchis-Gomar, F.; Garcia-Valles, R.; Pareja-Galeano, H.; Gambini, J.; Borras, C.; Viña, J. Mitochondria as sources and targets of damage in cellular aging. Clin. Chem. Lab. Med. 2012, 50, 1287–1295. [Google Scholar] [CrossRef] [PubMed]
- Cuervo, A.M.; Bergamini, E.; Brunk, U.T.; Dröge, W.; Ffrench, M.; Terman, A. Autophagy and aging: The importance of maintaining “clean” cells. Autophagy 2005, 1, 131–140. [Google Scholar] [CrossRef] [PubMed]
- Sastre, J.; Pallardó, F.V.; Plá, R.; Pellín, A.; Juan, G.; O’Connor, J.E.; Estrela, J.M.; Miquel, J.; Viña, J. Aging of the liver: Age-associated mitochondrial damage in intact hepatocytes. Hepatology 1996, 24, 1199–1205. [Google Scholar] [CrossRef] [PubMed] [Green Version]
- Cui, J.; Bai, X.-Y.; Shi, S.; Cui, S.; Hong, Q.; Cai, G.; Chen, X. Age-related changes in the function of autophagy in rat kidneys. Age 2012, 34, 329–339. [Google Scholar] [CrossRef] [PubMed]
- Jin, S.M.; Lazarou, M.; Wang, C.; Kane, L.A.; Narendra, D.P.; Youle, R.J. Mitochondrial membrane potential regulates PINK1 import and proteolytic destabilization by PARL. J. Cell Biol. 2010, 191, 933–942. [Google Scholar] [CrossRef] [PubMed] [Green Version]
- Cui, J.; Shi, S.; Sun, X.; Cai, G.; Cui, S.; Hong, Q.; Chen, X.; Bai, X.-Y. Mitochondrial autophagy involving renal injury and aging is modulated by caloric intake in aged rat kidneys. PLoS ONE 2013, 8, e69720. [Google Scholar] [CrossRef] [PubMed]
- Sosulski, M.L.; Gongora, R.; Danchuk, S.; Dong, C.; Luo, F.; Sanchez, C.G. Deregulation of selective autophagy during aging and pulmonary fibrosis: The role of TGFβ1. Aging Cell 2015, 14, 774–783. [Google Scholar] [CrossRef] [PubMed]
- Rogaeva, E.; Johnson, J.; Lang, A.E.; Gulick, C.; Gwinn-Hardy, K.; Kawarai, T.; Sato, C.; Morgan, A.; Werner, J.; Nussbaum, R.; et al. Analysis of the PINK1 gene in a large cohort of cases with Parkinson disease. Arch. Neurol. 2004, 61, 1898–1904. [Google Scholar] [CrossRef] [PubMed]
- Exner, N.; Treske, B.; Paquet, D.; Holmström, K.; Schiesling, C.; Gispert, S.; Carballo-Carbajal, I.; Berg, D.; Hoepken, H.-H.; Gasser, T.; et al. Loss-of-function of human PINK1 results in mitochondrial pathology and can be rescued by parkin. J. Neurosci. 2007, 27, 12413–12418. [Google Scholar] [CrossRef] [PubMed]
- Bueno, M.; Lai, Y.-C.; Romero, Y.; Brands, J.; Croix, C.M.S.; Kamga, C.; Corey, C.; Herazo-Maya, J.D.; Sembrat, J.; Lee, J.S.; et al. PINK1 deficiency impairs mitochondrial homeostasis and promotes lung fibrosis. J. Clin. Investig. 2015, 125, 521–538. [Google Scholar] [CrossRef] [PubMed]
- Chistiakov, D.A.; Sobenin, I.A.; Revin, V.V.; Orekhov, A.N.; Bobryshev, Y.V. Mitochondrial aging and age-related dysfunction of mitochondria. BioMed Res. Int. 2014, 2014, 238463. [Google Scholar] [CrossRef] [PubMed]
- Serviddio, G.; Bellanti, F.; Romano, A.D.; Tamborra, R.; Rollo, T.; Altomare, E.; Vendemiale, G. Bioenergetics in aging: Mitochondrial proton leak in aging rat liver, kidney and heart. Redox Rep. 2007, 12, 91–95. [Google Scholar] [CrossRef] [PubMed]
- Hagen, T.M.; Yowe, D.L.; Bartholomew, J.C.; Wehr, C.M.; Do, K.L.; Park, J.Y.; Ames, B.N. Mitochondrial decay in hepatocytes from old rats: Membrane potential declines, heterogeneity and oxidants increase. Proc. Natl. Acad. Sci. USA 1997, 94, 3064–3069. [Google Scholar] [CrossRef] [PubMed] [Green Version]
- Popkov, V.A.; Plotnikov, E.Y.; Lyamzaev, K.G.; Silachev, D.N.; Zorova, L.D.; Pevzner, I.B.; Jankauskas, S.S.; Zorov, S.D.; Babenko, V.A.; Zorov, D.B. Mitodiversity. Biochemistry 2015, 80, 532–541. [Google Scholar] [CrossRef] [PubMed]
- Ahn, B.-H.; Kim, H.-S.; Song, S.; Lee, I.H.; Liu, J.; Vassilopoulos, A.; Deng, C.-X.; Finkel, T. A role for the mitochondrial deacetylase Sirt3 in regulating energy homeostasis. Proc. Natl. Acad. Sci. USA 2008, 105, 14447–14452. [Google Scholar] [CrossRef] [PubMed] [Green Version]
- Guarente, L.; Picard, F. Calorie restriction--the SIR2 connection. Cell 2005, 120, 473–482. [Google Scholar] [CrossRef] [PubMed]
- Lanza, I.R.; Short, D.K.; Short, K.R.; Raghavakaimal, S.; Basu, R.; Joyner, M.J.; McConnell, J.P.; Nair, K.S. Endurance exercise as a countermeasure for aging. Diabetes 2008, 57, 2933–2942. [Google Scholar] [CrossRef] [PubMed]
- Kwon, Y.; Kim, J.; Lee, C.-Y.; Kim, H. Expression of SIRT1 and SIRT3 varies according to age in mice. Anat. Cell Biol. 2015, 48, 54–61. [Google Scholar] [CrossRef] [PubMed]
- Rose, G.; Dato, S.; Altomare, K.; Bellizzi, D.; Garasto, S.; Greco, V.; Passarino, G.; Feraco, E.; Mari, V.; Barbi, C.; et al. Variability of the SIRT3 gene, human silent information regulator Sir2 homologue, and survivorship in the elderly. Exp. Gerontol. 2003, 38, 1065–1070. [Google Scholar] [CrossRef]
- Morigi, M.; Perico, L.; Rota, C.; Longaretti, L.; Conti, S.; Rottoli, D.; Novelli, R.; Remuzzi, G.; Benigni, A. Sirtuin 3-dependent mitochondrial dynamic improvements protect against acute kidney injury. J. Clin. Investig. 2015, 125, 715–726. [Google Scholar] [CrossRef] [PubMed]
- Porter, G.A.; Urciuoli, W.R.; Brookes, P.S.; Nadtochiy, S.M. SIRT3 deficiency exacerbates ischemia-reperfusion injury: Implication for aged hearts. AJP Heart Circ. Physiol. 2014, 306, H1602–H1609. [Google Scholar] [CrossRef] [PubMed]
- Palacios, O.M.; Carmona, J.J.; Michan, S.; Chen, K.Y.; Manabe, Y.; Ward, J.L.W., III; Goodyear, L.J.; Tong, Q. Diet and exercise signals regulate SIRT3 and activate AMPK and PGC-1α in skeletal muscle. Aging 2009, 1, 771–783. [Google Scholar] [CrossRef] [PubMed]
- Zhang, B.; Cui, S.; Bai, X.; Zhuo, L.; Sun, X.; Hong, Q.; Fu, B.; Wang, J.; Chen, X.; Cai, G. SIRT3 overexpression antagonizes high glucose accelerated cellular senescence in human diploid fibroblasts via the SIRT3–FOXO1 signaling pathway. Age 2013, 35, 2237–2253. [Google Scholar] [CrossRef] [PubMed]
- Sundaresan, N.R.; Bindu, S.; Pillai, V.B.; Samant, S.; Pan, Y.; Huang, J.-Y.; Gupta, M.; Nagalingam, R.S.; Wolfgeher, D.; Verdin, E.; et al. SIRT3 Blocks Aging-Associated Tissue Fibrosis in Mice by Deacetylating and Activating Glycogen Synthase Kinase 3β. Mol. Cell. Biol. 2016, 36, 678–692. [Google Scholar] [CrossRef] [PubMed]
- Markel, T.A.; Crisostomo, P.R.; Manukyan, M.C.; Al-Azzawi, D.; Herring, C.M.; Lahm, T.; Novotny, N.M.; Meldrum, D.R. Are Neonatal Stem Cells as Effective as Adult Stem Cells in Providing Ischemic Protection? J. Surg. Res. 2009, 152, 325–330. [Google Scholar] [CrossRef] [PubMed]
- Graham, E.L.; Balla, C.; Franchino, H.; Melman, Y.; del Monte, F.; Das, S. Isolation, Culture, and Functional Characterization of Adult Mouse Cardiomyoctyes. J. Vis. Exp. 2013, e50289. [Google Scholar] [CrossRef] [PubMed]


© 2018 by the authors. Licensee MDPI, Basel, Switzerland. This article is an open access article distributed under the terms and conditions of the Creative Commons Attribution (CC BY) license (http://creativecommons.org/licenses/by/4.0/).
Share and Cite
Andrianova, N.V.; Jankauskas, S.S.; Zorova, L.D.; Pevzner, I.B.; Popkov, V.A.; Silachev, D.N.; Plotnikov, E.Y.; Zorov, D.B. Mechanisms of Age-Dependent Loss of Dietary Restriction Protective Effects in Acute Kidney Injury. Cells 2018, 7, 178. https://doi.org/10.3390/cells7100178
Andrianova NV, Jankauskas SS, Zorova LD, Pevzner IB, Popkov VA, Silachev DN, Plotnikov EY, Zorov DB. Mechanisms of Age-Dependent Loss of Dietary Restriction Protective Effects in Acute Kidney Injury. Cells. 2018; 7(10):178. https://doi.org/10.3390/cells7100178
Chicago/Turabian StyleAndrianova, Nadezda V., Stanislovas S. Jankauskas, Ljubava D. Zorova, Irina B. Pevzner, Vasily A. Popkov, Denis N. Silachev, Egor Y. Plotnikov, and Dmitry B. Zorov. 2018. "Mechanisms of Age-Dependent Loss of Dietary Restriction Protective Effects in Acute Kidney Injury" Cells 7, no. 10: 178. https://doi.org/10.3390/cells7100178