1. Introduction
Kidney transplantation is the treatment of choice for the resolution of chronic kidney disease (CKD) and end-stage kidney disease (ESKD), conferring a significant improvement to the quality of life and an increase in survival rate compared with dialysis [
1] (pp. 2093–2109). As with many other surgeries, several complications can arise because of the transplant procedure, including nephrotoxicity and ischaemia-reperfusion (IR) damage [
2] (pp. 1546–1549). The IR process represents an inevitable event in the early phases of kidney transplantation, and it is associated with the onset of acute kidney injury (AKI), delayed graft function (DGF), along with an increased risk of graft rejection. This process is linked to the impairment of tubular-cell morphology and functionality, along with alterations in the cytokine microenvironment and in tissue homeostasis [
3] (p. 1412).
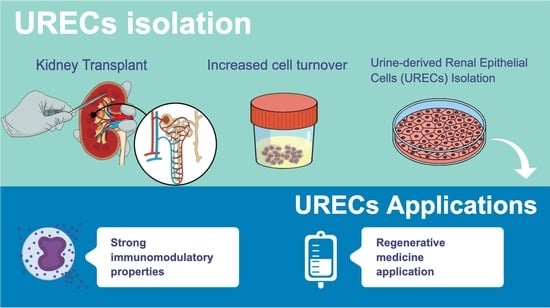
These events result in an increased cell turnover within nephron structures, with the recruitment of renal progenitor cells that replace damaged cells and contribute to the regeneration of kidney structures [
4] (p. 251). The result of the regeneration process is an increased exfoliation of epithelial cells lining tubules, which are highly voided in the urine [
5] (p. 534139).
Different cell types of the urinary tract are physiologically voided into the urine daily; however, only negligible amounts of kidney cells have been isolated from the urine of healthy subjects. On the contrary, an increase in the exfoliation rate has been observed in active kidney diseases, including AKI and CKD [
6,
7] (pp. 525–531, p. 7610). In this context, urine may represent a promising, easily obtainable and ethics-free cell source for diagnostic and therapeutic applications, avoiding the invasiveness and the risks of solid biopsies [
8].
Numerous cell-isolation and -characterization techniques have been developed in recent years, allowing exfoliated cells from the urine to be used as surrogate markers for solid biopsies in predicting changes relating to gene expression, deoxyribonucleic acid (DNA) methylation, DNA damage and protein expression in the kidney [
9] (pp. 601–610). In addition to their application in diagnostics, urine cells are increasingly studied for cell therapy applications in different pathologies, as well as in drug-testing procedures [
10] (p. 189). Since the applications of exfoliated kidney cells into clinical practice has increased, the development of protocols to properly isolate and expand the target-cell type, and the set-up of proper culture conditions are required [
11] (pp. 345–349).
As of today, the cell types commonly observed and isolated in the urine of patients with different pathological conditions include podocytes, tubular progenitor cells and proximal tubule epithelial cells (PTECs) [
12] (pp. F145–F161). Urine is also a source of cells with stemness characteristics, and immunomodulatory and differentiative abilities [
13,
14] (pp. 3566–3578, p. 573); these cells are known as urine stem cells (USCs) and share some phenotypical and functional features with mesenchymal Stem Cells (MSCs), derived from other tissues [
10,
11] (p. 189, pp. 345–349). Unlike embryonic stem cells (ESCs) USCs can be transplanted into an animal model without inducing teratoma formation [
15,
16] (pp. 2123–2132, pp. 1–20). Given the high heterogeneity of the urine sediment, the kidney epithelial populations obtained during culture are commonly defined as urine-derived renal epithelial cells (URECs) [
17] (pp. 87–95).
URECs are another population of progenitor cells found in urine, considered to be more differentiated and less proliferating than USCs. URECs can be isolated by the centrifugation of urine samples, and the seeding of cell suspension under proper conditions allows one to subculture cells for 4 to 10 passages, before they visibly transform, acquiring a more flattened and elongated morphology, suggesting the onset of senescence. These cells share most of their markers with USCs, differing in terms of their morphology and differentiation potential. In fact, URECs’ phenotype is intermediate between PTECs and fibroblasts, with the expression of cytokeratin and proximal-tubule-associated markers, such as CD13 [
18] (pp. 1–17), along with the expression of fibroblastic-like markers such as CD90 and Vimentin [
17] (pp. 87–95).
There are certain pathological conditions in which URECs are highly voided in urine, but a small amount of progenitor epithelial cells was also found in urine samples from preterm neonates [
19] (pp. 2762–2770). A loss of renal tubular epithelial cells was also observed in the urinary sediments of renal transplant recipients, especially in the first 2 weeks post-kidney-transplant, with an increase in their number during acute graft rejection, as demonstrated in a pivotal study published in 1977 [
20] (pp. 580–584). The primary objective of the present study is to isolate and characterize URECs obtained from patients who have undergone kidney transplants, focusing on evaluating their phenotype and proliferative capacity. Moreover, the search for cells with immunomodulatory and anti-inflammatory capacities is one of the most attractive fields in regenerative medicine strategies; here, for the first time, we accurately describe the ability of URECs to reduce CD4 T (CD4
+) and CD8 T (CD8
+) lymphocyte proliferation, promoting the expansion of regulatory T cells (Treg), while reducing the T helper 1 (Th1)-producing interferon gamma (IFN-γ), and modulating the cytokine microenvironment.
2. Materials and Methods
2.1. Patients Recruitment and Literature Search
The urine samples collected for this study were derived from patients who had undergone kidney transplantation in University Hospital of Bologna IRCCS, Sant’Orsola Polyclinic, after the approval of the Ethics Committee (protocol number: 312/2021/Oss/AOUBO).
The transplanted kidneys were derived from circulatory death (DCD) donors. Transplanted patients recruited for the study had no residual diuresis, to ensure the donor origin of kidney cells. The urine of four healthy volunteers was collected as the control. Information from the literature was selected, starting from papers regarding differences about kidney donors, focusing on DCD ones. The side effects of DCD donation on kidneys were also evaluated, followed by a search for studies regarding urine-derived kidney cells and their applications. Subsequently, the study of the literature regarding the immunomodulatory properties of different cell populations was performed.
2.2. Isolation of Urine Renal Epithelial Cells (URECs)
The urine of transplant patients was collected within the first week after transplantation (T0), when patients resume autonomous diuresis. Urine samples were also collected after one (T1) and six (T6) months from kidney transplant. Samples were processed right after the collection and the range of urine volume was 100–300 mL. Urine was transferred into sterile 50 mL tubes and centrifuged at 400 g for 10 min. The pellet was resuspended in phosphate-buffered saline (PBS, Corning, Steuben County, NY, USA) with 1% penicillin–streptomycin (P/S) solution (10,000 U/mL Penicillin, 10,000 U/mL Streptomycin, Corning, Steuben County, NY, USA) and centrifuged at 400 g for 10 min. Urine sediment was resuspended in Dulbecco’s modified Eagle medium: Nutrient Mixture F12 (DMEM F12, Gibco, Life Technologies, Carlsbad, CA, USA) with 10% of foetal bovine serum (FBS, Gibco, Life Technologies, Carlsbad, CA, USA), and supplemented with Renal Epithelial Growth Medium (REGMTM) Single Quot kit (Lonza Bioscience, Basel, Swizerland), 1% P/S solution (Corning, Steuben County, NY, USA), 2.5 µg/mL amphotericin B (Biochrom, Waterbeach Cambridge, UK), 100 µg/mL normocin (InvivoGen, San Diego, CA, USA) and 10 µg/mL ciprofloxacin (Fresenius Kabi, Graz, Austria).
The cell suspension was seeded in flasks and incubated at 37 °C and 5% CO2. After 72 h, the isolation medium was replaced with Renal Epithelial Basal Medium (REBMTM, Lonza Bioscience, Basel, Swizerland) at 10% of FBS and supplemented with REGM TM SingleQuot kit, 2.5 mM GlutaMAX (Gibco, Life Technologies, Carlsbad, CA, USA), 1% non-essential amino acids (Termo Fisher Scientific, Waltham, MA, USA) and 1% P/S. The proliferation medium allows the survival and proliferation of epithelial cells, while dead cells and cellular debris are removed with subsequent medium exchanges. Cultures were monitored for the presence of growth foci, and after reaching confluence, the cells were detached from the growth surface by incubation with 0.25% Trypsin/EDTA solution (Corning, Steuben County, NY, USA). For each time point, the isolation yield percentage in the Y axes refers to the number of patients in which UREC cells could be isolated and grown in culture. The freshly isolated cells were counted and tested for viability using Erythrosine B (Sigma-Aldrich, St. Louis, MO, USA). Only samples with >90% viability were used for further assays. All the experiments were performed on cells obtained at T0 and used within the third culture passage.
2.3. Immunofluorescence Analysis
For immunofluorescence analysis, URECs were seeded onto glass coverslips and cultured in proliferation medium. Cells were fixed with 10% formalin for ten minutes at room temperature, washed with PBS, and permeabilized by adding PBS 0.1% Triton (Triton X-100, Sigma-Aldrich, Co., St. Louis, MO, USA) for 10 min. URECs were incubated for 30 min with blocking solution containing PBS 1% Bovine Serum Albumin (BSA, Sigma-Aldrich, St. Louis, MO, USA) and then incubated overnight at 4 °C with primary antibodies rabbit anti-Vimentin (1:200, Thermo Fisher Scientific, Waltham, MA, USA) and mouse anti-Ki-67 FITC (1:250, Miltenyi-Biotech, Bergisch Gladbach, NRW, Germany), and mouse anti-CD24 (1:250, #MAB8547, R&D Systems, Minneapolis, MN, USA) diluted in blocking solution. Secondary antibodies anti-rabbit Alexa Fluor 594 (1:500, Thermo Fisher Scientific, Waltham, MA, USA) and anti-mouse Alexa Fluor 488 (1:500, #A11001, Thermo Scientific, Waltham, MA, USA) were added and incubated for 1 h at room temperature. After three washes with PBS, coverslips were mounted using the Prolong Gold Antifade Mountant with DAPI (Thermo Fisher Scientific, Monza, Italy). Stained cells were observed using a Nikon Inverted Microscope (Nikon Instruments, Tokyo, Japan), and images were acquired with a Digital Sight camera DS-03 using the imaging software NIS-Elements 4.1 (Nikon Corporation, Tokyo, Japan).
2.4. URECs Proliferation during Culture Passages
To assess the proliferation of UREC during culture passages, cells were thawed and seeded in proliferation medium. The proliferative capacity of URECs after each passage (P1–P5) was assessed as Cumulative Population Doubling (CPD) by applying the following formula: [log10(NH) − log10(N1)]/log10(2)], where NH is the number of harvest cells, and N1 is the number of plated cells.
2.5. RNA Extraction and Real-Time PCR
URECs were seeded in T25 flasks at the density of 30,000 cells/cm2 and cultured in proliferation medium. For the extraction of RNA, from UREC and PBMC samples, the RNeasy mini kit (QIAGEN, Valencia, CA, USA) was used following the manufacturer’s instructions. The genomic DNA contamination was removed by digestion with RNase-free deoxyribonuclease I (RNase-free DNase set, QIAGEN, Valencia, CA, USA). The evaluation of RNA quality and concentration was assessed using the NanoDrop® 1000 Spectrophotometer (Thermo Fisher Scientific, Waltham, MA, USA). The iScript cDNA Synthesis Kit (Bio-Rad Laboratories, Hercules, CA, USA) was used to reverse-transcribe the RNA according to the manufacturer’s instructions. Real-time PCR (qPCR) was performed in a Bio-Rad CFX96 real-time thermal cycler (Bio-Rad Laboratories, Hercules, CA, USA). For each condition, 25 ng of cDNA were amplified using the SsoAdvanced Universal SYBR Green Supermix (Bio-Rad Laboratories, Hercules, CA, USA) in technical triplicate. Data were analysed using the software CFX Manager (Bio-Rad Laboratories, Hercules, CA, USA) and the 2−ΔΔCt method. The glyceraldehyde-3-phosphate dehydrogenase (GAPDH) was used as the reference gene and the expression of CD24 and CD133 was normalized on GAPDH. The primers used were as follows: GAPDH (Cat. No: HP205798, ID: NM_002046, Origene, Rockville, MD, USA), CD24 (Cat. No: HP210404, ID: HP210404, Origene, Rockville, MD, USA), CD133 (Cat. No: HP209042, ID: NM_006017, Origene, Rockville, MD, USA)
2.6. Flow Cytometry Analysis of URECs Immunophenotype
After isolation, URECs were seeded in culture flasks and cultured until confluence. Cells were harvested by trypsin digestion and fixed with 10% formalin (Sigma-Aldrich, St. Louis, MO, USA) for 10 min. Fixed cells were stained with conjugated antibodies and analysed by flow cytometry. For the surface staining, fixed cells were incubated for 30 min at 4 °C in staining buffer, made of PBS containing 0.1% BSA (Sigma-Aldrich, St. Louis, MO, USA), avoiding light exposure. Conjugated antibodies used for surface staining were the following: anti-CD13 APC, anti-CD326 (EpCam) FITC, anti-CD24 PE, anti-CD90 PerCP/Cy5.5, anti-CD133 APC, all purchased from BioLegend, San Diego, CA, USA, and anti-HLA-G PerCp-eFluor™ 710 (eBioscience, San Diego, CA, USA). Cells were then washed twice and resuspended in PBS 0.1% BSA. For the intracellular staining, cells were permeabilized using a Fixation/Permeabilization Kit (BD Bioscience, Franklin Lakes, NJ, USA) according to the manufacturer’s instructions. Cells were incubated for 30 min at 4 °C in permeabilization buffer with anti-Cytokeratin (Ck) BV421 (BD Bioscience, Franklin Lakes, NJ, USA) and anti Ki-67 FITC (Miltenyi-Biotech, Bergisch Gladbach, NRW, Germany) antibodies. Cells were resuspended in PBS 0.1% BSA and analysed by flow cytometry using a CytoFLEX S (Beckman Counter, CA, USA) instrument. Unstained samples were used as negative controls and the data were analysed using FlowJo X software V.10 (Tree Star, Ashland, OR, USA). The markers were analysed and their functions are listed in the table below (
Table 1).
2.7. Isolation of PBMCs
PBMCs were obtained from the blood of healthy donors according to the protocol approved by the Ethics Committee. PBMCs were isolated by density gradient centrifugation with Histopaque®-1077 (Sigma-Aldrich, St. Louis, MO, USA). Then, the blood sample was centrifuged at 2500 rpm for 30 min without break. After the centrifugation, the ring containing the PBMC population was collected and resuspended in PBS. The cell suspension was centrifuged at 1500 rpm for 10 min, and the washing step was repeated twice. PBMCs were counted with Methyl Violet (Sigma-Aldrich, St. Louis, MO, USA) to exclude red blood cells and with Erythrosine B to evaluate viability; cells were frozen at –80 °C in FBS with 10% dimethyl sulfoxide (Sigma-Aldrich, St. Louis, MO, USA).
2.8. Co-Culture of URECs and PBMCs
URECs were seeded at a density of 40,000 cells/cm2 in 96-well plates in proliferation medium. After 24 h, PBMCs were thawed and activated by stimulation with anti-CD3 (CD3 Monoclonal Antibody HIT3a, Functional Grade, eBioscience™ Invitrogen, Waltham, MA, USA) and anti-CD28 (CD28 Monoclonal Antibody (CD28.2), Functional Grade, eBioscience™, Invitrogen, Waltham, MA, USA) antibodies. Stimulated PBMCs were seeded at a concentration of 200,000 cells/well above the URECs monolayer (PBMCs + URECs); activated PBMCs seeded in the absence of URECs were set as the positive control, while non-activated PBMCs represented the negative control. Cells were incubated for 72 h, and the medium for the co-culture experiments was RPMI 10% FBS, 2.5 mM GlutaMAX (Gibco), 1% non-essential amino acids (Termo Fisher Scientific, Waltham, MA, USA) and 1% P/S. Proliferation, apoptosis, and analysis of lymphocyte subpopulations were assessed by flow cytometry.
2.9. CFSE Assay
The proliferation of CD4+ and CD8+ lymphocytes with or without co-culture with URECs was evaluated by labelling with Carboxyfluorescein Succinimidyl Ester (CFSE). Before seeding, PBMCs were labelled with BD Horizon™ CFSE according to the manufacturer’s protocol. Briefly, thawed PBMCs were resuspended in PBS and labelled with CFSE 2 µM for 5 min at 37 °C. The reaction was stopped using RPMI with 50% of FBS; cells were then centrifuged and resuspended in culture medium. CFSE-labelled PBMCs were activated with anti-CD3 and anti-CD28 antibodies and seeded at a concentration of 200,000 cells/well in a 96-well plate for both positive controls and co-culture condition, as previously described. After 72 h, PBMCs were collected, washed with PBS, and stained with anti-CD4 APC (Biolegend, San Diego, CA, USA) and anti-CD8 Pecy7 (Biolegend, San Diego, CA, USA) antibodies for 30 min at 4 °C in PBS 0.1% BSA, both diluted at 1:100. The proliferation rate of CD4+ and CD8+ cells was evaluated by flow cytometry using the CytoFLEX S instrument. Results were compared to positive control set as 100%. A total of 20,000 events among both CD4+ and CD8+ cell subsets were acquired for each sample.
2.10. Analysis of PBMCs Apoptosis with Annexin V/7-AAD Assay
The apoptosis of PBMCs with or without co-culture was assessed using Annexin V/7-AAD kit (Biolegend, San Diego, CA, USA). Cells were stained according to manufacturer instructions. Briefly, PBMCs were collected, washed with PBS, and then labelled for 15 min at room temperature with anti-Annexin V PE and 7-AAD in binding buffer; both used 2:100. After the staining, 400 µL of binding buffer was added to each tube and samples were analysed by flow cytometry. Unstained PBMCs were used as negative controls and results were represented as a percentage of Annexin V PE+/7-AAD− (early apoptosis) and Annexin V PE+/7-AAD+ (late apoptosis) cells among PBMCs.
2.11. Flow Cytomentry Analysis of Lymphocyte Subpopulations
PBMCs from healthy donors were cultured with URECs as described before. After 72 h of incubation, PBMCs were collected, and the characterization of T cells subset was performed. For the analysis of the Treg population, anti-CD4 APC (Biolegend, San Diego, CA, USA) and anti-CD25 FITC (Biolegend, San Diego, CA, USA) antibodies were used as surface markers, through incubation of 30 min in PBS 0.1% BSA. For intracellular staining, PBMCs were fixed and permeabilized with eBioscience™ Foxp3/Transcription Factor Staining Buffer Set (Invitrogen, MA, USA) according to the manufacturer’s instructions. Briefly, cells were fixed for 30 min at 4 °C with Fixation/Permeabilization solution, previously diluted 1:4 with Foxp3 Fixation/Permeabilization Diluent, and permeabilized with 1X Foxp3 Permeabilization Buffer for 15 min. Cells were labelled with anti-FoxP3 PE (Biolegend, San Diego, CA, USA) antibody for 30 min at 4 °C in Permeabilization Buffer, washed twice and resuspended in PBS 0.1% BSA. For the quantification of intracellular cytokines, the PBMCs of both the control and co-culture conditions were treated with a mixture of 1 nM Phorbol 12-myristate 13-acetate (PMA, Sigma-Aldrich, St. Louis, MO, USA), Ionomycin 3 mg/mL (Sigma-Aldrich, St. Louis, MO, USA) and 1 uL/mL Golgi Plug™ (BD, Becton, Dickinson, NJ, USA), and incubated at 37 °C to 5% CO
2 for 4 h before staining. For IFN-γ-producing populations, cells were stained for surface markers with the anti-CD4 APC and (Biolegend, San Diego, CA, USA) antibody, while intracellular staining was performed, after the fixation and permeabilization steps, for 30 min at 4 °C with anti-IFN-γ-PeCy7 (Biolegend, San Diego, CA, USA). The markers for the identification of PBMC subsets and their functions are listed in
Table 2.
2.12. Luminex xMAP Thecnology
The analysis of cytokine release was performed in cell culture supernatant of PBMCs and PBMCs + URECs conditions. After 72 h of culture, conditioned media were centrifuged and collected into 1.5 mL tubes; samples were stored at −80 °C until subsequent analysis. Samples were thawed at room temperature and cytokines were quantified using the Human Custom Procartaplex-19 (Cat. No. PPX-19-MXRWE2G, Invitrogen, Waltham, MA, USA) according to manufacturer protocol, and the concentration of cytokines was measured by MAGPIX TM (Luminex
® xMAP
® Technology, Austin, TX, USA). All samples were analysed in technical triplicates. The amount of each cytokine in the co-culture condition was normalized to the control condition (PBMCs), set as 100%.
Table 2 reports the list of analysed cytokines.
2.13. Statistical Analysis
All the experiments were performed at least on five donors. Data are expressed as mean ± standard deviation (SD) and were analysed with a t-test using Graph Pad Prism 7.04 software (San Diego, CA, USA). The significance threshold was p < 0.05.
4. Discussion
The number of kidney transplants has grown exponentially over the years. Despite organs from living donors having shown a superior graft survival compared with the ones from deceased donors, the increasing demand of kidneys and the living organ-donation scarcity have resulted in the expansion of the donor pool, including donation after brain death (DBD) and donation after circulatory death (DCD) [
21] (pp. 1836–1839).
Despite the fact DBD donation is the main current source of organs for transplantation, over the past decade, DCD donation has increased more than 10-fold.
Kidneys from DBD and especially DCD donors are highly exposed to IR injury, that inevitably takes place during the transplant procedure. The lack of O
2 and nutrients promotes the accumulation of ischemic metabolites, kidney-damage markers and waste products, increasing the risk of AKI, DGF and rejection [
22] (p. 20).
These events result in an increased cell turnover within nephron structures, especially in the glomerulus and in the proximal tubule, to replace the damaged cells with functional ones [
23] (pp. 1714–1725). The result of the tissue regeneration process is an increase in the release of kidney-derived cells into the urine, together with other cell types deriving from the urinary tract [
14] (p. 573).
URECs are a cell population highly voided in urine in response to stress factors, including post-transplant ischemia and reperfusion events, while a small percentage of these cells is detected in the urine of healthy patients. According to Lenzini and colleagues, URECs can be successfully cultured for up to four culture passages. They also highlighted the role of URECs in renal metabolic-disorder modelling, focusing on glycogen-storage diseases [
24]. The characterization of URECs obtained from kidney transplanted patients recruited for this study confirmed the epithelial phenotype of this population, with the high expression of cytokeratin epithelial marker. The high CD13 expression also suggests that URECs obtained in the early stages after transplant was mainly derived from proximal tubules, while a small contribution of distal-tubule-derived cells (CD13−EpCAM
+) was observed. According to previous studies, the progressive reduction in successful isolations observed after one and six months from transplant, and the lack of positive isolations from healthy donors, has confirmed that the release of URECs is higher in the earlier stages after transplant, when the regenerative events are more involved [
3] (p. 1412).
As a result of the increased cell turnover, a significant amount of CD24
+CD133
+ kidney progenitor cells were detected during the first passages of the cell culture. The CD24
+CD133
+ population can be expanded in vitro without losing their phenotype and their self-renewal capacity, as well as the ability to differentiate into podocytes and tubular cells, contributing to kidney regeneration [
25] (pp. 828–829). The presence of CD24
+CD133
+ progenitor cells in urine suggests their potential use for modelling genetic disorders and for personalized therapeutic approaches, avoiding both the risk associated with isolation from biopsies and the alteration in cell features caused by the immortalization process [
26] (pp. 1961–1974). URECs also tested highly positive for mesenchymal stromal cell markers, including the CD73 surface molecule, which is known to be involved in the regulation of the immune response by converting pro-inflammatory adenosine monophosphate (AMP) into anti-inflammatory adenosine, reducing myocardial ischemia/reperfusion injury in animal models [
27] (p. e006949). A percentage of URECs also expresses the tolerogenic molecule HLA-G, which is involved in the inhibition of CD4
+ and CD8
+ T cell proliferation, in the promotion of Treg cells and in foeto-maternal tolerance [
28] (pp. 364–375). The regulation of the immune response is crucial in organ transplantation and in many immune-related disorders, new immunoregulatory strategies are needed to reduce the use of immunosuppressive drugs.
The injection of cells with immunomodulatory properties, such as mesenchymal stem cells (MSCs), is one of the most promising cell-therapy strategies nowadays.
URECs are usually poorly characterized for potential therapeutic applications, including their immunomodulatory potential. These cells may have the advantages of an easy collection, the lack of ethical issues and the high availability of samples, which are all main aspects of cell administration in therapeutic strategies and also in disease modelling. The lack of information regarding the role of HLA-G in cells obtained after kidney transplant has stimulated interest in deepening the understanding of the interaction between URECs and immune cells in vitro, setting up a co-co-culture with PBMCs from healthy donors. Here, for the first time, we demonstrated that, like other more-characterized cell populations, URECs obtained from DCD-transplanted kidneys significantly reduce the proliferation of CD4
+ and CD8
+ T lymphocytes. Interestingly, this inhibition of lympho-proliferation was not associated with the promotion of apoptotic mechanisms. On the contrary, URECs protected PBMCs against the onset of both early and late apoptosis. The inhibition of the apoptosis on PBMCs exerted by URECs has not been documented to date. Anti-apoptotic mechanisms have already been described in other cell populations, including mesenchymal stem cells from several tissues, and they are mostly associated with the secretion of factors such as transforming growth factor-β (TGF-β) and bone morphogenetic protein 15 (BMP15), that inhibit the activation of pro-apoptotic signals [
29] (p. 270). To better understand the immunomodulatory activity of URECs, their influence on T CD4
+ and CD8
+ cell subsets was analysed. T CD4
+ cell population-producing IFN-γ (Th1), commonly associated with inflammation and immune-response triggering, was significantly reduced in the co-culture, along with the reduced release of IFN-γ into the extracellular environment. Interestingly, the percentage of Treg cells increased during the co-culture, and could be associated with the expression of HLA-G observed in a subset of URECs, given its role in activating the regulatory T component and in the downregulation of the inflammatory response [
30] (pp. 1–15). Additionally, an increase in IL-2, which is commonly related to both immune-response initiation and tolerance regulation, was observed [
31] (pp. 79–119). The co-culture of URECs with immune cells also resulted in a significant decrease in several cytokines. Among these cytokines, some are known to be associated with the recruitment and activation of immune cells (IL-5, IL-8, MIP-1β, CD40L), while others play a role in the regulation of immune and inflammatory responses (IL-10, IFN-γ, TNF-β). It is known that cytokines and chemokines play pleiotropic roles, and their actions are strongly influenced by the surrounding microenvironment and by the target cells. A single cytokine may be secreted by different cells and may exert both pro-inflammatory and anti-inflammatory functions, generating multiple immune responses [
32] (p. e2004433). For these reasons, the analysis of the mechanisms involved in the modulation of such molecules is challenging and requires deeper investigation. From the results obtained until now, it is possible to observe that the presence of a UREC monolayer significantly influenced the cytokine microenvironment in the co-culture, confirming the ability of urine-derived cells to modulate immune cells. Since this study mainly focused on the T-cell subsets, the effect of URECs on other cell populations in both the innate and the acquired immune response will be also evaluated.


 ,
, 


