
Smarcb1 Loss Results in a Deregulation of esBAF Binding and Impacts the Expression of Neurodevelopmental Genes

 , , and
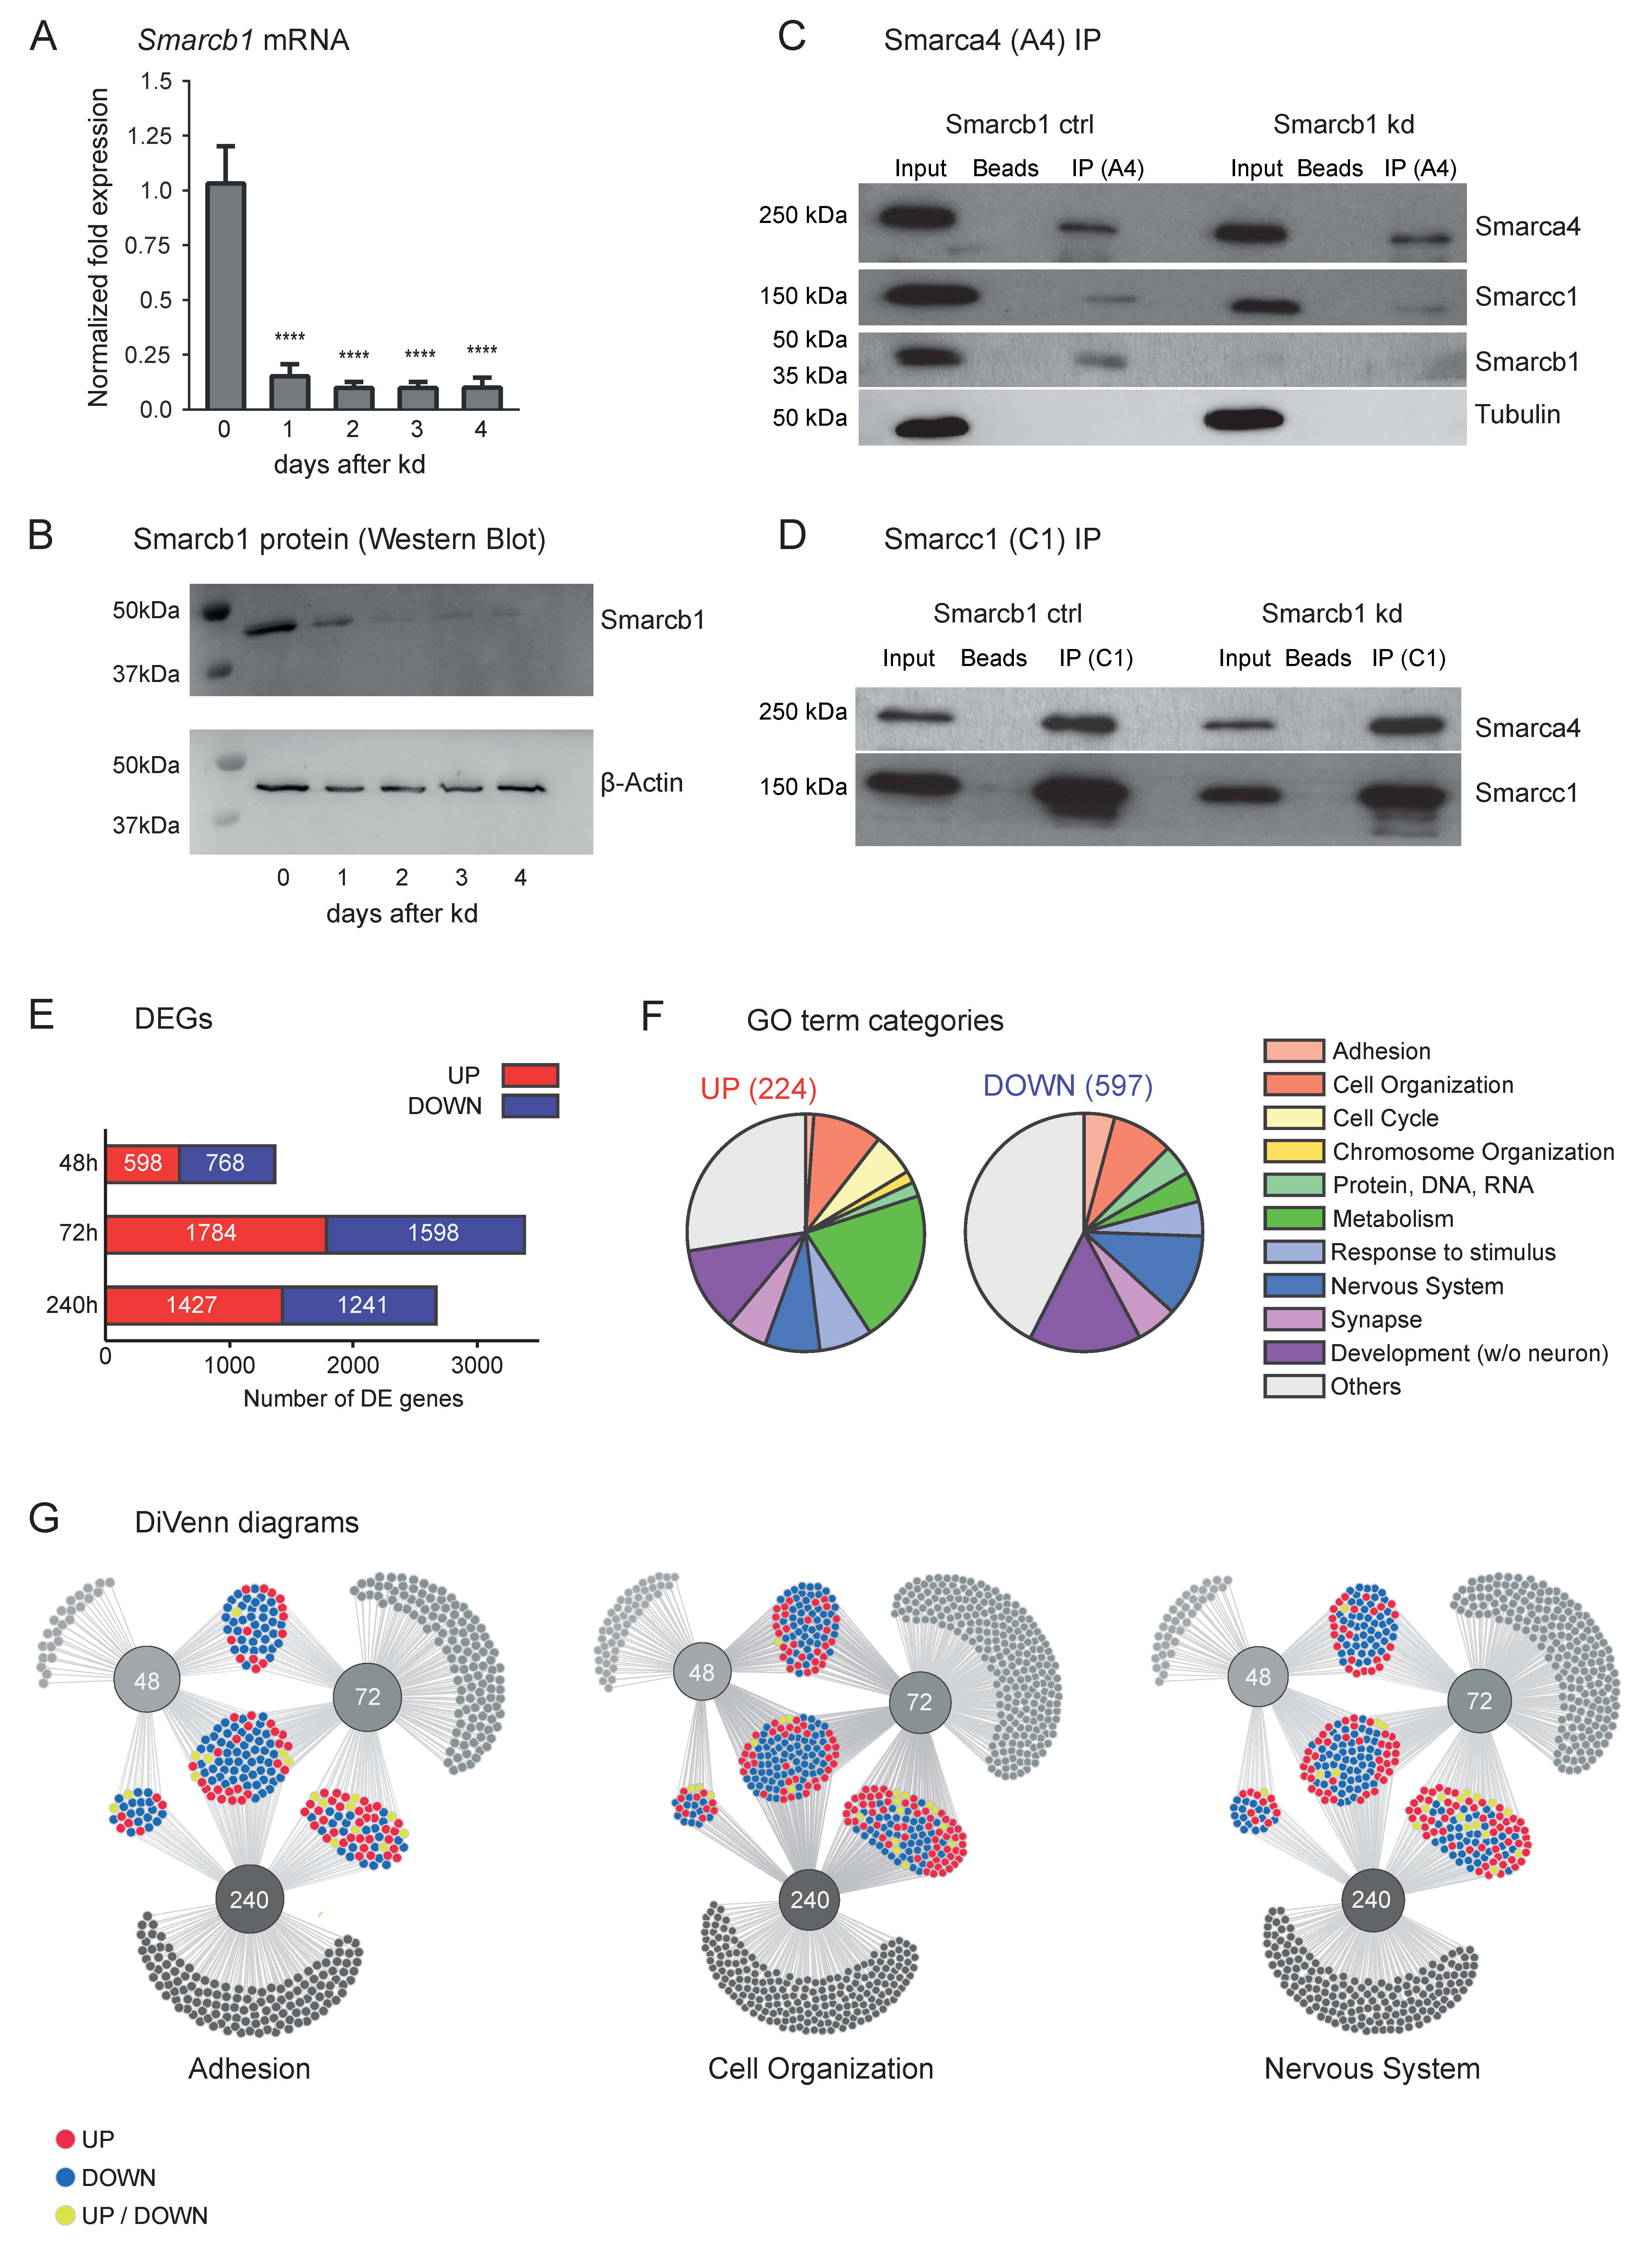
Abstract
:1. Introduction
2. Materials and Methods
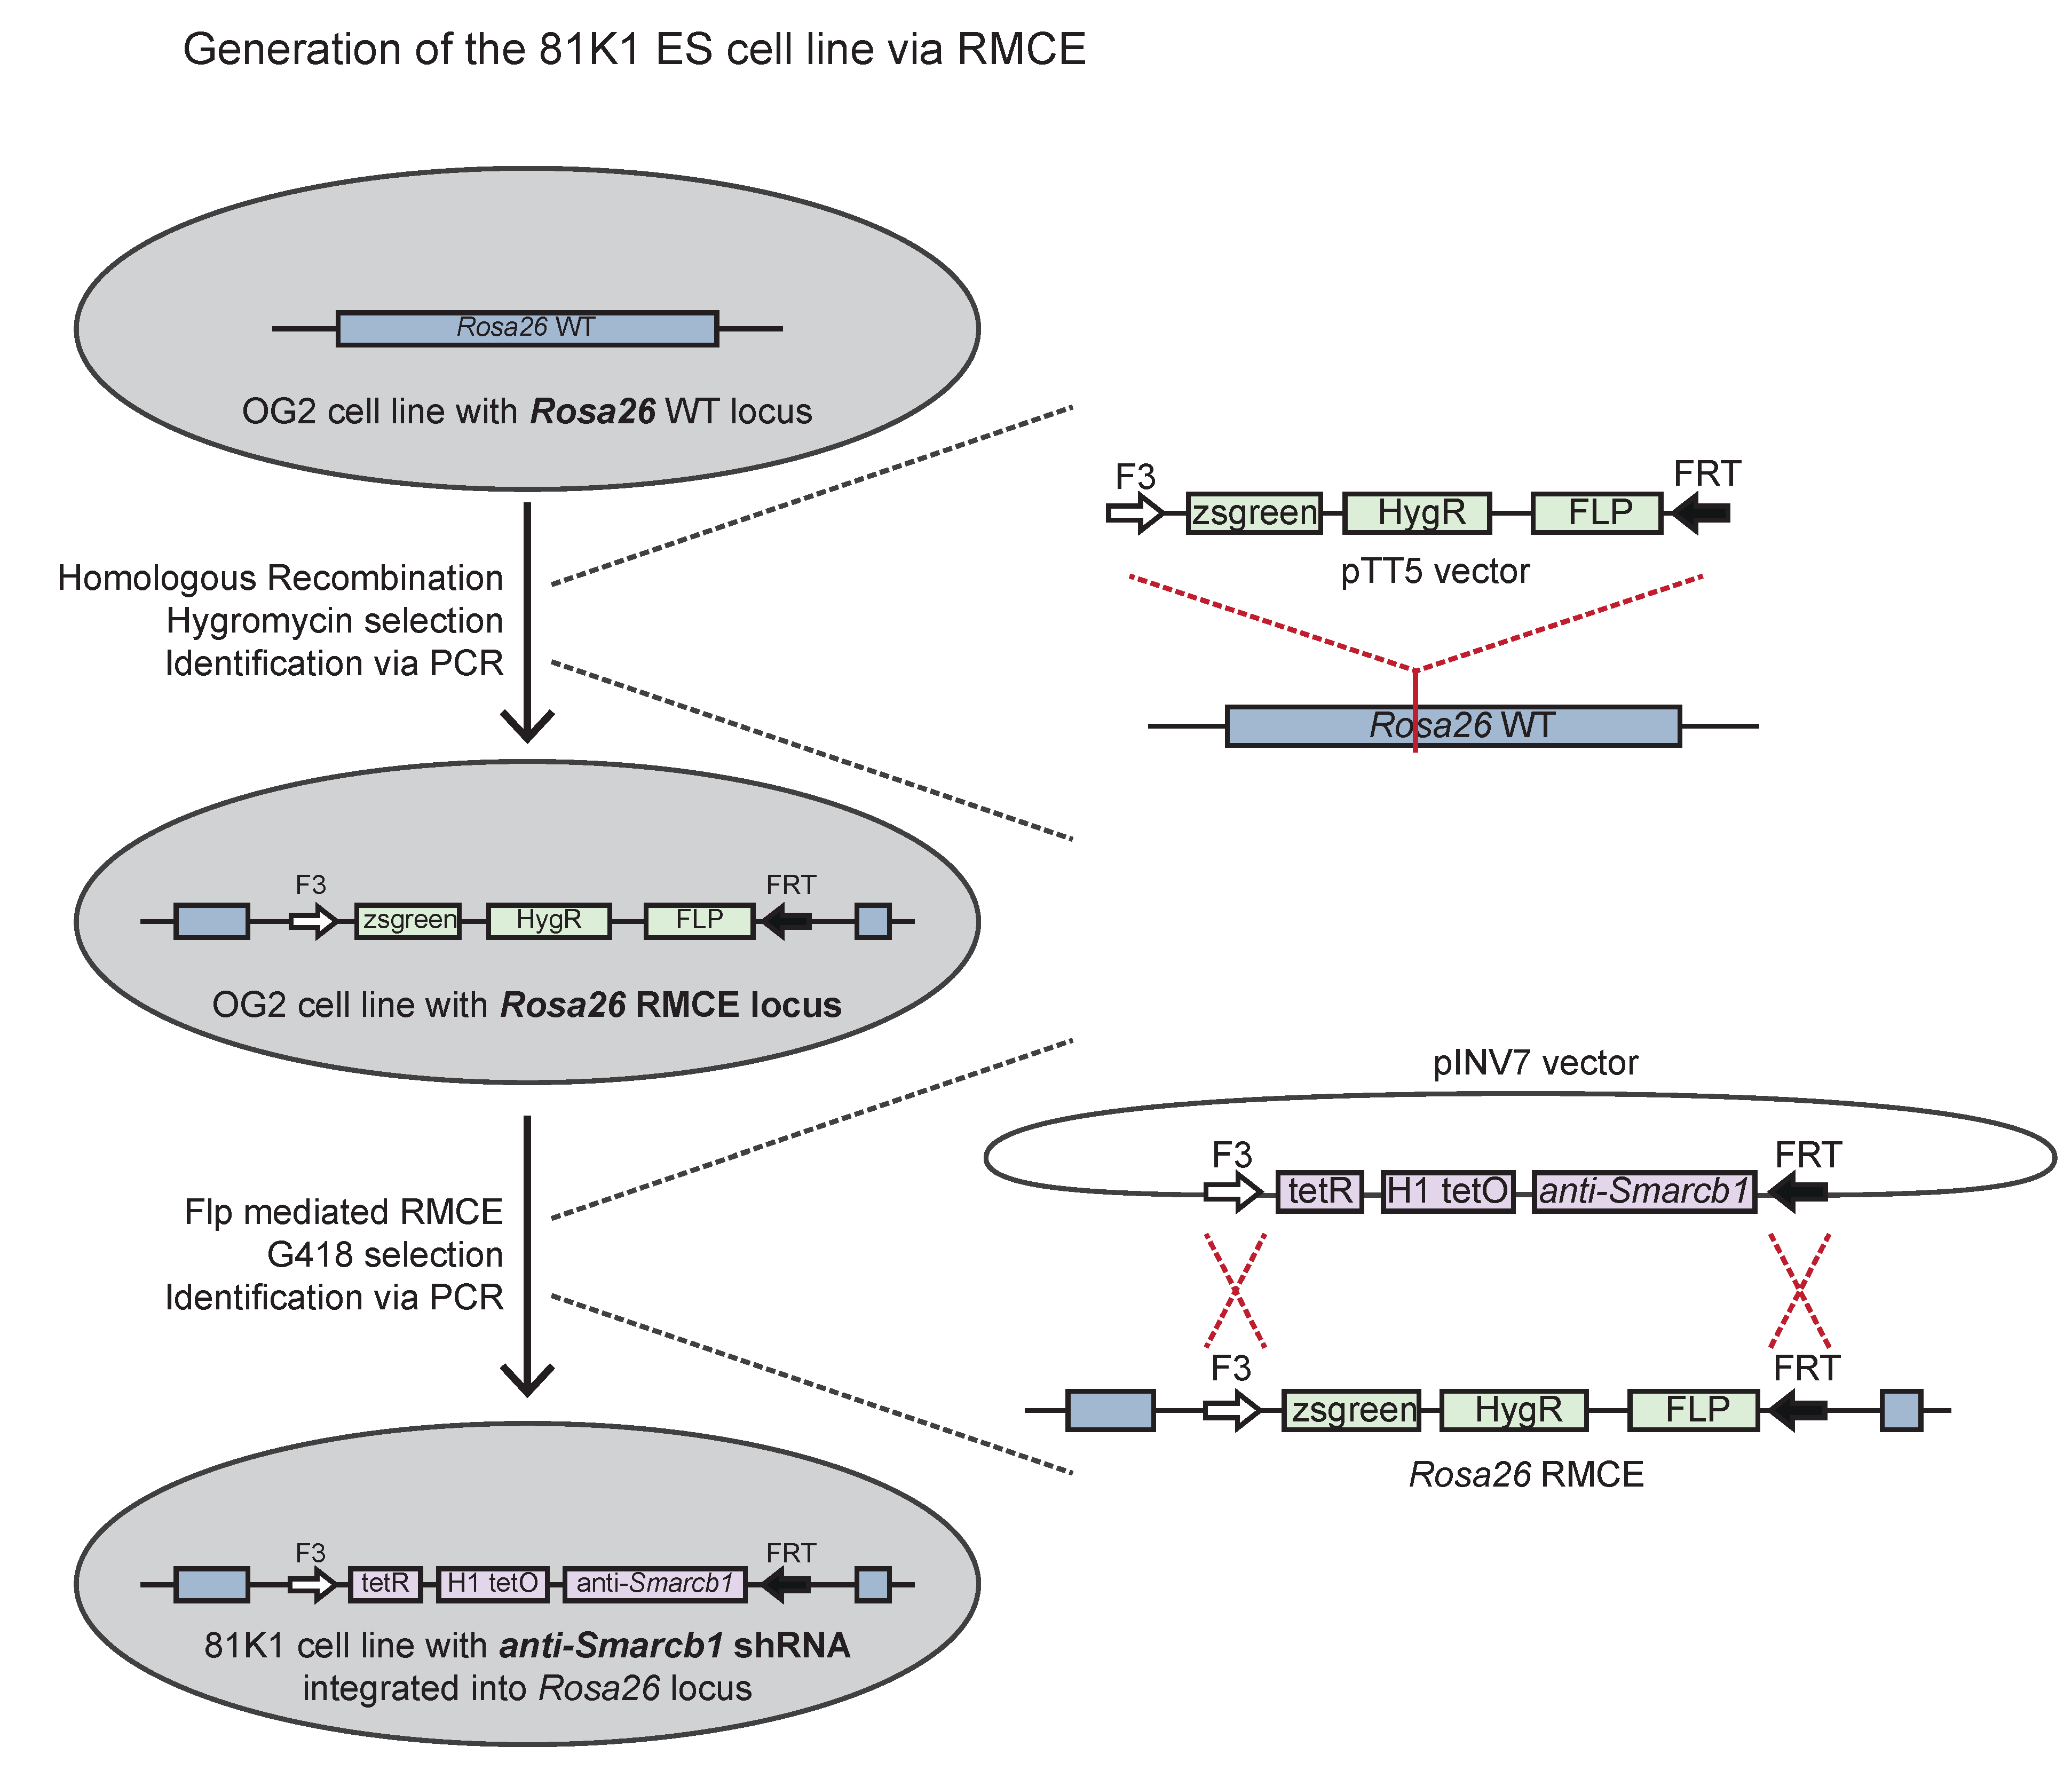
2.1. Generation of the 81K1 ESC Line
2.2. Cell Culture
2.3. RT-qPCR
2.4. Western Blot
2.5. Co-IP Experiments
2.6. Evaluation of Cell Growth and Cell Viability: MTT Assay and Doubling Time
2.7. RNA-Seq
2.8. ChIP-Seq for Ezh2, H3K27ac and H3K4me3
2.9. ChIP-Seq for Smarca4 and H3K27me3
2.10. Analysis of ChIP-Seq Data—Alignment and Peak Calling
2.11. ChIP-Seq Visualisation in Peak Profiles
2.12. Gene Ontology (GO) Analysis
2.13. Comparison of Smarca4 and Smarcb1 Knockdown Data
2.14. Combining RNA-Seq and ChIP-Seq Data
2.15. Permutation Tests and Antibody Enrichment
2.16. Enhancer Analysis
3. Results
3.1. Smarcb1 Regulates Gene Networks Involved in the Development of the Nervous System, Cell Organisation and Adhesion

3.2. The Regulation of Nervous System-Related Genes Is More Dependent on Smarcb1 Than on Smarca4 Function
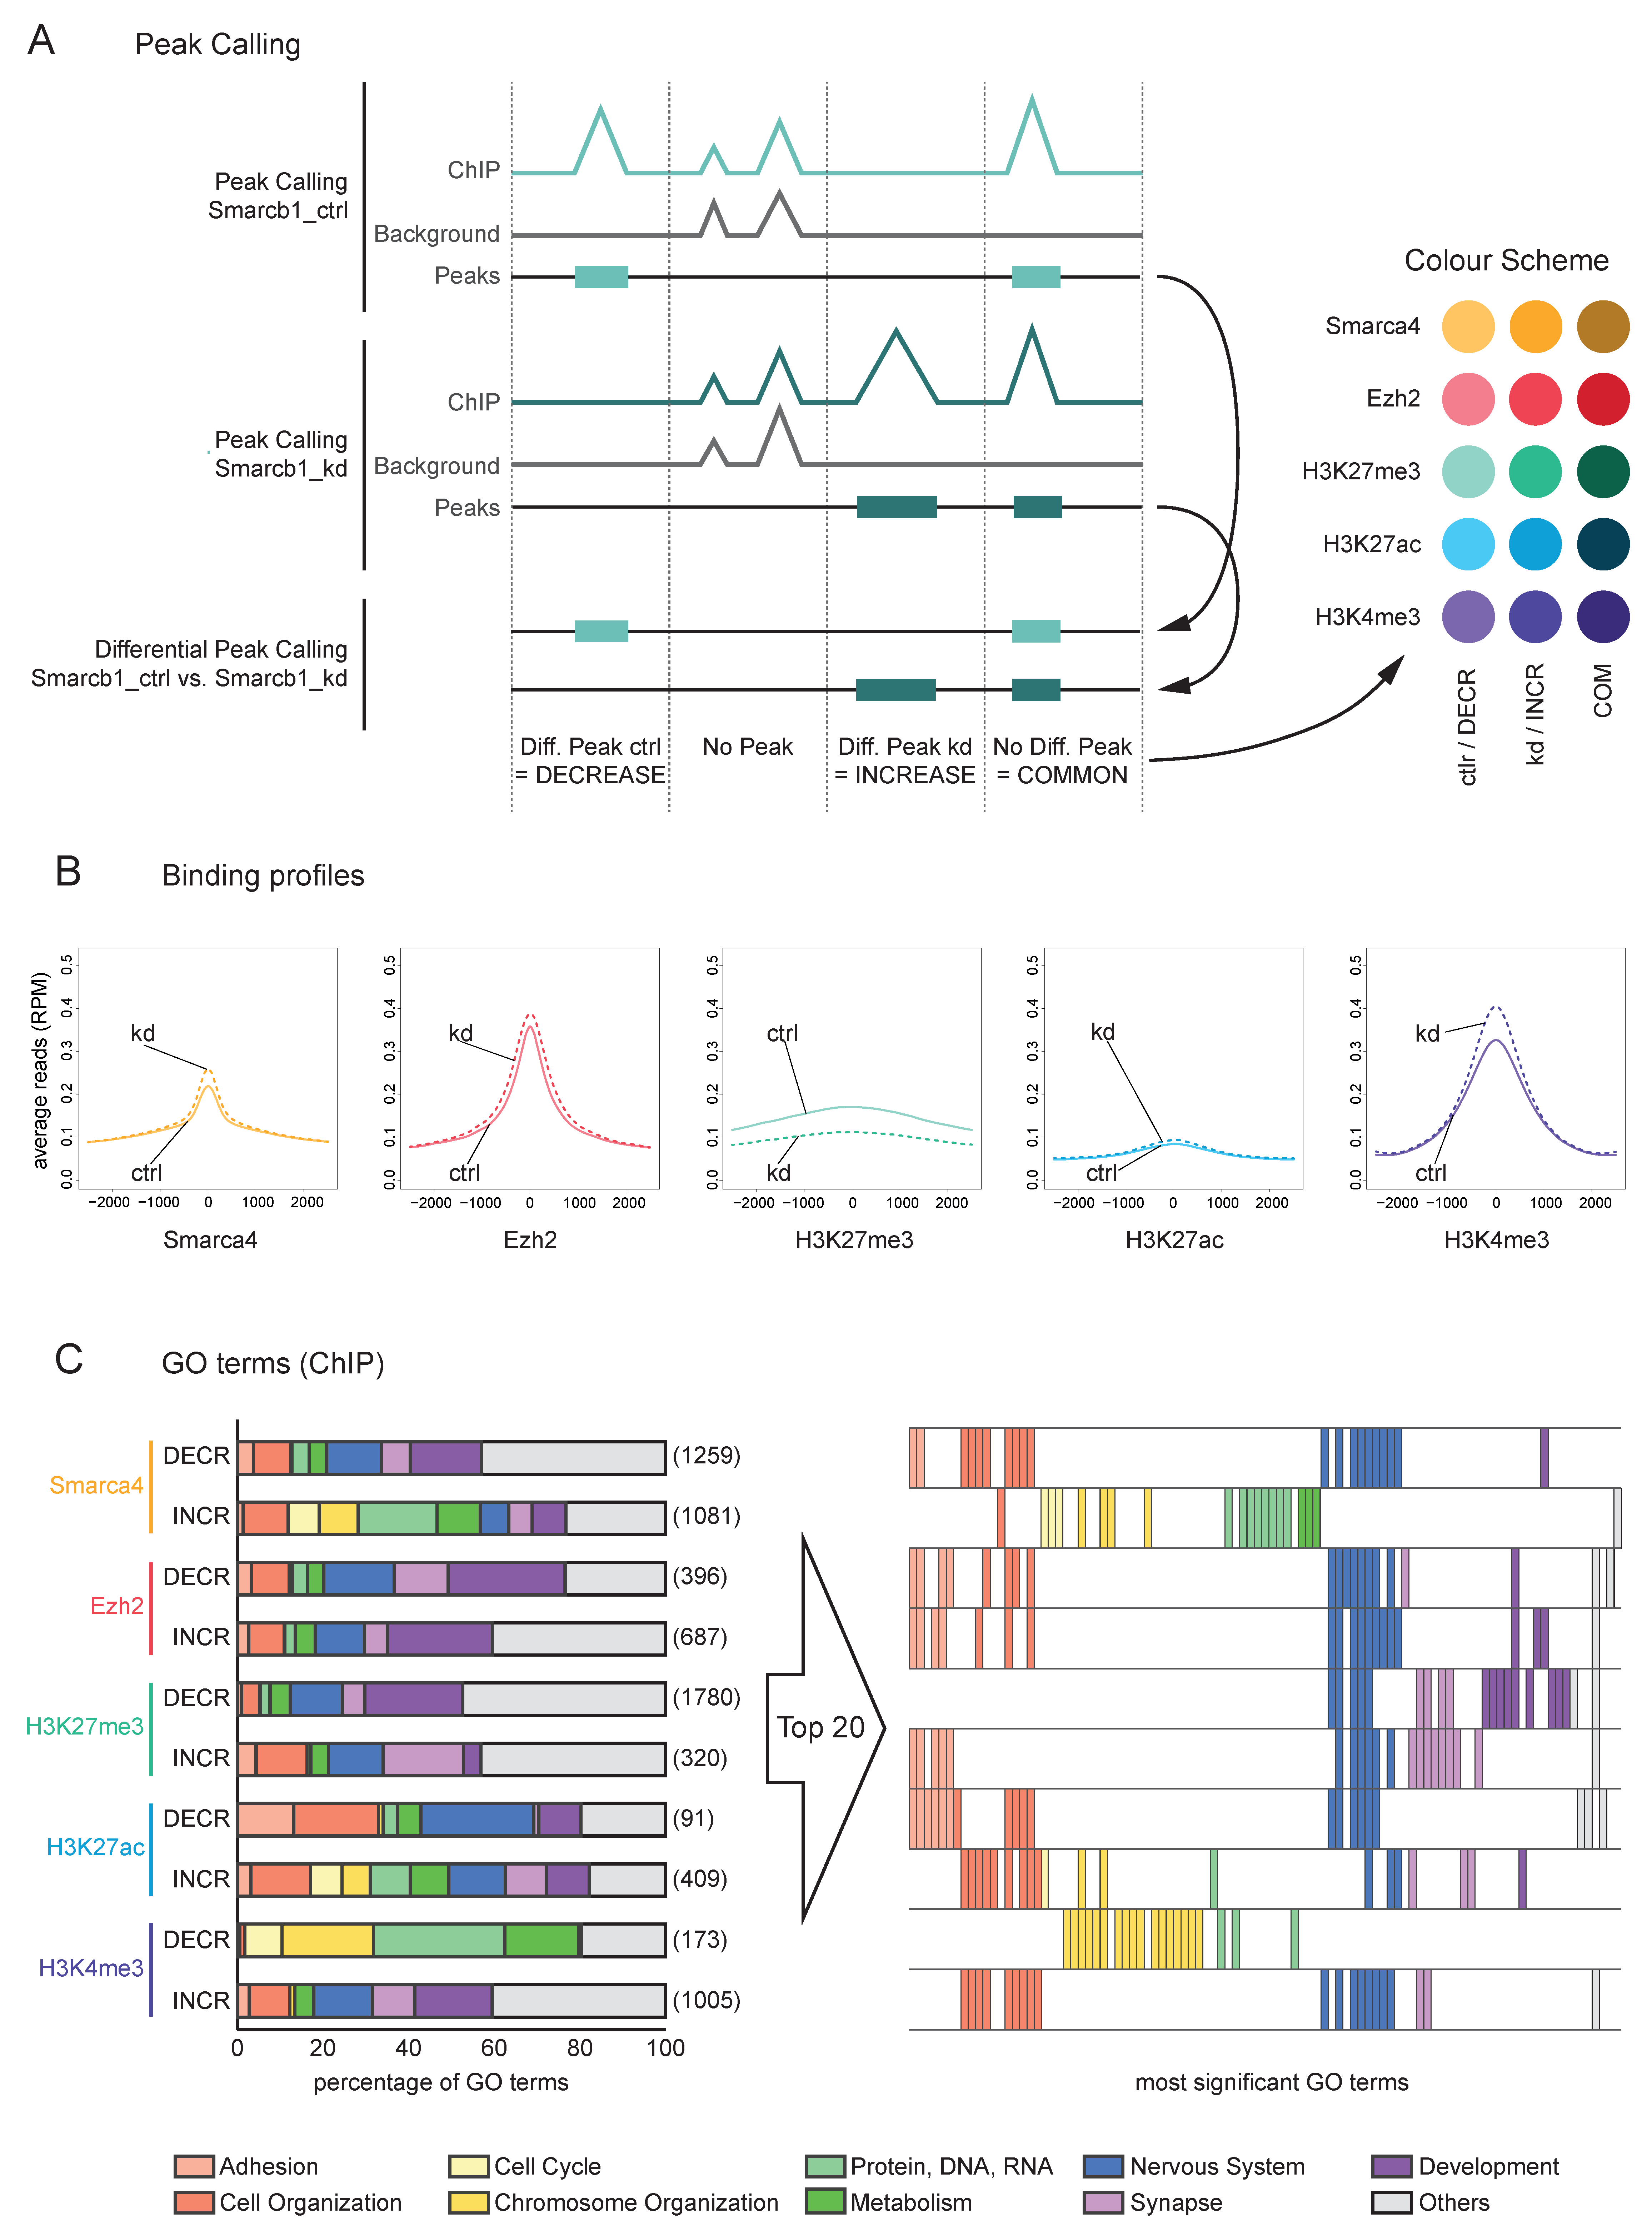
3.3. Upon Smarcb1 kd, Smarca4 Binding and Histone Marks Change in Gene Regions Connected to Nervous System, Cell Organisation and Adhesion
3.4. A Subset of Downregulated Genes with Smarca4 INCREASE after Smarcb1 kd Show an Unexpected Binding Pattern
3.5. Smarcb1 Loss Results in Changes in Enhancer Occupancy, Particularly in Regions Regulating Nervous System-, Cell Organisation-, Adhesion- and Chromosome Organisation-Related Genes
4. Discussion
5. Conclusions
Supplementary Materials
Author Contributions
Funding
Institutional Review Board Statement
Informed Consent Statement
Data Availability Statement
Acknowledgments
Conflicts of Interest
Abbreviations
| A4 | Smarca4 |
| abs | absolute |
| B1 | Smarcb1 |
| bios | biosynthetic |
| cBAF | Canonical BAF complex |
| COM | COMMON |
| ctrl | control |
| DE(G) | differentially expressed (gene) |
| DECR | DECREASE |
| dox | doxycycline |
| ENH | enhancer region |
| esBAF | ESC-specific BAF complex |
| GENE | gene region |
| GO | Gene ontology |
| HMT | histone methyltransferase |
| INCR | INCREASE |
| K27ac | H3K27ac |
| K27me3 | H3K27me3 |
| K4me3 | H3K4me3 |
| kd | knockdown |
| LIF | leukaemia inhibitory factor |
| (m)ESC | (murine) embryonic stem cell |
| morph | morphogenesis |
| ncBAF | non-canonical BAF complex |
| neg | negative |
| PBAF | Polybromo-associated BAF complex |
| pos | positive |
| PRC1 | Polycomb Repressive Complex 1 |
| PRC2 | Polycomb Repressive Complex 2 |
| proc | process |
| prot | protein |
| rec | receptor |
| reg | regulation |
| RMCE | recombinase-mediated cassette exchange |
| sign | signalling |
| TES | transcription end site |
| TSS | transcription start site |
References
- Loh, Y.H.; Wu, Q.; Chew, J.L.; Vega, V.B.; Zhang, W.; Chen, X.; Bourque, G.; George, J.; Leong, B.; Liu, J.; et al. The Oct4 and Nanog transcription network regulates pluripotency in mouse embryonic stem cells. Nat. Genet. 2006, 38, 431–440. [Google Scholar] [CrossRef] [PubMed]
- Nichols, J.; Zevnik, B.; Anastassiadis, K.; Niwa, H.; Klewe-Nebenius, D.; Chambers, I.; Schöler, H.; Smith, A. Formation of Pluripotent Stem Cells in the Mammalian Embryo Depends on the POU Transcription Factor Oct4. Cell 1998, 95, 379–391. [Google Scholar] [CrossRef] [Green Version]
- Chambers, I.; Colby, D.; Robertson, M.; Nichols, J.; Lee, S.; Tweedie, S.; Smith, A. Functional expression cloning of Nanog, a pluripotency sustaining factor in embryonic stem cells. Cell 2003, 113, 643–655. [Google Scholar] [CrossRef] [Green Version]
- Dunn, S.J.; Martello, G.; Yordanov, B.; Emmott, S.; Smith, A.G. Defining an essential transcription factor program for naïve pluripotency. Science 2014, 344, 1156–1160. [Google Scholar] [CrossRef] [Green Version]
- Bernstein, B.E.; Mikkelsen, T.S.; Xie, X.; Kamal, M.; Huebert, D.J.; Cuff, J.; Fry, B.; Meissner, A.; Wernig, M.; Plath, K.; et al. A Bivalent Chromatin Structure Marks Key Developmental Genes in Embryonic Stem Cells. Cell 2006, 125, 315–326. [Google Scholar]
- Efroni, S.; Duttagupta, R.; Cheng, J.; Dehghani, H.; Hoeppner, D.J.; Dash, C.; Bazett-Jones, D.P.; Le Grice, S.; McKay, R.D.; Buetow, K.H.; et al. Global Transcription in Pluripotent Embryonic Stem Cells. Cell Stem Cell 2008, 2, 437–447. [Google Scholar] [CrossRef] [Green Version]
- Harikumar, A.; Meshorer, E. Chromatin remodeling and bivalent histone modifications in embryonic stem cells. EMBO Rep. 2015, 16, 1609–1619. [Google Scholar] [CrossRef] [Green Version]
- Moore, L.D.; Le, T.; Fan, G. DNA Methylation and Its Basic Function. Neuropsychopharmacology 2013, 38, 23–38. [Google Scholar] [CrossRef] [Green Version]
- Klein, D.C.; Hainer, S.J. Chromatin regulation and dynamics in stem cells. Curr. Top. Dev. Biol. 2020, 138, 1–71. [Google Scholar]
- Creyghton, M.P.; Cheng, A.W.; Welstead, G.G.; Kooistra, T.; Carey, B.W.; Steine, E.J.; Hanna, J.; Lodato, M.A.; Frampton, G.M.; Sharp, P.A.; et al. Histone H3K27ac separates active from poised enhancers and predicts developmental state. Proc. Natl. Acad. Sci. USA 2010, 107, 21931–21936. [Google Scholar]
- Pokholok, D.K.; Harbison, C.T.; Levine, S.; Cole, M.; Hannett, N.M.; Lee, T.I.; Bell, G.W.; Walker, K.; Rolfe, P.A.; Herbolsheimer, E.; et al. Genome-wide map of nucleosome acetylation and methylation in yeast. Cell 2005, 122, 517–527. [Google Scholar] [CrossRef] [PubMed] [Green Version]
- Rada-Iglesias, A.; Bajpai, R.; Swigut, T.; Brugmann, S.A.; Flynn, R.A.; Wysocka, J. A unique chromatin signature uncovers early developmental enhancers in humans. Nature 2011, 470, 279–283. [Google Scholar] [CrossRef] [PubMed] [Green Version]
- Bannister, A.J.; Kouzarides, T. Regulation of chromatin by histone modifications. Cell Res. 2011, 21, 381–395. [Google Scholar] [CrossRef] [PubMed]
- Barski, A.; Cuddapah, S.; Cui, K.; Roh, T.-Y.; Schones, D.E.; Wang, Z.; Wei, G.; Chepelev, I.; Zhao, K. High-Resolution Profiling of Histone Methylations in the Human Genome. Cell 2007, 129, 823–837. [Google Scholar] [CrossRef] [PubMed] [Green Version]
- Hon, G.C.; Hawkins, R.D.; Ren, B.; Program, B. Predictive chromatin signatures in the mammalian genome. Hum. Mol. Genet. 2009, 18, 195–201. [Google Scholar] [CrossRef] [PubMed] [Green Version]
- Mikkelsen, T.S.; Ku, M.; Jaffe, D.B.; Issac, B.; Lieberman, E.; Giannoukos, G.; Alvarez, P.; Brockman, W.; Kim, T.K.; Koche, R.P.; et al. Genome-wide maps of chromatin state in pluripotent and lineage-committed cells. Nature 2007, 448, 553–560. [Google Scholar] [CrossRef]
- Copeland, R.A.; Solomon, M.E.; Richon, V.M. Protein methyltransferases as a target class for drug discovery. Nat. Rev. Drug Discov. 2009, 8, 724–732. [Google Scholar] [CrossRef]
- Endoh, M.; Endo, T.A.; Endoh, T.; Isono, K.-I.; Sharif, J.; Ohara, O.; Toyoda, T.; Ito, T.; Eskeland, R.; Bickmore, W.A.; et al. Histone H2A Mono-Ubiquitination Is a Crucial Step to Mediate PRC1-Dependent Repression of Developmental Genes to Maintain ES Cell Identity. PLoS Genet. 2012, 8, e1002776. [Google Scholar] [CrossRef] [Green Version]
- Gao, Z.; Zhang, J.; Bonasio, R.; Strino, F.; Sawai, A.; Parisi, F.; Kluger, Y.; Reinberg, D. PCGF Homologs, CBX Proteins, and RYBP Define Functionally Distinct PRC1 Family Complexes. Mol. Cell 2012, 45, 344–356. [Google Scholar] [CrossRef] [Green Version]
- Fursova, N.A.; Blackledge, N.P.; King, H.W.; Koseki, H.; Klose, R.J. Synergy between Variant PRC1 Complexes Defines Polycomb-Mediated Gene Repression In Brief. Mol. Cell 2019, 74, 1020–1036. [Google Scholar] [CrossRef] [Green Version]
- Kundu, S.; Ji, F.; Sunwoo, H.; Jain, G.; Lee, J.T.; Sadreyev, R.I.; Dekker, J.; Kingston, R.E. Polycomb Repressive Complex 1 generates discrete compacted domains that change during differentiation HHS Public Access. Mol. Cell 2017, 65, 432–446. [Google Scholar] [CrossRef] [PubMed] [Green Version]
- Hargreaves, D.C.; Crabtree, G.R. ATP-dependent chromatin remodeling: Genetics, genomics and mechanisms. Cell Res. 2011, 21, 396–420. [Google Scholar] [CrossRef] [PubMed]
- Kadoch, C.; Hargreaves, D.C.; Hodges, C.; Elias, L.; Ho, L.; Ranish, J.; Crabtree, G.R. Proteomic and bioinformatic analysis of mammalian SWI/SNF complexes identifies extensive roles in human malignancy. Nat. Genet. 2013, 45, 592–601. [Google Scholar] [CrossRef] [PubMed]
- Kadoch, C.; Crabtree, G.R. Mammalian SWI/SNF chromatin remodeling complexes and cancer: Mechanistic insights gained from human genomics. Sci. Adv. 2015, 1, 1–17. [Google Scholar] [CrossRef] [Green Version]
- Wang, W.; Cote, J.; Xue, Y.; Zhou, S.; Khavari, P.A.; Biggar, S.R.; Muchardt, C.; Kalpana, G.V.; Goff, S.P.; Yaniv, M.; et al. Purification and biochemical heterogeneity of the mammalian SWI-SNF complex. EMBO J. 1996, 15, 5370–5382. [Google Scholar] [CrossRef]
- Kaeser, M.D.; Aslanian, A.; Dong, M.Q.; Yates, J.R.; Emerson, B.M. BRD7, a novel PBAF-specific SWI/SNF subunit, is required for target gene activation and repression in embryonic stem cells. J. Biol. Chem. 2008, 283, 32254–32263. [Google Scholar] [CrossRef] [Green Version]
- Middeljans, E.; Wan, X.; Jansen, P.W.; Sharma, V.; Stunnenberg, H.G.; Logie, C. SS18 Together with Animal-Specific Factors Defines Human BAF-Type SWI/SNF Complexes. PLoS ONE 2012, 7, e33834. [Google Scholar] [CrossRef] [Green Version]
- Mashtalir, N.; D’Avino, A.R.; Michel, B.C.; Luo, J.; Pan, J.; Otto, J.E.; Zullow, H.J.; McKenzie, Z.M.; Kubiak, R.L.; St Pierre, R.; et al. Modular Organization and Assembly of SWI/SNF Family Chromatin Remodeling Complexes. Cell 2018, 175, 1272–1288.e20. [Google Scholar] [CrossRef] [Green Version]
- Alpsoy, A.; Dykhuizen, E.C. Glioma tumor suppressor candidate region gene 1 (GLTSCR1) and its paralog GLTSCR1-like form SWI/SNF chromatin remodeling subcomplexes. J. Biol. Chem. 2018, 293, 3892–3903. [Google Scholar] [CrossRef] [Green Version]
- Gatchalian, J.; Malik, S.; Ho, J.; Lee, D.S.; Kelso, T.W.R.; Shokhirev, M.N.; Dixon, J.R.; Hargreaves, D.C. A non-canonical BRD9-containing BAF chromatin remodeling complex regulates naive pluripotency in mouse embryonic stem cells. Nat. Commun. 2018, 9, 5139. [Google Scholar] [CrossRef] [Green Version]
- Innis, S.M.; Cabot, B. GBAF, a small BAF sub-complex with big implications: A systematic review. Epigenet. Chromatin 2020, 13, 48. [Google Scholar] [CrossRef]
- Ho, L.; Ronan, J.L.; Wu, J.; Staahl, B.T.; Chen, L.; Kuo, A.; Lessard, J.; Nesvizhskii, A.I.; Ranish, J.; Crabtree, G.R. An embryonic stem cell chromatin remodeling complex, esBAF, is essential for embryonic stem cell self-renewal and pluripotency. Proc. Natl. Acad. Sci. USA 2009, 106, 5181–5186. [Google Scholar] [CrossRef] [PubMed] [Green Version]
- Ho, L.; Jothi, R.; Ronan, J.L.; Cui, K.; Zhao, K.; Crabtree, G.R. An embryonic stem cell chromatin remodeling complex, esBAF, is an essential component of the core pluripotency transcriptional network. Proc. Natl. Acad. Sci. USA 2009, 106, 5187–5191. [Google Scholar] [CrossRef] [PubMed] [Green Version]
- Ho, L.; Miller, E.L.; Ronan, J.L.; Ho, W.Q.; Jothi, R.; Crabtree, G.R. EsBAF facilitates pluripotency by conditioning the genome for LIF/STAT3 signalling and by regulating polycomb function. Nat. Cell Biol. 2011, 13, 903–913. [Google Scholar] [CrossRef] [PubMed] [Green Version]
- Weber, C.M.; Hafner, A.; Kirkland, J.G.; Braun, S.M.G.; Stanton, B.Z.; Boettiger, A.N.; Crabtree, G.R. mSWI/SNF promotes Polycomb repression both directly and through genome-wide redistribution. Nat. Struct. Mol. Biol. 2021, 28, 501–511. [Google Scholar] [CrossRef] [PubMed]
- Kadoch, C.; Williams, R.T.; Calarco, J.P.; Miller, E.L.; Weber, C.M.; Braun, S.M.G.; Pulice, J.L.; Chory, E.J.; Crabtree, G.R. Dynamics of BAF-Polycomb complex opposition on heterochromatin in normal and oncogenic states. Nat. Genet. 2017, 49, 213–222. [Google Scholar] [CrossRef] [PubMed]
- Stanton, B.Z.; Hodges, C.; Calarco, J.P.; Braun, S.M.G.; Ku, W.L.; Kadoch, C.; Zhao, K.; Crabtree, G.R. Smarca4 ATPase mutations disrupt direct eviction of PRC1 from chromatin. Nat. Genet. 2017, 49, 282–288. [Google Scholar] [CrossRef]
- Alfert, A.; Moreno, N.; Kerl, K. The BAF complex in development and disease. Epigenetics Chromatin 2019, 12, 19. [Google Scholar] [CrossRef] [Green Version]
- Bultman, S.; Gebuhr, T.; Yee, D.; Mantia C la Nicholson, J.; Gilliam, A.; Randazzo, F.; Metzger, D.; Chambon, P.; Crabtree, G.; Magnuson, T.A.; et al. A Brg1 Null Mutation in the Mouse Reveals Functional Differences among Mammalian SWI/SNF Complexes. Mol. Cell 2000, 6, 1287–1295. [Google Scholar]
- Roberts, C.W.M.; Galusha, S.A.; McMenamin, M.E.; Fletcher, C.D.M.; Orkin, S.H. Haploinsufficiency of Snf5 (integrase interactor 1) predisposes to malignant rhabdoid tumors in mice. Proc. Natl. Acad. Sci. USA 2000, 97, 13796–13800. [Google Scholar] [CrossRef] [Green Version]
- Hodges, C.; Kirkland, J.G.; Crabtree, G.R. The Many Roles of BAF (mSWI/SNF) and PBAF Complexes in Cancer. Cold Spring Harb. Perspect. Med. 2016, 6, a026930. [Google Scholar] [CrossRef] [PubMed] [Green Version]
- Versteege, I.; Sévenet, N.; Lange, J.; Rousseau-Merck, M.-F.; Ambros, P.; Handgretinger, R.; Aurias, A.; Delattre, O. Truncating mutations of hSNF5 in aggressive paediatric cancer. Nature 1998, 394, 203–206. [Google Scholar] [CrossRef] [PubMed]
- Hasselblatt, M.; Isken, S.; Linge, A.; Eikmeier, K.; Jeibmann, A.; Oyen, F.; Nagel, I.; Richter, J.; Bartelheim, K.; Kordes, U.; et al. High-Resolution Genomic Analysis Suggests the Absence of Recurrent Genomic Alterations other than SMARCB1 Aberrations in Atypical Teratoid/Rhabdoid Tumors. Genes Chromosomes Cancer 2013, 52, 185–190. [Google Scholar] [CrossRef] [PubMed]
- Kosho, T.; Okamoto, N. Coffin-Siris Syndrome International Collaborators Genotype-phenotype correlation of coffin-siris syndrome caused by mutations in SMARCB1, SMARCA4, SMARCE1, and ARID1A. Am. J. Med. Genet. Part C Semin. Med. Genet. 2014, 166, 262–275. [Google Scholar] [CrossRef] [PubMed]
- Barish, S.; Barakat, T.S.; Michel, B.C.; Mashtalir, N.; Phillips, J.B.; Valencia, A.M.; Ugur, B.; Wegner, J.; Scott, T.M.; Bostwick, B.; et al. BICRA, a SWI/SNF Complex Member, Is Associated with BAF-Disorder Related Phenotypes in Humans and Model Organisms. Am. J. Hum. Genet. 2020, 107, 1096–1112. [Google Scholar] [CrossRef] [PubMed]
- Bögershausen, N.; Wollnik, B. Mutational Landscapes and Phenotypic Spectrum of SWI/SNF-Related Intellectual Disability Disorders. Front. Mol. Neurosci. 2018, 11, 1–18. [Google Scholar] [CrossRef]
- Sokpor, G.; Xie, Y.; Rosenbusch, J.; Tuoc, T. Chromatin Remodeling BAF (SWI/SNF) Complexes in Neural Development and Disorders. Front. Mol. Neurosci. 2017, 10, 1–22. [Google Scholar] [CrossRef] [Green Version]
- Dobin, A.; Davis, C.A.; Schlesinger, F.; Drenkow, J.; Zaleski, C.; Jha, S.; Batut, P.; Chaisson, M.; Gingeras, T.R. Sequence analysis STAR: Ultrafast universal RNA-seq aligner. Bioinformatics 2013, 29, 15–21. [Google Scholar] [CrossRef]
- Lawrence, M.; Huber, W.; Pagès, H.; Aboyoun, P.; Carlson, M. Software for Computing and Annotating Genomic Ranges. PLoS Comput. Biol. 2013, 9, 1003118. [Google Scholar] [CrossRef]
- Morgan, M.; Pagès, H.; Obenchain, V.; Hayden, N. R Package, version 2.10.0; Rsamtools: Binary Alignment (BAM), FASTA, Variant Call (BCF), and Tabix File Import; Bioconductor: Boston, MA, USA, 2021. [Google Scholar]
- Love, M.I.; Huber, W.; Anders, S. Moderated estimation of fold change and dispersion for RNA-seq data with DESeq2. Genome Biol. 2014, 15, 550. [Google Scholar] [CrossRef] [Green Version]
- R Core Team. R: A Languange and Environment for Statistical Computing; R Foundation for Statistical Computing: Vienna, Austria, 2018. [Google Scholar]
- Krämer, A.; Green, J.; Pollard, J.; Tugendreich, S. Systems biology Causal analysis approaches in Ingenuity Pathway Analysis. Bioinformatics 2014, 30, 523–530. [Google Scholar] [CrossRef] [PubMed]
- Qiagen-Ipa; Qiagen Inc.: Hilden, Germany. Available online: https://digitalinsights.qiagen.com/products-overview/discovery-insights-portfolio/analysis-and-visualization/qiagen-ipa/ (accessed on 31 December 2021).
- Afgan, E.; Baker, D.; Batut, B.; van den Beek, M.; Bouvier, D.; Cech, M.; Chilton, J.; Clements, D.; Coraor, N.; Grüning, B.A.; et al. The Galaxy platform for accessible, reproducible and collaborative biomedical analyses: 2018 update. Nucleic Acids Res. 2018, 46, 537–544. [Google Scholar] [CrossRef] [PubMed] [Green Version]
- Li, H.; Handsaker, B.; Wysoker, A.; Fennell, T.; Ruan, J.; Homer, N.; Marth, G.; Abecasis, G.; Durbin, R. 1000 Genome Project Data Processing Subgroup The Sequence Alignment/Map format and SAMtools. Bioinformatics 2009, 25, 2078–2079. [Google Scholar] [CrossRef] [PubMed] [Green Version]
- Zhang, Y.; Liu, T.; Meyer, C.A.; Eeckhoute, J.; Johnson, D.S.; Bernstein, B.E.; Nusbaum, C.; Myers, R.M.; Brown, M.; Li, W. Model-based Analysis of ChIP-Seq (MACS). Genome Biol. 2008, 9, R137. [Google Scholar] [CrossRef] [Green Version]
- Zang, C.; Schones, D.E.; Zeng, C.; Cui, K.; Zhao, K.; Peng, W. Data and text mining A clustering approach for identification of enriched domains from histone modification ChIP-Seq data. Bioinformatics 2009, 25, 1952–1958. [Google Scholar] [CrossRef] [Green Version]
- Durinck, S.; Moreau, Y.; Kasprzyk, A.; Davis, S.; de Moor, B.; Brazma, A.; Huber, W. BioMart and Bioconductor: A powerful link between biological databases and microarray data analysis. Bioinformatics 2005, 21, 3439–3440. [Google Scholar] [CrossRef] [Green Version]
- Yu, G.; Wang, L.-G.; He, Q.-Y. ChIPseeker: An R/Bioconductor package for ChIP peak annotation, comparison and visualization. Bioinformatics 2015, 31, 2382–2383. [Google Scholar] [CrossRef] [Green Version]
- Heinz, S.; Benner, C.; Spann, N.; Bertolino, E.; Lin, Y.C.; Laslo, P.; Cheng, J.X.; Murre, C.; Singh, H.; Glass, C.K. Simple combinations of lineage-determining transcription factors prime cis-regulatory elements required for macrophage and B cell identities. Mol. Cell. 2010, 38, 576–589. [Google Scholar] [CrossRef] [Green Version]
- Cleveland, W.; Grosse, E.; Shyu, W. Statistical Models in S; Chambers, J.M., Hastie, T.J., Eds.; Wadsworth & Brooks/Cole: Pacific Grove, CA, USA, 1992. [Google Scholar]
- Chen, J.; Bardes, E.E.; Aronow, B.J.; Jegga, A.G. ToppGene Suite for gene list enrichment analysis and candidate gene prioritization. Nucleic Acids Res. 2009, 37, 305–311. [Google Scholar] [CrossRef]
- Sun, L.; Dong, S.; Ge, Y.; Fonseca, J.P.; Robinson, Z.T.; Mysore, K.S.; Mehty, P. DiVenn: An Interactive and Integrated Web-Based Visualization Tool for Comparing Gene Lists. Front. Genet. 2019, 10, 421. [Google Scholar] [CrossRef]
- Quinlan, A.R.; Hall, I.M. BEDTools: A flexible suite of utilities for comparing genomic features. Bioinformatics 2010, 26, 841–842. [Google Scholar] [CrossRef] [PubMed] [Green Version]
- Frankish, A.; Diekhans, M.; Ferreira, A.-M.; Johnson, R.; Jungreis, I.; Loveland, J.; Mudge, J.M.; Sisu, C.; Wright, J.; Armstrong, J. GENCODE reference annotation for the human and mouse genomes. Nucleic Acids Res. 2019, 47, 767. [Google Scholar] [CrossRef] [PubMed] [Green Version]
- Bland, J.; Altman, D. Multiple significance tests: The Bonferroni method. BMJ 1995, 310, 170. [Google Scholar] [CrossRef] [PubMed] [Green Version]
- Shen, Y.; Yue, F.; McCleary, D.F.; Ye, Z.; Edsall, L.; Kuan, S.; Wagner, U.; Dixon, J.; Lee, L.; Lobanenkov, V.V. A map of the cis-regulatory sequences in the mouse genome. Nature 2012, 488, 116–120. [Google Scholar] [CrossRef] [Green Version]
- Kent, W.J.; Sugnet, C.W.; Furey, T.S.; Roskin, K.M.; Pringle, T.H.; Zahler, A.M.; Haussler, D. The Human Genome Browser at UCSC. Genome Res. 2002, 12, 996–1006. [Google Scholar] [CrossRef] [Green Version]
- Wickham, H. Ggplot2: Elegant Graphics for Data Analysis; Springer: New York, NY, USA, 2009. [Google Scholar]
- Ahmed, K.; Dehghani, H.; Rugg-Gunn, P.; Fussner, E.; Rossant, J.; Bazett-Jones, D.P. Global Chromatin Architecture Reflects Pluripotency and Lineage Commitment in the Early Mouse Embryo. PLoS ONE 2010, 5, e10531. [Google Scholar] [CrossRef] [Green Version]
- Wilson, B.G.; Wang, X.; Shen, X.; Mckenna, E.S.; Madeleine, E.; Cho, Y.; Koellhoffer, E.C.; Pomeroy, S.L.; Orkin, S.H.; Roberts, C.W. Epigenetic antagonism between Polycomb and SWI/SNF complexes during oncogenic transformation. Cancer Cell 2011, 18, 316–328. [Google Scholar] [CrossRef] [Green Version]
- Nakayama, R.T.; Pulice, J.L.; Valencia, A.M.; Mcbride, M.J.; Mckenzie, Z.M.; Gillespie, M.A.; Ku, W.L.; Teng, M.; Cui, K.; Williams, R.T.; et al. SMARCB1 is required for widespread BAF complex-mediated activation of enhancers and bivalent promoters HHS Public Access. Nat. Genet. 2017, 49, 1613–1623. [Google Scholar] [CrossRef]
- Alver, B.H.; Kim, K.H.; Lu, P.; Wang, X.; Manchester, H.E.; Wang, W.; Haswell, J.R.; Park, P.J.; Roberts, C.W. The SWI/SNF chromatin remodelling complex is required for maintenance of lineage specific enhancers. Nat. Commun. 2017, 8, 14648. [Google Scholar] [CrossRef]
- Wang, X.; Lee, R.S.; Alver, B.H.; Haswell, J.R.; Wang, S.; Mieczkowski, J.; Drier, Y.; Gillespie, S.M.; Archer, T.C.; Wu, J.N.; et al. SMARCB1-mediated SWI/SNF complex function is essential for enhancer regulation. Nat. Genet. 2017, 49, 289–295. [Google Scholar] [CrossRef]
- Moreno, N.; Schmidt, C.; Ahlfeld, J.; Pöschl, J.; Dittmar, S.; Pfister, S.M.; Kool, M.; Kerl, K.; Schüller, U. Loss of Smarc Proteins Impairs Cerebellar Development. J. Neurosci. 2014, 34, 13486–13491. [Google Scholar] [CrossRef] [PubMed] [Green Version]
- Parisian, A.D.; Koga, T.; Miki, S.; Johann, P.D.; Kool, M.; Crawford, J.R.; Furnari, F.B. SMARCB1 loss interacts with neuronal differentiation state to block maturation and impact cell stability. Genes and Development. Cold Spring Harb. Lab. Press 2020, 34, 1316–1329. [Google Scholar]
- Vasko, A.; Drivas, T.G.; Schrier Vergano, S.A. Genotype-Phenotype Correlations in 208 Individuals with Coffin-Siris Syndrome. Genes 2021, 12, 937. [Google Scholar] [CrossRef] [PubMed]
- Ho, B.; Johann, P.D.; Grabovska, Y.; de Dieu Andrianteranagna, M.J.; Yao, F.; Frühwald, M.; Hasselblatt, M.; Bourdeaut, F.; Williamson, D.; Huang, A.; et al. Molecular subgrouping of atypical teratoid/rhabdoid tumors—A reinvestigation and current consensus. Neuro-Oncol. 2020, 22, 613–624. [Google Scholar] [CrossRef] [PubMed] [Green Version]
- McBride, M.J.; Pulice, J.L.; Beird, H.C.; Ingram, D.R.; D’Avino, A.R.; Shern, J.F.; Charville, G.W.; Hornick, J.L.; Nakayama, R.T.; Garcia-Rivera, E.M.; et al. The SS18-SSX Fusion Oncoprotein Hijacks BAF Complex Targeting and Function to Drive Synovial Sarcoma. Cancer Cell 2018, 33, 1–14. [Google Scholar] [CrossRef] [PubMed] [Green Version]
- Michel, B.C.; D’Avino, A.R.; Cassel, S.H.; Mashtalir, N.; McKenzie, Z.M.; McBride, M.J.; Valencia, A.M.; Zhou, Q.; Bocker, M.; Soares, L.M.M.; et al. A non-canonical SWI/SNF complex is a synthetic lethal target in cancers driven by BAF complex perturbation. Nat. Cell Biol. 2018, 20, 1410–1420. [Google Scholar] [CrossRef] [PubMed]
- Brien, G.L.; Remillard, D.; Shi, J.; Hemming, M.L.; Chabon, J.; Wynne, K.; Dillon, E.T.; Cagney, G.; Van Mierlo, G.; Baltissen, M.P.; et al. Targeted degradation of BRD9 reverses oncogenic gene expression in synovial sarcoma. eLife 2018, 7, 1–26. [Google Scholar] [CrossRef]


Publisher’s Note: MDPI stays neutral with regard to jurisdictional claims in published maps and institutional affiliations. |
© 2022 by the authors. Licensee MDPI, Basel, Switzerland. This article is an open access article distributed under the terms and conditions of the Creative Commons Attribution (CC BY) license (https://creativecommons.org/licenses/by/4.0/).
Share and Cite
Alfert, A.; Walter, C.; Moreno, N.; Melcher, V.; Graf, M.; Hotfilder, M.; Dugas, M.; Albert, T.; Kerl, K. Smarcb1 Loss Results in a Deregulation of esBAF Binding and Impacts the Expression of Neurodevelopmental Genes. Cells 2022, 11, 1354. https://doi.org/10.3390/cells11081354
Alfert A, Walter C, Moreno N, Melcher V, Graf M, Hotfilder M, Dugas M, Albert T, Kerl K. Smarcb1 Loss Results in a Deregulation of esBAF Binding and Impacts the Expression of Neurodevelopmental Genes. Cells. 2022; 11(8):1354. https://doi.org/10.3390/cells11081354
Chicago/Turabian StyleAlfert, Amelie, Carolin Walter, Natalia Moreno, Viktoria Melcher, Monika Graf, Marc Hotfilder, Martin Dugas, Thomas Albert, and Kornelius Kerl. 2022. "Smarcb1 Loss Results in a Deregulation of esBAF Binding and Impacts the Expression of Neurodevelopmental Genes" Cells 11, no. 8: 1354. https://doi.org/10.3390/cells11081354